JP7500568B2 - Systems and methods for detecting liquid accumulation - Patents.com - Google Patents
Systems and methods for detecting liquid accumulation - Patents.com Download PDFInfo
- Publication number
- JP7500568B2 JP7500568B2 JP2021534235A JP2021534235A JP7500568B2 JP 7500568 B2 JP7500568 B2 JP 7500568B2 JP 2021534235 A JP2021534235 A JP 2021534235A JP 2021534235 A JP2021534235 A JP 2021534235A JP 7500568 B2 JP7500568 B2 JP 7500568B2
- Authority
- JP
- Japan
- Prior art keywords
- signal
- sensor device
- subject
- heart
- frequency
- Prior art date
- Legal status (The legal status is an assumption and is not a legal conclusion. Google has not performed a legal analysis and makes no representation as to the accuracy of the status listed.)
- Active
Links
Images



Classifications
-
- A—HUMAN NECESSITIES
- A61—MEDICAL OR VETERINARY SCIENCE; HYGIENE
- A61B—DIAGNOSIS; SURGERY; IDENTIFICATION
- A61B5/00—Measuring for diagnostic purposes; Identification of persons
- A61B5/02—Detecting, measuring or recording for evaluating the cardiovascular system, e.g. pulse, heart rate, blood pressure or blood flow
- A61B5/02042—Determining blood loss or bleeding, e.g. during a surgical procedure
-
- A—HUMAN NECESSITIES
- A61—MEDICAL OR VETERINARY SCIENCE; HYGIENE
- A61B—DIAGNOSIS; SURGERY; IDENTIFICATION
- A61B5/00—Measuring for diagnostic purposes; Identification of persons
-
- A—HUMAN NECESSITIES
- A61—MEDICAL OR VETERINARY SCIENCE; HYGIENE
- A61B—DIAGNOSIS; SURGERY; IDENTIFICATION
- A61B5/00—Measuring for diagnostic purposes; Identification of persons
- A61B5/02—Detecting, measuring or recording for evaluating the cardiovascular system, e.g. pulse, heart rate, blood pressure or blood flow
-
- A—HUMAN NECESSITIES
- A61—MEDICAL OR VETERINARY SCIENCE; HYGIENE
- A61B—DIAGNOSIS; SURGERY; IDENTIFICATION
- A61B5/00—Measuring for diagnostic purposes; Identification of persons
- A61B5/02—Detecting, measuring or recording for evaluating the cardiovascular system, e.g. pulse, heart rate, blood pressure or blood flow
- A61B5/024—Measuring pulse rate or heart rate
-
- A—HUMAN NECESSITIES
- A61—MEDICAL OR VETERINARY SCIENCE; HYGIENE
- A61B—DIAGNOSIS; SURGERY; IDENTIFICATION
- A61B5/00—Measuring for diagnostic purposes; Identification of persons
- A61B5/103—Measuring devices for testing the shape, pattern, colour, size or movement of the body or parts thereof, for diagnostic purposes
- A61B5/11—Measuring movement of the entire body or parts thereof, e.g. head or hand tremor or mobility of a limb
-
- A—HUMAN NECESSITIES
- A61—MEDICAL OR VETERINARY SCIENCE; HYGIENE
- A61B—DIAGNOSIS; SURGERY; IDENTIFICATION
- A61B5/00—Measuring for diagnostic purposes; Identification of persons
- A61B5/103—Measuring devices for testing the shape, pattern, colour, size or movement of the body or parts thereof, for diagnostic purposes
- A61B5/11—Measuring movement of the entire body or parts thereof, e.g. head or hand tremor or mobility of a limb
- A61B5/1102—Ballistocardiography
-
- A—HUMAN NECESSITIES
- A61—MEDICAL OR VETERINARY SCIENCE; HYGIENE
- A61B—DIAGNOSIS; SURGERY; IDENTIFICATION
- A61B5/00—Measuring for diagnostic purposes; Identification of persons
- A61B5/68—Arrangements of detecting, measuring or recording means, e.g. sensors, in relation to patient
- A61B5/6801—Arrangements of detecting, measuring or recording means, e.g. sensors, in relation to patient specially adapted to be attached to or worn on the body surface
- A61B5/6813—Specially adapted to be attached to a specific body part
- A61B5/6814—Head
-
- A—HUMAN NECESSITIES
- A61—MEDICAL OR VETERINARY SCIENCE; HYGIENE
- A61B—DIAGNOSIS; SURGERY; IDENTIFICATION
- A61B5/00—Measuring for diagnostic purposes; Identification of persons
- A61B5/68—Arrangements of detecting, measuring or recording means, e.g. sensors, in relation to patient
- A61B5/6801—Arrangements of detecting, measuring or recording means, e.g. sensors, in relation to patient specially adapted to be attached to or worn on the body surface
- A61B5/6813—Specially adapted to be attached to a specific body part
- A61B5/6823—Trunk, e.g., chest, back, abdomen, hip
-
- A—HUMAN NECESSITIES
- A61—MEDICAL OR VETERINARY SCIENCE; HYGIENE
- A61B—DIAGNOSIS; SURGERY; IDENTIFICATION
- A61B5/00—Measuring for diagnostic purposes; Identification of persons
- A61B5/68—Arrangements of detecting, measuring or recording means, e.g. sensors, in relation to patient
- A61B5/6801—Arrangements of detecting, measuring or recording means, e.g. sensors, in relation to patient specially adapted to be attached to or worn on the body surface
- A61B5/6813—Specially adapted to be attached to a specific body part
- A61B5/6828—Leg
-
- A—HUMAN NECESSITIES
- A61—MEDICAL OR VETERINARY SCIENCE; HYGIENE
- A61B—DIAGNOSIS; SURGERY; IDENTIFICATION
- A61B5/00—Measuring for diagnostic purposes; Identification of persons
- A61B5/68—Arrangements of detecting, measuring or recording means, e.g. sensors, in relation to patient
- A61B5/6801—Arrangements of detecting, measuring or recording means, e.g. sensors, in relation to patient specially adapted to be attached to or worn on the body surface
- A61B5/6813—Specially adapted to be attached to a specific body part
- A61B5/6829—Foot or ankle
-
- A—HUMAN NECESSITIES
- A61—MEDICAL OR VETERINARY SCIENCE; HYGIENE
- A61B—DIAGNOSIS; SURGERY; IDENTIFICATION
- A61B5/00—Measuring for diagnostic purposes; Identification of persons
- A61B5/72—Signal processing specially adapted for physiological signals or for diagnostic purposes
- A61B5/7235—Details of waveform analysis
- A61B5/7253—Details of waveform analysis characterised by using transforms
-
- A—HUMAN NECESSITIES
- A61—MEDICAL OR VETERINARY SCIENCE; HYGIENE
- A61B—DIAGNOSIS; SURGERY; IDENTIFICATION
- A61B5/00—Measuring for diagnostic purposes; Identification of persons
- A61B5/72—Signal processing specially adapted for physiological signals or for diagnostic purposes
- A61B5/7235—Details of waveform analysis
- A61B5/7264—Classification of physiological signals or data, e.g. using neural networks, statistical classifiers, expert systems or fuzzy systems
-
- A—HUMAN NECESSITIES
- A61—MEDICAL OR VETERINARY SCIENCE; HYGIENE
- A61B—DIAGNOSIS; SURGERY; IDENTIFICATION
- A61B2562/00—Details of sensors; Constructional details of sensor housings or probes; Accessories for sensors
- A61B2562/02—Details of sensors specially adapted for in-vivo measurements
- A61B2562/0219—Inertial sensors, e.g. accelerometers, gyroscopes, tilt switches
-
- A—HUMAN NECESSITIES
- A61—MEDICAL OR VETERINARY SCIENCE; HYGIENE
- A61B—DIAGNOSIS; SURGERY; IDENTIFICATION
- A61B2562/00—Details of sensors; Constructional details of sensor housings or probes; Accessories for sensors
- A61B2562/02—Details of sensors specially adapted for in-vivo measurements
- A61B2562/0247—Pressure sensors
Landscapes
- Health & Medical Sciences (AREA)
- Life Sciences & Earth Sciences (AREA)
- Engineering & Computer Science (AREA)
- Physics & Mathematics (AREA)
- Surgery (AREA)
- Public Health (AREA)
- Animal Behavior & Ethology (AREA)
- Veterinary Medicine (AREA)
- General Health & Medical Sciences (AREA)
- Biophysics (AREA)
- Pathology (AREA)
- Biomedical Technology (AREA)
- Heart & Thoracic Surgery (AREA)
- Medical Informatics (AREA)
- Molecular Biology (AREA)
- Physiology (AREA)
- Cardiology (AREA)
- Artificial Intelligence (AREA)
- Dentistry (AREA)
- Oral & Maxillofacial Surgery (AREA)
- Signal Processing (AREA)
- Psychiatry (AREA)
- Computer Vision & Pattern Recognition (AREA)
- Evolutionary Computation (AREA)
- Fuzzy Systems (AREA)
- Mathematical Physics (AREA)
- Nuclear Medicine, Radiotherapy & Molecular Imaging (AREA)
- Measuring Pulse, Heart Rate, Blood Pressure Or Blood Flow (AREA)
- Measuring And Recording Apparatus For Diagnosis (AREA)
- Measurement Of The Respiration, Hearing Ability, Form, And Blood Characteristics Of Living Organisms (AREA)
Description
本発明は、身体における液体(体液)蓄積、例えば出血による内出血を検出するためのシステム及び方法に関する。 The present invention relates to a system and method for detecting fluid accumulation in the body, such as internal bleeding due to hemorrhage.
出血は、術後ケア、救急部門、急性期医療環境、及び脳卒中患者の主要な問題である。特に、ベッドサイドでの内出血のタイムリーで確実な監視及び検出は、複数の現場にわたり依然として重要な課題である。 Bleeding is a major problem in post-operative care, emergency departments, acute care settings, and stroke patients. In particular, timely and reliable monitoring and detection of internal bleeding at the bedside remains a significant challenge across multiple settings.
健康な人が1000mlを超える血液を失うと、身体は心拍数(HR)を上昇させることにより反応し、その結果として血圧が変化する。しかしながら、投薬(ベータ遮断薬等)中の患者及び神経障害(糖尿病等による)を患っている患者は、失血を補う能力が低下しており、バイタルサインの変化が限定され得る。更に、若い患者は血液量の変動に対する補償メカニズムが大きいため、失血に伴うバイタルサインの変化は後で発生する。 When a healthy person loses more than 1000 ml of blood, the body responds by increasing heart rate (HR) and resulting in changes in blood pressure. However, patients on medication (e.g., beta-blockers) and those with neuropathy (e.g., due to diabetes) have a reduced ability to compensate for blood loss and may experience limited changes in vital signs. Furthermore, younger patients have greater compensation mechanisms for blood volume fluctuations, so vital sign changes associated with blood loss occur later.
バイタルサインの持続的な変化が臨床的に観察された場合、典型的に、内出血の確認がX線、CT又は超音波を使用したスキャンを実行することによって行われる。出血の症状と後遺症は、組織の灌流に関連する。 If persistent changes in vital signs are observed clinically, confirmation of internal bleeding is typically performed by performing a scan using X-ray, CT or ultrasound. Symptoms and sequelae of bleeding are related to tissue perfusion.
血液量の15%以下の損失は、如何なるバイタルサインの変化にも関連しない場合がある。その結果、大量の失血が起こるまで、出血は診断されないままとなる。 Losses of 15% or less of blood volume may not be associated with any changes in vital signs. As a result, hemorrhage may go undiagnosed until significant blood loss occurs.
例えば、補償される出血性ショックは、1000ml未満の失血に相当し、それを下回る場合、心拍数、血圧、呼吸及び毛細血管再充満は正常のままである。軽度のショックは、1000~1500mlの失血に相当するが、生理学的パラメータの僅かに小さな変化しか観察されない。中程度のショックは、1500~2000mlの失血に相当する。この場合、血圧の著しい低下、心拍数の増加(>120bpm)、毛細血管再充満の遅延及び中等度の頻呼吸が起こる。この段階において、被検者は典型的に混乱する。 For example, compensated hemorrhagic shock corresponds to a blood loss of less than 1000 ml, below which heart rate, blood pressure, respiration and capillary refill remain normal. Mild shock corresponds to a blood loss of 1000-1500 ml, but only small changes in physiological parameters are observed. Moderate shock corresponds to a blood loss of 1500-2000 ml. In this case, there is a marked drop in blood pressure, an increase in heart rate (>120 bpm), delayed capillary refill and moderate tachypnea. At this stage, the subject is typically confused.
重度のショックは、2000mlを超える失血に相当する。この場合、血圧が大幅に低下し、心拍数が大幅に増加し(>140bpm)、毛細血管再充満が遅れ、著しい頻呼吸(呼吸器虚脱)が起こる。被検者は、次いで、無気力になり、昏睡状態になる。 Severe shock corresponds to blood loss of more than 2000 ml. There is a large fall in blood pressure, a large increase in heart rate (>140 bpm), delayed capillary refill, and marked tachypnea (respiratory collapse). The subject then becomes lethargic and comatose.
診断用の既知のベッドサイド警告システムは心拍数及び血圧の尺度に依存しているが、これらのバイタルは内出血に固有のものではなく、特定の患者グループ(例えば、ベータ遮断薬を使用しているグループ)には鈍感でさえもあり得る。心拍数の上昇は、1000mlを超える失血後にのみ発生するため、遅い目印である。加えて、心拍数の上昇は他の多くの要因(ストレス、投薬等)によっても引き起こされる可能性があり、したがって内出血に特有のものではない。 Known bedside warning systems for diagnosis rely on measures of heart rate and blood pressure, but these vitals are not specific to internal bleeding and may even be insensitive to certain patient groups (e.g., those using beta-blockers). Elevated heart rate is a late indicator, as it occurs only after blood loss of more than 1000 ml. In addition, elevated heart rate can be caused by many other factors (stress, medications, etc.) and is therefore not specific to internal bleeding.
上述したように、出血が疑われる場合、CTスキャン等の決定的な放射線医学的確認のための高度な撮像法を使用して診断を確認することができる。これにより、検出の遅延が更に増加する。更に、これらの方法は、高価であり、時間がかかり(臨床的ワークフローが複雑であるため)、患者に負担がかかり、ワークフローに適合させるのが困難である。これら方法は、連続した測定も提供しない。 As mentioned above, when bleeding is suspected, the diagnosis can be confirmed using advanced imaging methods for definitive radiological confirmation, such as CT scan, which further increases the delay in detection. Furthermore, these methods are expensive, time consuming (due to the complex clinical workflow), burdensome to the patient, and difficult to fit into the workflow. They also do not provide continuous measurements.
大手術を受けた患者等の、特定の患者の搬送にはリスクがないわけではなく、ベッドサイドで内出血を診断する際の信頼性を向上させる必要性が更に高まることにも言及する価値がある。 It is also worth mentioning that transporting certain patients, such as those undergoing major surgery, is not without risks, further increasing the need for improved reliability in diagnosing internal bleeding at the bedside.
Sela I他による文献“Measuring Left Ventricular Ejection Time using Under-the-Mattress Sensor”は、マットレス下の圧電センサを使用して心臓弾道効果を測定することにより左心室駆出時間(LVET)を測定することを開示している。LVETの短縮は、内出血中の血液損失の結果であると考えられている。当該センサは、できる限り心臓に近くなるように胸骨の下に配置される。 The article "Measuring Left Ventricular Ejection Time using Under-the-Mattress Sensor" by Sela I et al. discloses measuring left ventricular ejection time (LVET) by measuring cardiac ballistics using an under-the-mattress piezoelectric sensor. The shortening of LVET is believed to be the result of blood loss during internal bleeding. The sensor is placed under the sternum as close as possible to the heart.
内出血(血液量減少性ショック又は出血性ショックとしても知られる)を検出し、より一般的に体内の液体蓄積を検出するための、より特定的で感度の高い指標(指示情報)に対する要求が依然として存在する。 There remains a need for more specific and sensitive indicators for detecting internal bleeding (also known as hypovolemic or hemorrhagic shock) and more generally for detecting fluid accumulation in the body.
本発明は、請求項によって定義される。 The invention is defined by the claims.
本発明の一態様による例によれば、被検者の身体領域における液体蓄積を検出するためのシステムが提供され、該システムは:
- 前記被検者の心臓の拍動によって誘起される力、動き又は圧力の信号を取得するためのセンサ装置であって、前記信号が前記身体領域の密度分布に依存して変化するセンサ装置;及び
- 時間にわたり前記センサ装置の信号の変化を分析し、前記密度分布の変化を検出することに基づいて液体蓄積が生じたことを決定するプロセッサ;
を有する。
According to an example according to one aspect of the present invention, there is provided a system for detecting fluid accumulation in a body region of a subject, the system comprising:
- a sensor device for acquiring a force, movement or pressure signal induced by the beating of the subject's heart, the signal varying depending on a density distribution of the body region; and - a processor for analysing changes in the signal of the sensor device over time and determining that liquid accumulation has occurred based on detecting a change in the density distribution;
has.
このシステムは、センサ装置の信号の変化を追跡するもので、液体の蓄積によって引き起こされる物質の異なる密度の分布の変化の検出に基づくものである。 The system tracks changes in the signal of a sensor device and is based on detecting changes in the distribution of different densities of materials caused by the accumulation of liquid.
本発明は、密度分布の変化を検出するためのセンサ装置の信号の処理に基づいている。言い換えれば、身体領域内の密度分布に変化があり、他の全ての生理学的パラメータ及び応答が等しい場合、この変化が検出され、液体蓄積の指示情報として使用される。この処理は、液体蓄積の原因を検出すること、又は実際に発生し得る他の生理学的反応に基づくものではない。代わりに、本発明は、身体を介しての力、圧力又は動き信号の伝播の分析に基づくもので、特に心拍の特性を解釈する必要なしに、身体内の密度分布を決定できるようにする。 The invention is based on processing the signals of the sensor device to detect changes in density distribution. In other words, if there is a change in density distribution in a body region, and all other physiological parameters and responses are equal, this change is detected and used as an indication of fluid accumulation. This processing is not based on detecting the cause of fluid accumulation or other physiological responses that may actually occur. Instead, the invention is based on the analysis of the propagation of force, pressure or movement signals through the body, allowing the density distribution in the body to be determined, especially without the need to interpret the characteristics of the heartbeat.
液体の蓄積は、例えば、内出血の結果である可能性があり、密度の変化が、循環系からの血液の損失及び他の場所における血液の存在の結果として生じる。特に、密度分布の変化は、心臓によって引き起こされる圧力パルスが身体(特に関心領域)を通ってセンサ装置まで伝播する態様を変化させる。 Fluid accumulation may be the result of internal bleeding, for example, and density changes occur as a result of blood loss from the circulatory system and the presence of blood elsewhere. In particular, changes in density distribution alter the manner in which pressure pulses caused by the heart propagate through the body (particularly the region of interest) to the sensor device.
当該センサ装置は、例えば心弾動記録(BCG)センサのように機能する。心拍数及び呼吸の検出のためにBCG信号を使用することが知られており、本発明は、液体蓄積に関して、BCG信号、又は一層一般的には圧力、動き(運動)又は力に基づくセンサ装置の信号の分析を利用する。本発明は、当該信号における傾向の検出に基づくと共に時間的分析によるもので、自然に発生する変化を、例えば内出血によって引き起こされる病状を示す液体蓄積と区別できるようにする。したがって、一般に、本発明は、圧力、力及び/又は動きの信号を時間にわたり測定すること(センサ装置を使用して)、及び経時的に観察された差に基づいて、液体の蓄積が生じたかを決定することを含む。 The sensor device functions, for example, like a ballistocardiogram (BCG) sensor. It is known to use the BCG signal for heart rate and respiration detection, and the present invention utilizes the analysis of the BCG signal, or more generally, pressure, movement or force based sensor device signals, for fluid accumulation. The present invention is based on detecting trends in the signals and by temporal analysis, allowing to distinguish naturally occurring changes from fluid accumulation indicative of a pathology caused, for example, by internal bleeding. Thus, in general, the present invention involves measuring (using the sensor device) pressure, force and/or movement signals over time, and determining whether fluid accumulation has occurred based on the differences observed over time.
当該センサ装置の信号は、心臓の拍動によって引き起こされたパルス状圧力が当該身体領域を経て(好ましくは直接)通過した結果として変調された成分を少なくとも有する。当該信号処理は、身体領域の密度分布(3D空間における)の変化を検出するためのものである。このことは、如何なる密度値も出力として供給されることを意味するのではなく、該信号処理が、心拍特性が一定のままであっても、密度の変化に応答することを意味する。 The signal of the sensor device has at least a modulated component as a result of the pulsed pressure caused by the heart beating passing (preferably directly) through the body region. The signal processing is for detecting changes in the density distribution (in 3D space) of the body region. This does not mean that any density value is provided as output, but rather that the signal processing responds to density changes even if the heartbeat characteristics remain constant.
当該センサ装置は:
- 前記被検者の心臓に対して前記身体領域の反対側に配置するためのもの;
- 前記被検者の心臓に対して前記身体領域の反対側から感知するためのもの;又は
- 前記被検者に結合された物体の動きを、該物体の動きが前記心臓の拍動により誘起されるようにして感知するためもの;
であり得る。
The sensor device comprises:
- for placement on an opposite side of said body region relative to said subject's heart;
- for sensing from an opposite side of said body region to said subject's heart; or - for sensing movement of an object coupled to said subject, said movement of said object being induced by beating of said heart;
It could be.
幾つかの例において、前記関心領域は心臓とセンサとの間に位置し、心拍圧力波が該関心領域を経て伝播し該センサに到達するようにする。 In some examples, the region of interest is located between the heart and the sensor, such that cardiac pressure waves propagate through the region of interest to reach the sensor.
このような例において、センサは、心臓から横方向に、例えば少なくとも10cm、好ましくは少なくとも20cm、より好ましくは少なくとも30cm、変位されて配置されることが好ましい。横方向に変位されるとは、身体の一般面に平行で心臓を通過する平面に投影された場合に、センサの位置が該平面内の心臓の位置から変位されていることを意味する。したがって、心臓からセンサまでの身体を通る主要な経路の少なくとも幾つかは、当該関心身体領域を含み、該関心領域自体は、通常、心臓の真上又は真下ではない(即ち、上記平面に垂直な方向においいて)。 In such an example, the sensor is preferably positioned laterally displaced from the heart, e.g. by at least 10 cm, preferably at least 20 cm, more preferably at least 30 cm. By laterally displaced, it is meant that the position of the sensor, when projected onto a plane parallel to the general plane of the body and passing through the heart, is displaced from the position of the heart in said plane. Thus, at least some of the major paths through the body from the heart to the sensor include the body region of interest, which itself is typically not directly above or below the heart (i.e. in a direction perpendicular to said plane).
同じ概念が非接触センサにも適用され、その場合、特定の領域からの感知が依然として存在し得る。このようなケースにおいても、感知が行われる位置は、心臓から横方向に、例えば少なくとも10cm、好ましくは少なくとも20cm、より好ましくは少なくとも30cmだけ変位される。しかしながら、液体の蓄積がセンサ信号に測定可能な影響を与える限り、どのような構成も使用可能であるという点で、経路は直接的である必要はない。拍動する心臓は、他の物体(ベッドフレーム等)の動きを誘起さえし得る。 The same concept applies to non-contact sensors, in which case there may still be sensing from a particular area. Even in such cases, the location where sensing occurs is displaced laterally from the heart, for example by at least 10 cm, preferably at least 20 cm, more preferably at least 30 cm. However, the path does not have to be direct, in that any configuration can be used as long as the accumulation of fluid has a measurable effect on the sensor signal. The beating heart may even induce movement of other objects (such as a bed frame).
該物体への振動の結合は、この場合も、被検者の身体における例えば少なくとも10cm、好ましくは少なくとも20cm、より好ましくは少なくとも30cm心臓から横方向に変位された位置におけるものであり得る。 The coupling of vibrations to the object may again be at a location on the subject's body that is laterally displaced from the heart, for example at least 10 cm, preferably at least 20 cm, more preferably at least 30 cm.
一般的に、当該関心領域は心臓ではなく、目的は、心臓から離れた場所の液体の蓄積を、それ自体が心臓から離れている関心領域を経て伝搬した圧力波の分析に基づいて検出することである。したがって、当該センサは、心臓と該センサとの間の圧力波の伝播に対する測定可能な影響、特に圧力波が伝播した媒体の密度分布の変化によって引き起こされる影響が存在するように配置する必要がある。 Typically, the region of interest is not the heart, and the objective is to detect fluid accumulation remote from the heart based on analysis of pressure waves propagating through a region of interest that is itself remote from the heart. The sensor must therefore be positioned such that there is a measurable effect on the propagation of the pressure wave between the heart and the sensor, in particular an effect caused by a change in the density distribution of the medium through which the pressure wave propagates.
本発明は、個々の心拍の特徴の分析を必要とするものではない。代わりに、本発明は全体的な(累積的な)心拍圧力パルスの伝播、及び全体的な圧力パルスが身体を介して伝達される態様に依存する。このように、必要とされる信号分析は、心臓の特性を測定することを目的とするのではなく、身体の特性を測定することを目的とする。 The present invention does not require analysis of characteristics of individual heart beats. Instead, the present invention relies on the propagation of the overall (cumulative) heart beat pressure pulse and the manner in which the overall pressure pulse is transmitted through the body. Thus, the signal analysis required is not intended to measure characteristics of the heart, but rather characteristics of the body.
心臓の特性(LVET等)を推定するためには、心拍間隔又は心拍周波数等の心周期又は心拍に関連するパラメータの抽出を実行できる信号が必要である。このように、当該分析は周期的成分の検出に基づくものである。したがって、当該信号分析は、拍動する心臓によって取得される信号の、この周期的な挙動に関連する特徴を強調又は計算するための前処理を必要とする。 To estimate cardiac characteristics (such as LVET), a signal is required that allows the extraction of parameters related to the cardiac cycle or the heart beat, such as the beat-to-beat interval or the beat frequency. The analysis is thus based on the detection of periodic components. The signal analysis therefore requires a pre-processing of the signal acquired by the beating heart in order to highlight or calculate features related to this periodic behavior.
本発明によるより一般的なパルス伝播の分析により、捕捉された信号から周期的挙動を抽出する、又は個々の心周期又は心拍周期性に特に関連するパラメータを決定する必要がないという点で、より単純な信号処理が可能になる。 The more general analysis of pulse propagation according to the present invention allows for simpler signal processing in that it does not require extracting periodic behavior from the captured signal or determining parameters specifically related to individual cardiac cycles or cardiac periodicity.
例えば、当該分析は単一の心拍のみを有する期間(例えば、0.5秒)に関するデータのサンプルに基づいて実行することができ、かくして、心拍に関する周期性情報は必要とされない。当該分析は、より長い期間(例えば、数秒又は数十秒)のデータのサンプルに基づいて実行することができる。しかしながら、当該分析は依然として心拍の周期性に関する情報を利用することはなく、実際に、そのような周期性に関連する周波数成分は、可能性のある信号処理の幾つかの例では、当該信号処理から特に除外される(ハイパス又はバンドパスフィルタ処理により)。 For example, the analysis can be performed based on samples of data for a period having only a single heartbeat (e.g., 0.5 seconds), and thus no periodicity information about the heartbeat is required. The analysis can be performed based on samples of data for a longer period (e.g., several seconds or tens of seconds). However, the analysis still does not utilize information about the periodicity of the heartbeat, and indeed frequency components associated with such periodicity are specifically excluded from the signal processing (by high-pass or band-pass filtering) in some examples of possible signal processing.
当該センサ装置は:
- 1以上の圧力センサ;及び/又は
- 1以上の慣性センサ;
を好ましくは有する。
The sensor device comprises:
one or more pressure sensors; and/or one or more inertial sensors;
Preferably,
当該センサ装置は、心臓の関心領域とは反対側に配置され、従って、心臓によって生成される圧力波は、感知する前に関心領域を通過する。光学的感知も可能であり、実際にBCGセンサのための光学的感知アプローチが提案されていることに注意されたい。上記慣性センサは、加速度計、ジャイロスコープ又は他のジャイロセンサを有し得る。 The sensor device is placed on the opposite side of the heart from the region of interest, so that pressure waves generated by the heart pass through the region of interest before being sensed. Note that optical sensing is also possible, and in fact an optical sensing approach has been proposed for BCG sensors. The inertial sensor may include an accelerometer, gyroscope or other gyro sensor.
当該センサ装置は:
- 例えば脳の出血を監視するための、頭部に装着するためのセンサ装置;
- 例えば胴体内の出血を監視するための、腰の周りに装着するためのセンサ装置;
- 例えば肺内の体液蓄積を監視するための、背中に装着するためのセンサ装置;
- 例えば心臓より下の任意の位置における体液蓄積を監視するための、脚若しくは足に装着するためのセンサ装置;
- 前記被検者が立つ、座る若しくは横たわるセンサ装置;及び/又は
- 非接触センサ;
を有し得る。
The sensor device comprises:
- a sensor device to be worn on the head, for example for monitoring cerebral hemorrhages;
a sensor device for wearing around the waist, for example for monitoring bleeding in the torso;
- a sensor device to be worn on the back, for example to monitor fluid accumulation in the lungs;
- a sensor device for wearing on the leg or foot, for example to monitor fluid accumulation anywhere below the heart;
a sensor device on which the subject stands, sits or lies; and/or a non-contact sensor;
may have:
信号処理アプローチの一例において、前記プロセッサは:
- 特徴抽出を実行して、前記センサ装置の信号の関心特徴を分離し;
- 前記センサ装置の信号の関心特徴のパラメータを決定し;及び
- 前記決定されたパラメータの変化から、液体蓄積が生じたことを決定する;
ように構成することができる。
In one example signal processing approach, the processor:
- performing feature extraction to isolate features of interest in the signal of the sensor device;
- determining a parameter of a characteristic of interest of a signal of the sensor device; and - determining from a change in the determined parameter that liquid accumulation has occurred;
It can be configured as follows.
抽出されるべき関心特徴は、事前にわかっている場合には事前に定義若しくは事前に選択でき、又は例えば機械学習アルゴリズム等によって動的に決定することができる。 The features of interest to be extracted can be predefined or preselected if they are known in advance, or can be dynamically determined, for example by a machine learning algorithm.
前記センサ装置の信号の特性が変化したかを分析するために、特定の通知された特徴を抽出でき、これらの特徴値の変化を評価できる。 To analyze whether the characteristics of the signal of the sensor device have changed, specific notified features can be extracted and changes in the values of these features can be evaluated.
信号の形状又は他の特性の変化を経時的に監視する、より一般的な時系列分析を行うことができる。時間領域信号から多くの特徴を抽出でき、これらの特徴を使用して、機械学習ツールを液体の蓄積が発生したかを判定するために使用できる。これは、機械学習又はデータ駆動型のアプローチである。これには、液体の蓄積がある場合とない場合のセンサ装置の信号を使用したトレーニングが含まれる。代わりに又は加えて、機械学習を、抽出された特徴を使用してクラスタを形成できるかを評価する、教師なし態様で適用することができる。 A more general time series analysis can be performed, monitoring changes in the shape or other characteristics of the signal over time. Many features can be extracted from the time domain signal, and using these features, machine learning tools can be used to determine if liquid accumulation has occurred. This is a machine learning or data-driven approach. This involves training with the sensor device's signals with and without liquid accumulation. Alternatively or in addition, machine learning can be applied in an unsupervised manner, evaluating whether clusters can be formed using the extracted features.
深層学習法では、特徴を事前に計算する必要はない。代わりに、生のセンサ装置の信号を入力として使用でき、液体の蓄積を検出できる。深層学習法のニューラルネットワークは、最初に注釈付きのセンサ装置データでトレーニングされる。 Deep learning methods do not require pre-computation of features. Instead, raw sensor device signals can be used as input to detect liquid accumulation. The neural network of the deep learning method is first trained on the annotated sensor device data.
特徴ベースのアプローチにおいて、前記パラメータは、例えば、信号エネルギ、信号強度又は信号分散の尺度を有する。したがって、これは、心臓とセンサ装置との間の信号減衰(又は増幅又は変動)のレベルに関連する。 In a feature-based approach, the parameter may for example comprise a measure of signal energy, signal strength or signal variance. This is therefore related to the level of signal attenuation (or amplification or variation) between the heart and the sensor device.
前記プロセッサは、好ましくは、少なくとも2分の時間枠にわたってセンサ装置の信号の変化を分析するように構成される。 The processor is preferably configured to analyze changes in the sensor device signal over a time frame of at least two minutes.
この時間枠は、被検者が監視される期間に関連する。これは、監視の開始と終了との間に十分な液体が蓄積されていることを保証するために十分に長くなければならない。液体蓄積(例えば、出血)の強度に依存して、この時間枠は、通常、数分から数時間の範囲であり得る。被検者は、この時間枠内で継続的に監視され得る。例えば、液体蓄積の尺度を導出するための前記信号の処理は、数分の1秒(例えば0.5秒)から数秒、数秒から数分(例えば1分)まで変化し得る時間窓(ウィンドウ)内で行われる。 This time frame relates to the period over which the subject is monitored. It must be long enough to ensure that sufficient fluid has accumulated between the start and end of monitoring. Depending on the intensity of the fluid accumulation (e.g. bleeding), this time frame can usually range from a few minutes to a few hours. The subject can be continuously monitored within this time frame. For example, the processing of the signal to derive a measure of fluid accumulation is performed within a time window that can vary from a fraction of a second (e.g. 0.5 seconds) to a few seconds, from a few seconds to a few minutes (e.g. 1 minute).
順次のパラメータ決定のための時間窓は、オーバーラップし得る。したがって、分析が実行される移動時間窓が存在し得る。上記オーバーラップは、例えば、50%(例えば、30秒毎の新しい測定値の場合、1分の時間枠の30秒のオーバーラップ)と95%(例えば、1秒毎の新しい測定値の場合、20秒の時間枠の19秒のオーバーラップ)との間である。 The time windows for sequential parameter determinations may overlap. Thus, there may be a moving time window over which the analysis is performed. The overlap may be, for example, between 50% (e.g., a 30 second overlap in a 1 minute time window for a new measurement every 30 seconds) and 95% (e.g., a 19 second overlap in a 20 second time window for a new measurement every second).
一群の例において、前記プロセッサは前記センサ装置の信号を周波数成分に分解することにより前記特徴抽出を実施するための分解アルゴリズムを有することができ、前記関心特徴は、1.67Hzより上に又は前記被検者の決定された心拍数周波数より上に位置する周波数帯域内の周波数成分を有する。 In one set of examples, the processor may have a decomposition algorithm for performing the feature extraction by decomposing the sensor device signal into frequency components, the feature of interest having frequency components within a frequency band located above 1.67 Hz or above a determined heart rate frequency of the subject.
(心拍数に関連する)高周波成分は、内出血又は他の液体蓄積によって引き起こされる密度分布の変化を表す上で特に重要であることがわかっている。 High frequency components (associated with heart rate) have been found to be particularly important in representing changes in density distribution caused by internal bleeding or other fluid accumulation.
前記分解アルゴリズムは、例えば、経験的モード分解を実施するように構成される。これは、周波数分析に適したアプローチの1つである。他のアプローチには、ウェーブレット変換、又はバンドパスフィルタ処理(即ち、フィルタバンクの使用)が含まれる。 The decomposition algorithm may, for example, be configured to perform empirical mode decomposition, which is one suitable approach for frequency analysis. Other approaches include wavelet transformations, or bandpass filtering (i.e., using a filter bank).
特徴ベースのアプローチにおいて、前記パラメータはヒルベルト変換又は抽出された周波数ベースの特徴のエネルギを有することができ、その場合、前記プロセッサはヒルベルト変換を実行するためのヒルベルト変換ユニットを有し得る。 In a feature-based approach, the parameters may include a Hilbert transform or the energy of extracted frequency-based features, in which case the processor may include a Hilbert transform unit for performing the Hilbert transform.
他の群の例において、前記パラメータは生のセンサ装置の信号(したがって、先行する周波数分解なしの)のエネルギ又はヒルベルト変換を有し、その場合、当該システムはヒルベルト変換を実行するためのヒルベルト変換ユニットを有し得る。このように、周波数ベースの分解は必須ではなく、当該処理は生信号に対して実行されてもよい。上記生信号は、特徴又はパラメータを計算する前に処理される必要があり得る(例えば、分析前の該生信号の変換又はフィルタ処理)ことに注意されたい。したがって、「生信号」という用語は、周波数成分には分解されていないが、何らかの信号の前処理が行われた信号として理解されるべきである。このことは、取得された生の信号にノイズが含まれている場合、又はアーティファクトが含まれているため、更に分析する前にクリーニングする必要がある場合に重要である。 In another group of examples, the parameter comprises the energy or Hilbert transform of the raw sensor device signal (thus without prior frequency decomposition), in which case the system may comprise a Hilbert transform unit for performing the Hilbert transform. Thus, a frequency-based decomposition is not required and the processing may be performed on the raw signal. It should be noted that the raw signal may need to be processed before calculating the features or parameters (e.g., transforming or filtering the raw signal before analysis). Thus, the term "raw signal" should be understood as a signal that has not been decomposed into frequency components, but has undergone some signal pre-processing. This is important when the acquired raw signal is noisy or contains artifacts and needs to be cleaned before further analysis.
この生信号の処理は、信号分解が適用される前に適用されてもよい。 This processing of the raw signal may be applied before signal decomposition is applied.
前記センサ装置の信号は:
- 前記被検者の身体の頭部-つま先方向に平行な方向のベクトル量の測定;
- 前記被検者の身体の頭部-つま先方向に垂直な方向のベクトル量の測定;又は
- 異なる方向の複数のベクトル量の組み合わせ;
に基づくものであり得る。
The signal of the sensor device is:
- measurement of vector quantities in a direction parallel to the head-to-toe direction of the subject's body;
- measurement of a vector quantity in a direction perpendicular to the head-to-toe direction of the subject's body; or - a combination of a number of vector quantities in different directions;
It may be based on.
したがって、加速度計の測定等の、1軸、2軸、又は3軸の測定を使用することができる。更に、当該センサ装置は、センサのアレイ、例えば圧力マットを形成するセンサの2Dアレイを有し得る。このようなケースにおいては、時間とともに変化する2D信号が存在し得る。 Thus, one-, two- or three-axis measurements can be used, such as accelerometer measurements. Furthermore, the sensor device may comprise an array of sensors, for example a 2D array of sensors forming a pressure mat. In such cases, there may be a 2D signal that varies over time.
当該液体蓄積は、例えば、内出血を有する。 Such fluid accumulation may include, for example, internal bleeding.
本発明は、被検者の身体領域における液体蓄積を検出するための方法も提供し、該方法は:
- 前記被検者の心臓の拍動によって誘起される力、動き又は圧力信号を取得するステップであって、該信号が前記身体領域の密度分布に依存して変化するステップ;及び
- 時間にわたり前記信号の変化を分析し、該密度分布の変化を検出することに基づいて液体蓄積が生じたことを決定するステップ;
を有する。
The present invention also provides a method for detecting fluid accumulation in a body region of a subject, the method comprising:
- acquiring a force, motion or pressure signal induced by the beating of the subject's heart, the signal varying depending on a density distribution of the body region; and - analysing the changes in the signal over time and determining that liquid accumulation has occurred based on detecting a change in the density distribution;
has.
本発明は、コンピュータ上で実行された場合に、上述された方法を実施するように適合されたコンピュータプログラムコード手段を有するコンピュータプログラムも提供する。 The present invention also provides a computer program having computer program code means adapted to carry out the method described above when executed on a computer.
本発明のこれら及び他の態様は、以下に説明する実施形態から明らかになり、これら実施形態を参照して説明されるであろう。 These and other aspects of the invention will become apparent from and elucidated with reference to the embodiments described hereinafter.
本発明をよりよく理解し、本発明がどのように実施されるかをより明確に示すために、添付図面を例示としてのみ参照する。 For a better understanding of the invention and to show more clearly how it may be carried into effect, reference will now be made, by way of example only, to the accompanying drawings in which:
本発明を、図面を参照して説明する。 The present invention will be described with reference to the drawings.
詳細な説明及び特定の例は、装置、システム及び方法の例示的な実施形態を示しているが、説明のみを目的としており、本発明の範囲を限定することを意図していないことを理解されたい。本発明の装置、システム及び方法のこれら及び他の特徴、態様及び利点は、以下の説明、添付請求項及び添付図面からよりよく理解されるであろう。図は単に概略図であり、縮尺通りに描かれていないことを理解すべきである。同一又は類似の部分を示すために、全図にわたって同じ参照番号が使用されていることも理解されたい。 It should be understood that the detailed description and specific examples, while illustrating exemplary embodiments of the devices, systems, and methods, are for purposes of illustration only and are not intended to limit the scope of the invention. These and other features, aspects, and advantages of the devices, systems, and methods of the present invention will become better understood from the following description, appended claims, and accompanying drawings. It should be understood that the figures are merely schematic and are not drawn to scale. It should also be understood that the same reference numbers are used throughout the figures to indicate the same or similar parts.
本発明は、被検体(被検者)における液体(体液)蓄積を検出するためのシステムを提供する。心臓の拍動によって引き起こされる動きが、動き、圧力又は力を監視することにより時間にわたり分析される。液体蓄積による密度の変化が、センサ装置の信号の変化につながる。変化が、内出血等の体液の蓄積が起こった可能性があることを示すために使用される。 The present invention provides a system for detecting fluid accumulation in a subject. Movement caused by heartbeats is analyzed over time by monitoring the movement, pressure or force. Changes in density due to fluid accumulation lead to changes in the signal of the sensor device. The changes are used to indicate that fluid accumulation, such as internal bleeding, may have occurred.
本発明は、心臓の拍動から生じる身体の動きの分析を利用する。 The present invention utilizes an analysis of the body movements resulting from the beating of the heart.
心弾動図(BCG)は、心臓からの血液の駆出に対する身体の反応(変位、速度又は加速度)として定義される。したがって、これは、心臓内、動脈(主に大動脈)内の血液の動き、及び心臓自体の動きに関連する複数の力の統合である。したがって、本発明は、心弾動図に類似した信号の分析を利用する。このタイプの信号は、通常、センサが心臓の可能な限り近くに配置されて、心拍数又は呼吸の測定に使用されるが、本発明では、このタイプの運動信号を心臓から離れた場所で検出し、心臓圧力波の伝播が身体の関心領域を介して検出されることを可能にする。 The ballistocardiogram (BCG) is defined as the body's reaction (displacement, velocity or acceleration) to the ejection of blood from the heart. It is therefore an integration of multiple forces related to the movement of blood in the heart, in the arteries (mainly the aorta) and the movement of the heart itself. The present invention therefore utilises the analysis of a signal similar to a ballistocardiogram. This type of signal is usually used to measure heart rate or respiration, with sensors placed as close as possible to the heart, but the present invention detects this type of motion signal at a distance from the heart, allowing the propagation of cardiac pressure waves to be detected through a region of interest in the body.
心弾動図(及び本発明による運動、力又は圧力感知によりピックアップされる信号)は、本質的に多次元信号であり、全ての方向及び全ての側で測定することができる。これらの信号は頭部-足先方向で最も強いため、殆どのBCG測定技術は縦方向の頭部-足先成分に焦点を当てている。 Ballistocardiograms (and the signals picked up by motion, force or pressure sensing in accordance with the present invention) are inherently multi-dimensional signals and can be measured in all directions and on all sides. These signals are strongest in the head-to-toe direction, so most BCG measurement techniques focus on the longitudinal head-to-toe component.
患者の心臓を測定するために特にSCG(心理心電図:seismocardiography)を実施する際に、BCG信号を使用することが知られており、感知電極は可能な限り心臓の近くに配置される。更に、当該システムから呼吸数を導き出すことができる。後者は、背腹方向に最大の力を有する。しかしながら、BCG信号は、より一般的には、異なる側で、且つ、心臓から離れた場所において測定できる。また、これら信号は、センサをベッド、背もたれ又は椅子等の被検者が接触する物体に配置して測定することもできる。 It is known to use BCG signals to measure the patient's heart, especially when performing SCG (seismocardiography), with the sensing electrodes being placed as close as possible to the heart. Furthermore, the respiratory rate can be derived from the system. The latter has a maximum force in the dorsoventral direction. However, BCG signals can more commonly be measured on different sides and at a distance from the heart. These signals can also be measured by placing sensors on objects with which the subject comes into contact, such as a bed, a backrest or a chair.
本発明は、BCG信号等の運動/圧力信号は液体蓄積の結果として変化する特性を有するという洞察に基づいている。このことは、拍動する心臓及び移動する血液によって発生される力に起因する身体部分の動き、振動又は共振が液体の蓄積の結果として変化する故に発生する。 The present invention is based on the insight that motion/pressure signals, such as BCG signals, have characteristics that change as a result of fluid accumulation. This occurs because the movement, vibration or resonance of body parts due to forces generated by the beating heart and moving blood changes as a result of fluid accumulation.
言い換えると、通常、内部臓器は心臓の拍動の結果として特定の態様で振動するが、これは液体が蓄積されるために変化し、これら臓器の振動特性(例えば、減衰及び剛性)が変化し、このことは、身体の外部から測定されるBCG信号も変化させる。 In other words, while internal organs normally vibrate in a certain way as a result of the beating of the heart, this changes due to the accumulation of fluid, changing the vibration properties (e.g. damping and stiffness) of these organs, which in turn changes the BCG signal measured from outside the body.
図1は、被検者12が立っている圧力マット10により測定されたECG信号とBCG信号との間の関係を示している。
Figure 1 shows the relationship between the ECG signal and the BCG signal measured by a
本発明は、内出血等の内部液体蓄積を測定するためにBCGタイプの情報を使用することに基づいている。身体の動きを検出し、これによりBCGタイプの信号を取得するために、任意の適切な方法を使用することができる。例としては、加速度計、ジャイロスコープ、力センサ及び圧力センサがある。例えば、重量計はロードセルを使用する。 The present invention is based on using BCG type information to measure internal fluid accumulation such as internal bleeding. Any suitable method can be used to detect body movement and thereby obtain the BCG type signal. Examples include accelerometers, gyroscopes, force sensors and pressure sensors. For example, weighing scales use load cells.
加速度計は、例えば呼吸センサ等の身体センサにおいて既に広く使用されている。圧力センサ又はロードセルは、被検者の下等の、被検者と接触して配置できるマットに組み込むことができる。カメラを使用してBCG信号を測定することも知られており、このようなシステムも使用できる。カメラは非接触的感知アプローチを提供する。モーションセンサを使用して、被検者と接触している物体の動きを監視することにより、非接触感知(センシング)を実施することもできる。このような物体は、吊り下げ式ベッド、可撓性脚上に配置されたベッド、又は可撓性背もたれ付きの座席であり得る。例えば、間にマットレスがある場合、直接接触する必要はない。したがって、より一般的には、その動きがBCGによって引き起こされる物体の動きを監視することが可能である。 Accelerometers are already widely used in body sensors, e.g. respiration sensors. Pressure sensors or load cells can be integrated into a mat that can be placed in contact with the subject, e.g. under the subject. It is also known to use cameras to measure the BCG signal, and such systems can also be used. Cameras provide a non-contact sensing approach. Non-contact sensing can also be performed using motion sensors to monitor the movement of an object in contact with the subject. Such an object can be a suspended bed, a bed placed on flexible legs, or a seat with a flexible backrest. Direct contact is not necessary, for example, if there is a mattress in between. It is therefore possible to monitor the movement of an object, the movement of which is caused by the BCG, more generally.
このような場合、当該センサ装置は被検者の身体上には位置されないが、たとえ感知が非接触であっても、身体の既知の領域から感知するためのものである。
したがって、本発明は、異なるタイプのセンサに適用可能である。
In such cases, the sensor device is not placed on the subject's body, but is for sensing from a known area of the body, even if the sensing is non-contact.
Thus, the present invention is applicable to different types of sensors.
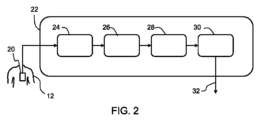
図2は、被検者12の内出血等の液体蓄積を検出するための本発明によるシステムを示す。このシステムは、被検者の動きに関するセンサ信号を取得するためのセンサ装置20を有する。便宜上、この時点以降、該信号は単に心弾動記録信号と呼ばれる。センサ装置20は、例えば、身体の振動を測定するために加速度計、圧力センサ又はこれらの組み合わせを有する。
Figure 2 shows a system according to the invention for detecting fluid accumulation, such as internal bleeding, in a subject 12. The system comprises a
プロセッサ22は、上記センサ装置の信号の分析を実行する。該プロセッサは、例えば機械学習又は深層学習アルゴリズムを使用して、時間にわたり生のセンサ装置の信号を単に分析することができる。しかしながら、本発明の根底にある概念をより明確に示すために、より識別可能で構造化された信号分析に基づく処理アプローチについて説明する。
The
この例の場合、プロセッサ22は以下のものを備えている:
- 信号前処理のための第1の信号処理ユニット24。この処理は、例えば、当該信号成分のノイズ除去及び抽出を可能にするフィルタリング及び分解を含む;
- 当該心弾動記録信号の関心のある特徴を分離するための特徴抽出ユニット26;
- 該心弾動記録信号の関心特徴のパラメータを決定するための特徴分析ユニット28。この関心特徴は、特にエネルギ又は信号強度に関連する特徴である;
- 決定された上記パラメータの変化から内出血が起こったことを決定するための出力ユニット30。これは、内出血が発生したことを示すためのアラート32を生成するために使用され得る。
In this example, the
a first
a
a
- an
前述したように、身体内の臓器は、心臓の拍動、大きな動脈(特に大動脈)内の血流による及び呼吸による振動力を受ける。これらの振動を捕捉するために、患者の身体の動きを測定することができる、該動きは、患者の動き、心拍数成分及び呼吸成分(即ち、振動力)から構成される。 As mentioned above, organs in the body are subject to vibrational forces due to the beating of the heart, blood flow in the large arteries (especially the aorta) and due to breathing. To capture these vibrations, the patient's body motion can be measured, which consists of the patient's motion, heart rate component and breathing component (i.e., vibrational force).
心臓の拍動及び胴体の動き(呼吸)は、身体を介して進む力を誘起する。身体内にある如何なる区画(臓器、組織、体液等)も、密度及びサイズ、並びに減衰及び剛性特性等の、当該区画の性質に応じて異なる反応をする。捕捉される振動信号の周波数領域を見ると、より低い周波数は被検者の動き及び患者の呼吸(≒0.4Hz)に由来し、心拍数は約1Hzであり、測定される心拍数より高い周波数成分は主に心臓の拍動によって生じる力による身体の振動である。 The beating of the heart and the movement of the torso (breathing) induce forces that move through the body. Any compartment within the body (organ, tissue, fluid, etc.) will respond differently depending on the properties of that compartment, such as density and size, as well as damping and stiffness properties. Looking at the frequency domain of the captured vibration signal, the lower frequencies come from the subject's movement and the patient's breathing (≈0.4 Hz), the heart rate is around 1 Hz, and the higher frequency components than the measured heart rate are primarily body vibrations due to forces generated by the beating of the heart.
当該技術思想は、内出血等の液体蓄積の結果としての(局部的)身体密度の変化を検出することに基づくものである。身体密度は、実際に:
- 膀胱内の尿の蓄積;
- 敗血症による血液漏出;
- 食物の摂取;
- 液体の摂取又は追加(例えば、投薬又は静脈内輸液);
- 内出血;
- 炎症;
等の種々の理由により変化し得る。
The idea is based on detecting changes in (local) body density as a result of fluid accumulation, such as internal bleeding. Body density is actually:
- Accumulation of urine in the bladder;
- blood leakage due to sepsis;
- food intake;
- taking or adding fluids (e.g. medication or intravenous fluids);
- internal bleeding;
- inflammation;
The amount of the change may vary for various reasons.
身体密度の変化は、異なる時間枠、及び振動に対する異なる影響を有する。例えば、食物の摂取は大きく突然の変化を引き起こす。この突然の変化は、ベースラインを修正することにより、基本的には、低周波数成分を除去するためにハイパスフィルタ処理を実施することにより当該システムからフィルタ除外できる。 Changes in body density have different time frames and different effects on vibration. For example, eating food causes a large and sudden change. This sudden change can be filtered out of the system by modifying the baseline, essentially performing high pass filtering to remove low frequency content.
静脈内点滴による液体の追加は、血流を介して体全体に再分配される緩やかなプロセスであり(したがって、液体の蓄積はない)、炎症は組織の局所的密度を変化させる (即ち、より高い灌流、腫れ)比較的ゆっくりとしたプロセスである。固形食品(即ち、水分含有量が少ない)の摂取は、変化が反対方向であるため、出血や又は液体の摂取と明確に区別できる。 Addition of fluid via intravenous infusion is a gradual process that is redistributed throughout the body via the bloodstream (so there is no accumulation of fluid), whereas inflammation is a relatively slow process that changes the local density of tissue (i.e., higher perfusion, swelling). Ingestion of solid foods (i.e., low water content) can be clearly distinguished from bleeding or ingestion of fluids, as the changes are in the opposite direction.
ここで、この特定の例で使用される異なる処理ステップを、より詳細に説明する。
[第一信号処理]
The different processing steps used in this particular example will now be described in more detail.
[First signal processing]
第1の信号処理ユニット24は、5秒から60秒、例えば30秒等の予め定められた持続時間の分析ウィンドウを実施化する。この所定の持続時間は、複数の心周期をカバーする。該ウィンドウは、関心信号特性が測定されるのに十分なデータを収集する。
The first
これらのウィンドウは、分析期間全体、例えば、5分等の、少なくとも2分にわたって分析される。したがって、期間[t1 t2]内の1以上の加速度計信号等の生のセンサデータは、[t1 t1+30]、[t1+1 t1+31]等々の30秒の分析期間に分割される。全体の期間は、液体の蓄積レベルが変化するのに十分なものである。 These windows are analyzed over the entire analysis period, e.g., at least 2 minutes, such as 5 minutes. Thus, raw sensor data, such as one or more accelerometer signals, in period [t1 t2] are divided into 30 second analysis periods, such as [t1 t1+30], [t1+1 t1+31], etc. The entire period is sufficient for the fluid accumulation level to change.
また、当該分析期間は、例えば50%オーバーラップするウィンドウ等のように、部分的にオーバーラップし得る。
[特徴抽出]
The analysis periods may also be partially overlapping, such as, for example, 50% overlapping windows.
[Feature Extraction]
特徴抽出ユニット26は、第1の信号プロセッサによってウィンドウ処理された信号の特徴を計算する。一例において、該計算は、元の信号を構成周波数成分に分解するステップを有する。これらの周波数成分を加算すると、元の信号になる。呼吸及び心拍の周波数は大幅に異なるため、周波数分解により、呼吸及び心拍のみに対応する周波数特性が、拍動する心臓の活動による振動に対応する他の特性(前述のとおり)と一緒に導き出される。
The
周波数分解には、経験的モード分解(EMD)を使用できるが、代わりにウェーブレット変換及びフィルタバンク分析を使用することもできる。これら2つの手法に対する EMDの利点は、EMDがノンパラメトリックであることである。 For frequency decomposition, empirical mode decomposition (EMD) can be used, but alternatively wavelet transforms and filter bank analysis can be used. The advantage of EMD over these two techniques is that it is non-parametric.
EMDを使用した結果としての分解信号は、固有モード関数(IMF)と呼ばれる。 The decomposed signals resulting from using EMD are called intrinsic mode functions (IMFs).
例示として、図3は、時間の経過に伴う3軸加速度計の生の加速度計信号を示している。 By way of example, Figure 3 shows the raw accelerometer signal of a three-axis accelerometer over time.
該生の信号は、EMDを適用する前に、該信号を自身の平均により除算すると共に1 を減算することにより、ゼロ平均を有するように正規化される。該EMD処理の出力は、図4に示されたIMFである。 The raw signal is normalized to have zero mean by dividing the signal by its mean and subtracting 1 before applying EMD. The output of the EMD process is the IMF shown in Figure 4.
これらのIMFは時間領域の信号であるが、異なる周波数帯域に分割されている。即ち、x軸は時間を秒単位で示している。 These IMFs are time domain signals, but split into different frequency bands, i.e. the x-axis shows time in seconds.
IMFの数は、当該生信号に依存する。これらIMFは減少する周波数成分を有し、最初のIMF(図4の上部)は高周波ノイズをモデル化し、最後のIMF(図4の下部)は当該生信号のDCをモデル化している。 The number of IMFs depends on the raw signal. They have decreasing frequency content, with the first IMF (top of Figure 4) modeling high frequency noise and the last IMF (bottom of Figure 4) modeling the DC of the raw signal.
IMFの計算には、短い時間枠(例えば、60秒)の処理が使用される。ウィンドウは時間的にシフトされる(秒の桁のシフト量であるが、ウィンドウの長さより短い)。例えば、10秒から60秒まで変化するウィンドウ長を使用して、同等の結果を得ることができる。最適なウィンドウ長は測定される周波数に依存し、より長いウィンドウは低い周波数に適し、より短いウィンドウは高い周波数に適している。 For the IMF calculation, a short time frame (e.g. 60 seconds) of processing is used. The window is shifted in time (a shift of the order of seconds, but less than the window length). For example, window lengths varying from 10 seconds to 60 seconds can be used with comparable results. The optimal window length depends on the frequency being measured, with longer windows being suitable for lower frequencies and shorter windows being suitable for higher frequencies.
図5は、図4のIMFのフーリエ変換振幅を示している。 Figure 5 shows the Fourier transform amplitude of the IMF in Figure 4.
これらのフーリエ変換振幅は、周波数領域信号である。即ち、x軸は周波数をHz で示している。 These Fourier transform magnitudes are frequency domain signals, i.e. the x-axis shows frequency in Hz.
図5からわかるように、最初の2つのIMFは高い周波数成分を含み、これらは、このアプリケーションのための関心成分である。3番目(この特定の例における)及びそれ以降の成分は心拍数を含む。 As can be seen in Figure 5, the first two IMFs contain high frequency components, which are the components of interest for this application. The third (in this particular example) and subsequent components contain the heart rate.
当該IMFの周波数コンテンツは、高い周波数から低い周波数へと並べられる。言い換えると、最初のIMFは最高の周波数を含み、周波数はIMF番号が増加するにつれて減少する。心拍数は、例えば、3番目の成分に見られるが、これは信号の特性に依存する。 The frequency content of the IMFs is ordered from high to low. In other words, the first IMF contains the highest frequencies and the frequencies decrease as the IMF number increases. Heart rate, for example, can be found in the third component, depending on the characteristics of the signal.
呼吸数も測定できる。この例の場合、これは6番目の成分で観察される。心拍数より上の成分が対象なので、心拍数自体を使用して正しい特徴を抽出できる。 Respiration rate can also be measured. In this example, this is observed in the 6th component. Since we are interested in the components above the heart rate, the heart rate itself can be used to extract the correct features.
前述したように、当該処理はカットオフ周波数の正確な選択にあまり敏感ではない。このことは、1.67Hzより高い、又は被検者の決定された心周波数を超える全ての成分を使用できることを意味する。ノイズの多い状況では、選択した周波数帯域に焦点を合わせ、これらの帯域の特徴を計算することが望ましい。
[特徴分析]
As mentioned before, the process is not very sensitive to the exact choice of the cut-off frequency. This means that all components above 1.67 Hz or above the determined cardiac frequency of the subject can be used. In noisy situations, it is advisable to focus on selected frequency bands and calculate the characteristics of these bands.
[Feature Analysis]
特徴分析ユニット28は、エネルギ等の代表的な特徴を抽出するために、心拍数よりも高い周波数の分解信号を分析するために使用される。特に、信号の振幅に結び付けられるエネルギ特徴は、液体の蓄積に関連する。エネルギ及び/又はヒルベルト変換を、時間の経過に伴う振動の変化を測定及び調査するために使用できる。
The
図4のIMFの各々に関して、正規化された時間領域信号のエネルギ成分が、「エネルギ」尺度又は「ヒルベルト」変換を適用することによって取得される。 For each of the IMFs in Figure 4, the energy content of the normalized time domain signal is obtained by applying an "energy" measure or "Hilbert" transform.
当該エネルギ尺度は、当該(正規化された)信号の二乗平均平方根エネルギである。当該信号は、例えば、エネルギを計算する前にゼロ平均を有するように正規化される。この場合(即ち、正規化後)、エネルギ尺度は当該信号の標準偏差に類似する。しかしながら、エネルギを計算する前に信号を正規化することは、厳格に必要というものではない。 The energy measure is the root-mean-square energy of the (normalized) signal. The signal is, for example, normalized to have zero mean before calculating the energy. In this case (i.e. after normalization), the energy measure resembles the standard deviation of the signal. However, it is not strictly necessary to normalize the signal before calculating the energy.
エネルギコンテンツに関連する代替的尺度は、選択されたIMF信号に適用されるヒルベルト変換である。 An alternative measure related to energy content is the Hilbert transform applied to the selected IMF signal.
ヒルベルト特徴の計算には、局部的包絡線検出のためにヒルベルト変換(HT)が使用される。HT特徴は、考慮中のウィンドウから取得した複素分析信号のモジュラスの平均値として定義される。該解析信号は、元の信号と該信号のヒルベルト変換とを有する複素信号の和として定義される。 To calculate the Hilbert features, the Hilbert transform (HT) is used for local envelope detection. The HT feature is defined as the average value of the modulus of the complex analytic signal obtained from the window under consideration. The analytic signal is defined as the sum of a complex signal comprising the original signal and the Hilbert transform of the signal.
ヒルベルト変換は、基本的に、信号の包絡線の追跡を容易にする変換である。該包絡線は、振幅の変動、即ち信号のエネルギを表す。 The Hilbert transform is essentially a transform that makes it easier to track the envelope of a signal. The envelope represents the amplitude variations, i.e. the energy, of the signal.
これらの特徴は、心拍数よりも高い周波数を持つ(心拍数自体に基づく、又は閾レベルに基づく)IMFについて計算される。
[出力ユニット]
These features are calculated for IMFs that have a frequency higher than the heart rate (either based on the heart rate itself or based on a threshold level).
[Output unit]
出力ユニット30は、上記特徴分析により特定された特徴に適合する傾向線の推定を実施する。身体内部の変化に起因する特徴の如何なる(徐々の)変化も検出するために、これらの特徴の移動平均がなされる。該傾向線の傾きに基づいて、アラートが生成される(例えば、当該傾きが負の場合、潜在的な内出血に対してアラートが生成される)。
The
前述のように、当該特徴分析は安静時心拍数よりも高い周波数帯域に焦点を当て得る。実験的に、詳細は後述するが、これらの周波数帯域は、身体密度の局所的な変化に対してより敏感であり、したがって、より優れた区別を提供できることが示されている。正確な下限カットオフ周波数は、心拍数よりも低い周波数だけが含まれているわけではない限り、重要ではない。例えば1.67Hz等の心拍数より高い又は実際の心拍数より高い(固定下限閾値の場合)若しくは実際の心拍数に基づく下限閾値で帯域内の周波数に焦点を当てることが適切である。 As mentioned above, the feature analysis may focus on frequency bands higher than the resting heart rate. Experiments have shown that these frequency bands are more sensitive to local changes in body density, and therefore provide better discrimination, as will be described in more detail below. The exact lower cutoff frequency is not important, as long as it does not include only frequencies lower than the heart rate. It is appropriate to focus on frequencies in a band above the heart rate, such as 1.67 Hz, or above the actual heart rate (in the case of a fixed lower threshold), or with a lower threshold based on the actual heart rate.
フィルタバンクを使用する等の周波数領域分析方法の場合、カットオフ周波数が設定される(例えば、1.67Hzから5Hzの範囲に)。正確な心拍数の測定値が利用できる場合、該心拍数を入力として使用して、より適切なカットオフ周波数を導き出すことができる。 For frequency domain analysis methods such as using a filter bank, a cutoff frequency is set (e.g., in the range of 1.67 Hz to 5 Hz). If an accurate heart rate measurement is available, it can be used as an input to derive a more appropriate cutoff frequency.
フィルタリングは必須ではない。代わりに、高い側の周波数が当該分析に含まれる必要があるだけである。しかしながら、例えば周波数分解を伴わない生信号処理の場合のように、高い側の周波数及び低い側の周波数の両方とも含まれる場合でも、当該検出は可能である。 Filtering is not required. Instead, only the higher frequencies need to be included in the analysis. However, detection is possible even when both higher and lower frequencies are included, such as in raw signal processing without frequency decomposition.
このように、当該信号を処理することが可能な多数のやり方が存在する。1つのオプションは心拍数よりも高い周波数のみを使用することであり、他のオプションは心拍数も含む全ての周波数を使用することである。
[周波数領域対時間領域]
Thus, there are many ways in which the signal can be processed: one option is to use only frequencies higher than the heart rate, another option is to use all frequencies including the heart rate.
[Frequency domain vs. time domain]
上記例は、図4のIMF信号を導出するために時間領域分析に基づいている。しかしながら、当該分解は周波数領域で実行することもできる。 The above example is based on a time domain analysis to derive the IMF signal of FIG. 4. However, the decomposition can also be performed in the frequency domain.
周波数分解なしで時間領域分析も可能である。 Time domain analysis is also possible without frequency decomposition.
例えば、エネルギ特徴は、生信号を異なる周波数の成分に分解することなく、生信号から直接計算することができる。患者が静止している低ノイズ条件では、この単純な方法が適している。心拍信号を除外しなくても、観察される効果は存在する。心拍数信号を除外すると、状態の区別が一層明確になるが、必要ということではないであろう。 For example, energy features can be calculated directly from the raw signal without decomposing it into components of different frequencies. In low noise conditions when the patient is stationary, this simple method is suitable. The observed effect is present even without excluding the heart rate signal. Excluding the heart rate signal would make the distinction between states clearer, but this may not be necessary.
当該時間領域方法は、例えば、以下のステップを有する:
分析のためのウィンドウ期間が定義される。例えば、20秒の移動平均ウィンドウを 1秒ごとの計算で使用できる(95%のウィンドウオーバーラップを与える)。これらのウィンドウは、5分等の分析期間全体にわたって分析される。
The time domain method may, for example, comprise the following steps:
A window period for the analysis is defined. For example, a 20 second moving average window can be used with a 1 second calculation (giving 95% window overlap). These windows are analyzed over an analysis period, such as 5 minutes.
加速度計の場合、該加速度計の1以上の軸を分析のために選択できる。複数の軸を選択した場合、これら軸のデータを加算して組み合わせることができる。 In the case of an accelerometer, one or more axes of the accelerometer can be selected for analysis. If multiple axes are selected, the data from these axes can be added together and combined.
エネルギ尺度(例えば、各データポイントの平方和の平方根)が計算されるか、又は当該信号のヒルベルト変換が使用され得る。当該信号のフィルタリング又は変換が、特徴の計算の前にオプションとして考えられ得る。 An energy measure (e.g. the square root of the sum of the squares for each data point) can be calculated or the Hilbert transform of the signal can be used. Filtering or transformation of the signal can be considered as an option before feature computation.
上記例は、当該信号の異なる周波数コンテンツを持つ時間領域信号への分解、及び該分解された信号の1以上からの特徴の計算に基づいている。これらの特徴は、液体の蓄積又は液体の無蓄積を区別するために使用される。 The above example is based on decomposing the signal into time domain signals with different frequency content and computing features from one or more of the decomposed signals. These features are used to distinguish between liquid accumulation or no liquid accumulation.
該分解ステップは必ずしも必要ではない。一部の被検者については、信号を周波数帯域に分解しなくても、状態の違いを観察できる。しかしながら、当該方法は、通常、分解により一層ロバストになる。 The decomposition step is not necessary. For some subjects, differences in condition can be observed without decomposing the signal into frequency bands. However, the method is usually more robust with decomposition.
したがって、好ましい実施形態では、第2のIMFが選択され、その信号から特徴が計算される。より適応的なアプローチは、分解が必要かどうかを最初に判断し、もし必要なら、何の周波数帯域が使用されるべきかを決定することである。言い換えれば、信号特性に応じて、特徴が信号全体から、又は(1以上の)分解信号の選択されたセットから計算される適応処理方法を使用することができる。 Therefore, in a preferred embodiment, a second IMF is selected and features are calculated from that signal. A more adaptive approach would be to first determine whether decomposition is necessary and, if so, what frequency bands should be used. In other words, an adaptive processing method can be used in which, depending on the signal characteristics, features are calculated from the entire signal or from a selected set of (one or more) decomposed signals.
周波数領域及び時間領域の両方の方法に関し、特定の加速度計の軸を選択し、これらの軸のみに関して特徴を計算することが望ましいであろう。これら軸の1以上を使用して、当該信号のノイズを減らすことができる。例えば、被検者の動き及び/又は外部振動を1つの軸から導出し、頭部-つま先方向を捕捉する軸に沿った信号を修正するために使用できる。他のオプションは、低周波数信号エネルギに対する高周波数信号エネルギの比率が最も高いチャネルを選択することである。 For both frequency and time domain methods, it may be desirable to select specific accelerometer axes and calculate features only on those axes. One or more of these axes can be used to reduce noise in the signal. For example, subject movement and/or external vibrations can be derived from one axis and used to correct the signal along an axis that captures the head-toe direction. Another option is to select the channel with the highest ratio of high frequency to low frequency signal energy.
拍動する心臓に起因する振動は主に身体に平行な方向(即ち、頭部からつま先への方向)であるから、同じ方向の軸が変化を検出するには一層適している。したがって、好ましい実施形態では、身体と整列した軸が選択され、その信号から抽出されたエネルギ特徴が使用される。 Because the vibrations due to the beating heart are primarily parallel to the body (i.e., head-to-toe), an axis in the same direction is better suited to detect changes. Therefore, in the preferred embodiment, an axis aligned with the body is selected and energy features extracted from that signal are used.
しかしながら、場合によっては、全ての加速度計軸を使用する(即ち、それらを合計する)ことも可能である。
[実験結果]
However, in some cases it is possible to use all accelerometer axes (ie, sum them together).
[Experimental result]
このBCGベースのアプローチ(特に、加速度計及び圧力センサに基づいた)を使用して身体内の液体蓄積を測定できることを示すために実験が行われた。 Experiments were performed to demonstrate that this BCG-based approach (specifically based on accelerometers and pressure sensors) can be used to measure fluid accumulation in the body.
該実験では、身体内の液体蓄積を模擬するために水の摂取量が使用された。この場合、液体の蓄積は胃及び小腸内であることは自明であり、したがって、当該センサ装置は胃及び小腸の下、例えば下腰部及び股関節部の周りに配置される。被検者が静止したまま(直立又は横たわった状態で)で約5分の測定時間が用いられた。 In the experiment, water intake was used to simulate fluid accumulation in the body. In this case, the fluid accumulation is obviously in the stomach and small intestine, and therefore the sensor device is placed below the stomach and small intestine, for example around the lower back and hips. A measurement time of about 5 minutes was used with the subject remaining motionless (standing or lying down).
図6は、圧力マット60、ECG電極62、呼吸測定バンド64及び3軸加速度計 66を備えた実験設定構成を示している。当該ワークフローにおいては、ベースラインが測定され、次いで、水(異なる量の)の摂取及び続く測定が行われた。該測定は立った姿勢及び横たわった姿勢の両方で行われた。
Figure 6 shows the experimental setup with a
先ず、加速度計の使用に基づく結果について説明する。これらは、被検者が仰向けである一層臨床的に適用可能な状況を提供する。しかしながら、体重計測定値を使用しても同様の結果が得られ得る。 First, we describe results based on the use of accelerometers. These provide a more clinically applicable situation in which the subject is supine. However, similar results can be obtained using weight scale measurements.
身体に平行な方向の加速度信号が使用された。 Acceleration signals parallel to the body were used.
図7は、当該信号から計算された2つの異なる特徴を示している。各特徴は、2つのベースライン測定値BL1及びBL2並びに2つの液体蓄積状態FL1及びFL2について示されている。これらは、反復測定1及び2に対する、横たわった姿勢のみにおける同一の被検者に関する信号である。
Figure 7 shows two different features calculated from the signal. Each feature is shown for two baseline measurements BL1 and BL2 and two fluid accumulation states FL1 and FL2. These are the signals for the same subject in the lying position only, for
該信号から、2つの異なるエネルギ尺度特徴が計算される。 Two different energy measure features are calculated from the signal.
この例において、エネルギ(Energy)は、信号全体に対する、即ち、周波数分解無しでのエネルギ尺度である。 In this example, Energy is the energy measure for the entire signal, i.e., without frequency decomposition.
ヒルベルト(Hilbert)は、信号全体のヒルベルト変換の計算に基づいた、信号エネルギの尺度を表す。 Hilbert represents a measure of signal energy based on computing the Hilbert transform of the entire signal.
上記エネルギ尺度及びヒルベルト変換は、共に、ベースライン(BL)と対応する液体蓄積(FL)状態との間を適切に区別する。言い換えると、時間にわたり監視される信号の変動は、身体内の液体に依存して大きく変化する。 Both the energy measure and the Hilbert transform provide an adequate distinction between the baseline (BL) and the corresponding fluid load (FL) states. In other words, the variation of the signal monitored over time varies greatly depending on the fluid in the body.
少量(300ml)の蓄積された体液でさえも観察できる該大きな変化により、信号エネルギ又は信号強度の変化が監視され、液体蓄積(この例では胃及び小腸内の水であるが、内出血の検出の可能性を検証するために使用される)に関するアラートを生成するために使用される。 Due to the large changes that can be observed even with small amounts of accumulated fluid (300 ml), changes in signal energy or signal strength are monitored and used to generate an alert regarding fluid accumulation (in this example, water in the stomach and small intestine, which is used to verify the possible detection of internal bleeding).
図8は、生信号の短時間ベースの分析から計算される種々の特徴を使用した信号特性(特にエネルギ尺度)の変化を示している。 Figure 8 shows the evolution of signal characteristics (particularly energy measures) using various features calculated from short-time-based analysis of the raw signal.
上側のプロットは、5分間の合計測定時間における処理ウィンドウ(60秒)毎の平均エネルギ特徴を示している。真ん中のプロットは、4つのテスト条件(BL1、BL2、FL1、FL2)に関するエネルギ特徴の平均(ライン)及び標準偏差(エラーバー)を示し、下側のプロットは該4つのテスト条件に関するエネルギ特徴の箱ひげ図を示している。液体蓄積の結果としてのエネルギの減少が、これらの結果から明瞭に見られ、定量化できる。 The top plot shows the average energy signature per processing window (60 seconds) over a total measurement time of 5 minutes. The middle plot shows the mean (line) and standard deviation (error bars) of the energy signatures for the four test conditions (BL1, BL2, FL1, FL2), and the bottom plot shows a box plot of the energy signatures for the four test conditions. The reduction in energy as a result of liquid accumulation is clearly visible and quantifiable in these results.
予想通り、心臓を振動源として使用する場合、加速度計の位置が信号に影響を与える。 As expected, when using the heart as the vibration source, the position of the accelerometer affects the signal.
図9は、3つの異なる加速度センサの位置、即ち、acc-0(左肩)、acc-1(左太もも)及びacc-2(胃)に関するエネルギの変化を示している。一般的に、心臓とつま先との間の加速度計位置は、BCG信号の起点及び伝播に基づいて特に適切な位置である。この特定のケースでは、液体が胃の中であるため、心臓より下の位置が最良の結果をもたらす。もちろん、心臓より上の体液蓄積の場合、これは当てはまらない。 Figure 9 shows the energy change for three different acceleration sensor locations: acc-0 (left shoulder), acc-1 (left thigh) and acc-2 (stomach). In general, the accelerometer location between the heart and the toes is a particularly suitable location based on the origin and propagation of the BCG signal. In this particular case, the location below the heart gives the best results since the fluid is in the stomach. Of course, in the case of fluid accumulation above the heart, this is not the case.
左の列は或る被検者に関するものであり、右の列は他の被検体に関するものである。各被検者について、BL1及びBL2は反復されたベースライン測定値であり、FL1及びFL2は液体蓄積状態に関して反復された測定値である。これらは全て、横たわっている被検者に関するものである。 The left column is for one subject, the right column is for another. For each subject, BL1 and BL2 are repeated baseline measurements, and FL1 and FL2 are repeated measurements for the fluid accumulation state. All for subjects lying down.
図9は、測定が異なる時間に行われた故に、信号のロバストさを示している。加速度計の較正(即ち、ベクトル解析)及び位置決めが信号品質に影響を与えることに注意されたい。 Figure 9 shows the robustness of the signal since measurements were taken at different times. Note that the calibration (i.e., vector analysis) and positioning of the accelerometers will affect the signal quality.
被検者が立った姿勢である間に圧力センサを使用する場合の感度を測定する実験も行われた。同じ被検者に対して同時に実行された測定は、圧力センサ信号の信号特性が加速度計信号の信号特性に匹敵することを示している。したがって、同様の感度尺度が、圧力信号に対するのと同様に加速度計信号にも適用可能である。 Experiments were also carried out to measure the sensitivity when using the pressure sensor while the subject was in a standing position. Measurements performed simultaneously on the same subject show that the signal characteristics of the pressure sensor signal are comparable to those of the accelerometer signal. Therefore, similar sensitivity measures are applicable to the accelerometer signal as to the pressure signal.
図10は、体重計のロードセルにより得られる力測定に基づく信号解析の結果を示している。 Figure 10 shows the results of signal analysis based on force measurements obtained by the load cell of a weighing scale.
重量計内のロードセルセンサが、300mlの水により液体蓄積が増加された場合のBCG信号を測定するために使用された。BL1及びBL2は、被検者に対する2つの反復されたベースライン測定値を表す。FL1及びFL2は、300mlの水の最初の摂取後の被検者の反復測定である。FL3及びFL4は、2番目の300mlの水の摂取後の第2組の2つの反復測定である。FL5及びFL6は、3番目の300mlの水の摂取後の第3組の2つの反復測定である。図10からわかるように、重量(左上の画像)は水の摂取とともに増加し、IMF2のエネルギ(右上のプロット)は減少傾向を示している。 A load cell sensor in the weighing scale was used to measure the BCG signal when fluid accumulation was increased with 300 ml of water. BL1 and BL2 represent two repeated baseline measurements for the subject. FL1 and FL2 are the repeated measurements of the subject after the first ingestion of 300 ml of water. FL3 and FL4 are the second set of two repeated measurements after the second ingestion of 300 ml of water. FL5 and FL6 are the third set of two repeated measurements after the third ingestion of 300 ml of water. As can be seen in Figure 10, weight (top left image) increases with water ingestion, while IMF2 energy (top right plot) shows a decreasing trend.
左下のプロットはIMF2信号の周波数(x60、即ち1分あたりのサイクル数) を示し、右下のプロットは推定された心拍数を示している。 The bottom left plot shows the frequency of the IMF2 signal (x60, i.e., cycles per minute), and the bottom right plot shows the estimated heart rate.
2つの測定の結果は、IMF2信号のエネルギの同様の減少を示している。限られた量の繰り返しでも、300mlの体液蓄積はベースラインとは大きく異なる。 The results of the two measurements show a similar decrease in the energy of the IMF2 signal. Even with a limited amount of repetition, the accumulation of 300 ml of fluid is significantly different from the baseline.
このように、IMF2信号のエネルギは傾向線を作成するために使用でき、その場合、該傾向は内出血があるという警告を提供するために使用される。 In this way, the energy of the IMF2 signal can be used to create a trend line, which can then be used to provide a warning that there is internal bleeding.
図11の上側の画像は、実線として、図10に示された被検者に関するIMF2エネルギの傾向線を摂取量(ボリューム)の関数として示している。 The top image in Figure 11 shows, as a solid line, the trend line of IMF2 energy as a function of intake (volume) for the subject shown in Figure 10.
点線は他の被検者に関するデータを示している(基礎となるデータは示されていない)。ベースライン(ボリューム=0)に正規化すると、2つのデータソースは、図11の下側の画像(上側の画像の両方のプロットを示しているが、ベースライン補正により重なっている)に示されるように摂取量との良好な相関関係を示す。 The dotted line shows data for another subject (underlying data not shown). When normalized to baseline (volume = 0), the two data sources show good correlation with uptake as shown in the lower image of Figure 11 (which shows both plots from the upper image, but overlapped due to baseline correction).
該傾向線の勾配は、例えば該勾配が特定の閾値を超える(即ち、特定の負の閾値よりも小さい)場合、アラートのトリガとして使用できる。 The slope of the trend line can be used to trigger an alert, for example, if the slope exceeds a certain threshold (i.e., is less than a certain negative threshold).
閾値を超えるベースラインと測定条件との間の振幅差も、トリガとして使用できる。実際に、このことはベースライン測定値使用して正規化することで達成できる。x%(2.5%等)を超える偏差を、アラートをトリガするために使用できる。 An amplitude difference between the baseline and measurement conditions that exceeds a threshold can also be used as a trigger. In practice, this can be achieved by normalizing using the baseline measurement. A deviation of more than x% (e.g. 2.5%) can be used to trigger an alert.
適切なトリガは、検出方法に依存する。一般的な特徴ベースの検出の場合、変化のパターン又は傾向の分析を使用できる。 The appropriate trigger will depend on the detection method. For typical feature-based detection, analysis of patterns or trends of change can be used.
特定の特徴が身体内の液体蓄積と相関される特定の特徴ベースの方法については、閾値ベースの方法を使用することができる。言い換えると、この特徴が特定の値を示したら、アラートが生成され得る。 For certain feature-based methods, where a certain feature is correlated with fluid accumulation in the body, a threshold-based method can be used. In other words, if this feature exhibits a certain value, an alert can be generated.
機械学習アプローチ(深層学習も含む)が適用されるデータに基づくモデルの場合、分類器の出力における確率が観察され、アラートをトリガするか否かを決定するために使用される。 For models based on data where machine learning approaches (including deep learning) are applied, the probability at the output of the classifier is observed and used to decide whether to trigger an alert or not.
時系列ベースのアプローチの場合、信号特性の傾向を探すことが望ましいであろう。 For a time series based approach, it may be desirable to look for trends in the signal characteristics.
図12は、被検者における液体蓄積を検出するための方法を示しており、以下を有する:
- ステップ50において、被検者の心臓に対して身体領域の反対側の位置から得られる、該被検者の心臓の拍動によって誘起される力、運動又は圧力信号を取得するステップ;及び
- ステップ52において、時間にわたる前記信号の変化を分析し、これにより液体蓄積が生じたことを決定するステップ。
FIG. 12 shows a method for detecting fluid accumulation in a subject, comprising:
- in
上記特定の例の場合、ステップ52は次のステップに分解できる:
- ステップ53において特徴抽出を実行し、心弾動記録信号の関心特徴を分離するステップ;
- ステップ54において、複数の心周期の期間にわたる前記心弾動記録信号の関心特徴のパラメータを決定するステップ;及び
- ステップ56において、該決定されたパラメータの変化から液体蓄積が起こったことを決定するステップ。
For the particular example above, step 52 can be broken down into the following steps:
- performing feature extraction in
- in
次いで、ステップ58においてアラートが供給される。
An alert is then provided in
特定の周波数範囲を分析する場合に、このBCGベースのアプローチを使用して身体内の液体蓄積を一層良い結果で測定できることを示すために、更なる実験が実行された。BCGの前後関係において、人体の基本共振周波数は3~7Hzの範囲にあることが知られている。 Further experiments were carried out to show that this BCG-based approach can be used to measure fluid accumulation in the body with better results when analyzing specific frequency ranges. In the context of BCG, the fundamental resonant frequency of the human body is known to be in the range of 3-7 Hz.
当該設定構成は、BCG信号を取得するための異なるセンサの使用を目立たなく組み合わせた。これらは以下のものを含むものであった:
- 3つの電気的に絶縁された3軸加速度計;
- 正方形のプレートの4つの角部に配置された4つの歪ゲージタイプの圧力センサからなる特注の体重計であって、4つの測定値の合計によって参加者の瞬間的な総体重が得られる体重計;及び
- ベッド上に配置され、参加者の胴体に対応して位置される電気機械式フィルム(EMFi)センサマット(志願者の解剖学的構造に依存して、大凡、肩から腰まで延在する)。
The setup unobtrusively combined the use of different sensors to acquire the BCG signal. These included:
- 3 electrically isolated 3-axis accelerometers;
- a custom-made weight scale consisting of four strain gauge type pressure sensors placed on the four corners of a square plate, with the sum of the four measurements giving the participant's instantaneous total weight; and - an electromechanical film (EMFi) sensor mat placed on the bed and positioned corresponding to the participant's torso (extending approximately from the shoulders to the hips, depending on the volunteer's anatomy).
当該実験プロトコルは、わずかに異なるプロトコルを持つ2つの別個の検査ラウンドからなり、各参加者に対して、最大で7日間隔てられた異なる日に実行された。参加者は、検査前の2時間は飲食を控え、検査開始直前に膀胱を空にするように求められた。両検査ラウンドにおいて、プロトコルの最初の部分は同じであり、2つの異なる監視姿勢(即ち、センサを備えたベッドに横たわった姿勢及び体重計上に立った姿勢)でベースライン測定を繰り返し行うことから成るものであった。各記録の持続時間は3分であり、立った状態と横たわった状態の計測は合計で4つの計測の間で入れ換えられた。該検査の最初の部分が完了した後、参加者は最大10分の期間内で500mLの静水を飲むように求められた。 The experimental protocol consisted of two separate testing rounds with slightly different protocols, carried out on different days, separated by a maximum of 7 days, for each participant. Participants were asked to refrain from eating and drinking for 2 hours before the test and to empty their bladders immediately before the start of the test. In both testing rounds, the first part of the protocol was the same and consisted of repeated baseline measurements in two different monitoring positions (i.e., lying on a bed equipped with sensors and standing on a weighing scale). Each recording lasted 3 minutes, and the standing and lying measurements were alternated between for a total of four measurements. After completing the first part of the test, participants were asked to drink 500 mL of still water within a maximum period of 10 minutes.
検査ラウンド1の間において、加速度計1は下腹部の左側(臍の高さから約3cm下)に配置され;加速度計2は右大腿部の外側(膝頭の約2cm上)に配置され;加速度計3は右ふくらはぎの後ろ(足首から約2cm上)に配置された。検査ラウンド2の間において、加速度計1は前のラウンドと同じ場所に維持され;加速度計2は、胸上部の左側(鎖骨から約1cm下)に配置され;加速度計3は腰の右側(加速度計1とほぼ同じ高さ)に配置された。
During
該実験は、同じ信号に関して異なる特徴を分析することを含み、各特徴は、分析される周波数帯域又は信号の分析方法を変更することによって他の特徴とは異なるものであった。全ての特徴が、最初に、重なりのない10秒のスライディングウィンドウに対して計算された。調査された特徴の完全なリストは、異なる周波数帯域及び経験的モード分解ベースの特徴を含む。 The experiments involved analyzing different features on the same signal, each feature differing from the others by changing the frequency band analyzed or the method of analyzing the signal. All features were initially computed over non-overlapping 10 second sliding windows. The complete list of features investigated includes different frequency bands and empirical mode decomposition based features.
特徴1(F1):標準偏差が前処理なしで完全な信号から取得される。 Feature 1 (F1): The standard deviation is obtained from the full signal without any preprocessing.
特徴2(F2):呼吸帯域を除く。標準偏差を計算する前に、当該信号は0.6Hzにカットオフを持つ6次ハイパスバタワースフィルタでフィルタされる。これにより、BCG信号の呼吸成分がフィルタリングされる。 Feature 2 (F2): Remove respiratory band. Before calculating the standard deviation, the signal is filtered with a 6th order high-pass Butterworth filter with a cutoff at 0.6 Hz. This filters out the respiratory component of the BCG signal.
特徴3(F3):呼吸及び心拍数帯域を除く。この特徴は更に選択的であり、BCG信号の一層高い周波数に焦点を当てる。標準偏差が計算される前に、2Hzにカットオフを持つ6次ハイパスバタワースが当該信号をフィルタ処理するために使用される。 Feature 3 (F3): Exclude respiration and heart rate bands. This feature is more selective and focuses on the higher frequencies of the BCG signal. A 6th order high pass Butterworth with a cutoff at 2 Hz is used to filter the signal before the standard deviation is calculated.
特徴4(F4):「共振帯域」。この帯域は、身体の固有周波数に密に合致する、従って応答振動を強化する共振状態に入るBCG信号の周波数を含むと考えられる。この特徴のための通過帯域は、2.5Hz及び7.5Hzにカットオフを有すると定義されている。使用されるフィルタは、ここでも、6次バターワースである。 Feature 4 (F4): "Resonance Band". This band is believed to include frequencies of the BCG signal that closely match the body's natural frequency and thus enter into a resonant state that enhances the response vibration. The passband for this feature is defined to have cutoffs at 2.5 Hz and 7.5 Hz. The filter used is again a 6th order Butterworth.
特徴5(F5):経験的モード分解(EMD)でノイズ除去された標準偏差。 Feature 5 (F5): Standard deviation denoised using empirical mode decomposition (EMD).
特徴6~9(F6~F9):IMF2、3、4及び5の各々の標準偏差。これらの特徴はEMDに基づいており、標準偏差を選択的に計算する。
Features 6-9 (F6-F9): Standard deviations of
特徴10~18(F10~F18):中央絶対偏差(MAD)ベースの特徴セット。これらの9つの特徴は、特徴1から9と同じ前処理手順を含むが、標準偏差の代わりに MADを使用してエネルギを計算する。MADは、データの中央値からの絶対偏差の中央値として定義される。これは標準偏差に似た尺度であるが、標準偏差よりも外れ値に対してよりロバストである。 Features 10-18 (F10-F18): Median Absolute Deviation (MAD) based feature set. These nine features include the same preprocessing steps as features 1-9, but use MAD instead of standard deviation to calculate the energy. MAD is defined as the median of absolute deviations from the median of the data. It is a measure similar to standard deviation, but is more robust to outliers than standard deviation.
全ての特徴は、利用可能な12の信号(8つの加速度計チャネル、EMFi、及び各加速度計の軸の合計によって得られる追加の3つの信号)のそれぞれから計算された。 All features were calculated from each of the 12 available signals (8 accelerometer channels, EMFi, and 3 additional signals obtained by summing each accelerometer axis).
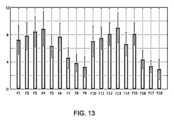
図13は、12の信号の平均から算出されたt検定(仮説検定の一種)による、ベースライン測定から摂取後測定までの各特徴に関する減少を示している。最も有望な特徴は、特徴4(即ち、共振ベースの特徴)及び対応するMADベースの特徴13のようである。
Figure 13 shows the reduction for each feature from baseline to post-ingestion measurements using t-tests (a type of hypothesis testing) calculated from the average of the 12 signals. The most promising features appear to be feature 4 (i.e., the resonance-based feature) and the corresponding MAD-based
したがって、当該システムの一構成例は、センサ装置からの信号を、例えば3Hzから7.5Hz、例えば2.5Hzから7.0Hz、例えば3Hzから7Hz等の、2Hzから7.5Hzの間に入る予め定義された人の共振周波数範囲のみを含むようにフィルタリングするステップ(13)を含むことができる。 Thus, one example configuration of the system may include a step (13) of filtering the signal from the sensor device to include only a predefined human resonant frequency range that falls between 2 Hz and 7.5 Hz, e.g., 3 Hz to 7.5 Hz, e.g., 2.5 Hz to 7.0 Hz, e.g., 3 Hz to 7 Hz, etc.
主な用途は内出血であるが、他の用途分野も予想される。それらの用途の1つは、出血とは関係のない液体の蓄積/再分配である。例えば、心不全患者の体液の蓄積、又は妊娠中の体液の再分布である。ここでも、立位での測定が可能である。立位での測定では、下限値が5Hz、上限値が11Hz、12Hz及び/又は13Hzの特徴帯域が好ましいであろう。これは横になった位置からのわずかなずれとなる。このずれは、身体の組織/臓器/区域の圧縮に基づいて変化する身体の機械的反応によるものである。身体は、圧縮時に線形ではない「バネ」と「ダンパ」によってリンクされた一連の要素として見ることができる。 The main application is internal bleeding, but other application areas are foreseen. One of those applications is fluid accumulation/redistribution unrelated to bleeding, e.g. fluid accumulation in patients with heart failure, or fluid redistribution during pregnancy. Here again, measurements in standing position are possible. For measurements in standing position, a characteristic band with a lower limit of 5 Hz and upper limits of 11 Hz, 12 Hz and/or 13 Hz would be preferred. This results in a small deviation from the lying position. This deviation is due to the mechanical response of the body, which changes based on compression of the body tissues/organs/areas. The body can be seen as a series of elements linked by "springs" and "dampers" that are not linear when compressed.
最適な帯域を決定するために、特徴4の開始周波数及び終了周波数の周辺で周波数スイープを実行し、最も優れた性能の周波数帯域を最終的な特徴として選択することができる。種々の体位及び参加者に適用可能なロバストな特徴を持たせるために、性能を低下させることなく、可能な限り広い周波数帯域を選択できる。
To determine the optimal band, a frequency sweep can be performed around the start and end frequencies of
人間のBCG及び集中質量機械モデルの組み合わせに基づいて、個人化された共振周波数を体重、体型(一部は男女差にも組み込まれる)及び体長に基づいて、計算できる。このモデルは、共振周波数に関する一般化された関係を、体質量及び体質量指標の関数として示す。性別及び年齢も上記モデルに組み込むことができる。 Based on a combination of the human BCG and a lumped mass mechanical model, a personalized resonant frequency can be calculated based on weight, body type (some of which also incorporates gender differences) and body length. This model shows a generalized relationship for resonant frequency as a function of body mass and body mass index. Gender and age can also be incorporated into the model.
姿勢に対する共振周波数の適応化も実行できる。(このような適応化は、代表的な実験データを収集して学習することにより、又は既存の(体位が異なる)モデルを使用し、これらモデルを実験データでシミュレーションし、該シミュレーション結果を分析することにより可能である。) Adaptation of the resonant frequency to posture can also be performed. (Such adaptation can be done by collecting and learning from representative experimental data, or by using existing models (for different body positions), simulating these models with experimental data, and analyzing the simulation results.)
異なる体位の人は僅かに異なる共振周波数を有することが知られている。精度及び検出感度を高めるために、加速度計を使用して被検者の姿勢(例えば、仰向け、立っている、座っている等)を推定し、その姿勢情報を使用して、個人化された共振帯域を決定することができる。このような適応化により、当該検出アルゴリズムを一層固有のものに、且つ、特定の条件に的を絞ったものにすることができ、このことは一層高い精度及び感度を可能にする。 It is known that people in different body positions have slightly different resonant frequencies. To increase accuracy and detection sensitivity, an accelerometer can be used to estimate the subject's posture (e.g., supine, standing, sitting, etc.) and the posture information can be used to determine a personalized resonant band. Such adaptation allows the detection algorithm to be more specific and targeted to specific conditions, which allows for greater accuracy and sensitivity.
上述したように、当該システムはプロセッサを利用してデータ処理を実行する。該プロセッサは、必要なさまざまな機能を実行するために、ソフトウェア及び/又はハードウェアにより種々の態様で実施化できる。該プロセッサは、通常、必要な機能を実行するためにソフトウェア(例えば、マイクロコード)を使用してプログラムできる1以上のマイクロプロセッサを使用する。該プロセッサは、いくつかの機能を実行する専用のハードウェア、並びに他の機能を実行する1以上のプログラムされたマイクロプロセッサ及び関連する回路の組み合わせとして実施化することができる。 As described above, the system utilizes a processor to perform data processing. The processor can be implemented in various ways using software and/or hardware to perform the various functions required. The processor typically uses one or more microprocessors that can be programmed using software (e.g., microcode) to perform the required functions. The processor can be implemented as a combination of dedicated hardware to perform some functions and one or more programmed microprocessors and associated circuitry to perform other functions.
本開示の様々な実施形態で使用できる回路の例には、従来のマイクロプロセッサ、特定用途向け集積回路(ASIC)、及びフィールドプログラマブルゲートアレイ(FPGA)が含まれるが、これらに限定されるものではない。 Examples of circuitry that may be used in various embodiments of the present disclosure include, but are not limited to, conventional microprocessors, application specific integrated circuits (ASICs), and field programmable gate arrays (FPGAs).
様々な実装において、当該プロセッサは、RAM、PROM、EPROM、及びEEPROM等の揮発性及び不揮発性コンピュータメモリ等の1以上の記憶媒体と関連され得る。該記憶媒体は、1以上のプロセッサ及び/又はコントローラ上で実行されたときに必要な機能を実行する1以上のプログラムで符号化することができる。さまざまな記憶媒体は、プロセッサ又はコントローラ内に固定されるか、又は格納されている1以上のプログラムをプロセッサにロードできるように移動可能であってもよい。 In various implementations, the processor may be associated with one or more storage media, such as volatile and non-volatile computer memory, such as RAM, PROM, EPROM, and EEPROM. The storage media may be encoded with one or more programs that, when executed on one or more processors and/or controllers, perform the necessary functions. The various storage media may be fixed within the processor or controller, or may be removable so that one or more programs stored therein may be loaded into the processor.
上記では時系列ベースの処理方法について説明したが、機械学習を使用できることも言及される。機械学習分類器は、液体の蓄積が検出されたか否かに関する確率スコアを継続的に生成する。深層学習ベースの方法も使用できる。 Although a time series based processing method is described above, it is also noted that machine learning can be used. A machine learning classifier continuously generates a probability score as to whether or not fluid accumulation has been detected. Deep learning based methods can also be used.
開示された実施形態の変形は、図面、開示、及び添付の請求項の精査から、請求項に記載の発明を実施する当業者によって理解され、実行され得る。請求項において、「有する」という言葉は他の要素及びステップを排除するものではなく、単数形は複数を排除するものではない。単一のプロセッサ又は他のユニットは、請求項に記載されているいくつかの項目の機能を果たすことができる。相互に異なる従属請求項に特定の手段が記載されているという事実は、これらの手段の組み合わせが有利に使用できないことを意味するものではない。コンピュータプログラムは、他のハードウェアと一緒に又はその一部として供給される光記憶媒体又はソリッドステート媒体等の適切な媒体で格納/配布することができるが、インターネット又はその他の有線若しくは無線通信システムを介して等のように、他の形態で配布することもできる。請求項における参照記号は、範囲を限定するものとして解釈されるべきではない。 Variations of the disclosed embodiments can be understood and effected by those skilled in the art in practicing the claimed invention, from an examination of the drawings, the disclosure and the appended claims. In the claims, the word "comprises" does not exclude other elements and steps, and the singular does not exclude a plurality. A single processor or other unit may fulfill the functions of several items recited in the claims. The fact that certain means are recited in mutually different dependent claims does not indicate that a combination of these means cannot be used to advantage. The computer program can be stored/distributed on a suitable medium, such as an optical storage medium or a solid-state medium, supplied together with or as part of other hardware, but can also be distributed in other forms, such as via the Internet or other wired or wireless communication systems. Reference signs in the claims should not be interpreted as limiting the scope.
Claims (15)
前記被検者の心臓の拍動によって誘起される力、動き又は圧力の信号を取得するためのセンサ装置であって、前記信号が前記身体領域の密度分布に依存して変化するように、前記力、動き又は圧力の信号が、前記心臓から前記センサ装置へ前記身体領域を通じて送信される、センサ装置と、
時間にわたり前記センサ装置の前記信号の変化を分析し、前記密度分布の変化を検出することに基づいて液体蓄積が生じたことを決定するプロセッサと
を有する、システム。 1. A system for detecting fluid accumulation in a body region of a subject, the system comprising:
a sensor device for acquiring a force, movement or pressure signal induced by the beating of the subject 's heart, the force, movement or pressure signal being transmitted from the heart through the body region to the sensor device such that the signal varies depending on a density distribution of the body region;
a processor that analyzes changes in the signal of the sensor device over time and determines that liquid accumulation has occurred based on detecting a change in the density distribution.
前記身体領域に対して前記被検者の心臓と反対側に配置されるためのものであり、
前記身体領域に対して前記被検者の心臓と反対側から感知するためのものであり、又は、
前記被検者に結合された物体の動きを、該物体の動きが前記心臓の拍動により誘起されるようにして感知するためものである、
請求項1に記載のシステム。 The sensor device comprises:
for placement on an opposite side of the subject's heart relative to the body region ;
or for sensing the body region from an opposite side to the subject's heart ;
for sensing movement of an object coupled to the subject, the movement of the object being induced by the beating of the heart.
The system of claim 1 .
頭部に装着するためのセンサ装置、
腰の周りに装着するためのセンサ装置、
背中に装着するためのセンサ装置、
脚若しくは足に装着するためのセンサ装置、
前記被検者が立つ、座る若しくは横たわるセンサ装置、及び/又は
非接触センサ
を有する、請求項1から3の何れか一項に記載のシステム。 The sensor device comprises:
A sensor device to be worn on the head;
A sensor device for being worn around the waist;
A sensor device to be worn on the back;
A sensor device for attachment to a leg or foot;
The system according to claim 1 , comprising a sensor device on which the subject stands, sits or lies, and/or a non-contact sensor.
特徴抽出を実行して、心弾動記録信号の関心特徴を分離し、
前記センサ装置の信号の関心特徴のパラメータを決定し、及び
前記決定されたパラメータの変化から、液体蓄積が生じたことを決定する、
請求項1から4の何れか一項に記載のシステム。 The processor,
performing feature extraction to isolate features of interest in the ballistocardiographic signal;
determining a parameter of a characteristic of interest in a signal of the sensor device; and determining from a change in the determined parameter that liquid accumulation has occurred.
A system according to any one of claims 1 to 4.
前記パラメータが抽出された前記関心特徴のエネルギ、強度、分散若しくは振幅の測定値を有する、
請求項5から7の何れか一項に記載のシステム。 the parameters comprise a Hilbert transform of the extracted features of interest and the processor comprises a Hilbert transform unit for performing the Hilbert transform; or the parameters comprise measures of energy, intensity, variance or amplitude of the extracted features of interest.
A system according to any one of claims 5 to 7.
前記パラメータが前記生のセンサ装置の信号のエネルギ、強度、分散若しくは振幅の測定値を有する、
請求項5又は請求項6に記載のシステム。 the parameters comprise a Hilbert transform of the raw sensor device signals and the system comprises a Hilbert transform unit for performing the Hilbert transform, or the parameters comprise measurements of energy, intensity, variance or amplitude of the raw sensor device signals.
A system according to claim 5 or claim 6.
前記被検者の身体の頭部-つま先方向に平行な方向のベクトル量若しくは一群のベクトル量の測定、
前記被検者の身体の頭部-つま先方向に垂直な方向のベクトル量若しくは一群のベクトル量の測定、又は
異なる方向の複数のベクトル量の組み合わせ
に基づくものである、請求項1から11の何れか一項に記載のシステム。 The signal of the sensor device
Measurement of a vector quantity or a group of vector quantities in a direction parallel to the head-to-toe direction of the subject's body;
The system of any one of claims 1 to 11, wherein the measurement is based on measuring a vector quantity or a set of vector quantities in a direction perpendicular to the head-to-toe direction of the subject's body, or a combination of a number of vector quantities in different directions.
センサ装置が、前記被検者の心臓の拍動によって誘起される力、動き又は圧力の信号を取得するステップであって、該信号が前記身体領域の密度分布に依存して変化するように、前記力、動き又は圧力の信号が、前記心臓から前記センサ装置へ前記身体領域を通じて送信される、ステップと、
プロセッサが、時間にわたり前記信号の変化を分析し、該密度分布の変化を検出することに基づいて液体蓄積が生じたことを決定するステップと
を有する、システムの作動方法。 1. A method of operating a system for detecting fluid accumulation in a body region of a subject, comprising :
acquiring, with a sensor device, a force, motion or pressure signal induced by the beating of the subject's heart , the force, motion or pressure signal being transmitted from the heart to the sensor device through the body region such that the signal varies depending on a density distribution of the body region;
a processor analyzing changes in the signal over time and determining that liquid accumulation has occurred based on detecting a change in the density distribution.
Applications Claiming Priority (5)
| Application Number | Priority Date | Filing Date | Title |
|---|---|---|---|
| EP18213291.0 | 2018-12-18 | ||
| EP18213291.0A EP3669757A1 (en) | 2018-12-18 | 2018-12-18 | System and method for detecting fluid accumulation |
| EP19193969 | 2019-08-28 | ||
| EP19193969.3 | 2019-08-28 | ||
| PCT/EP2019/084722 WO2020126764A1 (en) | 2018-12-18 | 2019-12-11 | System and method for detecting fluid accumulation |
Publications (2)
| Publication Number | Publication Date |
|---|---|
| JP2022514260A JP2022514260A (en) | 2022-02-10 |
| JP7500568B2 true JP7500568B2 (en) | 2024-06-17 |
Family
ID=69159713
Family Applications (1)
| Application Number | Title | Priority Date | Filing Date |
|---|---|---|---|
| JP2021534235A Active JP7500568B2 (en) | 2018-12-18 | 2019-12-11 | Systems and methods for detecting liquid accumulation - Patents.com |
Country Status (5)
| Country | Link |
|---|---|
| US (1) | US20220054025A1 (en) |
| EP (1) | EP3897355B1 (en) |
| JP (1) | JP7500568B2 (en) |
| CN (1) | CN113423325B (en) |
| WO (1) | WO2020126764A1 (en) |
Families Citing this family (6)
| Publication number | Priority date | Publication date | Assignee | Title |
|---|---|---|---|---|
| US20220269958A1 (en) * | 2021-02-19 | 2022-08-25 | Samsung Electronics Co., Ltd. | Device-invariant, frequency-domain signal processing with machine learning |
| WO2022183082A1 (en) * | 2021-02-26 | 2022-09-01 | Vanderbilt University | Systems and methods for pulmonary perfusion analysis using dynamic radiography |
| EP4070725A1 (en) * | 2021-04-07 | 2022-10-12 | Koninklijke Philips N.V. | Predicting ballistic forces on a subject |
| CN113712526B (en) * | 2021-09-30 | 2022-12-30 | 四川大学 | Pulse wave extraction method and device, electronic equipment and storage medium |
| EP4254425A1 (en) | 2022-03-29 | 2023-10-04 | Heartkinetics | Method, system and computer program for detecting a heart health state |
| CN116269274B (en) * | 2023-05-24 | 2023-07-25 | 中国科学院苏州生物医学工程技术研究所 | Blood pressure monitoring intelligent patch, dynamic blood pressure monitoring method, device and storage medium |
Citations (6)
| Publication number | Priority date | Publication date | Assignee | Title |
|---|---|---|---|---|
| JP2009532072A (en) | 2005-11-01 | 2009-09-10 | アーリーセンス エルティディ | Clinical seizure patient monitoring method and system |
| US20110319724A1 (en) | 2006-10-30 | 2011-12-29 | Cox Paul G | Methods and systems for non-invasive, internal hemorrhage detection |
| JP2014507213A (en) | 2011-01-27 | 2014-03-27 | ザ ボード オブ トラスティーズ オブ ザ レランド スタンフォード ジュニア ユニバーシティー | System and method for observing the circulatory system |
| US20140371635A1 (en) | 2010-12-07 | 2014-12-18 | Earlysense Ltd. | Monitoring a sleeping subject |
| WO2017140663A1 (en) | 2016-02-15 | 2017-08-24 | Koninklijke Philips N.V. | Device and method for extracting heart rate information |
| US20180064392A1 (en) | 2016-09-07 | 2018-03-08 | Empire Technology Development Llc | Detection of foot edema through in-shoe pressure sensors |
Family Cites Families (16)
| Publication number | Priority date | Publication date | Assignee | Title |
|---|---|---|---|---|
| US4838275A (en) * | 1985-11-29 | 1989-06-13 | Lee Arnold St J | Home medical surveillance system |
| US4899758A (en) * | 1986-01-31 | 1990-02-13 | Regents Of The University Of Minnesota | Method and apparatus for monitoring and diagnosing hypertension and congestive heart failure |
| US20140296677A1 (en) * | 2003-09-18 | 2014-10-02 | New Paradigm Concepts, LLC | Method of measuring total vascular hemoglobin mass |
| US8870780B2 (en) * | 2008-10-15 | 2014-10-28 | The Board Of Trustees Of The Leland Stanford Junior University | Systems and methods for monitoring heart function |
| US11395634B2 (en) * | 2008-10-29 | 2022-07-26 | Flashback Technologies, Inc. | Estimating physiological states based on changes in CRI |
| US20130109989A1 (en) * | 2009-06-17 | 2013-05-02 | Heart Force Medical Inc. | Method and apparatus for obtaining and processing ballistocardiograph data |
| CA2804788C (en) * | 2010-07-08 | 2020-08-25 | Intelomed, Inc. | System and method for characterizing circulatory blood flow |
| WO2013109188A1 (en) * | 2012-01-16 | 2013-07-25 | Agency For Science, Technology And Research | Method and system for optical blood pressure monitoring |
| US8880155B2 (en) * | 2012-02-24 | 2014-11-04 | Covidien Lp | Hypovolemia diagnosis technique |
| US20160007935A1 (en) * | 2014-03-19 | 2016-01-14 | Massachusetts Institute Of Technology | Methods and apparatus for measuring physiological parameters |
| US10456046B2 (en) * | 2014-09-12 | 2019-10-29 | Vanderbilt University | Device and method for hemorrhage detection and guided resuscitation and applications of same |
| US20160223514A1 (en) * | 2015-01-30 | 2016-08-04 | Samsung Electronics Co., Ltd | Method for denoising and data fusion of biophysiological rate features into a single rate estimate |
| US20180296163A1 (en) * | 2015-07-27 | 2018-10-18 | Google Inc. | Altering Physiological Signals Based On Patient Movement |
| EP3135194A1 (en) * | 2015-08-28 | 2017-03-01 | Universite Libre De Bruxelles | Improvements in or relating to heart monitoring |
| KR101971208B1 (en) * | 2017-01-31 | 2019-04-22 | (주)감성과학연구센터 | Apparatus for monitoring of seismocardiography(scg) using accelerometer sensor and gyroscope sensor and method thereof |
| CN207477498U (en) * | 2017-04-10 | 2018-06-12 | 桂林电子科技大学 | Sitting posture detection device for vital signs and system |
-
2019
- 2019-12-11 JP JP2021534235A patent/JP7500568B2/en active Active
- 2019-12-11 EP EP19835215.5A patent/EP3897355B1/en active Active
- 2019-12-11 CN CN201980092282.3A patent/CN113423325B/en active Active
- 2019-12-11 US US17/416,190 patent/US20220054025A1/en not_active Abandoned
- 2019-12-11 WO PCT/EP2019/084722 patent/WO2020126764A1/en not_active Ceased
Patent Citations (6)
| Publication number | Priority date | Publication date | Assignee | Title |
|---|---|---|---|---|
| JP2009532072A (en) | 2005-11-01 | 2009-09-10 | アーリーセンス エルティディ | Clinical seizure patient monitoring method and system |
| US20110319724A1 (en) | 2006-10-30 | 2011-12-29 | Cox Paul G | Methods and systems for non-invasive, internal hemorrhage detection |
| US20140371635A1 (en) | 2010-12-07 | 2014-12-18 | Earlysense Ltd. | Monitoring a sleeping subject |
| JP2014507213A (en) | 2011-01-27 | 2014-03-27 | ザ ボード オブ トラスティーズ オブ ザ レランド スタンフォード ジュニア ユニバーシティー | System and method for observing the circulatory system |
| WO2017140663A1 (en) | 2016-02-15 | 2017-08-24 | Koninklijke Philips N.V. | Device and method for extracting heart rate information |
| US20180064392A1 (en) | 2016-09-07 | 2018-03-08 | Empire Technology Development Llc | Detection of foot edema through in-shoe pressure sensors |
Also Published As
| Publication number | Publication date |
|---|---|
| EP3897355A1 (en) | 2021-10-27 |
| EP3897355B1 (en) | 2024-09-25 |
| US20220054025A1 (en) | 2022-02-24 |
| WO2020126764A1 (en) | 2020-06-25 |
| JP2022514260A (en) | 2022-02-10 |
| CN113423325B (en) | 2024-09-10 |
| CN113423325A (en) | 2021-09-21 |
Similar Documents
| Publication | Publication Date | Title |
|---|---|---|
| JP7500568B2 (en) | Systems and methods for detecting liquid accumulation - Patents.com | |
| US20230082362A1 (en) | Processes and methods to predict blood pressure | |
| Tavakolian et al. | Precordial vibrations provide noninvasive detection of early-stage hemorrhage | |
| US12324683B2 (en) | Method and system for engineering cycle variability-related features from biophysical signals for use in characterizing physiological systems | |
| US10092268B2 (en) | Method and apparatus to monitor physiologic and biometric parameters using a non-invasive set of transducers | |
| JP6097495B2 (en) | Biological condition analyzer and computer program | |
| WO2005069740A2 (en) | Method and system for cardiovascular system diagnosis | |
| Cimr et al. | Automatic detection of breathing disorder from ballistocardiography signals | |
| US20230072281A1 (en) | Methods and Systems for Engineering Wavelet-Based Features From Biophysical Signals for Use in Characterizing Physiological Systems | |
| US20210068683A1 (en) | Cardiovascular state monitoring - drug delivery apparatus and method of use thereof | |
| JP7607337B2 (en) | Health monitoring device, computer program and recording medium | |
| Ullal et al. | Non-invasive monitoring of vital signs for older adults using recliner chairs | |
| EP4255289B1 (en) | Monitoring shivering and sweating episodes | |
| WO2020168260A1 (en) | Method of predicting fluid responsiveness in patients | |
| EP3669757A1 (en) | System and method for detecting fluid accumulation | |
| Gardner et al. | Estimation of heart rate during sleep measured from a gyroscope embedded in a CPAP mask | |
| Enayati et al. | Machine Learning Approach for motion artifact detection in Ballistocardiogram signals | |
| US20210146115A1 (en) | Cardiac output controlled electroactive polymer sleeve heart assist apparatus and method of use thereof | |
| Heise et al. | Unobtrusively detecting apnea and hypopnea events via a hydraulic bed sensor | |
| Pinnelli et al. | A Wearable Platform as a First Step towards Enabling Collective Intelligence in Alzheimer's Disease Management: Feasibility Assessment on Healthy Volunteers | |
| US11412942B2 (en) | Apparatus, system and method for obtaining hemodynamic data of an individual | |
| Alam et al. | Inferring respiratory minute volume from wrist motion | |
| Boiko et al. | Accelerometer based system for unobtrusive sleep apnea detection | |
| Bekele | Neonatal Respiratory Rate Monitoring Using a Pressure-Sensitive Mat | |
| Shivaanivarsha et al. | A Smart IoMT-Based Health Assisting Tool for Predicting Deep Vein Thrombosis |
Legal Events
| Date | Code | Title | Description |
|---|---|---|---|
| A621 | Written request for application examination |
Free format text: JAPANESE INTERMEDIATE CODE: A621 Effective date: 20221208 |
|
| A977 | Report on retrieval |
Free format text: JAPANESE INTERMEDIATE CODE: A971007 Effective date: 20230831 |
|
| A131 | Notification of reasons for refusal |
Free format text: JAPANESE INTERMEDIATE CODE: A131 Effective date: 20231002 |
|
| A601 | Written request for extension of time |
Free format text: JAPANESE INTERMEDIATE CODE: A601 Effective date: 20231219 |
|
| A521 | Request for written amendment filed |
Free format text: JAPANESE INTERMEDIATE CODE: A523 Effective date: 20240304 |
|
| TRDD | Decision of grant or rejection written | ||
| A01 | Written decision to grant a patent or to grant a registration (utility model) |
Free format text: JAPANESE INTERMEDIATE CODE: A01 Effective date: 20240507 |
|
| A61 | First payment of annual fees (during grant procedure) |
Free format text: JAPANESE INTERMEDIATE CODE: A61 Effective date: 20240605 |
|
| R150 | Certificate of patent or registration of utility model |
Ref document number: 7500568 Country of ref document: JP Free format text: JAPANESE INTERMEDIATE CODE: R150 |