JP7626657B2 - Anomaly detection device, anomaly detection method, and anomaly detection program - Google Patents
Anomaly detection device, anomaly detection method, and anomaly detection program Download PDFInfo
- Publication number
- JP7626657B2 JP7626657B2 JP2021071101A JP2021071101A JP7626657B2 JP 7626657 B2 JP7626657 B2 JP 7626657B2 JP 2021071101 A JP2021071101 A JP 2021071101A JP 2021071101 A JP2021071101 A JP 2021071101A JP 7626657 B2 JP7626657 B2 JP 7626657B2
- Authority
- JP
- Japan
- Prior art keywords
- detection device
- data
- error
- time
- anomaly detection
- Prior art date
- Legal status (The legal status is an assumption and is not a legal conclusion. Google has not performed a legal analysis and makes no representation as to the accuracy of the status listed.)
- Active
Links
Images




Classifications
-
- G—PHYSICS
- G06—COMPUTING OR CALCULATING; COUNTING
- G06F—ELECTRIC DIGITAL DATA PROCESSING
- G06F11/00—Error detection; Error correction; Monitoring
- G06F11/07—Responding to the occurrence of a fault, e.g. fault tolerance
- G06F11/0703—Error or fault processing not based on redundancy, i.e. by taking additional measures to deal with the error or fault not making use of redundancy in operation, in hardware, or in data representation
- G06F11/0751—Error or fault detection not based on redundancy
-
- G—PHYSICS
- G06—COMPUTING OR CALCULATING; COUNTING
- G06F—ELECTRIC DIGITAL DATA PROCESSING
- G06F11/00—Error detection; Error correction; Monitoring
- G06F11/07—Responding to the occurrence of a fault, e.g. fault tolerance
- G06F11/0703—Error or fault processing not based on redundancy, i.e. by taking additional measures to deal with the error or fault not making use of redundancy in operation, in hardware, or in data representation
- G06F11/0706—Error or fault processing not based on redundancy, i.e. by taking additional measures to deal with the error or fault not making use of redundancy in operation, in hardware, or in data representation the processing taking place on a specific hardware platform or in a specific software environment
- G06F11/0709—Error or fault processing not based on redundancy, i.e. by taking additional measures to deal with the error or fault not making use of redundancy in operation, in hardware, or in data representation the processing taking place on a specific hardware platform or in a specific software environment in a distributed system consisting of a plurality of standalone computer nodes, e.g. clusters, client-server systems
-
- G—PHYSICS
- G06—COMPUTING OR CALCULATING; COUNTING
- G06F—ELECTRIC DIGITAL DATA PROCESSING
- G06F11/00—Error detection; Error correction; Monitoring
- G06F11/07—Responding to the occurrence of a fault, e.g. fault tolerance
- G06F11/0703—Error or fault processing not based on redundancy, i.e. by taking additional measures to deal with the error or fault not making use of redundancy in operation, in hardware, or in data representation
- G06F11/0706—Error or fault processing not based on redundancy, i.e. by taking additional measures to deal with the error or fault not making use of redundancy in operation, in hardware, or in data representation the processing taking place on a specific hardware platform or in a specific software environment
- G06F11/0721—Error or fault processing not based on redundancy, i.e. by taking additional measures to deal with the error or fault not making use of redundancy in operation, in hardware, or in data representation the processing taking place on a specific hardware platform or in a specific software environment within a central processing unit [CPU]
Landscapes
- Engineering & Computer Science (AREA)
- Theoretical Computer Science (AREA)
- General Engineering & Computer Science (AREA)
- Quality & Reliability (AREA)
- Physics & Mathematics (AREA)
- General Physics & Mathematics (AREA)
- Computer Hardware Design (AREA)
- Debugging And Monitoring (AREA)
Description
本発明は、異常を検出する異常検出装置、異常検出方法、および異常検出プログラムに関する。 The present invention relates to an anomaly detection device, an anomaly detection method, and an anomaly detection program for detecting anomalies.
IT(Information Technology)システムにおける異常検出は、適切な行動計画が設計され、かつ、ITシステムの円滑かつ効率的な操作を実行されるように、ITシステムの通常とは異なる振る舞いを特定するために利用される。 Anomaly detection in IT (Information Technology) systems is used to identify unusual behavior of IT systems so that appropriate action plans can be designed and implemented for smooth and efficient operation of the IT systems.
しかし、ディスクやRAMの容量の追加や削除による構成変更、大量のログファイルの予定外の削除、または、大量のログファイルのバックアップストレージへの転送のようなイベントの直後では、異常検出ができなくなる。これらのイベントが、急激な概念ドリフトを引き起こすからである。これらのイベントは、コンテナベースのマイクロサービスアーキテクチャの採用により、より頻繁に発生すると予想される。そのため、これらのイベントの直後に異常検出を可能にすることが重要である。 However, anomaly detection is not possible immediately after events such as configuration changes due to adding or removing disk or RAM capacity, unplanned deletion of a large number of log files, or transfer of a large number of log files to backup storage. This is because these events cause rapid concept drift. These events are expected to occur more frequently with the adoption of container-based microservices architectures. Therefore, it is important to enable anomaly detection immediately after these events.
特許文献1は、予測分析のためのドリフト検出および補正のための装置、システム、方法、およびコンピュータプログラム製品を開示する。この装置では、予測モジュールは、モデルをワークロードデータに適用して、1つまたは複数の予測結果を生成する。ワークロードデータには、1つ以上のレコードが含まれる。モデルは、トレーニングデータに基づいて1つまたは複数の学習された関数を含む。ドリフト検出モジュールは、1つまたは複数の予測結果に関連するドリフト現象を検出する。予測時間修正モジュールは、ドリフト現象に応答して、少なくとも1つの予測結果を修正する。
しかしながら、上述した特許文献1では、ドリフト現象が検出された場合、予測時間修正モジュールは、ドリフト現象に応答して、少なくとも1つの予測結果を修正するが、検出後の実測データをトレーニングデータとして用いて関数の再学習が必要となる。したがって、上述したイベント発生から再学習の完了までに時間がかかり、その間、異常検出ができなかったり、再学習前の状態で異常検出をしなければならないため誤検出が発生したりする。
However, in the above-mentioned
本発明は、イベント発生後における異常検出の即時性の向上を図ることを目的とする。 The present invention aims to improve the immediacy of anomaly detection after an event occurs.
本願において開示される発明の一側面となる異常検出装置は、プログラムを実行するプロセッサと、前記プログラムを記憶する記憶デバイスと、を有する異常検出装置であって、前記プロセッサは、監視対象の時系列な第1予測データのうち特定イベントの発生時点後における第2予測データを、スケール変換により補正する補正処理と、前記補正処理による補正後の第2予測データと、前記監視対象の時系列な第1実測データのうち前記特定イベントの発生時点後における第2実測データと、に基づいて、前記監視対象の異常を検出する検出処理と、を実行することを特徴とする。 The anomaly detection device according to one aspect of the invention disclosed in this application is an anomaly detection device having a processor that executes a program and a storage device that stores the program, and is characterized in that the processor executes a correction process that corrects, by scale conversion, second predicted data after the occurrence of a specific event from among the first predicted data in time series of the monitored object, and a detection process that detects an anomaly in the monitored object based on the second predicted data corrected by the correction process and the second actual measured data after the occurrence of the specific event from among the first actual measured data in time series of the monitored object.
本発明の代表的な実施の形態によれば、イベント発生後における異常検出の即時性の向上を図ることができる。前述した以外の課題、構成及び効果は、以下の実施例の説明により明らかにされる。 According to a representative embodiment of the present invention, it is possible to improve the immediacy of anomaly detection after an event occurs. Problems, configurations, and effects other than those described above will become clear from the explanation of the following examples.
<異常検出例>
図1は、異常検出装置による異常検出例を示す説明図である。監視対象は、たとえば、ITインフラストラクチャのディスク使用率である。図1の(A)~(C)に示すグラフにおいて、横軸は時間軸であり、縦軸はディスク使用率を示す。本実施例では、ディスク使用率を例に挙げて説明するが、RAM使用率でもよい。訓練データは、時系列モデルの作成に用いられる時刻t1までの時系列な実測値である。予測データは、時系列モデルから出力される時刻t1~t3までの時系列な予測値である。テストデータは、予測データと比較される時刻t1~t3までの時系列な実測値(正解データ)である。
<Example of abnormality detection>
FIG. 1 is an explanatory diagram showing an example of anomaly detection by an anomaly detection device. The object to be monitored is, for example, disk usage of an IT infrastructure. In the graphs shown in (A) to (C) of FIG. 1, the horizontal axis is the time axis, and the vertical axis is disk usage. In this embodiment, disk usage is taken as an example for explanation, but RAM usage may also be used. The training data is a time-series actual measurement value up to time t1 used to create a time-series model. The prediction data is a time-series predicted value from time t1 to t3 output from the time-series model. The test data is a time-series actual measurement value (correct answer data) from time t1 to t3 to be compared with the prediction data.
時刻t1から時刻t2までは予測データとテストデータとの差は許容範囲内であり、時系列モデルによる予測が正しいことを示している。 From time t1 to time t2, the difference between the predicted data and the test data is within the acceptable range, indicating that the predictions made by the time series model are correct.
(1)時刻t2で、イベントが検出されたとする。ここで、イベントとは、ディスクやRAMの容量の追加や削除による構成変更、大量のログファイルの予定外の削除、または、大量のログファイルのバックアップストレージへの転送のように突発的にディスク使用率が変更される挙動である。 (1) Assume that an event is detected at time t2. Here, an event is a behavior that causes a sudden change in disk usage, such as a configuration change due to the addition or deletion of disk or RAM capacity, the unplanned deletion of a large number of log files, or the transfer of a large number of log files to backup storage.
このようなイベントの後は、ディスク使用率は通常の挙動を繰り返すが、時刻t2を境にディスク使用率が急激に変化しているため、時刻t2以降、テストデータと予測データとの間に差Gが生じる。このようなイベント前後のディスク使用率の挙動を概念ドリフトという。異常検出装置は、ディスク使用率の挙動が正常であるにもかかわらず、異常検出したり、ディスク使用率の挙動が異常であるにもかかわらず、異常検出しなかったりすることになる。 After such an event, the disk usage rate will repeat normal behavior, but because the disk usage rate changes abruptly from time t2 onwards, a difference G occurs between the test data and the predicted data from time t2 onwards. The behavior of the disk usage rate before and after such an event is called conceptual drift. The anomaly detection device may detect an anomaly even though the disk usage rate behavior is normal, or may not detect an anomaly even though the disk usage rate behavior is abnormal.
(2)このため、異常検出装置は、時刻t2以降の予測データを線形変換する。(B)では、異常検出装置は、時刻t2以降の予測データをシフトし、(C)では、時刻t2以降の予測データをk倍にスケール(拡縮)する。異常検出装置は、(B)のシフト結果後の予測データとテストデータとの差(シフト誤差)と、(C)のスケール結果後の予測データとテストデータとの差(スケール誤差)と、を比較し、誤差が小さい方を選択する。図1では、シフト誤差が5%、スケール誤差が10%であるため、シフト変換が採用される。このように、イベントが検出された時刻t2の直後でも線形変換結果を用いることで、時刻t2以降も異常検出が可能になる。 (2) For this reason, the anomaly detection device linearly transforms the predicted data from time t2 onwards. In (B), the anomaly detection device shifts the predicted data from time t2 onwards, and in (C), scales (expands) the predicted data from time t2 onwards by a factor of k. The anomaly detection device compares the difference (shift error) between the predicted data and test data after the shift result in (B) with the difference (scale error) between the predicted data and test data after the scale result in (C), and selects the one with the smaller error. In FIG. 1, the shift error is 5% and the scale error is 10%, so shift transformation is adopted. In this way, by using the linear transformation result even immediately after time t2 when an event is detected, anomalies can be detected even after time t2.
<システム構成例>
図2は、異常検出システムのシステム構成例を示す説明図である。異常検出システム200は、ITインフラストラクチャ201と、異常検出装置202と、を有する。ITインフラストラクチャ201および異常検出装置202は、インターネット、LAN(Local Area Network)、WAN(Wide Area Network)などのネットワーク203を介して通信可能に接続される。
<System configuration example>
2 is an explanatory diagram showing an example of the system configuration of an
<異常検出装置のハードウェア構成例>
図3は、異常検出装置のハードウェア構成例を示すブロック図である。異常検出装置202は、プロセッサ301と、記憶デバイス302と、入力デバイス303と、出力デバイス304と、通信インターフェース(通信IF)305と、を有する。プロセッサ301、記憶デバイス302、入力デバイス303、出力デバイス304、および通信IF305は、バス306により接続される。プロセッサ301は、異常検出装置202を制御する。記憶デバイス302は、プロセッサ301の作業エリアとなる。また、記憶デバイス302は、各種プログラムやデータを記憶する非一時的なまたは一時的な記録媒体である。記憶デバイス302としては、たとえば、ROM(Read Only Memory)、RAM(Random Access Memory)、HDD(Hard Disk Drive)、フラッシュメモリがある。入力デバイス303は、データを入力する。入力デバイス303としては、たとえば、キーボード、マウス、タッチパネル、テンキー、スキャナ、マイクがある。出力デバイス304は、データを出力する。出力デバイス304としては、たとえば、ディスプレイ、プリンタ、スピーカがある。通信IF305は、ネットワーク203と接続し、データを送受信する。
<Example of hardware configuration of an abnormality detection device>
3 is a block diagram showing an example of a hardware configuration of the abnormality detection device. The
ここで、記憶デバイス302に記憶されているデータを具体的に説明する。記憶デバイス302は、ディスク使用率テーブル321と、予測結果テーブル322と、補正後予測結果テーブル323と、異常検出プログラム324と、を有する。ディスク使用率テーブル321は、ディスク使用率を時系列に記憶したテーブルであり、図4で後述する。予測結果テーブル322は、予測結果を時系列に記憶したテーブルであり、図5で後述する。補正後予測結果テーブル323は、補正後の予測結果を時系列に記憶したテーブルであり、図6で後述する。
Here, the data stored in the
異常検出プログラム324は、プロセッサ301に、ITインフラストラクチャ201で発生した異常を検出させるプログラムであり、異常検出モジュール340、収集モジュール341、概念ドリフト候補点決定モジュール342および予測結果補正モジュール343というプログラムモジュールを含む。異常検出モジュール340は、テストデータと予測データとを比較することにより、ディスク使用率の異常を検出するプログラムモジュールである。収集モジュール341は、ITインフラストラクチャ201からメトリクスデータを収集するプログラムモジュールであり、図7で後述する。概念ドリフト候補点決定モジュール342は、概念ドリフト候補点を決定するプログラムモジュールであり、図8~図11で後述する。概念ドリフト候補点とは、概念ドリフトを引き起こすようなイベントの検出時刻の候補である。予測結果補正モジュール343は、予測結果テーブル322に記憶された予測結果を補正するモジュールであり、図12および図13で後述する。
The
<テーブル>
図4~図6を用いて、記憶デバイス302に記憶されたディスク使用率テーブル321、予測結果テーブル322および補正後予測結果テーブル323について説明する。
<Table>
The disk usage rate table 321, the prediction result table 322, and the corrected prediction result table 323 stored in the
図4は、ディスク使用率テーブル321の一例を示す説明図である。ディスク使用率テーブル321は、フィールドとして、タイムスタンプ401と、ディスク使用率402と、を有する。タイムスタンプ401は、ITインフラストラクチャ201がディスク使用率402を計測した日付時刻である。ディスク使用率402は、ITインフラストラクチャ201の全ディスク容量のうち使用中のディスクの容量の割合である。
Figure 4 is an explanatory diagram showing an example of the disk usage table 321. The disk usage table 321 has fields of a
図4において、タイムスタンプ401は、たとえば、15分刻みで記憶される。ディスク使用率402は、エントリ325X5まで増加傾向にあり、15分ごとに5%増加している。エントリ321X6において、ディスク使用率402が50%になると予想されたが、ディスク使用率402が突然25%に下がっている。ディスク使用率402が予想(50%)の半分にまで突発的に下落した理由は、ITインフラストラクチャ201のディスク容量が、エントリ321X5のタイムスタンプ401である「2021-01-01 01:00:00」後に、10GBから20GBに2倍にまで増加したからである。
In FIG. 4, timestamps 401 are stored in, for example, 15-minute increments.
また、エントリ321X7のタイムスタンプ401である「2021-01-01 01:30:00」のときに、ディスク使用率402が突然上昇した。エントリ321X7では、ディスク使用率402が27.5%になると予想されたが、実測値は50%である。このエントリ321X7で異常が発生したことがわかる。すなわち、エントリ321X7のディスク使用率402は異常値である。異常検出装置202は、エントリ321X7のタイムスタンプ401で異常が発生したことを検出することになる。
Furthermore, at "2021-01-01 01:30:00", which is the
図5は、予測結果テーブル322の一例を示す説明図である。予測結果テーブル322は、フィールドとして、タイムスタンプ401と、予測ディスク使用率502と、下側シリーズ503と、上側シリーズ504と、を有する。予測ディスク使用率502は、時系列モデルに目的変数としてタイムスタンプ401が入力された場合に出力されるディスク使用率402の予測値である。タイムスタンプ401のほか、曜日、休日、祝祭日といったパラメータが時系列モデルに入力されてもよい。
Figure 5 is an explanatory diagram showing an example of the prediction result table 322. The prediction result table 322 has the following fields:
下側シリーズ503と上側シリーズ504との間隔を、予測間隔という。予測間隔は、たとえば、95%信頼区間である。下側シリーズ503の値および上側シリーズ504の値は、たとえば、そのエントリの予測ディスク使用率502の-3σおよび+3σの値として算出される(σは標準偏差)。下側シリーズ503より小さい値および上側シリーズ504より大きい値は棄却域に含まれる。
The interval between the
また、予測間隔はパーセンタイルで規定されてもよい。この場合、下側シリーズ503は、たとえば、10パーセンタイルであり、上側シリーズ504は、90パーセンタイルである。すなわち、1~9番目に小さい予測ディスク使用率502およびから91番目以降の予測ディスク使用率502が棄却域に含まれる。
The prediction interval may also be specified in percentiles. In this case, the
下側シリーズ503および上側シリーズ504は、異常検出に用いられる。ディスク使用率402が、下側シリーズ503より低く、または、上側シリーズ504より高ければ、そのディスク使用率402は異常値として検出される。換言すれば、ディスク使用率402は、予測間隔に含まれていれば、そのディスク使用率402は異常値として検出されない。
The
図6は、補正後予測結果テーブル323の一例を示す説明図である。補正後予測結果テーブル323は、フィールドとして、タイムスタンプ401と、補正後予測ディスク使用率602と、補正後下側シリーズ603と、補正後上側シリーズ604と、を有する。補正後予測ディスク使用率602は、線形変換により補正された予測ディスク使用率502である。補正後下側シリーズ603は、補正後予測ディスク使用率602に対応する下側シリーズ503である。補正後上側シリーズ604は、補正後予測ディスク使用率602に対応する上側シリーズ504である。
Figure 6 is an explanatory diagram showing an example of the corrected prediction result table 323. The corrected prediction result table 323 has the following fields:
<異常検出処理手順例>
図7は、異常検出装置202による異常検出処理手順例を示すフローチャートである。ステップ701~S704は収集モジュール341により実行され、ステップS705は概念ドリフト候補点決定モジュール342により実行され、ステップS706は予測結果補正モジュール343により実行される。異常検出装置202は、たとえば、ディスク使用率テーブル321に未分析のエントリが一定数蓄積されると、図7に示す処理を開始する。
<Example of abnormality detection processing procedure>
7 is a flowchart showing an example of an anomaly detection processing procedure by the
異常検出装置202は、ITインフラストラクチャ201からメトリクスデータを収集し、ディスク使用率テーブル321にエントリを追加する(ステップS701)。たとえば、ディスク使用率テーブル321の1つのエントリは、複数の時刻における各ディスク使用率402の統計値である。統計値とは、たとえば、複数の時刻における各ディスク使用率402の平均値、中央値、最大値、または最小値である。
The
ディスク使用率テーブル321のタイムスタンプ401は、15分間隔で記録されるため、ITインフラストラクチャ201がたとえば1分間隔でディスク使用率402を測定する場合、ITインフラストラクチャ201はディスク使用率402を15回測定し、15回分のディスク使用率402の統計値を算出する。ITインフラストラクチャ201は、15回の測定うち最後の測定時刻と15回のディスク使用率402の統計値とを異常検出装置202に送信する。異常検出装置202は、受信した最後の測定時刻をタイムスタンプ401に記録し、15回のディスク使用率402の統計値をディスク使用率402に記録する。
The
つぎに、異常検出装置202は、分析開始時刻Tstartを取得する(ステップS702)。分析開始時刻Tstartは、異常検出装置202がステップS703の分析を開始するディスク使用率テーブル321のエントリのタイムスタンプ401である。すなわち、分析開始時刻Tstartは、ディスク使用率テーブル321において、未分析でかつ最古のエントリのタイムスタンプ401である。たとえば、ディスク使用率テーブル321において、エントリ321X4まで異常検出処理が完了しているものとすると、次のエントリ321X5のタイムスタンプ401の値「2021-01-01 01:00:00」が分析開始時刻Tstartとなる。
Next, the
つぎに、異常検出装置202は、時系列モデルの再学習に用いられていない分析開始時刻Tstartまでのエントリ群を時系列データとしてディスク使用率テーブル321から抽出し、時系列モデルを再学習する(ステップS703)。時系列モデルは、たとえば、
y=f(t)・・・(1)
で表現される関数である。左辺のyは、ディスク使用率402であり、右辺のtは時刻データであり、たとえば、タイムスタンプ401である。時刻データtとして、タイムスタンプ401のほか、曜日の種類(平日、休日、祝祭日)が入力されてもよい。
Next, the
y=f(t)...(1)
The left side of the formula is a function expressed as follows: y on the left side is the
たとえば、エントリ321X1の1つ前までのエントリが学習済みであり、エントリ321X1~321X4が時系列モデルの学習に用いられていない分析開始時刻Tstartまでのエントリ群であれば、異常検出装置202は、エントリ321X1~321X4のタイムスタンプ401を時系列モデルの時刻データtに入力し、それらの出力結果yとエントリ321X1~321X4のディスク使用率402との差が最小となるように時系列モデルを再学習する。なお、時系列モデルが未生成である場合、異常検出装置202は、分析開始時刻Tstartまでのエントリ群を時系列データとしてディスク使用率テーブル321から抽出し、時系列モデルを学習する。
For example, if the entries immediately preceding entry 321X1 have already been learned, and entries 321X1 to 321X4 are a group of entries up to analysis start time T start that have not been used in learning the time series model, then
なお、時系列モデルは、ランダムフォレストでもよく、ARIMA(AutoRegressive Integrated Moving Average)モデルでもよく、SARIMA(Seasonal ARIMA)モデルでもよい。 The time series model may be a random forest, an ARIMA (AutoRegressive Integrated Moving Average) model, or a SARIMA (Seasonal ARIMA) model.
つぎに、異常検出装置202は、分析開始時刻Tstartから予測の実行を開始し、予測結果テーブル322にエントリを追加する(ステップS704)。具体的には、たとえば、異常検出装置202は、ステップS703で再学習された上記式(1)の時系列モデルの時刻データtに、分析開始時刻Tstartから最新時刻までのタイムスタンプ401を順次入力し、タイムスタンプ401ごとのディスク使用率402の予測データpを上記式(1)のyとして出力し、タイムスタンプ401とともに予測ディスク使用率502として予測結果テーブル322に記録する。また、異常検出装置202は、順次入力されたタイムスタンプ401ごとに、下側シリーズ503の値および上側シリーズ504の値を算出して、予測結果テーブル322に記録する。
Next, the
ここで、異常検出モジュール340で異常検出されないエントリについて説明する。たとえば、エントリ321X7のディスク使用率402(50%)は異常値である。しかし、エントリ321X7と同一タイムスタンプ401の予測結果テーブル322のエントリ322P3では、下側シリーズ503の値が「45%」、上側シリーズ504の値が「65%」である。
Now, we will explain entries for which no abnormality is detected by the
したがって、異常値であるエントリ321X7のディスク使用率402(50%)は、下側シリーズ503の値「45%」と上側シリーズ504の値「65%」との間の予測間隔[45,65]に含まれる。したがって、エントリ321X7のディスク使用率402(50%)は、異常値として検出されない。これは、再学習後の時系列モデルfが、ITインフラストラクチャ201のディスク容量が2倍になった影響を見逃しているからである。
Therefore, the disk usage rate 402 (50%) of entry 321X7, which is an abnormal value, is included in the prediction interval [45, 65] between the value "45%" of
異常検出装置202は、概念ドリフト候補点決定処理(ステップS705)および予測結果補正処理(ステップS706)により、予測ディスク使用率502を補正する。これにより、異常検出装置202は、異常検出モジュール340により、このように見逃されて正常値として扱われたエントリ321X7のディスク使用率402(50%)を異常値として検出する(ステップS707)。
The
<概念ドリフト候補点決定処理(ステップS705)>
図8は、図7に示した概念ドリフト候補点決定処理(ステップS705)の詳細な処理手順例を示すフローチャートである。ステップS704のあと、異常検出装置202は、操作ログまたは構成管理データベース(CMDB)が利用可能か否かを判断する(ステップS801)。ITインフラストラクチャ201における操作ログまたはCMDBのいずれかが利用可能である場合(ステップS801:Yes)、異常検出装置202は、概念ドリフト候補点を操作ログまたはCMDBから取得して(ステップS810)、予測結果補正処理(ステップS706)に移行する。
<Concept Drift Candidate Point Determination Process (Step S705)>
Fig. 8 is a flowchart showing a detailed example of the process procedure of the concept drift candidate point determination process (step S705) shown in Fig. 7. After step S704, the
一方、操作ログおよびCMDBのいずれも利用不可能である場合(ステップS801:No)、異常検出装置202は、予測データとテストデータとの平均誤差を算出する(ステップS802)。予測データとは、予測ディスク使用率502であり、テストデータとは、予測データと同一タイムスタンプ401のディスク使用率402であり、正解データとも呼ばれる。平均誤差とは、タイムスタンプ401ごとの予測データとテストデータとの差分に基づく誤差の平均値である。たとえば、誤差は、図1の(A)の差Gであり、下記式(2)で表現される。平均誤差は、下記式(3)で表現される。
On the other hand, if neither the operation log nor the CMDB is available (step S801: No), the

式(2)、(3)のxtは、テストデータであり、ptは、予測ディスク使用率502であり、tは、タイムスタンプ401である。e(t)は、タイムスタンプ401がtのときの誤差であり、Eは、分析開始時刻TstartからTendまでのn個の誤差e(t)の平均値、すなわち、平均誤差である。Tendは、分析開始時刻Tstartのエントリからn番目のエントリのタイムスタンプ401が示す分析終了時刻である。
In formulas (2) and (3), xt is the test data, pt is the predicted
つぎに、異常検出装置202は、ステップS802で算出した平均誤差Eが誤差しきい値Ethresholdよりも大きいか否かを判断する(ステップS803)。平均誤差Eが誤差しきい値Ethresholdよりも大きくない場合(ステップS803:No)、予測結果補正処理(ステップS706)に移行する。一方、平均誤差Eが誤差しきい値Ethresholdよりも大きい場合(ステップS803:Yes)、ステップS804に移行する。本例では、誤差しきい値Ethresholdを、たとえば、Ethreshold=0.2とする。平均誤差Eが誤差しきい値Ethresholdよりも大きければ、急激な概念ドリフトが発生していると予想される。平均誤差Eが誤差しきい値Ethresholdよりも大きい概念ドリフトを、急激な概念ドリフトと称す。
Next, the
平均誤差Eが誤差しきい値Ethresholdよりも大きい場合(ステップS803:Yes)、異常検出装置202は、テストデータの変化率rtをタイムスタンプ401ごとに算出する(ステップS804)。変化率rtは、たとえば、下記(4)で算出される。
If the average error E is greater than the error threshold E threshold (step S803: Yes), the

変化率rtは、時刻tのテストデータxtと時刻t+1のテストデータxt+1との比に基づいて算出される。異常検出装置202は、タイムスタンプ401ごとの変化率のうち、変化率しきい値Rthresholdよりも大きい特定の変化率rtがあるか否かを判断する(ステップS805)。特定の変化率rtが1つもない場合(ステップS805:No)、予測結果補正処理(ステップS706)に移行する。一方、特定の変化率rtが1つ以上ある場合(ステップS805:Yes)、ステップS806に移行する。変化率しきい値Rthresholdは、ユーザにより任意に設定可能である。
The change rate r t is calculated based on the ratio of the test data x t at time t to the test data x t+1 at time t+1 . The
異常検出装置202は、特定の変化率rtとそのタイムスタンプ401が示す時刻tとを選択する(ステップS806)。そして、異常検出装置202は、特定の変化率rtごとに、所定期間(たとえば、1日)においてステップS806で選択された回数をカウントする(ステップS807)。この選択された回数を特定の変化率rtの出現回数frと称す。なお、特定の変化率rtは、完全一致した場合にのみカウントされてもよく、許容範囲内であればカウントされてもよい。たとえば、変化率rtが1.804や1.863であれば、特定の変化率rt=1.8の出現回数frとしてカウントされる。
The
このあと、異常検出装置202は、出現回数frが出現回数しきい値Fthresholdより小さい特定のタイムスタンプ401があるか否かを判断する(ステップS808)。出現回数frが出現回数しきい値Fthresholdより小さい特定のタイムスタンプ401が1つもない場合(ステップS808:No)、予測結果補正処理(ステップS706)に移行する。
Thereafter, the
一方、出現回数ftが出現回数しきい値Fthresholdより小さい特定のタイムスタンプ401が1つ以上ある場合(ステップS808:Yes)、異常検出装置202は、特定のタイムスタンプ401を概念ドリフト候補点に決定し(ステップS809)、予測結果補正処理(ステップS706)に移行する。特定の変化率rtが出現回数しきい値Fthreshold以上出現しているということは、特定の変化率rtおよびそのタイムスタンプ401が概念ドリフトによるディスク使用率402の変化を示しているのではなく、ディスク使用率402自体に通常の挙動とは異なる変化が発生していることを示している。したがって、異常検出装置202は、出現回数frが出現回数しきい値Fthresholdより小さい特定のタイムスタンプ401が示す時刻で、急激な概念ドリフトが発生したらしいと予測する。
On the other hand, if there is one or more
つぎに、概念ドリフト候補点決定処理(ステップS705)の実行例を図9~図11を用いて説明する。 Next, an example of the execution of the concept drift candidate point determination process (step S705) will be explained using Figures 9 to 11.
図9は、ステップS802の算出例を示す説明図である。図9では、分析開始時刻となるタイムスタンプ401は、「2021-01-01 01:00:00」とし、分析終了時刻となるタイムスタンプ401は、「2021-01-01 01:45:00」とする。図9の場合、平均誤差Eは誤差しきい値Ethresholdよりも大きいため(ステップS802:Yes)、ステップS804に移行する。
9 is an explanatory diagram showing an example of calculation in step S802. In FIG. 9, the
図10は、ステップS804の算出例を示す説明図である。エントリ1000は、分析開始時刻Tstartの1つ前のタイムスタンプ401(すなわち、前回の分析での分析終了時刻Tend)の算出結果を示す。エントリ1004では、変化率が算出されないため、ステップS804の判定は実行されない。図10では、エントリ1001~1003の各変化率rtが変化率しきい値Rthresholdよりも大きい特定の変化率であることがわかる。
10 is an explanatory diagram showing an example of calculation in step S804.
図11は、ステップS807の算出例を示す説明図である。エントリ1101~1103では、特定の変化率rtの各々の出現回数frが「1」であるため、出現回数しきい値Fthresholdよりも小さい。したがって、ステップS806で選択されたエントリ1001~1003のタイムスタンプ401は、特定のタイムスタンプ401に決定される(ステップS809)。
11 is an explanatory diagram showing an example of calculation in step S807. In the
<予測結果補正処理(ステップS706)>
図12は、図7に示した予測結果補正処理(ステップS706)の詳細な処理手順例(前半)を示すフローチャートである。異常検出装置202は、テストデータ、予測データ、および概念ドリフト候補点を取得する(ステップS1201)。つぎに、異常検出装置202は、未選択の概念ドリフト候補点があるか否かを判断する(ステップS1202)。未選択の概念ドリフト候補点がある場合(ステップS1202:Yes)、異常検出装置202は、未選択の概念ドリフト候補点を1つ選択してTとし、選択した概念ドリフト候補点Tの変化率rTを、下記式(5)を用いて算出する(ステップS1203)。
<Prediction result correction process (step S706)>
12 is a flowchart showing a detailed processing procedure example (first half) of the prediction result correction process (step S706) shown in FIG. 7. The
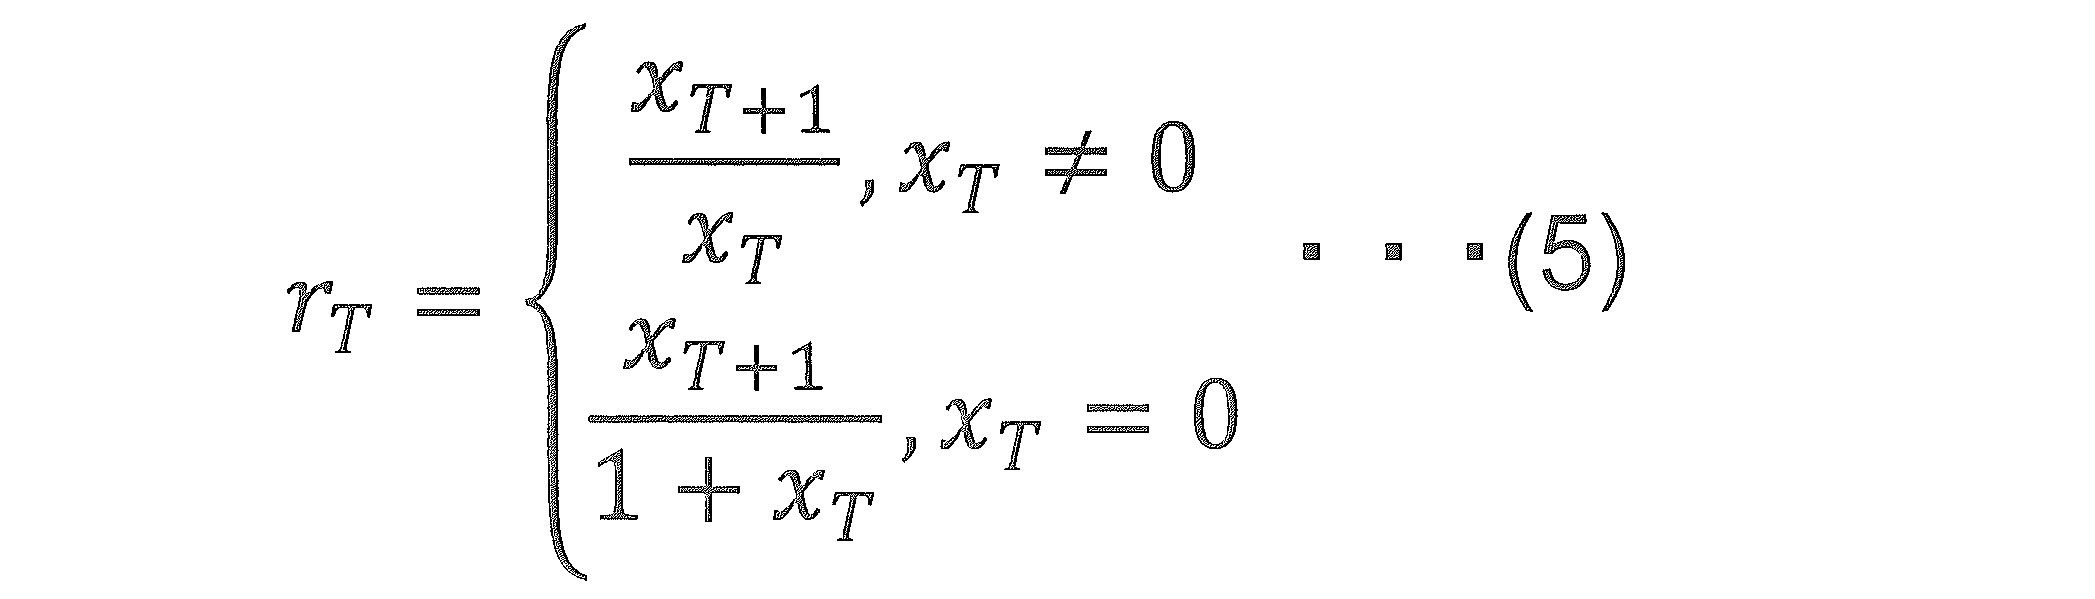
つぎに、異常検出装置202は、下記式(6)を用いて、概念ドリフト候補点Tのスケール誤差eT
scaleを算出する(ステップS1203)。
Next, the

上記式(6)において、mは、タイムスタンプ401が示す時刻T+1から分析終了時刻Tendまでのタイムスタンプ401の個数である。スケール誤差eT
scaleは、予測データptを概念ドリフト候補点Tの変化率rTでスケール(拡縮)した場合のテストデータとの誤差の平均値を示す。
In the above formula (6), m is the number of
つぎに、異常検出装置202は、下記式(7)を用いて、変化差分dTを算出する(ステップS1205)。
Next, the

そして、異常検出装置202は、下記式(8)を用いて、シフト誤差eT
shiftを算出して(ステップS1206)、ステップS1202に戻る。
Then, the

シフト誤差eT
shiftは、予測データptを概念ドリフト候補点Tの変化差分dTでシフト(加減算)した場合のテストデータとの誤差の平均値を示す。そして、ステップS1202において、未選択の概念ドリフト候補点がない場合(ステップS1202:No)、異常検出装置202は、最小誤差およびそのタイムスタンプ401を選択して(ステップS1207)、図13のステップS1301に移行する。具体的には、たとえば、異常検出装置202は、概念ドリフト候補点Tごとのスケール誤差eT
scaleおよびシフト誤差eT
shiftのうち、最小誤差を選択する。最小誤差のタイムスタンプ401が示す時刻をτとする。
The shift error e T shift indicates the average value of the error with the test data when the predicted data p T is shifted (added or subtracted) by the change difference d T of the conceptual drift candidate point T. Then, in step S1202, if there is no unselected conceptual drift candidate point (step S1202: No), the
たとえば、概念ドリフト候補点Tが3点(T1、T2、T3とする)存在すると仮定すると、スケール誤差eT1
scale,eT2
scale,eT3
scaleとシフト誤差eT1
shift,eT2
shift,eT3
shiftとが算出される。ステップS1207では、異常検出装置202は、スケール誤差eT1
scale,eT2
scale,eT3
scaleとシフト誤差eT1
shift,eT2
shift,eT3
shiftとの中から最小誤差を選択する。この最小誤差が、たとえば、スケール誤差eT3
scaleであったとすると、異常検出装置202は、スケール誤差eT3
scaleが発生した概念ドリフト候補点T3を選択してτとする。そして、図13のステップS1301に移行する。
For example, assuming that there are three concept drift candidate points T (T1, T2, and T3), the scale errors e T1 scale , e T2 scale , and e T3 scale and the shift errors e T1 shift , e T2 shift , and e T3 shift are calculated. In step S1207, the
なお、概念ドリフト候補点決定処理(ステップS705)において、概念ドリフト候補点Tが1つも決定または取得されなかった場合、ステップS1207および図13の処理は実行されない。 Note that if no concept drift candidate points T are determined or acquired in the concept drift candidate point determination process (step S705), step S1207 and the process of FIG. 13 are not executed.
図13は、図7に示した予測結果補正処理(ステップS706)の詳細な処理手順例(後半)を示すフローチャートである。異常検出装置202は、ステップS1207の選択最小誤差がスケール誤差eτ
scaleであるかシフト誤差eτ
shiftであるかを判断する(ステップS1301)。選択最小誤差がスケール誤差eτ
scaleである場合(ステップS1301:スケール誤差)、異常検出装置202は、選択最小誤差であるスケール誤差eτ
scaleが誤差許容値Etolerance以下であるか否かを判断する(ステップS1302)。スケール誤差eτ
scaleが誤差許容値Etolerance以下でない場合(ステップS1302:No)、予測結果補正処理(ステップS706)が終了する。
13 is a flowchart showing a detailed processing procedure example (second half) of the prediction result correction process (step S706) shown in FIG. 7. The
一方、スケール誤差eτ
scaleが誤差許容値Etolerance以下である場合(ステップS1302:Yes)、異常検出装置202は、タイムスタンプ401が示す時刻τ後の予測データpを変化率rτでスケールする(ステップS1303)。このとき、異常検出装置202は、スケール後の予測データpに基づいて下側シリーズ503および上側シリーズ504も補正する。そして、異常検出装置202は、スケール後の予測データpについて、補正後予測結果テーブル323のエントリを追加し(ステップS1304)、予測結果補正処理(ステップS706)が終了する。
On the other hand, if the scale error e τ scale is equal to or smaller than the error tolerance E tolerance (step S1302: Yes), the
また、ステップS1301において、選択最小誤差がシフト誤差eτ
shiftである場合(ステップS1301:シフト誤差)、異常検出装置202は、選択最小誤差であるシフト誤差eτ
shiftが誤差許容値Etolerance以下であるか否かを判断する(ステップS1305)。シフト誤差eτ
shiftが誤差許容値Etolerance以下でない場合(ステップS1305:No)、予測結果補正処理(ステップS706)が終了する。
In addition, in step S1301, if the selected minimum error is the shift error e τ shift (step S1301: shift error), the
一方、シフト誤差eτ
shiftが誤差許容値Etolerance以下である場合(ステップS1305:Yes)、異常検出装置202は、タイムスタンプ401が示す時刻τ後の予測データpを変化差分dτでシフトする(ステップS1306)。このとき、異常検出装置202は、シフト後の予測データpに基づいて下側シリーズ503および上側シリーズ504も補正する。そして、異常検出装置202は、シフト後の予測データpについて、補正後予測結果テーブル323のエントリを追加し(ステップS1307)、予測結果補正処理(ステップS706)が終了する。
On the other hand, if the shift error e τ shift is equal to or smaller than the error tolerance E tolerance (step S1305: Yes), the
図14~図16は、概念ドリフト候補点Tごとのスケールおよびシフト計算例を示す説明図である。図14の概念ドリフト候補点は、「2021-01-01 01:00:00」であり、図15の概念ドリフト候補点は、「2021-01-01 01:15:00」であり、図16の概念ドリフト候補点は、「2021-01-01 01:30:00」である。 Figures 14 to 16 are explanatory diagrams showing examples of scale and shift calculations for each conceptual drift candidate point T. The conceptual drift candidate point in Figure 14 is "2021-01-01 01:00:00", the conceptual drift candidate point in Figure 15 is "2021-01-01 01:15:00", and the conceptual drift candidate point in Figure 16 is "2021-01-01 01:30:00".
これら3つの概念ドリフト候補点Tにおける3つのスケール誤差eT
scaleおよび3つのシフト誤差eT
shiftのうち最小誤差は、図14の概念ドリフト候補点T=「2021-01-01 01:00:00」におけるスケール誤差eT
scale=0.159である。したがって、このスケール誤差eT
scaleが最小誤差として選択され、そのタイムスタンプ401である概念ドリフト候補点T=「2021-01-01 01:00:00」がτとして選択される(ステップS1207)。そして、エントリ1401~1403のタイムスタンプ401およびスケール後の予測データが、補正後予測テーブルに登録される。
The minimum error among the three scale errors e T scale and the three shift errors e T shift at these three conceptual drift candidate points T is the scale error e T scale =0.159 at the conceptual drift candidate point T=“2021-01-01 01:00:00” in FIG. 14. Therefore, this scale error e T scale is selected as the minimum error, and the conceptual drift candidate point T=“2021-01-01 01:00:00” which is its
このように、上述した異常検出装置202によれば、たとえば、ITインフラストラクチャ201において、ディスクの容量がk倍に増加すると、ディスク使用率402が1/k倍にスケール変換される。また、ディスクの容量がk倍に低下すると、ディスク使用率402がk倍にスケール変換される。また、大量のログファイルの予定外の削除があると、ディスク使用率402がその分低下するようシフト変換される。また、大量のファイルがバックアップストレージにコピーされると、ディスク使用率402がその分上昇するようシフト変換される。
In this way, according to the
したがって、概念ドリフトを引き起こすような特定イベント発生後においても、異常検出の即時性が向上し、1日ごとまたは1時間ごとのような定期的なITシステムの異常レポートの即時的な出力が可能になる。したがって、特定イベント発生後に異常検出が停止せず、異常であるのに正常としたり正常であるのに異常としたりするような誤検出も抑制することができる。 Therefore, even after the occurrence of a specific event that causes concept drift, the immediacy of anomaly detection is improved, and it becomes possible to immediately output anomaly reports for the IT system on a regular basis, such as daily or hourly. Therefore, anomaly detection does not stop after the occurrence of a specific event, and it is also possible to suppress erroneous detections such as anomalies being classified as normal when they are actually abnormal, or normal conditions being classified as abnormal when they are actually normal.
また、上述した異常検出装置202では、スケール変換とシフト変換のうちいずれか一方の線形変換を選択して、予測データを補正したが、スケール変換とシフト変換のうちいずれか一方の線形変換のみが実装されてもよい。
In addition, in the above-described
また、上述した異常検出装置202は、下記(1)~(9)のように構成することもできる。
The above-mentioned
(1)異常検出装置202は、プログラムを実行するプロセッサ301と、前記プログラムを記憶する記憶デバイス302と、を有し、前記プロセッサ301は、監視対象(たとえば、ディスク使用率402)の時系列な第1予測データ(たとえば、図1に示した時刻t1からt3までの予測データ)のうち特定イベントの発生時点T(たとえば、図1の時刻t2)後における第2予測データを、スケール変換により補正する補正処理(ステップS706)と、前記補正処理による補正後の第2予測データ(たとえば、図1に示した時刻t2からt3までの予測データ)と、前記監視対象の時系列な第1実測データ(たとえば、図1に示した時刻t1からt3までのテストデータ)のうち前記特定イベントの発生時点T後における第2実測データ(たとえば、図1に示した時刻t2からt3までのテストデータ)と、に基づいて、前記監視対象の異常を検出する検出処理(ステップS707)と、を実行する。
(1) The
(2)上記(1)の異常検出装置202において、前記補正処理(ステップS706)では、前記プロセッサ301は、前記第2予測データを、前記第2実測データの変化率rτを用いた前記スケール変換により補正する。
(2) In the
(3)上記(1)の異常検出装置202において、前記補正処理(ステップS706)では、前記プロセッサ301は、前記第2予測データを、前記スケール変換またはシフト変換のうちいずれかの一方の線形変換により補正する。
(3) In the
(4)上記(1)の異常検出装置202において、前記補正処理では、前記プロセッサ301は、前記スケール変換が選択された場合、前記第2予測データを、前記第2実測データの変化率rτを用いた前記スケール変換により補正し、前記シフト変換が選択された場合、前記第2予測データを、前記第2実測データの変化の差rτを用いた前記シフト変換により補正する。
(4) In the
(5)上記(4)の異常検出装置202において、前記補正処理(ステップS706)では、前記プロセッサ301は、前記第2実測データと前記変化率rτで拡縮した前記第2予測データとのスケール誤差eτ
scaleを算出し、前記第2実測データと前記変化の差rτでシフトした前記第2予測データとのシフト誤差eτ
shiftを算出し、前記スケール誤差eτ
scaleと前記シフト誤差eτ
shiftとに基づいて、前記スケール変換またはシフト変換のうちいずれかの一方の線形変換を選択する。
(5) In the
(6)上記(5)の異常検出装置202において、前記補正処理(ステップS706)では、前記プロセッサ301は、前記スケール誤差eτ
scaleと前記シフト誤差eτ
shiftとのうち誤差が小さい方の線形変換を選択する。
(6) In the
(7)上記(1)の異常検出装置202において、前記プロセッサ301は、前記第1実測データの観測時点tにおける実測値の変化率rtの各々について、変化率しきい値Rthresholdよりも大きい(ステップS805:Yes)特定の観測時点tを前記特定イベントの発生時点候補Tに決定する決定処理(ステップS705)を実行し、前記補正処理(ステップS706)では、前記プロセッサ301は、前記決定処理(ステップS705)によって決定された前記特定イベントの発生時点候補Tのうちいずれかの発生時点候補τの後における前記第2予測データを、前記スケール変換により補正する。
(7) In the
(8)上記(7)の異常検出装置202において、前記決定処理(ステップS705)では、前記プロセッサ301は、前記第1予測データと前記第1実測データとの間の誤差Eが誤差しきい値Ethresholdより大きい場合(ステップS803:Yes)、前記特定の観測時点tを前記特定イベントの発生時点候補Tに決定する。
(8) In the
(9)上記(7)の異常検出装置202において、前記決定処理(ステップS705)では、前記プロセッサ301は、前記特定の観測時点tでの前記実測値の変化率rtについて所定期間内における出現回数frを計数し、前記出現回数frが出現回数しきい値Fthresholdよりも小さい前記実測値の変化率rtに対応する前記特定の観測時点tを、前記特定イベントの発生時点候補Tに決定する。
(9) In the
なお、本発明は前述した実施例に限定されるものではなく、添付した特許請求の範囲の趣旨内における様々な変形例及び同等の構成が含まれる。たとえば、前述した実施例は本発明を分かりやすく説明するために詳細に説明したものであり、必ずしも説明した全ての構成を備えるものに本発明は限定されない。また、ある実施例の構成の一部を他の実施例の構成に置き換えてもよい。また、ある実施例の構成に他の実施例の構成を加えてもよい。また、各実施例の構成の一部について、他の構成の追加、削除、または置換をしてもよい。 The present invention is not limited to the above-described embodiments, but includes various modified examples and equivalent configurations within the spirit of the appended claims. For example, the above-described embodiments have been described in detail to clearly explain the present invention, and the present invention is not necessarily limited to having all of the configurations described. Furthermore, a portion of the configuration of one embodiment may be replaced with the configuration of another embodiment. Furthermore, the configuration of another embodiment may be added to the configuration of one embodiment. Furthermore, other configurations may be added, deleted, or replaced with part of the configuration of each embodiment.
また、前述した各構成、機能、処理部、処理手段等は、それらの一部又は全部を、たとえば集積回路で設計する等により、ハードウェアで実現してもよく、プロセッサ301がそれぞれの機能を実現するプログラムを解釈し実行することにより、ソフトウェアで実現してもよい。
Furthermore, each of the configurations, functions, processing units, processing means, etc. described above may be realized in part or in whole in hardware, for example by designing them as integrated circuits, or may be realized in software by having the
各機能を実現するプログラム、テーブル、ファイル等の情報は、メモリ、ハードディスク、SSD(Solid State Drive)等の記憶装置、又は、IC(Integrated Circuit)カード、SDカード、DVD(Digital Versatile Disc)の記録媒体に格納することができる。 Information such as programs, tables, and files that realize each function can be stored in a storage device such as a memory, a hard disk, or an SSD (Solid State Drive), or in a recording medium such as an IC (Integrated Circuit) card, an SD card, or a DVD (Digital Versatile Disc).
また、制御線や情報線は説明上必要と考えられるものを示しており、実装上必要な全ての制御線や情報線を示しているとは限らない。実際には、ほとんど全ての構成が相互に接続されていると考えてよい。 In addition, the control lines and information lines shown are those considered necessary for explanation, and do not necessarily represent all control lines and information lines necessary for implementation. In reality, it is safe to assume that almost all components are interconnected.
200 異常検出システム
201 ITインフラストラクチャ
202 異常検出装置
301 プロセッサ
302 記憶デバイス
321 ディスク使用率テーブル
322 予測結果テーブル
323 補正後予測結果テーブル
324 異常検出プログラム
340 異常検出モジュール
341 収集モジュール
342 概念ドリフト候補点決定モジュール
343 予測結果補正モジュール
200
Claims (11)
前記プロセッサは、
監視対象の時系列な第1予測データのうち特定イベントの発生時点後における第2予測データを、スケール変換により補正する補正処理と、
前記補正処理による補正後の第2予測データと、前記監視対象の時系列な第1実測データのうち前記特定イベントの発生時点後における第2実測データと、に基づいて、前記監視対象の異常を検出する検出処理と、
を実行することを特徴とする異常検出装置。 An anomaly detection device having a processor that executes a program and a storage device that stores the program,
The processor,
a correction process for correcting second predicted data after a specific event occurs from the first predicted data of the time series of the monitoring target by scale conversion;
a detection process for detecting an abnormality in the monitoring target based on second predicted data corrected by the correction process and second actual measurement data after a point in time when the specific event occurs among first time-series actual measurement data of the monitoring target;
An anomaly detection device comprising:
前記補正処理では、前記プロセッサは、前記第2予測データを、前記第2実測データの変化率を用いた前記スケール変換により補正する、
ことを特徴とする異常検出装置。 The abnormality detection device according to claim 1 ,
In the correction process, the processor corrects the second predicted data by the scale conversion using a rate of change of the second actual measurement data.
2. An abnormality detection device comprising:
前記補正処理では、前記プロセッサは、前記第2予測データを、前記スケール変換またはシフト変換のうちいずれかの一方の線形変換により補正する、
ことを特徴とする異常検出装置。 The abnormality detection device according to claim 1 ,
In the correction process, the processor corrects the second predicted data by linear transformation, which is either the scale transformation or the shift transformation.
2. An abnormality detection device comprising:
前記補正処理では、前記プロセッサは、前記スケール変換が選択された場合、前記第2予測データを、前記第2実測データの変化率を用いた前記スケール変換により補正し、前記シフト変換が選択された場合、前記第2予測データを、前記第2実測データの変化の差を用いた前記シフト変換により補正する、
ことを特徴とする異常検出装置。 The abnormality detection device according to claim 3,
In the correction process, when the scale conversion is selected, the processor corrects the second predicted data by the scale conversion using a rate of change of the second actual measured data, and when the shift conversion is selected, the processor corrects the second predicted data by the shift conversion using a difference in change of the second actual measured data.
2. An abnormality detection device comprising:
前記補正処理では、前記プロセッサは、前記第2実測データと前記変化率で拡縮した前記第2予測データとのスケール誤差を算出し、前記第2実測データと前記変化の差でシフトした前記第2予測データとのシフト誤差を算出し、前記スケール誤差と前記シフト誤差とに基づいて、前記スケール変換またはシフト変換のうちいずれかの一方の線形変換を選択する、
ことを特徴とする異常検出装置。 The abnormality detection device according to claim 4,
In the correction process, the processor calculates a scale error between the second actual data and the second predicted data scaled by the change rate, calculates a shift error between the second actual data and the second predicted data shifted by the change difference, and selects one of the linear transformations, the scale transformation or the shift transformation, based on the scale error and the shift error.
2. An abnormality detection device comprising:
前記補正処理では、前記プロセッサは、前記スケール誤差と前記シフト誤差とのうち誤差が小さい方の線形変換を選択する、
ことを特徴とする異常検出装置。 The abnormality detection device according to claim 5,
In the correction process, the processor selects a linear transformation that has a smaller error between the scale error and the shift error.
2. An abnormality detection device comprising:
前記プロセッサは、
前記第1実測データの観測時点における実測値の変化率の各々について、変化率しきい値よりも大きい特定の観測時点を前記特定イベントの発生時点候補に決定する決定処理を実行し、
前記補正処理では、前記プロセッサは、前記決定処理によって決定された前記特定イベントの発生時点候補のうちいずれかの発生時点候補の後における前記第2予測データを、前記スケール変換により補正する、
ことを特徴とする異常検出装置。 The abnormality detection device according to claim 1 ,
The processor,
performing a determination process for determining a specific observation time point at which a change rate of the actual measurement value at an observation time point of the first actual measurement data is greater than a change rate threshold value as a candidate occurrence time point of the specific event;
In the correction process, the processor corrects the second predicted data after any one of the occurrence time candidate candidates of the specific event determined in the determination process, by the scale conversion.
2. An abnormality detection device comprising:
前記決定処理では、前記プロセッサは、前記第1予測データと前記第1実測データとの間の誤差が誤差しきい値より大きい場合、前記特定の観測時点を前記特定イベントの発生時点候補に決定する、
ことを特徴とする異常検出装置。 The abnormality detection device according to claim 7,
In the determination process, when an error between the first predicted data and the first actual measured data is greater than an error threshold, the processor determines the specific observation time point as a candidate occurrence time point of the specific event.
2. An abnormality detection device comprising:
前記決定処理では、前記プロセッサは、前記特定の観測時点での前記実測値の変化率について所定期間内における出現回数を計数し、前記出現回数が出現回数しきい値よりも小さい前記実測値の変化率に対応する前記特定の観測時点を、前記特定イベントの発生時点候補に決定する、
ことを特徴とする異常検出装置。 The abnormality detection device according to claim 7,
In the determination process, the processor counts the number of occurrences within a predetermined period of time of the rate of change of the actual measurement value at the specific observation time point, and determines the specific observation time point corresponding to the rate of change of the actual measurement value where the number of occurrences is smaller than an occurrence number threshold value as a candidate occurrence time point of the specific event.
2. An abnormality detection device comprising:
前記プロセッサは、
監視対象の時系列な第1予測データのうち特定イベントの発生時点後における第2予測データを、スケール変換により補正する補正処理と、
前記補正処理による補正後の予測データと、前記監視対象の時系列な第1実測データのうち前記特定イベントの発生時点後における第2実測データと、に基づいて、前記監視対象の異常を検出する検出処理と、
を実行することを特徴とする異常検出方法。 An anomaly detection method executed by an anomaly detection device having a processor that executes a program and a storage device that stores the program, comprising:
The processor,
a correction process for correcting second predicted data after a specific event occurs from the first predicted data of the time series of the monitoring target by scale conversion;
a detection process for detecting an abnormality in the monitoring target based on predicted data corrected by the correction process and second actual measurement data after a point in time when the specific event occurs among first actual measurement data in a time series of the monitoring target;
2. An anomaly detection method comprising:
監視対象の時系列な第1予測データのうち特定イベントの発生時点後における第2予測データを、スケール変換により補正する補正処理と、
前記補正処理による補正後の予測データと、前記監視対象の時系列な第1実測データのうち前記特定イベントの発生時点後における第2実測データと、に基づいて、前記監視対象の異常を検出する検出処理と、
を実行させることを特徴とする異常検出プログラム。 The processor:
a correction process for correcting second predicted data after a specific event occurs from the first predicted data of the time series of the monitoring target by scale conversion;
a detection process for detecting an abnormality in the monitoring target based on predicted data corrected by the correction process and second actual measurement data after a point in time when the specific event occurs among first actual measurement data in a time series of the monitoring target;
An anomaly detection program characterized by executing the above.
Priority Applications (2)
| Application Number | Priority Date | Filing Date | Title |
|---|---|---|---|
| JP2021071101A JP7626657B2 (en) | 2021-04-20 | 2021-04-20 | Anomaly detection device, anomaly detection method, and anomaly detection program |
| US17/681,968 US11829226B2 (en) | 2021-04-20 | 2022-02-28 | Anomaly detection apparatus, anomaly detection method, and anomaly detection program |
Applications Claiming Priority (1)
| Application Number | Priority Date | Filing Date | Title |
|---|---|---|---|
| JP2021071101A JP7626657B2 (en) | 2021-04-20 | 2021-04-20 | Anomaly detection device, anomaly detection method, and anomaly detection program |
Publications (2)
| Publication Number | Publication Date |
|---|---|
| JP2022165669A JP2022165669A (en) | 2022-11-01 |
| JP7626657B2 true JP7626657B2 (en) | 2025-02-04 |
Family
ID=83601435
Family Applications (1)
| Application Number | Title | Priority Date | Filing Date |
|---|---|---|---|
| JP2021071101A Active JP7626657B2 (en) | 2021-04-20 | 2021-04-20 | Anomaly detection device, anomaly detection method, and anomaly detection program |
Country Status (2)
| Country | Link |
|---|---|
| US (1) | US11829226B2 (en) |
| JP (1) | JP7626657B2 (en) |
Families Citing this family (2)
| Publication number | Priority date | Publication date | Assignee | Title |
|---|---|---|---|---|
| WO2025173134A1 (en) * | 2024-02-14 | 2025-08-21 | Ntt株式会社 | Abnormality determination device, method, and program |
| WO2025177515A1 (en) * | 2024-02-22 | 2025-08-28 | Ntt株式会社 | Drift detection device and drift detection method |
Citations (3)
| Publication number | Priority date | Publication date | Assignee | Title |
|---|---|---|---|---|
| JP2009169959A (en) | 2009-02-18 | 2009-07-30 | Rakuten Inc | INFORMATION PROVIDING SYSTEM, INFORMATION PROVIDING DEVICE, ADJUSTMENT DETERMINATION INFORMATION GENERATION METHOD, AND ADJUSTMENT DETERMINATION INFORMATION GENERATION PROGRAM |
| JP2015090691A (en) | 2013-11-07 | 2015-05-11 | 株式会社エヌ・ティ・ティ・データ | Prediction device, prediction method, and program |
| JP2019135451A (en) | 2018-02-05 | 2019-08-15 | 株式会社日立製作所 | Weather prediction correcting technique and weather prediction system |
Family Cites Families (11)
| Publication number | Priority date | Publication date | Assignee | Title |
|---|---|---|---|---|
| JPH11125449A (en) * | 1997-10-22 | 1999-05-11 | Ntt Power And Building Facilities Inc | Heat load prediction device |
| US6785836B2 (en) * | 2001-04-11 | 2004-08-31 | Broadcom Corporation | In-place data transformation for fault-tolerant disk storage systems |
| US20040148047A1 (en) | 2001-12-18 | 2004-07-29 | Dismukes John P | Hierarchical methodology for productivity measurement and improvement of productions systems |
| US7190847B2 (en) * | 2002-02-12 | 2007-03-13 | International Business Machines Corporation | Method, system, and program for fractionally shifting data subject to a previous transformation |
| US7203878B2 (en) * | 2002-07-19 | 2007-04-10 | Sun Microsystems, Inc. | System and method for performing predictable signature analysis in the presence of multiple data streams |
| US7464294B2 (en) * | 2004-09-20 | 2008-12-09 | International Business Machines Corporation | Monitoring method with trusted corrective actions |
| JP4836608B2 (en) * | 2006-02-27 | 2011-12-14 | 株式会社東芝 | Semiconductor memory device |
| US20140298097A1 (en) * | 2013-03-28 | 2014-10-02 | General Electric Company | System and method for correcting operational data |
| JP2018014000A (en) * | 2016-07-21 | 2018-01-25 | 富士通株式会社 | Test support program, test support system, and test support method |
| TWI602188B (en) * | 2017-01-03 | 2017-10-11 | 慧榮科技股份有限公司 | Method for performing data management in memory device, and associated memory device and controller thereof |
| JP7491049B2 (en) * | 2020-05-19 | 2024-05-28 | 富士通株式会社 | Anomaly detection method and anomaly detection program |
-
2021
- 2021-04-20 JP JP2021071101A patent/JP7626657B2/en active Active
-
2022
- 2022-02-28 US US17/681,968 patent/US11829226B2/en active Active
Patent Citations (3)
| Publication number | Priority date | Publication date | Assignee | Title |
|---|---|---|---|---|
| JP2009169959A (en) | 2009-02-18 | 2009-07-30 | Rakuten Inc | INFORMATION PROVIDING SYSTEM, INFORMATION PROVIDING DEVICE, ADJUSTMENT DETERMINATION INFORMATION GENERATION METHOD, AND ADJUSTMENT DETERMINATION INFORMATION GENERATION PROGRAM |
| JP2015090691A (en) | 2013-11-07 | 2015-05-11 | 株式会社エヌ・ティ・ティ・データ | Prediction device, prediction method, and program |
| JP2019135451A (en) | 2018-02-05 | 2019-08-15 | 株式会社日立製作所 | Weather prediction correcting technique and weather prediction system |
Also Published As
| Publication number | Publication date |
|---|---|
| JP2022165669A (en) | 2022-11-01 |
| US20220334909A1 (en) | 2022-10-20 |
| US11829226B2 (en) | 2023-11-28 |
Similar Documents
| Publication | Publication Date | Title |
|---|---|---|
| JP6354755B2 (en) | System analysis apparatus, system analysis method, and system analysis program | |
| JP6875179B2 (en) | System analyzer and system analysis method | |
| US10747188B2 (en) | Information processing apparatus, information processing method, and, recording medium | |
| US9753801B2 (en) | Detection method and information processing device | |
| CN114528934A (en) | Time series data abnormity detection method, device, equipment and medium | |
| CN111045894A (en) | Database anomaly detection method and device, computer equipment and storage medium | |
| JP6521096B2 (en) | Display method, display device, and program | |
| JP6183450B2 (en) | System analysis apparatus and system analysis method | |
| CN114169604A (en) | Performance index abnormality detection method, abnormality detection device, electronic apparatus, and storage medium | |
| JP6183449B2 (en) | System analysis apparatus and system analysis method | |
| JP5771317B1 (en) | Abnormality diagnosis apparatus and abnormality diagnosis method | |
| JP5387779B2 (en) | Operation management apparatus, operation management method, and program | |
| JP7632613B2 (en) | Anomaly cause estimation device, anomaly cause estimation method, and program | |
| JP7626657B2 (en) | Anomaly detection device, anomaly detection method, and anomaly detection program | |
| CN108664603A (en) | A kind of method and device of abnormal polymerization value that repairing time series data | |
| JP6915693B2 (en) | System analysis method, system analyzer, and program | |
| JP6777142B2 (en) | System analyzer, system analysis method, and program | |
| EP3999983B1 (en) | Time-series data condensation and graphical signature analysis | |
| WO2021074995A1 (en) | Threshold value acquisition device, method, and program | |
| JP2014153736A (en) | Fault symptom detection method, program and device | |
| JP6973445B2 (en) | Display method, display device, and program | |
| US10157113B2 (en) | Information processing device, analysis method, and recording medium | |
| JP6405851B2 (en) | Predictive detection support program, method, apparatus, and predictive detection program, | |
| US20250085703A1 (en) | Fault diagnosis in multi-component systems | |
| JP2024003329A (en) | Anomaly detection device, anomaly detection method, and anomaly detection program |
Legal Events
| Date | Code | Title | Description |
|---|---|---|---|
| A621 | Written request for application examination |
Free format text: JAPANESE INTERMEDIATE CODE: A621 Effective date: 20240213 |
|
| A977 | Report on retrieval |
Free format text: JAPANESE INTERMEDIATE CODE: A971007 Effective date: 20241211 |
|
| TRDD | Decision of grant or rejection written | ||
| A01 | Written decision to grant a patent or to grant a registration (utility model) |
Free format text: JAPANESE INTERMEDIATE CODE: A01 Effective date: 20250107 |
|
| A61 | First payment of annual fees (during grant procedure) |
Free format text: JAPANESE INTERMEDIATE CODE: A61 Effective date: 20250123 |
|
| R150 | Certificate of patent or registration of utility model |
Ref document number: 7626657 Country of ref document: JP Free format text: JAPANESE INTERMEDIATE CODE: R150 |