KR20200052401A - System Anomaly Behavior Analysis Technology based on Deep Learning Using Imaged Data - Google Patents
System Anomaly Behavior Analysis Technology based on Deep Learning Using Imaged Data Download PDFInfo
- Publication number
- KR20200052401A KR20200052401A KR1020180126799A KR20180126799A KR20200052401A KR 20200052401 A KR20200052401 A KR 20200052401A KR 1020180126799 A KR1020180126799 A KR 1020180126799A KR 20180126799 A KR20180126799 A KR 20180126799A KR 20200052401 A KR20200052401 A KR 20200052401A
- Authority
- KR
- South Korea
- Prior art keywords
- data
- numeric
- abnormal behavior
- imaging
- encoding
- Prior art date
- Legal status (The legal status is an assumption and is not a legal conclusion. Google has not performed a legal analysis and makes no representation as to the accuracy of the status listed.)
- Ceased
Links
Images


Classifications
-
- G—PHYSICS
- G06—COMPUTING OR CALCULATING; COUNTING
- G06V—IMAGE OR VIDEO RECOGNITION OR UNDERSTANDING
- G06V10/00—Arrangements for image or video recognition or understanding
- G06V10/70—Arrangements for image or video recognition or understanding using pattern recognition or machine learning
- G06V10/764—Arrangements for image or video recognition or understanding using pattern recognition or machine learning using classification, e.g. of video objects
-
- G—PHYSICS
- G06—COMPUTING OR CALCULATING; COUNTING
- G06N—COMPUTING ARRANGEMENTS BASED ON SPECIFIC COMPUTATIONAL MODELS
- G06N3/00—Computing arrangements based on biological models
- G06N3/02—Neural networks
- G06N3/04—Architecture, e.g. interconnection topology
- G06N3/044—Recurrent networks, e.g. Hopfield networks
- G06N3/0442—Recurrent networks, e.g. Hopfield networks characterised by memory or gating, e.g. long short-term memory [LSTM] or gated recurrent units [GRU]
-
- G06K9/481—
-
- G—PHYSICS
- G06—COMPUTING OR CALCULATING; COUNTING
- G06N—COMPUTING ARRANGEMENTS BASED ON SPECIFIC COMPUTATIONAL MODELS
- G06N3/00—Computing arrangements based on biological models
- G06N3/02—Neural networks
- G06N3/04—Architecture, e.g. interconnection topology
- G06N3/045—Combinations of networks
- G06N3/0455—Auto-encoder networks; Encoder-decoder networks
-
- G—PHYSICS
- G06—COMPUTING OR CALCULATING; COUNTING
- G06N—COMPUTING ARRANGEMENTS BASED ON SPECIFIC COMPUTATIONAL MODELS
- G06N3/00—Computing arrangements based on biological models
- G06N3/02—Neural networks
- G06N3/04—Architecture, e.g. interconnection topology
- G06N3/0464—Convolutional networks [CNN, ConvNet]
-
- G—PHYSICS
- G06—COMPUTING OR CALCULATING; COUNTING
- G06N—COMPUTING ARRANGEMENTS BASED ON SPECIFIC COMPUTATIONAL MODELS
- G06N3/00—Computing arrangements based on biological models
- G06N3/02—Neural networks
- G06N3/08—Learning methods
-
- G—PHYSICS
- G06—COMPUTING OR CALCULATING; COUNTING
- G06N—COMPUTING ARRANGEMENTS BASED ON SPECIFIC COMPUTATIONAL MODELS
- G06N3/00—Computing arrangements based on biological models
- G06N3/02—Neural networks
- G06N3/08—Learning methods
- G06N3/09—Supervised learning
-
- G—PHYSICS
- G06—COMPUTING OR CALCULATING; COUNTING
- G06T—IMAGE DATA PROCESSING OR GENERATION, IN GENERAL
- G06T3/00—Geometric image transformations in the plane of the image
- G06T3/40—Scaling of whole images or parts thereof, e.g. expanding or contracting
-
- G—PHYSICS
- G06—COMPUTING OR CALCULATING; COUNTING
- G06V—IMAGE OR VIDEO RECOGNITION OR UNDERSTANDING
- G06V10/00—Arrangements for image or video recognition or understanding
- G06V10/40—Extraction of image or video features
- G06V10/46—Descriptors for shape, contour or point-related descriptors, e.g. scale invariant feature transform [SIFT] or bags of words [BoW]; Salient regional features
- G06V10/469—Contour-based spatial representations, e.g. vector-coding
Landscapes
- Engineering & Computer Science (AREA)
- Theoretical Computer Science (AREA)
- Physics & Mathematics (AREA)
- General Physics & Mathematics (AREA)
- General Health & Medical Sciences (AREA)
- Health & Medical Sciences (AREA)
- Artificial Intelligence (AREA)
- Software Systems (AREA)
- Computing Systems (AREA)
- Evolutionary Computation (AREA)
- Biomedical Technology (AREA)
- Molecular Biology (AREA)
- Data Mining & Analysis (AREA)
- General Engineering & Computer Science (AREA)
- Computational Linguistics (AREA)
- Mathematical Physics (AREA)
- Biophysics (AREA)
- Life Sciences & Earth Sciences (AREA)
- Computer Vision & Pattern Recognition (AREA)
- Multimedia (AREA)
- Databases & Information Systems (AREA)
- Medical Informatics (AREA)
- Image Analysis (AREA)
Abstract
Description
본 발명은 이상 행위 분석 기술에 관한 것으로, 보다 자세하게는 데이터 이미지화를 이용한 딥러닝 기반 시스템 이상 행위 분석 기술에 관한 것이다.The present invention relates to an abnormal behavior analysis technology, and more particularly, to a deep learning based system abnormal behavior analysis technology using data imaging.
최근 들어 분석대상 시스템(예컨대 네트워크 시스템, 계측 시스템, 제어 시스템 등의 각종 시스템)의 단일 채널(Single-channel) 또는 다중 채널(multi-channel)을 통해 입력되는 패킷 데이터를 분석하여 분석대상 시스템에서 이상 행위(Abnormal Behavior) 등을 실시간으로 검출하고자 하는 노력이 이루어지고 있다.Recently, the analytical system analyzes packet data input through a single channel or multi-channel of an analysis target system (for example, various systems such as a network system, a measurement system, and a control system). Efforts are being made to detect behavior, such as Abnormal Behavior, in real time.
기존의 통계적 머신러닝(Machine Learning) 기법을 이용한 이상 행위 분석 방법에 대해서 도 1 및 도 2를 참고하여 살펴본다.An anomaly analysis method using a conventional statistical machine learning technique will be described with reference to FIGS. 1 and 2.
도 1에 예시된 것과 같이, 행-기반 클러스터링(Row-wise Clustering)을 통해 'K-NN Clustering' 방식으로 데이터 분석을 하는 경우, 다중 채널 신호의 피처(Feature)를 활용한 다중 채널 정적 분석이 가능하다. 그러나 시간적인 데이터 시퀀스(data sequence)의 과거 정보를 활용할 수 없는 문제점이 있다.As illustrated in FIG. 1, when performing data analysis in a 'K-NN Clustering' method through row-wise clustering, multi-channel static analysis using a feature of a multi-channel signal is performed. It is possible. However, there is a problem in that past information of a temporal data sequence cannot be utilized.
한편 도 2에 예시된 것과 같이, 열-기반 프로세싱(Column-wise Processing)을 통해 'Column-wise LSTM(Long Short Term Memory) anomaly' 방식으로 데이터 분석을 하는 경우, 과거 정보를 분석에 활용할 수 있다. 그러나 다중 채널의 복합 신호의 피처를 활용하여 종합적 다변량 분석 및 예측은 불가능하다는 문제점이 있다.On the other hand, as illustrated in FIG. 2, when performing data analysis in a 'Column-wise Long Short Term Memory (LSTM) anomaly' method through column-wise processing, past information may be used for analysis . However, there is a problem that comprehensive multivariate analysis and prediction cannot be performed by utilizing the features of a multi-channel composite signal.
특히 제어망 시스템은 원격지의 시스템을 효율적으로 감시하고, 관리하는 목적으로 사용되는 시스템으로, 전력, 가스, 상하수도, 교통 등의 국가주요시설의 운용에 사용되고 있다. 비공개 제어망 시스템 프로토콜 표준이 점차 국제 표준으로 공개됨에 따라, 공개된 표준은 공격자에게 제어망 시스템 및 네트워크 동작에 대한 더 많은 지식을 제공하게 되었으며, 점차적으로 제어망 시스템에 대한 사이버침해의 가능성과 위험성이 높아지고 있다.In particular, the control network system is a system used for the purpose of efficiently monitoring and managing remote systems, and is used for the operation of major national facilities such as power, gas, water and sewage, and transportation. As the private control network system protocol standard was gradually released as an international standard, the published standard provided attackers with more knowledge of the control network system and network operation, and the possibility and risk of cyber infringement on the control network system gradually. This is getting higher.
따라서 본 발명이 해결하려는 과제는 제어망 시스템과 같은 분석 대상 시스템의 상태와 관련된 분석 대상 데이터를 이미지화한 후 딥러닝 기반의 이미지 인식을 통해 분석 대상 시스템에서의 이상 행위를 분류 및 인식하는 기술을 제공하는 것이다.Therefore, the problem to be solved by the present invention is to provide a technique for classifying and recognizing anomalous behavior in an analysis target system through image recognition based on deep learning after imaging an analysis target data related to a state of an analysis target system such as a control network system. Is to do.
상기한 기술적 과제를 해결하기 위한 본 발명에 따른 데이터 이미지화를 이용한 이상 행위 분석 방법은 분석 대상 시스템의 네트워크 패킷 데이터를 입력받는 단계, 상기 입력된 네트워크 패킷 데이터에서 특징(feature) 데이터 부분을 선택받는 단계, 상기 선택된 특징 데이터 부분을 분석하여 특징 벡터를 추출하는 단계, 상기 추출된 특징 벡터를 이미지 데이터로 변환하는 단계, 그리고 상기 변환된 이미지 데이터를 학습 데이터로 신경망 모델을 학습시켜 상기 분석 대상 시스템의 이상 행위 분류 예측 모델을 생성하는 단계를 포함한다.In order to solve the above technical problem, an abnormal behavior analysis method using data imaging according to the present invention comprises receiving network packet data of an analysis target system, and selecting a feature data portion from the input network packet data. , Extracting a feature vector by analyzing the selected feature data portion, converting the extracted feature vector into image data, and training the neural network model with the transformed image data as training data to abnormalize the system to be analyzed And generating a behavior classification prediction model.
상기 선택된 특징 데이터 부분을 분석하여 특징 벡터를 추출하는 단계는, 상기 선택된 특징 데이터 부분을 수치형 데이터(Numerical Data)와 비수치형 데이터(Non-numerical Data)로 구분하는 단계, 상기 수치형 데이터와 상기 비수치형 데이터를 각각 미리 정해진 방법으로 전처리하는 단계, 상기 전처리된 수치형 데이터와 비수치형 데이터를 조합하여 2차원 벡터로 전환하는 단계, 그리고 상기 2차원 벡터로부터 상기 특징 벡터를 추출하는 단계를 포함할 수 있다.The step of analyzing the selected feature data portion and extracting a feature vector may include dividing the selected feature data portion into numerical data and non-numerical data, and the numerical data and the And pre-processing each of the non-numeric data in a predetermined manner, converting the pre-processed numerical data and non-numeric data into a two-dimensional vector, and extracting the feature vector from the two-dimensional vector. Can be.
상기 수치형 데이터와 상기 비수치형 데이터를 각각 미리 정해진 방법으로 전처리하는 단계는, 상기 수치형 데이터를 정규화(normalization)하는 단계, 그리고 상기 비수치형 데이터를 행렬(matrix) 형태로 인코딩하는 단계를 포함할 수 있다.The pre-processing of the numeric data and the non-numeric data in a predetermined manner may include normalizing the numeric data and encoding the non-numeric data in a matrix form. Can be.
상기 수치형 데이터의 정규화는 최소최대 스케일링(MinMax-scaling) 기법으로 수행되고, 상기 비수치형 데이터의 행렬 형태 인코딩은 원-핫 인코딩(One-Hot Encoding), 오디날 인코딩(Ordinal Encoding), 합 인코딩(Sum Encoding), 바이너리 인코딩(Binary Encoding) 중 하나의 기법으로 수행될 수 있다.The normalization of the numeric data is performed by a MinMax-scaling technique, and the matrix-type encoding of the non-numeric data is one-hot encoding, ordinary encoding, and sum encoding. It can be performed by one of (Sum Encoding) and Binary Encoding.
상기 2차원 벡터는 상기 정규화된 수치형 데이터와 상기 형렬 형태로 인코딩된 비수치형 데이터를 조합한 것일 수 있다.The 2D vector may be a combination of the normalized numerical data and non-numeric data encoded in the matrix form.
상기 2차원 벡터로부터 상기 특징 벡터를 추출하는 단계는, 상기 2차원 벡터의 연관성 및 분산에 기초하여 상기 특징 벡터를 추출할 수 있다.In the step of extracting the feature vector from the 2D vector, the feature vector may be extracted based on the association and variance of the 2D vector.
상기 분석 대상 시스템에서 입력되는 네트워크 패킷 데이터로부터 생성되는 이미지 데이터를 입력으로 상기 이상 행위 분류 예측 모델을 이용하여 상기 분석 대상 시스템의 이상 행위를 분류 예측하는 단계를 더 포함할 수 있다. The method may further include classifying and predicting an abnormal behavior of the system to be analyzed by using the abnormal behavior classification prediction model as input of image data generated from network packet data input from the system to be analyzed.
상기한 기술적 과제를 해결하기 위한 본 발명에 따른 데이터 이미지화를 이용한 이상 행위 분석 시스템은, 분석 대상 시스템의 네트워크 패킷 데이터를 입력받는 입력부, 상기 입력된 네트워크 패킷 데이터에서 특징(feature) 데이터 부분을 선택받고, 상기 선택된 특징 데이터 부분을 분석하여 특징 벡터를 추출하며, 상기 추출된 특징 벡터를 이미지 데이터로 변환하는 데이터 처리부, 그리고 상기 변환된 이미지 데이터를 학습 데이터로 신경망 모델을 학습시켜 상기 분석 대상 시스템의 이상 행위 분류 예측 모델을 생성하는 모델 생성부를 포함한다.An abnormal behavior analysis system using data imaging according to the present invention for solving the above technical problem, an input unit receiving network packet data of an analysis target system, and receiving a feature data portion from the input network packet data , A feature processing unit to extract the feature vector by analyzing the selected feature data portion, a data processing unit for converting the extracted feature vector to image data, and learning the neural network model from the transformed image data as training data to abnormalize the analysis target system And a model generator for generating a behavior classification prediction model.
컴퓨터에 상기 방법을 실행시키기 위한 프로그램을 기록한 컴퓨터로 읽을 수 있는 기록매체를 포함할 수 있다.It may include a computer-readable recording medium recording a program for executing the method on a computer.
본 발명에 의하면 분석 대상 시스템의 상태와 관련된 분석 대상 데이터를 이미지화한 후 딥러닝 기반의 이미지 인식을 통해 분석 대상 시스템에서의 이상 행위를 분류 및 인식할 수 있다.According to the present invention, it is possible to classify and recognize abnormal behavior in the system to be analyzed through image recognition based on deep learning after imaging the data to be analyzed related to the state of the system to be analyzed.
도 1 및 도 2는 기존의 시스템 이상 행위 탐지 및 예측 방법을 설명하기 위해 제공되는 도면이다.
도 3은 본 발명의 일 실시예에 따른 데이터 이미지화를 이용한 이상 행위 분석 시스템의 구성을 나타낸 블록도이다.
도 4는 요청 패킷과 응답 패킷을 묶은 DNP3 프로토콜 로그를 예시한 도면이다.
도 5는 한 세션에 속한 로그 데이터를 묶은 예를 나타낸 것이다.
도 6은 본 발명에 따른 네트워크 패킷 데이터에서 특징 데이터 부분이 선택된 예를 나타낸 것이다.
도 7은 본 발명의 일 실시예에 따른 네트워크 패킷 데이터에서 선택된 특징 데이터 부분을 수치형 데이터와 비수치형 데이터로 구분한 예를 나타낸 것이다.
도 8은 본 발명에 따른 수치형 데이터의 정규화 처리를 예시한 도면이다.
도 9는 본 발명에 따른 비수치형 데이터의 벡터화 전처리를 예시한 도면이다.
도 10은 본 발명에 따른 전처리된 수치형 데이터와 비수치형 데이터를 조합하여 2차원 벡터로 전환한 예를 나타낸 것이다.
도 11은 본 발명에 따른 2차원 벡터로부터 특징 벡터를 추출하는 예를 나타낸 것이다.
도 12은 본 발명에 따른 특징 벡터를 이미지 벡터로 변환한 예를 나타낸 것이다.
도 13은 본 발명의 일 실시예에 따른 데이터 이미지화를 이용한 이상 행위 분석 시스템의 동작을 설명하는 흐름도이다.1 and 2 are diagrams provided to explain a conventional system anomaly detection and prediction method.
3 is a block diagram showing the configuration of an abnormal behavior analysis system using data imaging according to an embodiment of the present invention.
4 is a diagram illustrating a DNP3 protocol log that bundles a request packet and a response packet.
5 shows an example of grouping log data belonging to one session.
6 shows an example in which a feature data portion is selected from network packet data according to the present invention.
7 illustrates an example of dividing a feature data portion selected from network packet data into numerical data and non-numeric data according to an embodiment of the present invention.
8 is a diagram illustrating normalization processing of numeric data according to the present invention.
9 is a diagram illustrating a vectorized preprocessing of non-numeric data according to the present invention.
10 shows an example of converting a pre-processed numeric data and non-numeric data data into a two-dimensional vector according to the present invention.
11 shows an example of extracting a feature vector from a two-dimensional vector according to the present invention.
12 shows an example of converting a feature vector according to the present invention into an image vector.
13 is a flowchart illustrating an operation of an abnormal behavior analysis system using data imaging according to an embodiment of the present invention.
그러면 첨부한 도면을 참고로 하여 본 발명의 실시예에 대하여 본 발명이 속하는 기술 분야에서 통상의 지식을 가진 자가 용이하게 실시할 수 있도록 상세히 설명한다.Then, embodiments of the present invention will be described in detail with reference to the accompanying drawings so that those skilled in the art to which the present invention pertains may easily practice.
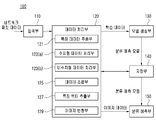
도 3은 본 발명의 일 실시예에 따른 데이터 이미지화를 이용한 이상 행위 분석 시스템의 구성을 나타낸 블록도이다.3 is a block diagram showing the configuration of an abnormal behavior analysis system using data imaging according to an embodiment of the present invention.
도 3을 참고하면, 본 발명의 일 실시예에 따른 데이터 이미지화를 이용한 이상 행위 분석 시스템(100)은 입력부(110), 데이터 처리부(120), 모델 생성부(130), 저장부(140) 및 분류 예측부(150)를 포함할 수 있다.Referring to FIG. 3, an abnormal
입력부(110)는 분석 대상 시스템으로부터 분석 대상 시스템의 상태와 관련된 분석 대상 데이터를 입력받을 수 있다.The
여기서 분석 대상 시스템은 네트워크 시스템, 계측 시스템, 제어망 시스템 등과 같은 각종 시스템이 될 수 있다. 특히 제어망 시스템은 전력 생산ㆍ분배, 댐 운영, 가스 생산ㆍ유통, 수자원 관리 및 대규모 산업 플랜트 설비의 운영을 제어하고 관리하는 시스템 등을 포함할 수 있다.Here, the analysis target system may be various systems such as a network system, a measurement system, and a control network system. In particular, the control network system may include a system for controlling and managing power production and distribution, dam operation, gas production and distribution, water resource management, and operation of large-scale industrial plant facilities.
분석 대상 데이터는 분석 대상 시스템에서 수집 또는 생성되어 패킷 데이터 스트림으로 입력부(110)에 전달될 수 있다. 예컨대 분석 대상 데이터는 분석 대상 시스템에 설치된 센서로부터 전달되는 센서 데이터가 패킷 데이터 스트림으로 전달될 수 있다. 또한 분석 대상 데이터는 분석 대상 시스템 내에서 교환되거나, 분석 대상 시스템과 외부 시스템 사이에 교환되는 패킷 데이터일 수도 있다.The analysis target data may be collected or generated in the analysis target system and transmitted to the
한편 실시예에 따라서 이상 행위 분류 예측 모델의 학습을 위한 학습 데이터 생성 과정에서는 일정 기간 동안 수집된 패킷 데이터 로그가 입력부(110)에 입력될 수도 있다.Meanwhile, according to an embodiment, in the process of generating learning data for learning the abnormal behavior classification prediction model, the packet data log collected for a certain period may be input to the
데이터 처리부(120)는 입력부(110)를 통해 입력된 네트워크 패킷 데이터에서 특징(feature) 데이터 부분을 선택받고, 선택된 특징 데이터 부분을 분석하여 특징 벡터를 추출하며, 추출된 특징 벡터를 이미지 데이터로 변환하는 작업을 수행할 수 있다.The
이를 위해 데이터 처리부(120)는 특징 데이터 추출부(121), 수치형 데이터 처리부(123a), 비수치형 데이터 처리부(123b), 데이터 조합부(125), 특징 벡터 추출부(127) 및 이미지 변환부(129)를 포함할 수 있다.To this end, the
특징 데이터 추출부(121)는 입력된 네트워크 패킷 데이터에서 특징(feature) 데이터 부분을 추출할 수 있다.The
특징 데이터 추출부(121)는, 학습 과정, 즉 학습 데이터를 생성하는 과정에서는, 네트워크 패킷 데이터에서 전문가로부터 선택된 특징 데이터 부분을 추출한다. 그리고 학습이 완료된 후, 실제 이상행위 분석 과정에서는, 학습 과정에서 선택된 특징 데이터 부분에 대한 정보(예컨대 전문가에 의해 선택된 특징 데이터에 대응하는 컬럼 인덱스(column index))를 저장부(140)에 저장하고, 특징 데이터 추출부(121)가 이를 참조하여 네트워크 패킷 데이터에서 특징 데이터 부분을 추출하게 된다.The feature
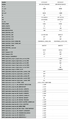
도 4는 요청 패킷과 응답 패킷을 묶은 DNP3 프로토콜 로그를 예시한 도면이고, 도 5는 본 발명에 따른 네트워크 패킷 데이터에서 특징 데이터 부분이 선택된 예를 나타낸 것이다.4 is a diagram illustrating a DNP3 protocol log that bundles a request packet and a response packet, and FIG. 5 shows an example in which a feature data portion is selected from network packet data according to the present invention.
분석 대상 시스템에서 이상 행위를 효율적으로 탐지하기 위해 패킷 로그별로 분석뿐만 아니라, 패킷 패턴 및 데이터 흐름을 파악해야 한다. 따라서, 도 4와 같이 요청(Request)-응답(Response) 패킷 로그끼리 묶어서 분석할 수 있다. 도 4에서 좌측은 요청 패킷이고, 우측은 응답 패킷이다. 요청-응답 패킷 로그끼리 묶어서 데이터 흐름을 살펴보면 연관성을 분석할 수 있다.In order to efficiently detect anomalies in the system under analysis, it is necessary to understand not only the analysis for each packet log, but also the packet pattern and data flow. Therefore, as shown in FIG. 4, request-response packet logs can be bundled and analyzed. 4, the left side is a request packet and the right side is a response packet. By associating request-response packet logs with each other, we can analyze the association by looking at the data flow.
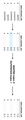
한편 도 5와 같이 한 세션에 속한 로그 데이터를 묶어서 분석할 수 있다.Meanwhile, as shown in FIG. 5, log data belonging to one session may be bundled and analyzed.
도 5는 한 세션에 속한 로그 데이터를 묶은 예를 나타낸 것이다.5 shows an example of grouping log data belonging to one session.
도 5를 참고하면, DNP3 프로토콜 로그 데이터를 원본 패킷에서 추출하여 한 세션에 속한 여러 개의 로그 데이터를 묶고, 데이터 흐름을 살펴보면 연관성을 분석할 수 있다.Referring to FIG. 5, DNP3 protocol log data is extracted from an original packet, and several log data belonging to a session are bundled, and correlation can be analyzed by examining the data flow.
위에서 설명한 방법 외에도 네트워크 패킷 데이터에서 특징 데이터 부분을 전문가 지식을 활용하여 선택할 수 있는 것으로 이해되어야 한다.In addition to the method described above, it should be understood that the feature data portion of the network packet data can be selected using expert knowledge.
도 6을 참고하면, 원본 네트워크 데이터 패킷에서 DNP3 프로토콜 로그를 추출하여, 추출된 로그에서 보안 전문가의 전문 지식으로 특징 데이터 부분이 40 컬럼 선택된 것을 예시하였다. 이상 행위 분류 예측 모델을 학습시킬 때, 무의미한 특징을 학습하면 분류 예측 성능이 떨어질 수 있으므로, 전문가의 전문 지식으로 학습에 사용할 특징 데이터 부분을 선택하여 추출하는 것이 중요할 수 있다.Referring to FIG. 6, the DNP3 protocol log is extracted from the original network data packet, and it is illustrated that 40 columns of feature data are selected from the extracted log with expertise of a security expert. When learning an abnormal behavior classification prediction model, learning the meaningless features may degrade the classification prediction performance, so it may be important to select and extract a feature data portion to be used for learning with expert expertise.
이와 같이 전문가에 의해 네트워크 패킷 데이터에서 특징 데이터 부분이 선택되어 설정되면, 해당 특징 데이터 부분에 대응하는 컬럼 인덱스를 저장해놓고, 이후 특징 데이터 추출부(121)는 자동으로 입력된 네트워크 패킷 데이터에서 특징 데이터 부분을 선택하여 추출할 수 있다.When the feature data portion is selected and set from the network packet data by an expert in this way, the column index corresponding to the feature data portion is stored, and then the feature
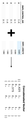
도 7은 본 발명의 일 실시예에 따른 네트워크 패킷 데이터에서 선택된 특징 데이터 부분을 수치형 데이터와 비수치형 데이터로 구분한 예를 나타낸 것이다.7 illustrates an example of dividing a feature data portion selected from network packet data into numerical data and non-numeric data according to an embodiment of the present invention.
데이터 처리부(120)는 도 7에 예시한 것과 같이 네트워크 패킷 데이터에서 선택된 특징 데이터 부분을 수치형 데이터(Numerical Data)와 비수치형 데이터(Non-numerical Data)로 구분하고, 각각 미리 정해진 방법으로 전처리할 수 있다.The
수치형 데이터 처리부(123a)는 수치형 데이터를 정규화(normalization)할 수 있다.The numeric data processing unit 123a may normalize the numeric data.
도 8은 본 발명에 따른 수치형 데이터의 정규화 처리를 예시한 도면이다.8 is a diagram illustrating normalization processing of numeric data according to the present invention.
도 8을 참고하면, 수치형 데이터에 대해서는 최소최대 스케일링(MinMax-scaling) 기법으로 스케일링을 수행할 수 있다. 최소최대 스케일링 기법은 수치형 데이터를 0~1 범위로 변환시키는 것으로, 가장 큰 숫자를 1로 맞추고, 가장 작은 숫자를 0으로 변환하고, 그 사이에 있는 숫자를 배율에 맞게 변환시킨다. 실시예에 따라 가장 큰 숫자를 255로 맞추고, 가장 작은 숫자를 0으로 변환하고, 그 사이에 있는 숫자를 배율에 맞게 변환시키는 것도 가능하다. 이미지 데이터의 픽셀값을 0~255의 범위 즉 256단계로 표현할 수 있다. 따라서 수치형 데이터를 0~1 범위로 변환시킨 경우는 다시 0~255의 범위로 스케일링을 하는 것이 필요하다.Referring to FIG. 8, scaling may be performed on the numeric data using a MinMax-scaling technique. The minimum and maximum scaling method converts numeric data to the range of 0 to 1, sets the largest number to 1, converts the smallest number to 0, and converts the numbers in between to scale. Depending on the embodiment, it is also possible to set the largest number to 255, convert the smallest number to 0, and convert the number in between to fit the magnification. The pixel value of the image data can be expressed in a range of 0 to 255, that is, 256 steps. Therefore, when the numeric data is converted to the range of 0 to 1, it is necessary to scale again to the range of 0 to 255.
비수치형 데이터 처리부(123b)는 비수치형 데이터를 행렬(matrix) 형태로 인코딩할 수 있다.The non-numeric data processing unit 123b may encode the non-numeric data in a matrix form.
도 9는 본 발명에 따른 비수치형 데이터의 벡터화 전처리를 예시한 도면이다.9 is a diagram illustrating a vectorized pre-processing of non-numeric data according to the present invention.
도 9를 참고하면, 비수치형 데이터의 행렬 형태 인코딩은 원-핫 인코딩(One-Hot Encoding) 기법으로 수행될 수 있다. 텍스트로 되어 있는 비수치형 데이터를 분류 학습하기 위해서 행렬 형태로 인코딩하기 위한 원-핫 인코딩 기법에 대해서는 이미 잘 알려져 있으므로 이에 대한 구체적 설명은 생략한다. 물론 원-핫 인코딩 기법이 아닌 다른 방법, 예를 들면, 오디날 인코딩(Ordinal Encoding), 합 인코딩(Sum Encoding), 바이너리 인코딩(Binary Encoding) 등을 통해 비수치형 데이터를 행렬 형태로 벡터화하는 것도 가능하며 그 외 다른 방법을 사용할 수도 있다. 비수치형 데이터를 행렬 형태 벡터로 변환할 때 행렬 요소에 해당하는 값을 0~255 범위를 가지도록 변환할 수 있다. 또는 앞서 설명한 것과 같이 0~1 범위로 변환하고, 다시 0~255 범위로 스케일링할 수도 있다.Referring to FIG. 9, matrix-type encoding of non-numeric data may be performed by a one-hot encoding technique. Since the one-hot encoding technique for encoding in the form of a matrix to classify and learn non-numeric data in text is already well known, a detailed description thereof will be omitted. Of course, it is also possible to vectorize non-numerical data in a matrix form through methods other than the one-hot encoding method, for example, Ordinary Encoding, Sum Encoding, or Binary Encoding. And other methods may be used. When converting non-numeric data into a matrix vector, the value corresponding to the matrix element can be converted to have a range of 0 to 255. Alternatively, as described above, it can be converted to a range of 0 to 1 and scaled back to a range of 0 to 255.
데이터 조합부(125)는 수치형 데이터 처리부(123a)에서 전처리된 수치형 데이터와 비수치형 데이터 처리부(123b)에서 전처리된 비수치형 데이터를 조합하여 2차원 벡터로 전환할 수 있다.The
도 10은 본 발명에 따른 전처리된 수치형 데이터와 비수치형 데이터를 조합하여 2차원 벡터로 전환한 예를 나타낸 것이다.10 shows an example of converting a pre-processed numeric data and non-numeric data data into a two-dimensional vector according to the present invention.
데이터 조합부(125)는 도 10에 예시한 것과 같이 수치형 데이터와 비수치형 데이터를 조합하여 2차원 벡터로 전환할 수 있다.As illustrated in FIG. 10, the
특징 벡터 추출부(127)는 데이터 조합부(125)에서 전환된 2차원 벡터로부터 특징 벡터를 추출할 수 있다.The feature
도 11은 본 발명에 따른 2차원 벡터로부터 특징 벡터를 추출하는 예를 나타낸 것이다.11 shows an example of extracting a feature vector from a two-dimensional vector according to the present invention.
도 11(a)는 통계적인 기법을 이용하여 특징별로 분포를 찾거나 분산이 낮은 특징을 제거하는 것을 예시한 것이다. FIG. 11 (a) is an example of finding a distribution for each feature using a statistical technique or removing a feature having a low variance.
도 11(a)는 분산이 일부 임계값을 충족하지 않는 모든 특징을 제거하는 'VarianceThreshold' 방법을 이용하여 어떤 기준보다 작은 분산을 가진 열을 제거하거나 분산 0을 가진 열을 제거한 나머지 열로 결과 벡터가 이루어진 예를 나타내었다. 기준이 되는 분산 임계값(VarianceThreshold)은 전문가 지식으로 설정하여 이용할 수 있다.Fig. 11 (a) shows the result vector as the remaining columns by removing the column with the variance less than any criterion or by removing the column with the
도 11(b)는 상관 행렬을 통해 특징끼리 연관성을 분석하여, 특징끼리 연관성을 분석하는 기법을 적용하여 연관성 100% 있는 특징을 제거할 수 있다. 11 (b) analyzes correlations between features through a correlation matrix, and applies a technique of analyzing correlations between features to remove features having 100% correlation.
행렬 특징끼리 연관성을 계산하는 방식은 여러 가지 방법이 있을 수 있다. Pearson Correlation, Kendall, Spearman 등의 방법을 이용할 수 있다. 특징끼리 연관성을 찾아서 여러 행이나 열을 같은 연관성을 가지고 있으면, 그 행이나 열들이 같은 정보량을 가지고 있다고 가정할 수 있다. 그래서 같은 정보량을 가진 열이나 행을 제거하여 나머지 결과 백터들만 특징 벡터로 사용할 수 있다.There are many ways to calculate the association between matrix features. Methods such as Pearson Correlation, Kendall, and Spearman can be used. If you find correlations between features and have multiple rows or columns with the same association, you can assume that the rows or columns have the same amount of information. So, by removing columns or rows with the same amount of information, only the remaining result vectors can be used as feature vectors.
여기서 설명한 것 외에 다양한 방법으로 2차원 벡터로부터 특징 벡터를 추출할 수 있는 것으로 이해하여야 한다.It should be understood that a feature vector can be extracted from a two-dimensional vector in various ways other than those described herein.
물론 실시예에 따라서 데이터 조합부(125)에서 조합된 2차원 벡터를 바로 특징 벡터로 이용할 수도 있다.Of course, according to the embodiment, the 2D vector combined by the
도 12은 본 발명에 따른 특징 벡터를 이미지 벡터로 변환한 예를 나타낸 것이다.12 shows an example of converting a feature vector according to the present invention into an image vector.
이미지 변환부(129)는 특징 벡터 추출부(127)에서 추출된 특징 벡터를 입력받아 이미지 데이터로 변환할 수 있다.The
도 12(a)는 0~1 범위로 전처리 된 2차원 특징 벡터를 나타내고, 도 12(b)는 도 12(a)에 예시한 2차원 특징 벡터를 0~255 범위로 스케일링한 2차원 특징 벡터를 나타낸다. 이미지 변환부(129)는 도 12(b)에 예시한 2차원 특징 벡터를 입력 받아 도 12(c)에 예시한 것과 같이 각 픽셀의 픽셀값을 0~255, 256단계로 표현하는 이미지 데이터 포맷으로 변환할 수 있다. 예컨대 각 화소의 밝기값을 256 단계로 나타내는 그레이스케일 이미지 데이터로 변환할 수 있다. 실시예에 따라서는 RGB 컬러 이미지 데이터로 변환할 수도 있다.12 (a) shows a 2D feature vector pre-processed in the range of 0 to 1, and FIG. 12 (b) shows a 2D feature vector obtained by scaling the 2D feature vector illustrated in FIG. 12 (a) to a range of 0 to 255. Indicates. The
모델 생성부(130)는 이미지 변환부(129)에서 변환된 이미지 데이터를 학습 데이터로 신경망 모델을 학습시켜 분석 대상 시스템의 이상 행위 분류 예측 모델을 생성할 수 있다. The
모델 생성부(130)에서 학습되는 신경망 모델은 콘볼루션 신경망(Convolution neural network)(CNN)과 같은 딥러닝(기계학습) 알고리즘 형태일 수 있다. 영상 인식에서 우수한 성능을 가지는 인셉션 모듈(inception module) 기반 콘볼루션 신경망(Convolutional Neural Networks, CNN), 심층 신경망(Deep Neural Network, DNN), 재귀 신경망(Recurrent Neural Network, RNN), 제한 볼츠만 머신(restricted Boltzmann machine), 심층 신뢰 신경망(Deep Belief Network, DBN), 심층 Q-네트워크(Deep Q-Network), 오토인코더(Autoencoder) 등과 같이 다양한 딥 러닝 기법이 적용된 신경망 알고리즘이 사용될 수 있다.The neural network model trained by the
오토인코더(Autoencoder)는 특징 벡터(x)를 입력받아 동일한 또는 유사한 벡터(x')를 출력하는 신경망 모델로, 출력값을 입력값과 최대한 비슷하게 만들려는 모델이다. 따라서 신경망 모델로 오토인코더를 이용하여 학습하면, 입력 이미지 데이터 중에 이상한 이미지가 들어가 있으면 입력 이미지와 출력 이미지가 많이 달라진다. 그래서 입력과 출력이 얼마나 다른지 오차로 판단하여 많이 다르면 이상 징후로 판단할 수 있다.Autoencoder (Autoencoder) is a neural network model that receives a feature vector (x) and outputs the same or similar vector (x '), which is a model that makes the output value as close as possible to the input value. Therefore, when learning using an auto-encoder as a neural network model, if a strange image is included in the input image data, the input image and the output image vary greatly. Therefore, it is possible to judge how much difference between the input and the output is an error, and if it is very different, it can be judged as an abnormal symptom.
저장부(140)는 이상 행위 분석 시스템(100)의 동작과 관련된 각종 정보 및 데이터를 저장할 수 있다. 앞서 설명한 신경망 모델 학습을 위해 생성된 학습 데이터, 학습 과정에서 선택된 특징 데이터 부분에 대한 정보, 모델 생성부(130)에서 생성된 이상 행위 분류 예측 모델 등을 저장할 수 있다.The
분류 예측부(150)는 학습 완료 후에 모델 생성부(130)에서 생성된 이상 행위 분류 예측 모델을 이용하여, 데이터 처리부(120)에서 이미지 데이터로 변환되어 입력되는 분석 대상 데이터를 분류해내고, 분류 결과를 기초로 분석 대상 시스템의 이상 행위를 분류 및 예측할 수 있다.The
도 13은 본 발명의 일 실시예에 따른 데이터 이미지화를 이용한 이상 행위 분석 시스템의 동작을 설명하는 흐름도이다.13 is a flowchart illustrating an operation of an abnormal behavior analysis system using data imaging according to an embodiment of the present invention.
도 3 내지 도 13을 참고하면, 먼저 입력부(110)는 분석 대상 시스템으로부터 분석 대상 시스템의 상태와 관련된 분석 대상 데이터인 네트워크 패킷 데이터를 입력받을 수 있다(S1310). 단계(S1310)에서 분석 대상 데이터는 학습 기간 동안 분석 대상 시스템에서 수집 또는 생성되어 패킷 데이터 스트림으로 전달되거나, 일정 기간동안 수집 저장된 패킷 데이터 로그 형태로 전달될 수도 있다.3 to 13, first, the
다음으로 데이터 처리부(120)는 입력부(110)를 통해 입력된 네트워크 패킷 데이터에서 특징(feature) 데이터 부분을 추출할 수 있다(S1320). 단계(S1320)에서 네트워크 패킷 데이터에서 전문가로부터 선택된 특징 데이터 부분에 대한 정보를 저장부(140)에 저장하고, 나중에 특징 데이터 추출부(121)가 이를 참조하여 네트워크 패킷 데이터에서 특징 데이터 부분을 자동 추출하게 할 수 있다.Next, the
데이터 처리부(120)는 단계(S1320)에서 추출된 특징 데이터 부분을 수치형 데이터와 비수치형 데이터로 구분하여, 각각 미리 정해진 방법으로 전처리할 수 있다(S1330).The
다음으로 데이터 처리부(120)는 전처리된 수치형 데이터와 전처리된 비수치형 데이터를 조합하여 2차원 벡터로 전환할 수 있다(S1340).Next, the
이후 데이터 처리부(120)는 단계(S1340)에서 전환된 2차원 벡터로부터 특징 벡터를 추출할 수 있다(S1350).Thereafter, the
다음으로 데이터 처리부(120)는 단계(S1350)에서 추출된 특징 벡터를 입력받아 이미지 데이터로 변환할 수 있다(S1360).Next, the
이후 모델 생성부(130)는 이미지 변환부(129)에서 변환된 이미지 데이터를 학습 데이터로 신경망 모델을 학습시켜 분석 대상 시스템의 이상 행위 분류 예측 모델을 생성할 수 있다(S1370).Thereafter, the
그리고 분류 예측부(150)는 학습 완료 후에 모델 생성부(130)에서 생성된 이상 행위 분류 예측 모델을 이용하여, 데이터 처리부(120)에서 이미지 데이터로 변환되어 입력되는 분석 대상 데이터를 분류해내고, 분류 결과를 기초로 분석 대상 시스템의 이상 행위를 분류 및 예측할 수 있다(S1380).Then, the
단계(S1380)에서 분류 예측부(150)에 입력되는 이미지 데이터는, 앞서 설명한 단계(S1310) 내지 단계(S1360)을 거쳐 생성될 수 있다. 다만 단계(S1320)에서 특징 데이터 부분을 추출할 때는 전문가 지식에 의한 것이 아니고, 학습 과정에서 선택된 특징 데이터 부분(예컨대 전문가에 의해 선택된 특징 데이터에 대응하는 컬럼 인덱스(column index))에 대한 정보를 이용하여 자동으로 추출된다.The image data input to the
본 발명의 실시예는 다양한 컴퓨터로 구현되는 동작을 수행하기 위한 프로그램 명령을 포함하는 컴퓨터로 읽을 수 있는 매체를 포함한다. 이 매체는 앞서 설명한 데이터 이미지화를 이용한 딥러닝 기반 시스템 이상 행위 분석 방법을 실행시키기 위한 프로그램을 기록한다. 이 매체는 프로그램 명령, 데이터 파일, 데이터 구조 등을 단독으로 또는 조합하여 포함할 수 있다. 이러한 매체의 예에는 하드디스크, 플로피디스크 및 자기 테이프와 같은 자기 매체, CD 및 DVD와 같은 광기록 매체, 플롭티컬 디스크(floptical disk)와 자기-광 매체, 롬, 램, 플래시 메모리 등과 같은 프로그램 명령을 저장하고 수행하도록 구성된 하드웨어 장치 등이 있다. 프로그램 명령의 예에는 컴파일러에 의해 만들어지는 것과 같은 기계어 코드뿐만 아니라 인터프리터 등을 사용해서 컴퓨터에 의해서 실행될 수 있는 고급 언어 코드를 포함한다.Embodiments of the present invention include a computer-readable medium including program instructions for performing various computer-implemented operations. This medium records a program for executing the deep learning based system anomaly analysis method using the data imaging described above. The medium may include program instructions, data files, data structures, or the like alone or in combination. Examples of such media include hard disks, magnetic media such as floppy disks and magnetic tapes, optical recording media such as CDs and DVDs, program instructions such as floptical disks and magnetic-optical media, ROM, RAM, flash memory, etc. And hardware devices configured to store and perform them. Examples of program instructions include high-level language codes that can be executed by a computer using an interpreter, etc., as well as machine language codes produced by a compiler.
이상에서 본 발명의 바람직한 실시예에 대하여 상세하게 설명하였지만 본 발명의 권리범위는 이에 한정되는 것은 아니고 다음의 청구범위에서 정의하고 있는 본 발명의 기본 개념을 이용한 당업자의 여러 변형 및 개량 형태 또한 본 발명의 권리범위에 속하는 것이다.Although the preferred embodiments of the present invention have been described in detail above, the scope of the present invention is not limited thereto, and various modifications and improvements of those skilled in the art using the basic concepts of the present invention defined in the following claims are also provided. It belongs to the scope of rights.
Claims (15)
상기 입력된 네트워크 패킷 데이터에서 특징(feature) 데이터 부분을 선택받는 단계,
상기 선택된 특징 데이터 부분을 분석하여 특징 벡터를 추출하는 단계,
상기 추출된 특징 벡터를 이미지 데이터로 변환하는 단계, 그리고
상기 변환된 이미지 데이터를 학습 데이터로 신경망 모델을 학습시켜 상기 분석 대상 시스템의 이상 행위 분류 예측 모델을 생성하는 단계
를 포함하는 데이터 이미지화를 이용한 이상 행위 분석 방법.Receiving network packet data of the system under analysis,
Receiving a feature data portion from the input network packet data,
Extracting a feature vector by analyzing the selected feature data portion,
Converting the extracted feature vector into image data, and
Training a neural network model using the transformed image data as training data to generate an abnormal behavior classification prediction model of the analysis target system
Method for analyzing anomalous behavior using data imaging that includes.
상기 선택된 특징 데이터 부분을 분석하여 특징 벡터를 추출하는 단계는,
상기 선택된 특징 데이터 부분을 수치형 데이터(Numerical Data)와 비수치형 데이터(Non-numerical Data)로 구분하는 단계,
상기 수치형 데이터와 상기 비수치형 데이터를 각각 미리 정해진 방법으로 전처리하는 단계,
상기 전처리된 수치형 데이터와 비수치형 데이터를 조합하여 2차원 벡터로 전환하는 단계, 그리고
상기 2차원 벡터로부터 상기 특징 벡터를 추출하는 단계
를 포함하는 데이터 이미지화를 이용한 이상 행위 분석 방법.In claim 1,
Extracting a feature vector by analyzing the selected feature data portion,
Dividing the selected feature data portion into numerical data and non-numerical data,
Pre-processing each of the numerical data and the non-numeric data in a predetermined method,
Converting the pre-processed numerical data and non-numeric data into a two-dimensional vector, and
Extracting the feature vector from the two-dimensional vector
An abnormal behavior analysis method using data imaging that includes.
상기 수치형 데이터와 상기 비수치형 데이터를 각각 미리 정해진 방법으로 전처리하는 단계는,
상기 수치형 데이터를 정규화(normalization)하는 단계, 그리고
상기 비수치형 데이터를 행렬(matrix) 형태로 인코딩하는 단계
를 포함하는 데이터 이미지화를 이용한 이상 행위 분석 방법.In claim 2,
Pre-processing the numerical data and the non-numeric data in a predetermined method, respectively,
Normalizing the numerical data, and
Encoding the non-numeric data in a matrix form
Method for analyzing anomalous behavior using data imaging that includes.
상기 수치형 데이터의 정규화는 최소최대 스케일링(MinMax-scaling) 기법으로 수행되고, 상기 비수치형 데이터의 행렬 형태 인코딩은 원-핫 인코딩(One-Hot Encoding), 오디날 인코딩(Ordinal Encoding), 합 인코딩(Sum Encoding), 바이너리 인코딩(Binary Encoding) 중 하나의 기법으로 수행되는 데이터 이미지화를 이용한 이상 행위 분석 방법.In claim 3,
The normalization of the numeric data is performed by a MinMax-scaling technique, and the matrix-type encoding of the non-numeric data is one-hot encoding, ordinary encoding, and sum encoding. (Sum Encoding), Binary Encoding (Binary Encoding), an anomaly analysis method using data imaging.
상기 2차원 벡터는 상기 정규화된 수치형 데이터와 상기 형렬 형태로 인코딩된 비수치형 데이터를 조합한 것인 데이터 이미지화를 이용한 이상 행위 분석 방법.In paragraph 3
The two-dimensional vector is an anomaly analysis method using data imaging, which is a combination of the normalized numeric data and the non-numeric data encoded in the matrix form.
상기 2차원 벡터로부터 상기 특징 벡터를 추출하는 단계는,
상기 2차원 벡터의 연관성 및 분산에 기초하여 상기 특징 벡터를 추출하는 데이터 이미지화를 이용한 이상 행위 분석 방법.In claim 2,
Extracting the feature vector from the two-dimensional vector,
An abnormal behavior analysis method using data imaging that extracts the feature vector based on the association and variance of the two-dimensional vector.
상기 분석 대상 시스템에서 입력되는 네트워크 패킷 데이터로부터 생성되는 이미지 데이터를 입력으로 상기 이상 행위 분류 예측 모델을 이용하여 상기 분석 대상 시스템의 이상 행위를 분류 예측하는 단계
를 더 포함하는 데이터 이미지화를 이용한 이상 행위 분석 방법.In claim 1,
Classifying and predicting the abnormal behavior of the system to be analyzed using the abnormal behavior classification prediction model as input of image data generated from network packet data input from the system to be analyzed.
An abnormal behavior analysis method using data imaging further comprising a.
상기 입력된 네트워크 패킷 데이터에서 특징(feature) 데이터 부분을 선택받고, 상기 선택된 특징 데이터 부분을 분석하여 특징 벡터를 추출하며, 상기 추출된 특징 벡터를 이미지 데이터로 변환하는 데이터 처리부, 그리고
상기 변환된 이미지 데이터를 학습 데이터로 신경망 모델을 학습시켜 상기 분석 대상 시스템의 이상 행위 분류 예측 모델을 생성하는 모델 생성부
를 포함하는 데이터 이미지화를 이용한 이상 행위 분석 시스템.Input section that receives the network packet data of the system under analysis,
A data processor that receives a feature data portion from the input network packet data, analyzes the selected feature data portion, extracts a feature vector, and converts the extracted feature vector into image data; and
A model generation unit that trains a neural network model using the transformed image data as training data to generate an anomaly classification prediction model of the analysis target system
An abnormal behavior analysis system using data imaging that includes.
상기 데이터 처리부는,
상기 선택된 특징 데이터 부분을 수치형 데이터(Numerical Data)와 비수치형 데이터(Non-numerical Data)로 구분하고, 상기 수치형 데이터와 상기 비수치형 데이터를 각각 미리 정해진 방법으로 전처리하며, 상기 전처리된 수치형 데이터와 비수치형 데이터를 조합하여 2차원 벡터로 전환하고, 상기 2차원 벡터로부터 상기 특징 벡터를 추출하는 데이터 이미지화를 이용한 이상 행위 분석 시스템.In claim 8,
The data processing unit,
The selected feature data portion is divided into numeric data (Numerical Data) and non-numerical data (Non-numerical Data), the numeric data and the non-numeric data are respectively pre-processed in a predetermined method, and the pre-processed numeric data An abnormal behavior analysis system using data imaging that combines data and non-numeric data, converts it into a two-dimensional vector, and extracts the feature vector from the two-dimensional vector.
상기 데이터 처리부는,
상기 수치형 데이터를 정규화(normalization)하고, 상기 비수치형 데이터를 행렬(matrix) 형태로 인코딩하는 데이터 이미지화를 이용한 이상 행위 분석 시스템.In claim 9,
The data processing unit,
An abnormal behavior analysis system using data imaging that normalizes the numerical data and encodes the non-numeric data in a matrix form.
상기 데이터 처리부는,
상기 수치형 데이터의 정규화는 최소최대 스케일링(MinMax-scaling) 기법으로 수행하고, 상기 비수치형 데이터의 행렬 형태 인코딩은 원-핫 인코딩(One-Hot Encoding), 오디날 인코딩(Ordinal Encoding), 합 인코딩(Sum Encoding), 바이너리 인코딩(Binary Encoding) 중 하나의 기법으로 수행하는 데이터 이미지화를 이용한 이상 행위 분석 시스템.In claim 10,
The data processing unit,
The normalization of the numerical data is performed by a MinMax-scaling technique, and the matrix-type encoding of the non-numeric data is One-Hot Encoding, Ordinal Encoding, and Sum Encoding. (Sum Encoding), Binary Encoding (Binary Encoding) of one of the anomaly behavior analysis system using data imaging.
상기 2차원 벡터는 상기 정규화된 수치형 데이터와 상기 형렬 형태로 인코딩된 비수치형 데이터를 조합한 것인 데이터 이미지화를 이용한 이상 행위 분석 시스템.In paragraph 9
The two-dimensional vector is an abnormal behavior analysis system using data imaging, which is a combination of the normalized numeric data and the non-numeric data encoded in the matrix form.
상기 데이터 처리부는,
상기 2차원 벡터의 연관성 및 분산에 기초하여 상기 특징 벡터를 추출하는 데이터 이미지화를 이용한 이상 행위 분석 시스템.In claim 9,
The data processing unit,
An abnormal behavior analysis system using data imaging that extracts the feature vector based on the association and variance of the two-dimensional vector.
상기 분석 대상 시스템에서 입력되는 네트워크 패킷 데이터로부터 생성되는 이미지 데이터를 입력으로 상기 이상 행위 분류 예측 모델을 이용하여 상기 분석 대상 시스템의 이상 행위를 분류 예측하는 분류 예측부
를 더 포함하는 데이터 이미지화를 이용한 이상 행위 분석 시스템.In claim 8,
A classification prediction unit that classifies and predicts the abnormal behavior of the analysis target system using the abnormal behavior classification prediction model as input of image data generated from network packet data input from the analysis target system.
An abnormal behavior analysis system using data imaging further comprising a.
Priority Applications (2)
| Application Number | Priority Date | Filing Date | Title |
|---|---|---|---|
| KR1020180126799A KR20200052401A (en) | 2018-10-23 | 2018-10-23 | System Anomaly Behavior Analysis Technology based on Deep Learning Using Imaged Data |
| PCT/KR2019/013810 WO2020085733A1 (en) | 2018-10-23 | 2019-10-21 | Deep learning-based system abnormality analysis technology using data imaging |
Applications Claiming Priority (1)
| Application Number | Priority Date | Filing Date | Title |
|---|---|---|---|
| KR1020180126799A KR20200052401A (en) | 2018-10-23 | 2018-10-23 | System Anomaly Behavior Analysis Technology based on Deep Learning Using Imaged Data |
Publications (1)
| Publication Number | Publication Date |
|---|---|
| KR20200052401A true KR20200052401A (en) | 2020-05-15 |
Family
ID=70331530
Family Applications (1)
| Application Number | Title | Priority Date | Filing Date |
|---|---|---|---|
| KR1020180126799A Ceased KR20200052401A (en) | 2018-10-23 | 2018-10-23 | System Anomaly Behavior Analysis Technology based on Deep Learning Using Imaged Data |
Country Status (2)
| Country | Link |
|---|---|
| KR (1) | KR20200052401A (en) |
| WO (1) | WO2020085733A1 (en) |
Cited By (7)
| Publication number | Priority date | Publication date | Assignee | Title |
|---|---|---|---|---|
| KR102308876B1 (en) * | 2021-03-16 | 2021-10-05 | 주식회사 브릿징파트너스 | System for managing export conference based on non-face-to-face business to business |
| KR102335604B1 (en) | 2020-07-29 | 2021-12-06 | 경북대학교 산학협력단 | Apparatus and method for intelligent abnormal operation recognition of system using bitmap pattern representation of power-consumption |
| CN113837512A (en) * | 2020-06-23 | 2021-12-24 | 中国移动通信集团辽宁有限公司 | Abnormal user identification method and device |
| KR20220106334A (en) | 2021-01-22 | 2022-07-29 | 한국전자통신연구원 | Method for supporting acceleration perfomance basesd on acceleration perfomance tracking of embedded deep learning acceleration application and apparatus using the same |
| CN115018154A (en) * | 2022-06-06 | 2022-09-06 | 邢台路桥建设总公司 | Loess collapsibility prediction method |
| US11748450B2 (en) | 2020-11-11 | 2023-09-05 | Pusan National University Industry-University Cooperation Foundation | Method and system for training image classification model |
| US12505684B2 (en) | 2022-07-19 | 2025-12-23 | Electronics And Telecommunications Research Institute | Method of predicting fine dust concentration and inferring source by using local public data and prediction and inference device |
Families Citing this family (4)
| Publication number | Priority date | Publication date | Assignee | Title |
|---|---|---|---|---|
| CN113722218B (en) * | 2021-08-23 | 2022-06-03 | 南京审计大学 | Software defect prediction model construction method based on compiler intermediate representation |
| CN116740731B (en) * | 2023-05-30 | 2025-11-18 | 中国航天科技国际交流中心 | A method for analyzing the relevance of online articles to topics based on data visualization |
| CN116545944A (en) * | 2023-05-30 | 2023-08-04 | 广东技术师范大学 | Network traffic classification method and system |
| CN117544416B (en) * | 2023-12-28 | 2024-04-30 | 东莞本凡网络技术有限公司 | Intelligent internet of things abnormal flow prediction system |
Family Cites Families (5)
| Publication number | Priority date | Publication date | Assignee | Title |
|---|---|---|---|---|
| US7348143B2 (en) * | 2002-03-22 | 2008-03-25 | Phenmenome Discoveries Inc. | Method of visualizing non-targeted metabolomic data generated from fourier transform ion cyclotron resonance mass spectrometers |
| JP2013143009A (en) * | 2012-01-11 | 2013-07-22 | Hitachi Ltd | Equipment state monitoring method and device using the same |
| JP2015026252A (en) * | 2013-07-26 | 2015-02-05 | 株式会社豊田中央研究所 | Abnormality detection device and program |
| KR20160148911A (en) * | 2015-06-17 | 2016-12-27 | 주식회사 나라시스템 | Integrated information system |
| JP6831729B2 (en) * | 2017-03-23 | 2021-02-17 | 株式会社日立パワーソリューションズ | Anomaly detection device |
-
2018
- 2018-10-23 KR KR1020180126799A patent/KR20200052401A/en not_active Ceased
-
2019
- 2019-10-21 WO PCT/KR2019/013810 patent/WO2020085733A1/en not_active Ceased
Cited By (7)
| Publication number | Priority date | Publication date | Assignee | Title |
|---|---|---|---|---|
| CN113837512A (en) * | 2020-06-23 | 2021-12-24 | 中国移动通信集团辽宁有限公司 | Abnormal user identification method and device |
| KR102335604B1 (en) | 2020-07-29 | 2021-12-06 | 경북대학교 산학협력단 | Apparatus and method for intelligent abnormal operation recognition of system using bitmap pattern representation of power-consumption |
| US11748450B2 (en) | 2020-11-11 | 2023-09-05 | Pusan National University Industry-University Cooperation Foundation | Method and system for training image classification model |
| KR20220106334A (en) | 2021-01-22 | 2022-07-29 | 한국전자통신연구원 | Method for supporting acceleration perfomance basesd on acceleration perfomance tracking of embedded deep learning acceleration application and apparatus using the same |
| KR102308876B1 (en) * | 2021-03-16 | 2021-10-05 | 주식회사 브릿징파트너스 | System for managing export conference based on non-face-to-face business to business |
| CN115018154A (en) * | 2022-06-06 | 2022-09-06 | 邢台路桥建设总公司 | Loess collapsibility prediction method |
| US12505684B2 (en) | 2022-07-19 | 2025-12-23 | Electronics And Telecommunications Research Institute | Method of predicting fine dust concentration and inferring source by using local public data and prediction and inference device |
Also Published As
| Publication number | Publication date |
|---|---|
| WO2020085733A1 (en) | 2020-04-30 |
Similar Documents
| Publication | Publication Date | Title |
|---|---|---|
| KR20200052401A (en) | System Anomaly Behavior Analysis Technology based on Deep Learning Using Imaged Data | |
| KR102048240B1 (en) | System Anomaly Behavior Analysis Technology based on Deep Learning Using Imaged Data | |
| CN115471216B (en) | Data management method of intelligent laboratory management platform | |
| CN116910752B (en) | Malicious code detection method based on big data | |
| CN115037805A (en) | Unknown network protocol identification method, system, device and storage medium based on deep clustering | |
| WO2024221550A1 (en) | Network intrusion detection method and apparatus, and electronic device and readable storage medium | |
| CN118656827B (en) | A dynamic malware detection method based on enhanced semantic API sequence features | |
| CN120339992B (en) | A multimodal orbital foreign object intrusion event detection system and method | |
| CN117220920A (en) | Firewall policy management method based on artificial intelligence | |
| CN120378167A (en) | Encryption flow intrusion detection and system based on BiLSTM and gating multi-head attention fusion | |
| CN117811843A (en) | Network intrusion detection method and system based on big data analysis and independent learning | |
| CN119276550A (en) | Malicious encrypted traffic detection method and system based on CNN and Swin-Transformer | |
| TW202416699A (en) | Network intrusion detecting system and network intrusion detecting method | |
| CN117932544B (en) | Prediction method, device and storage medium based on multi-source sensor data fusion | |
| CN119444386A (en) | An AI-based anti-money laundering pattern recognition system | |
| CN117082118B (en) | Network connection method based on data derivation and port prediction | |
| CN113205132A (en) | Industrial time sequence domain adaptive classification method based on target prior distribution | |
| CN121167416B (en) | Dynamic space-time CNN-transducer emotion brain-computer interface decoding method | |
| Yang et al. | 3d u-net for video anomaly detection | |
| CN119442146A (en) | A multimodal risk content identification system based on Markov network | |
| KR102933196B1 (en) | Method and System for Meta Feature Fusion for Few Shot Time Series Classification | |
| KR20220099749A (en) | Malware detection device and method based on hybrid artificial intelligence | |
| CN114239801A (en) | Intelligent section signal abnormity detection method for regulation and control work management system | |
| Foltz | Video anomaly detection with structured keywords | |
| CN119851013B (en) | Open set fine-grained recognition method and device |
Legal Events
| Date | Code | Title | Description |
|---|---|---|---|
| PA0109 | Patent application |
St.27 status event code: A-0-1-A10-A12-nap-PA0109 |
|
| PA0201 | Request for examination |
St.27 status event code: A-1-2-D10-D11-exm-PA0201 |
|
| P11-X000 | Amendment of application requested |
St.27 status event code: A-2-2-P10-P11-nap-X000 |
|
| P13-X000 | Application amended |
St.27 status event code: A-2-2-P10-P13-nap-X000 |
|
| E902 | Notification of reason for refusal | ||
| PE0902 | Notice of grounds for rejection |
St.27 status event code: A-1-2-D10-D21-exm-PE0902 |
|
| P22-X000 | Classification modified |
St.27 status event code: A-2-2-P10-P22-nap-X000 |
|
| PG1501 | Laying open of application |
St.27 status event code: A-1-1-Q10-Q12-nap-PG1501 |
|
| T11-X000 | Administrative time limit extension requested |
St.27 status event code: U-3-3-T10-T11-oth-X000 |
|
| P11-X000 | Amendment of application requested |
St.27 status event code: A-2-2-P10-P11-nap-X000 |
|
| P13-X000 | Application amended |
St.27 status event code: A-2-2-P10-P13-nap-X000 |
|
| T11-X000 | Administrative time limit extension requested |
St.27 status event code: U-3-3-T10-T11-oth-X000 |
|
| T11-X000 | Administrative time limit extension requested |
St.27 status event code: U-3-3-T10-T11-oth-X000 |
|
| P11-X000 | Amendment of application requested |
St.27 status event code: A-2-2-P10-P11-nap-X000 |
|
| P13-X000 | Application amended |
St.27 status event code: A-2-2-P10-P13-nap-X000 |
|
| T11-X000 | Administrative time limit extension requested |
St.27 status event code: U-3-3-T10-T11-oth-X000 |
|
| T12-X000 | Administrative time limit extension not granted |
St.27 status event code: U-3-3-T10-T12-oth-X000 |
|
| E601 | Decision to refuse application | ||
| PE0601 | Decision on rejection of patent |
St.27 status event code: N-2-6-B10-B15-exm-PE0601 |
|
| P22-X000 | Classification modified |
St.27 status event code: A-2-2-P10-P22-nap-X000 |
|
| R18-X000 | Changes to party contact information recorded |
St.27 status event code: A-3-3-R10-R18-oth-X000 |
|
| P22-X000 | Classification modified |
St.27 status event code: A-2-2-P10-P22-nap-X000 |
|
| P22-X000 | Classification modified |
St.27 status event code: A-2-2-P10-P22-nap-X000 |
|
| R18 | Changes to party contact information recorded |
Free format text: ST27 STATUS EVENT CODE: A-3-3-R10-R18-OTH-X000 (AS PROVIDED BY THE NATIONAL OFFICE) |
|
| R18-X000 | Changes to party contact information recorded |
St.27 status event code: A-3-3-R10-R18-oth-X000 |