US4648276A - Apparatus for measuring the characteristics of an ultrasonic wave medium - Google Patents
Apparatus for measuring the characteristics of an ultrasonic wave medium Download PDFInfo
- Publication number
- US4648276A US4648276A US06/616,472 US61647284A US4648276A US 4648276 A US4648276 A US 4648276A US 61647284 A US61647284 A US 61647284A US 4648276 A US4648276 A US 4648276A
- Authority
- US
- United States
- Prior art keywords
- signal
- received signal
- operatively connected
- averaging
- average
- Prior art date
- Legal status (The legal status is an assumption and is not a legal conclusion. Google has not performed a legal analysis and makes no representation as to the accuracy of the status listed.)
- Expired - Lifetime
Links
Images




Classifications
-
- G—PHYSICS
- G01—MEASURING; TESTING
- G01S—RADIO DIRECTION-FINDING; RADIO NAVIGATION; DETERMINING DISTANCE OR VELOCITY BY USE OF RADIO WAVES; LOCATING OR PRESENCE-DETECTING BY USE OF THE REFLECTION OR RERADIATION OF RADIO WAVES; ANALOGOUS ARRANGEMENTS USING OTHER WAVES
- G01S7/00—Details of systems according to groups G01S13/00, G01S15/00, G01S17/00
- G01S7/52—Details of systems according to groups G01S13/00, G01S15/00, G01S17/00 of systems according to group G01S15/00
- G01S7/52017—Details of systems according to groups G01S13/00, G01S15/00, G01S17/00 of systems according to group G01S15/00 particularly adapted to short-range imaging
- G01S7/52023—Details of receivers
- G01S7/52036—Details of receivers using analysis of echo signal for target characterisation
-
- G—PHYSICS
- G01—MEASURING; TESTING
- G01S—RADIO DIRECTION-FINDING; RADIO NAVIGATION; DETERMINING DISTANCE OR VELOCITY BY USE OF RADIO WAVES; LOCATING OR PRESENCE-DETECTING BY USE OF THE REFLECTION OR RERADIATION OF RADIO WAVES; ANALOGOUS ARRANGEMENTS USING OTHER WAVES
- G01S15/00—Systems using the reflection or reradiation of acoustic waves, e.g. sonar systems
- G01S15/88—Sonar systems specially adapted for specific applications
- G01S15/89—Sonar systems specially adapted for specific applications for mapping or imaging
- G01S15/8906—Short-range imaging systems; Acoustic microscope systems using pulse-echo techniques
- G01S15/895—Short-range imaging systems; Acoustic microscope systems using pulse-echo techniques characterised by the transmitted frequency spectrum
- G01S15/8954—Short-range imaging systems; Acoustic microscope systems using pulse-echo techniques characterised by the transmitted frequency spectrum using a broad-band spectrum
-
- G—PHYSICS
- G01—MEASURING; TESTING
- G01S—RADIO DIRECTION-FINDING; RADIO NAVIGATION; DETERMINING DISTANCE OR VELOCITY BY USE OF RADIO WAVES; LOCATING OR PRESENCE-DETECTING BY USE OF THE REFLECTION OR RERADIATION OF RADIO WAVES; ANALOGOUS ARRANGEMENTS USING OTHER WAVES
- G01S7/00—Details of systems according to groups G01S13/00, G01S15/00, G01S17/00
- G01S7/52—Details of systems according to groups G01S13/00, G01S15/00, G01S17/00 of systems according to group G01S15/00
- G01S7/52017—Details of systems according to groups G01S13/00, G01S15/00, G01S17/00 of systems according to group G01S15/00 particularly adapted to short-range imaging
- G01S7/52023—Details of receivers
- G01S7/52025—Details of receivers for pulse systems
Definitions
- This invention relates to an apparatus for measuring the distribution of ultrasonic wave characteristics in a medium, particularly to an apparatus utilizing the center frequency shift method for measuring ultrasonic wave attenuation constant distribution with high spatial resolution on a real time basis using simple hardware, without obtaining a reflected wave spectrum and including the ability to remove spectrum scalloping in the time domain.
- the center frequency shift method is a known method for obtaining the attenuation constant in an ultrasonic wave medium.
- the power spectrum A(f) of a transmitted ultrasonic wave has a Gaussian distribution expressed as
- K is a constant
- ⁇ is a constant proportional to the bandwidth and dependent on the shape of the spectrum of the transmitted ultrasonic wave
- f o is the center frequency.
- the power spectrum of the received signal A'(f) also has a Gaussian distribution which is expressed as follows, where f r is the center frequency of the received signal:
- the power spectrum of the received signal is subjected to "spectrum scalloping", which is caused by overlapping of the pulses in the received signal waveform due to reflection from random reflectors located close together in the medium.
- spectrum scalloping is caused by overlapping of the pulses in the received signal waveform due to reflection from random reflectors located close together in the medium.
- One attempt to remove spectrum scalloping in the application of ultrasonic wave detection for medical diagnosis has been to average echo envelope signals for several frequency bands.
- the object of this method is to remove the "speckle pattern" in the B-mode imaging.
- the speckle pattern is caused by interference from the spectrum scalloping and prevents the detection of small focal lesions.
- the speckle pattern varies with the frequency, so the averaging is effective in reducing the speckle pattern in the B-mode.
- This method uses linear processing and reduces the spatial resolution of the B-mode image. As a result, prior art devices using this method cannot be used for diagnosis of small focal lesions but only for diffusive lesions of a large organ such as
- Ultrasonic flaw detection systems use "spectrum wobbling", disclosed in Koryachenko, V. D., "Statistical Processing of Flaw Detector Signals to Enhance the Signal-to-Noise Ratio Associated with Structural Reverberation Noise", Soviet Journal of Non-Destructive Testing, Vol. 11, (1975), pps. 69-75, and "split spectrum”, disclosed in Newhouse, V. L., et al., "Flaw-to-Grain Echo Enhancement", Proceedings of Ultrasonics International '79, Graz, Austria, (1979), pp. 152-157 and Newhouse, V. L. and Bilgutay, N. M.
- both the radar and flaw detection systems are designed to suppress parts of the received signals such as grain and clutter and to emphasize the "specular boundary" or shape of the object reflecting the signal.
- the objective of the present invention is to produce the opposite effect, that is, to suppress those parts of the signal indicating specular boundaries and to emphasize those characteristics of the signal which indicate the nature of the object reflecting the signal.
- no prior art method or apparatus has been disclosed which can obtain ultrasonic wave characteristics of a medium, including the attenuation slope coefficient ⁇ , without any spectrum scalloping in real time using low-cost equipment.
- An object of the present invention is to overcome the problems of the prior art by providing a system for obtaining ultrasonic wave characteristics which removes spectrum scalloping in the time domain.
- Another object of the present invention is to provide a system which obtains the distribution of the attenuation slope coefficient on a real-time basis by estimating the center frequency of a received signal from a profile of the phase difference between the received signal and a reference signal and by estimating a shift of the center frequency of the received signal on a real-time basis using simple hardware and without calculating the power spectrum and the first moment in the power domain.
- Yet another object of the present invention is to provide a system for obtaining ultrasonic wave characteristics including the attenuation slope coefficient which removes effects of frequency independent reflection.
- the above objects can be attained by providing a circuit which determines the phase difference between a received signal and a reference signal and passes the phase difference through a differentiating circuit to find the amount of frequency shift between the frequencies of the received signal and the reference signal.
- the signal representing the frequency shift amount passes through another differentiating circuit and is multiplied by a constant to find the attenuation slope coefficient.
- Several embodiments of the present invention utilize a quadrature detector circuit and a signal conversion circuit to find the phase difference between the reference and received signals.
- the quadrature detector circuit multiplies the received signal by the reference signal and by the reference signal shifted by 90° to generate two components defining this phase difference. These components and a trigonometric table stored in a ROM are used to find the phase difference in the signal conversion circuit.
- Another embodiment of the present invention generates the phase difference by passing the input signal simultaneously through two EXCLUSIVE OR circuits, the other input of one of the EXCLUSIVE OR circuits being the reference signal and the other EXCLUSIVE OR circuit receiving a signal corresponding to the reference signal shifted by 90°. From the output of these two EXCLUSIVE OR circuits, the phase difference can be determined. As a result, the apparatus according to the present invention obtains the attenuation slope coefficient without using the power spectrum and is therefore less expensive and operates in real time.
- the apparatus removes all effects of spectrum scalloping by distributing the received signal into received signal bands and calculating signal characteristics for each of the received signal bands.
- An averaging circuit averages the signal characteristics and subsequent circuits provide any further processing necessary to output the tissue characteristics including the attenuation slope coefficent.
- circuits calculate the autocorrelation function for each of the received signal bands in one of the embodiments, and then calculate moments of the power spectrum from which an average frequency and the attenuation slope coefficent can be calculated.
- FIG. 1 is a graph of the power spectrum of transmitted and received signals
- FIG. 2 is a block diagram of a first embodiment of the present invention
- FIG. 3A is a block diagram of a first embodiment of the signal conversion circuit 7 in FIG. 2;
- FIG. 4 is a symbolic diagram of an EXCLUSIVE OR gate
- FIG. 5 is a graph of the relationship between phase ⁇ and the mean voltage Vout output by an EXCLUSIVE OR gate
- FIG. 6A is a graph of reference signals REF0 and REF1;
- FIG. 6B is a symbolic diagram of the EXCLUSIVE ORing of an input signal INPUT with reference signals REF0 and REF1;
- FIG. 6C is a graph of the relationship of the phase ⁇ of the input signal to Vout0 and Vout1;
- FIG. 7A is a graph of the power spectrum of the received signal
- FIG. 7B and 7C are graphs of phase ⁇ versus time
- FIG. 7D is a graph of d ⁇ /dt versus time
- FIG. 8 is a block diagram of a third embodiment of the signal conversion circuit 7 in FIG. 2;
- FIG. 9 is a block diagram of a second embodiment of the present invention.
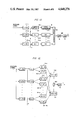
- FIG. 10 is a block diagram of a third embodiment of the present invention having multiple phase detectors and an averaging circuit to remove the effects of spectrum scalloping;
- FIG. 12 is a block diagram of a fourth embodiment of the present invention in which the average frequency is obtained without first finding the phase difference;
- FIG. 13 is a block diagram of a fifth embodiment of the present invention in which multiple quadrature detectors and a feedback loop of the type used in the second embodiment are provided to remove the effects of spectrum scalloping;
- An apparatus determines the attenuation slope coefficient ⁇ in real time instead of obtaining the power spectrum and the first moment.
- the phase of a received signal is compared with a reference signal, and if the phase difference is constant, the received signal has the same frequency as the reference signal. If the phase of the received signal increases over time compared to the reference signal, the received signal has a higher frequency, whereas if it decreases, the received signal has a lower frequency than the reference signal.
- the frequency difference f r - ⁇ between the received frequency f r and the reference frequency ⁇ is obtained by differentiating the phase difference with respect to time, and the attenuation slope coefficient ⁇ is then obtained from equation (5).
- phase difference ⁇ o (t) of the received signal can then be represented as:
- FIG. 2 is a block diagram of a first embodiment of the present invention wherein a signal is transmitted from one or more transducers into a medium under examination.
- a received signal reflected by the medium, is input to a quadrature detector circuit 14 which includes a reference signal oscillator 1 with an oscillation frequency of ⁇ , a 90° phase shifter 2, analog multipliers 3 and 4, and low-pass filters 5 and 6.
- the reflected signal having been received and amplified, is input, as the received signal, to the quadrature detector 14 from which the in-phase component I and quadrature component Q are obtained.
- the output of the multipliers 3 and 4 will have two frequency bands (f e - ⁇ ) to (f u - ⁇ ) and (f e+ ⁇ ) to (f u + ⁇ ).
- the low-pass filters 5 and 6 reject the higher of these two frequency bands.
- FIG. 3A A first embodiment of the structure of the signal conversion circuit 7 is illustrated in FIG. 3A, in which components I and Q are converted from analog signals to digital signals in analog/digital converters 71 and 72 and then input to a conversion table ROM 73 to determine tan -1 (Q/I). The value read out for tan -1 (Q/I) is converted to an analog signal in a digital/analog converter 74 and is then output as the phase ⁇ .
- FIG. 3B is a second embodiment of the signal conversion circuit 7. As shown in FIG. 3B, it is also possible to obtain the value of the phase ⁇ by dividing Q/I in an analog divider 75 and inputting it to the ROM 73 after converting Q/I to a digital signal in an analog/digital converter 77.
- the signs of I and Q, which specify the quadrant of the phase ⁇ are determined by voltage comparators 76 and 78 and are input to the ROM 73 along with the digital Q/I signal.
- This method offers advantages in that only one A/D converter is required and the table in the ROM 73 may be smaller without losing accuracy.
- d ⁇ (t)/dt includes impulse noise during the periods that ⁇ (t) changes in value from ⁇ to - ⁇ (a change known as wrap around).
- the low-pass filter 9 in FIG. 2 is provided to eliminate such noise.
- FIG. 9 A second embodiment of the present invention using such a feedback loop is illustrated in FIG. 9.
- the elements which are the same as those in FIG. 2 are given the same reference numerals and no further explanation of these elements is necessary. The only difference between the FIG. 9 circuit and the circuit of FIG.
- the reference frequency ⁇ is controlled through the feedback loop so that the reference frequency ⁇ is raised when ⁇ (t) is increasing, and lowered when ⁇ (t) is decreasing. Therefore, even if the center frequency (or average frequency) f r of the received signal drops, the reference frequency ⁇ from the oscillator 15 also drops and f r - ⁇ is kept almost constant, so that wrap around will rarely occur because excessive changes in ⁇ (t) are prevented. If wrap around is completely removed, the low-pass filter 9 is not needed.
- FIG. 7B A block diagram of an alternate embodiment of the present invention utilizing software would look the same as FIG. 9, with the level adjusting circuit 16 comprising a microprocessor programmed to adjust the level of the input voltage of the variable oscillator 15.
- the center frequency shift ⁇ f can be obtained without first finding the phase difference ⁇ o (t) as in the fourth embodiment illustrated in FIG. 12 and described below, in which the center frequency shift ⁇ f is obtained from the moments of the power spectrum calculated in the time domain.
- a method, which can be applied to the present invention, for removing wrap around using software is described in J. M. Tribolet, "A New Phase Unwrapping Algorithm", IEEE TRANSACTIONS ON ACOUSTICS, SPEECH AND SIGNAL PROCESSING, VOL. ASSP-25, NO. 2, APRIL 1977, pp. 170-177.
- the output of the low-pass filter 9 of FIG. 2 [d ⁇ (t)/dt] LPF is proportional to the center frequency shift ⁇ f.
- the spectrum of the received signal is assumed to have a Gaussian distribution, just like the spectrum of the transmitted signal. Even if the received signal does not have a Gaussian distribution, since the average frequency shift is obtained by differentiating tan -1 (Q/I) with respect to time t, an approximate value of the attenuation slope coefficient ⁇ will be obtained through the operations explained above. Also, tan -1 (Q/I) was obtained above as an analog signal and the differentiation and low-pass filtering were carried out on analog signals, but it is of course possible to use the output of the ROM 73 as a digital signal and then perform succeeding steps using digital crcuitry.
- the phase ⁇ may be obtained using cos -1 or sin -1 in place of tan -1 .
- the operation and purpose of the comparators 76 and 78, the divider 75, A/D converter 77, and D/A converter 74 in FIG. 8 are similar to the elements in FIG. 3B having the same reference numerals.
- the comparators 76 and 78 in FIG. 8 aid in distinguishing 0 ⁇ from ⁇ 2 ⁇ .
- the difference between ROM 738 and ROM 73 is in the contents of the stored table. In FIG.
- multipliers 81 and 82 form the square of components I and Q, respectively.
- An adder 83 sums the squares and root generating circuit 84 generates the divisor ( ⁇ I 2+ Q 2 ) for the divider 75.
- the square root generating circuit 84 as well as the multipliers 3, 4, 81 and 82 and divider 75 can all be implemented using an MC1595L multiplier manufactured by Motorola, and, as needed, an operational amplifier.
- calculations such as tan -1 and cos -1 may be omitted by employing a phase comparator which generates an output proportional to a phase difference.
- a phase comparator which generates an output proportional to a phase difference.
- square waves REF0 and REF1 having a phase difference of 90° (as illustrated in FIG. 6A), are used as reference signals.
- the received signal is converted into a square wave INPUT by a waveform converter 60 which may comprise an amplifier and a level slicer (not shown).
- the converted received signal is input to EXCLUSIVE ORs (61 and 62) along with each of the reference signals (REF0 and REF1, respectively) as illustrated in FIG. 6B.
- Low pass filters 63 and 64 are then used to generate mean values Vout0 and Vout1 from the outputs OUT0 and OUT1, respectively.
- the relationship between the phase ⁇ of the converted received signal INPUT and Vout0 and Vout1 is the sawtooth phase characteristic which is illustrated in FIG. 6C and stored in the saw-tooth phase characteristic circuit 65, therefore:
- the phase difference ⁇ between the received signal and the reference signal may be obtained by sampling the received signal at a frequency of several MHz after direct A/D conversion and by finding the phase difference ⁇ by digital processing of the sampled data using software or hardware.
- An example of a structure using digital processing is a combination of a high speed waveform sampling system and a computer.
- the average frequency f and power spectrum moments M 0 , M 1 , etc. can be calculated by circuits in the third through fifth embodiments because of relationships between values in the time and frequency domains.
- the power spectrum, center frequency and moments are theoretically related to time-domain values such as the in-phase and quadrature components I and Q and the autocorrelaton function R( ⁇ ) and its first and second derivatives R( ⁇ ), R( ⁇ ).
- Equations (22) to (27-2) can be derived from equations (18)-(21) and known formulas, where ⁇ > indicates averaging over time window T: ##EQU7##
- the average frequency f and the variance ⁇ 2 in the frequency domain can be obtained from the autocorrelation function using the quadrature detector outputs which are calculated in the time domain, thus avoiding Fourier transformation into the frequency domain.
- the third embodiment of the present invention uses the first derivative ⁇ of the phase difference ⁇ which may be obtained by differentiating the phase difference ⁇ output by any of the circuits used in the first and second embodiments, or it may be obtained from the following equation (28): ##EQU8## If ⁇ is time-averaged over a sufficiently long time period T, the average phase difference ⁇ > in the time domain has the following relationship, indicated in equation (29), with f and ⁇ in the frequency domain:
- equation (34) Since distance z depends on time t, z can be replaced with t in equation (34) and if both sides are differentiated with respect to time, equation (35) results: ##EQU10## Therefore, if ⁇ / ⁇ t ⁇ r > can be reduced to zero for the short time period T, then the attenuation slope coefficient ⁇ can be determined from equation (35). In a manner similar to that used by the prior art in the frequency domain, ⁇ / ⁇ t ⁇ r > could be reduced by averaging around a point of interest. However, this reduces the spatial resolution and requires a large amount of processing, thereby making real-time operation difficult.
- An apparatus uses "centroid averaging" in real time to eliminate ⁇ / ⁇ t ⁇ r > without spatial averaging, thereby assuring high spatial resolution and high accuracy using lowcost, simple circuitry having easy operation.
- the received signal is a convolution of a desired pulse waveform and a random signal described above.
- the random phase ⁇ r is included in, e.g., the output from quadrature detectors 14-1 to 14-m (FIG. 10) which process the received signal.
- the random phase ⁇ r varies with the center frequency f r .
- the signal characteristic which is averaged can be any of the quantities such as ⁇ , f and ⁇ which were derived from the outputs of the single quadrature detector 14 in the first and second embodiments.
- m filters 17-1 to 17-m distribute the received signal into m received signal bands and then m corresponding quadrature detectors 14-1 to 14-m generate in-phase and quadrature components for each of the received signal bands.
- m signal conversion circuits 7-1 to 7-m Prior to averaging in an averaging circuit 18, m signal conversion circuits 7-1 to 7-m generate the phase difference ⁇ by one of the methods described in the first two embodiments.
- the output of the averaging circuit 18 is the average phase difference ⁇ > and differentiating circuits 8 and 10 output ⁇ r > and ⁇ , respectively.
- FIG. 10 As a test of the effectiveness of the present invention, the embodiment illustrated in FIG. 10 was used on a rabbit liver about 2 cm thick.
- the signal conversion circuits 7-1 to 7-11 used an arctangent calculator which included an unwrapping algorithm.
- the averaging circuit 18 provided an arithmetic average ⁇ > of the phase difference ⁇ and the differentiating circuit 10 included dividing the result of the differentiation by 4 ⁇ 2 C and thus output the attenuation slope coefficient ⁇ .
- the output of the signal conversion circuits 7-1 to 7-11 and the averaging circuit 18 are illustrated in FIG. 11 with "mean" referring to the average phase difference ⁇ > output by the averaging circuit 18. From FIG. 11, it is clear that the random phase component of ⁇ > is remarkably reduced.
- FIG. 12 A fourth embodiment of the present invention is illustrated in FIG. 12 in which ⁇ > is calculated using equation (28) which was derived from the autocorrelation function.
- the signal conversion circuits 7-1 to 7-m, averaging circuit 18 and first differentiating circuit 8 are replaced with first calculation circuits 19-1 to 19-m 1 which calculate (QI-QI), second calculation circuits 20-1 to 20-m 1 which calculate (I 2 +Q 2 ), first and second summation circuits 182 and 184 which sum the output of the first 19-i and second 20-i calculation circuits, respectively, and a divider circuit 186.
- the remaining blocks in FIG. 12 contain the same components as in FIG. 10.
- the number of received signal bands in FIG. 12 is indicated as m 1 because in the third embodiment, illustrated in FIG. 10, m filters provide m meaningful values which can be averaged for a specific depth z.
- m filters provide m meaningful values which can be averaged for a specific depth z.
- the fourth embodiment, illustrated in FIG. 12 as z increases, the center frequency f r and thus ⁇ > decrease as indicated by equation (32). Additional received signal bands must be supplied to cover the decrease in the center frequency f r and m 1 is therefore larger than m.
- the weighted average > ⁇ w > is given by equations (36) and (37). ##EQU12##
- the first calculation circuits 19-1 to 19-m 1 and summation circuit 182 provide the numerator of equation (37-2) and the second calculation circuits 20-1 to 20-m 1 and the second summation circuit 184 provide the denominator of equation (37-2), while the divider 186 outputs ⁇ w >.
- the attenuation slope coefficient ⁇ is obtained.
- the fourth embodiment avoids the calculation of the phase difference and the use of a phase unwrapping algorithm, thus simplifying the circuitry used in each of the components. However, since additional received signal frequency bands are required, a larger number of each of the components are needed.
- feedback control was implemented to eliminate the need for phase unwrapping.
- a fifth embodiment illustrated in FIG. 13, feedback control is used to reduce the number of received signal bands needed to cover the decrease in ⁇ > for increases in z.
- the number of received signal bands is indicated as 5 to simplify the illustration, but in an actual device the number of bands would be m to provide the same resolution as the third embodiment.
- Distribution of the received signal is accomplished in the fifth embodiment by quadrature detectors 14'-1 to 14'-5, each of which receives a reference signal having a different frequency.
- the output of each of the quadrature detectors 14'-i passes through low-pass filters 21-1 to 21-5 which correspond to the low-pass filters 5 and 6 in FIG. 2.
- Calculation of ⁇ > is completed by the divider 186, as in the fourth embodiment, and then a difference amplifier 22 compares the output of the divider 186 with zero and outputs the difference.
- the output of the difference amplifier 22 is supplied to the differentiation circuit 10, as in the third and fourth embodiments, and is also supplied to a voltage-to-frequency converter 15' which generates the reference signals for the quadrature detectors 14'-1 to 14'-5.
- a voltage-to-frequency converter 15' which generates the reference signals for the quadrature detectors 14'-1 to 14'-5.
- FIG. 14(A) through FIG. 14(C) The operation of the fifth embodiment is illustrated in FIG. 14(A) through FIG. 14(C).
- the average frequency f and the reference frequency ⁇ +i ⁇ (where i is an integer) for one of the quadrature detectors 14'-1 to 14'-5 are illustrated in FIG. 14(A).
- the received signal band corresponding to the illustrated quadrature detector 14'-i is illustrated as a dotted line, while the received signal is illustrated as a solid line.
- the output of the quadrature detector 14'-i includes high and low spectra as illustrated in FIG. 14(B).
- the output waveform of the low-pass filter 21-i connected to the quadrature detector 14'-i is illustrated in FIG. 14(C).
- the output signals of m lowpass filters 21-1 to 21-m will have the same range as the quadrature detectors 14-1 to 14-m in the third embodiment.
- the calculation of ⁇ > is performed in a manner similar to that in the fourth embodiment, e.g., the outputs of the first calculation circuits 19-1 to 19-5 are as follows:
- the quantity in equation (39) is compared by the difference amplifier 22 which produces an output used by the differentiation circuit 10 and the voltage-to-frequency converter 15'.
- the voltage-to-frequency converter 15' can supply reference signals to the quadrature detectors 14'-1 to 14'-5 to keep the output of the difference amplifier 22 almost exactly proportional to f z .
- Japanese Patent Application 58-142893 provides detail on the use of the autocorrelation function to calculate higher moments of the power spectrum, the variance ⁇ 2 and other signal characteristics in the time domain which can be used for correcting the effect of frequency dependent reflection and to provide accurate tissue characteristics. These tissue characteristics can be derived from the statistical values generated by the calculation circuits 19-i, 20-i, 182, 184 and 186. As one example, the variance ⁇ 2 is a good measure of the randomness of the tissue and can be used for medical diagnosis. As another example, the attenuation can be obtained as a function of depth z in the time domain from the attenuation slope coefficient ⁇ . The attenuation can be used for precise time-gain control to provide the reflection coefficient quantitatively for reflection coefficient imaging. This also leads to the measurement of frequency dependent reflection by a parameter such as the exponent of the frequency in the time domain.
- An embodiment of the present invention includes an apparatus for supplying values such as ⁇ , ⁇ f, f, ⁇ , ⁇ 2 , etc. to a CRT display 13 illustrated in FIGS. 2 and 9.
- a tomographic image of an object to be measured can be displayed and the above values can be simultaneously displayed using e.g., B-mode, M-mode, or Doppler images.
- B-mode e.g., B-mode
- M-mode e.g., M-mode, or Doppler images.
- ⁇ , ⁇ f, f and ⁇ are supplied to the display controller 12 as brightness signals. These signals are then supplied to the CRT 13 together with the pertinent synchronous signal, blanking signal and deflection signal related to the ultrasonic scanning of the object to be measured.
- the frequency shift ⁇ f of a reflected ultrasonic wave passing through a measuring medium and the attenuation slope coefficient ⁇ of the ultrasonic wave in the measuring medium can be obtained on a real-time basis using a simple, low-cost circuit which is easy to use, in place of a relatively expensive and low speed device which obtains a power spectrum of the received signal.
- errors caused by pulse overlapping can be removed in the time domain, while maintaining high spatial resolution and real-time operation.
Landscapes
- Engineering & Computer Science (AREA)
- Physics & Mathematics (AREA)
- Radar, Positioning & Navigation (AREA)
- Remote Sensing (AREA)
- Computer Networks & Wireless Communication (AREA)
- General Physics & Mathematics (AREA)
- Acoustics & Sound (AREA)
- Ultra Sonic Daignosis Equipment (AREA)
Priority Applications (3)
| Application Number | Priority Date | Filing Date | Title |
|---|---|---|---|
| US06/616,472 US4648276A (en) | 1984-01-27 | 1984-06-01 | Apparatus for measuring the characteristics of an ultrasonic wave medium |
| DE8585300499T DE3585694D1 (de) | 1984-01-27 | 1985-01-25 | Einrichtung zum messen und darstellen eines mediums mit hilfe von ultraschall. |
| EP85300499A EP0150997B1 (de) | 1984-01-27 | 1985-01-25 | Einrichtung zum Messen und Darstellen eines Mediums mit Hilfe von Ultraschall |
Applications Claiming Priority (2)
| Application Number | Priority Date | Filing Date | Title |
|---|---|---|---|
| US06/574,690 US4534220A (en) | 1984-01-27 | 1984-01-27 | Apparatus for measuring the characteristics of an ultrasonic wave medium |
| US06/616,472 US4648276A (en) | 1984-01-27 | 1984-06-01 | Apparatus for measuring the characteristics of an ultrasonic wave medium |
Related Parent Applications (1)
| Application Number | Title | Priority Date | Filing Date |
|---|---|---|---|
| US06/574,690 Continuation-In-Part US4534220A (en) | 1984-01-27 | 1984-01-27 | Apparatus for measuring the characteristics of an ultrasonic wave medium |
Publications (1)
| Publication Number | Publication Date |
|---|---|
| US4648276A true US4648276A (en) | 1987-03-10 |
Family
ID=27076466
Family Applications (1)
| Application Number | Title | Priority Date | Filing Date |
|---|---|---|---|
| US06/616,472 Expired - Lifetime US4648276A (en) | 1984-01-27 | 1984-06-01 | Apparatus for measuring the characteristics of an ultrasonic wave medium |
Country Status (3)
| Country | Link |
|---|---|
| US (1) | US4648276A (de) |
| EP (1) | EP0150997B1 (de) |
| DE (1) | DE3585694D1 (de) |
Cited By (25)
| Publication number | Priority date | Publication date | Assignee | Title |
|---|---|---|---|---|
| US4723553A (en) * | 1985-06-26 | 1988-02-09 | Fujitsu Limited | Ultrasound medium characteristics measuring apparatus |
| US4984567A (en) * | 1986-09-27 | 1991-01-15 | Hitachi Construction Machinery Co., Ltd. | Apparatus for measuring intracranial pressure |
| US5197019A (en) * | 1989-07-20 | 1993-03-23 | Asulab S.A. | Method of measuring distance using ultrasonic waves |
| US5663502A (en) * | 1994-10-18 | 1997-09-02 | Hitachi, Ltd. | Method and apparatus for measuring thickness of layer using acoustic waves |
| US6184981B1 (en) * | 1998-07-28 | 2001-02-06 | Textron Systems Corporation | Speckle mitigation for coherent detection employing a wide band signal |
| US6704437B1 (en) * | 1999-10-29 | 2004-03-09 | Acuson Corporation | Noise estimation method and apparatus for noise adaptive ultrasonic image processing |
| US20040138569A1 (en) * | 1999-08-20 | 2004-07-15 | Sorin Grunwald | User interface for handheld imaging devices |
| US20100001780A1 (en) * | 2006-07-07 | 2010-01-07 | Rohde & Schwarz Gmbh & Co. Kg | Device and Method for High Resolution Time Measurements |
| EP2169424A1 (de) * | 2008-09-03 | 2010-03-31 | Esaote S.p.A. | Verfahren und Vorrichtung zur Bestimmung lokaler Charakteristika eines Gegenstands, insbesondere mit Ultraschall |
| US20100132468A1 (en) * | 2005-06-28 | 2010-06-03 | Nimtech Inc. | Advanced Ultrasonic Interferometer and Method of Non-Linear Classification and Identification of Matter using Same |
| US20100268083A1 (en) * | 1999-08-20 | 2010-10-21 | Mclaughlin Glen | Echolocation Data Generation |
| US20120186349A1 (en) * | 2009-07-31 | 2012-07-26 | Kyushu University, National University Corporation | Method and system for non-destructive testing |
| US20180224547A1 (en) * | 2017-02-03 | 2018-08-09 | Blackmore Sensors and Analytics Inc. | Method and system for doppler detection and doppler correction of optical phase-encoded range detection |
| US10914841B2 (en) | 2018-04-23 | 2021-02-09 | Blackmore Sensors And Analytics, Llc | LIDAR system for autonomous vehicle |
| EP3658952A4 (de) * | 2017-07-27 | 2021-03-10 | Blackmore Sensors & Analytics, LLC | Verfahren und system zur verwendung eines digitalen chirp-rechtecksignals zur optischen chirpbereichsdetektion |
| US11041954B2 (en) | 2017-07-10 | 2021-06-22 | Blackmore Sensors & Analytics, Llc | Lidar system to detect doppler effects |
| US11249192B2 (en) | 2016-11-30 | 2022-02-15 | Blackmore Sensors & Analytics, Llc | Method and system for automatic real-time adaptive scanning with optical ranging systems |
| US11537808B2 (en) | 2016-11-29 | 2022-12-27 | Blackmore Sensors & Analytics, Llc | Method and system for classification of an object in a point cloud data set |
| US11624828B2 (en) | 2016-11-30 | 2023-04-11 | Blackmore Sensors & Analytics, Llc | Method and system for adaptive scanning with optical ranging systems |
| US20230273182A1 (en) * | 2022-02-28 | 2023-08-31 | Wipro Limited | Method and system for assessing health of a wood specimen |
| US11802965B2 (en) | 2016-11-30 | 2023-10-31 | Blackmore Sensors & Analytics Llc | Method and system for doppler detection and doppler correction of optical chirped range detection |
| US11822010B2 (en) | 2019-01-04 | 2023-11-21 | Blackmore Sensors & Analytics, Llc | LIDAR system |
| US12130363B2 (en) | 2022-02-03 | 2024-10-29 | Aurora Operations, Inc. | LIDAR system |
| US12481032B2 (en) | 2019-01-04 | 2025-11-25 | Aurora Operations, Inc. | Systems and methods for refractive beam-steering |
| US12571914B2 (en) | 2023-10-05 | 2026-03-10 | Aurora Operations, Inc. | Systems and methods of LIDAR sensor systems having amplifier protection circuits |
Families Citing this family (9)
| Publication number | Priority date | Publication date | Assignee | Title |
|---|---|---|---|---|
| US4702112A (en) * | 1985-08-12 | 1987-10-27 | The Babcock & Wilcox Company | Ultrasonic phase reflectoscope |
| FR2660436A1 (fr) * | 1990-03-30 | 1991-10-04 | Bertin & Cie | Microscope acoustique pour analyser un objet en surface ou en profondeur. |
| JPH0435653A (ja) * | 1990-05-31 | 1992-02-06 | Fujitsu Ltd | 超音波診断装置 |
| SE518470C2 (sv) | 2001-02-12 | 2002-10-15 | Ericsson Telefon Ab L M | Styranordning för ett delsystem i en basstation för mobiltelefoni |
| JP2010082230A (ja) * | 2008-09-30 | 2010-04-15 | Fujifilm Corp | 超音波信号処理装置及び方法 |
| WO2014200417A1 (en) * | 2013-06-10 | 2014-12-18 | Medscienta Ab | Method and system for determining a property of a non-homogeneous material |
| WO2014207611A1 (en) * | 2013-06-28 | 2014-12-31 | Koninklijke Philips N.V. | Lung tissue identification in anatomically intelligent echocardiography |
| RU2640007C2 (ru) * | 2014-01-30 | 2017-12-25 | Конинклейке Филипс Н.В. | Способ и устройство обнаружения газового кармана, используя ультразвук |
| CN105307574B (zh) * | 2014-01-30 | 2018-03-30 | 皇家飞利浦有限公司 | 用于使用超声来探测气泡的方法和装置 |
Citations (4)
| Publication number | Priority date | Publication date | Assignee | Title |
|---|---|---|---|---|
| US4202215A (en) * | 1978-10-26 | 1980-05-13 | Kurt Orban Company, Inc. | Sonic pulse-echo method and apparatus for determining attenuation coefficients |
| JPS5877226A (ja) * | 1981-11-02 | 1983-05-10 | Hitachi Ltd | 液相エピタキシヤル成長装置 |
| JPS58142893A (ja) * | 1982-02-19 | 1983-08-25 | Toshiba Corp | 光学的情報記録媒体 |
| US4414850A (en) * | 1980-06-03 | 1983-11-15 | Fujitsu Limited | Measurement method and system utilizing ultrasonic wave |
Family Cites Families (2)
| Publication number | Priority date | Publication date | Assignee | Title |
|---|---|---|---|---|
| FR2514910A1 (fr) * | 1981-10-19 | 1983-04-22 | Labo Electronique Physique | Dispositif de traitement des echos dans un appareil d'exploration de milieux par echographie ultrasonore et appareil d'exploration de milieux comprenant un tel dispositif de traitement |
| JPS59171540A (ja) * | 1983-03-18 | 1984-09-28 | 富士通株式会社 | スペクトル形状利用測定方法 |
-
1984
- 1984-06-01 US US06/616,472 patent/US4648276A/en not_active Expired - Lifetime
-
1985
- 1985-01-25 EP EP85300499A patent/EP0150997B1/de not_active Expired - Lifetime
- 1985-01-25 DE DE8585300499T patent/DE3585694D1/de not_active Expired - Lifetime
Patent Citations (4)
| Publication number | Priority date | Publication date | Assignee | Title |
|---|---|---|---|---|
| US4202215A (en) * | 1978-10-26 | 1980-05-13 | Kurt Orban Company, Inc. | Sonic pulse-echo method and apparatus for determining attenuation coefficients |
| US4414850A (en) * | 1980-06-03 | 1983-11-15 | Fujitsu Limited | Measurement method and system utilizing ultrasonic wave |
| JPS5877226A (ja) * | 1981-11-02 | 1983-05-10 | Hitachi Ltd | 液相エピタキシヤル成長装置 |
| JPS58142893A (ja) * | 1982-02-19 | 1983-08-25 | Toshiba Corp | 光学的情報記録媒体 |
Non-Patent Citations (12)
| Title |
|---|
| Beasley, Eric W. et al., "A Quantitative Analysis of Sea Clutter Decorrelation with Frequency Agility," IEEE Transactions on Aerospace and Electronic Systems, vol. AES-4, No. 3, May 1968, pp. 468-473. |
| Beasley, Eric W. et al., A Quantitative Analysis of Sea Clutter Decorrelation with Frequency Agility, IEEE Transactions on Aerospace and Electronic Systems, vol. AES 4, No. 3, May 1968, pp. 468 473. * |
| Bilgutay, N. M. et al., "Flaw Visibility Enhancement by Split-Spectrum Processing Techniques", 1981 IEEE Ultrasonic Symposium, Chicago, Ill. |
| Bilgutay, N. M. et al., "Flaw-to-Grain Echo Enhancement," Proc. Ultrasonics International, '79, Graz, Austria, pp. 152-157. |
| Bilgutay, N. M. et al., Flaw to Grain Echo Enhancement, Proc. Ultrasonics International, 79, Graz, Austria, pp. 152 157. * |
| Bilgutay, N. M. et al., Flaw Visibility Enhancement by Split Spectrum Processing Techniques , 1981 IEEE Ultrasonic Symposium, Chicago, Ill. * |
| Gustafson, B. G. et al., "System Properties of Jumping-Frequency Radars," Philips Telecommunication Review, vol. 25, No. 1, Jul. 1964, pp. 70-76. |
| Gustafson, B. G. et al., System Properties of Jumping Frequency Radars, Philips Telecommunication Review, vol. 25, No. 1, Jul. 1964, pp. 70 76. * |
| Kuc, Roman et al., "Parametric Estimation of the Acoustic Attenuation Coefficient Slope for Soft Tissue", 1976 Ultrasonics Symposium Proceedings, IEEE Cat. #76, pp. 44-47. |
| Kuc, Roman et al., Parametric Estimation of the Acoustic Attenuation Coefficient Slope for Soft Tissue , 1976 Ultrasonics Symposium Proceedings, IEEE Cat. 76, pp. 44 47. * |
| Ray, Howard, "Improving Radar Range and Angle Detection with Frequency Agility," The Microwave Journal, May 1966, pp. 63-68. |
| Ray, Howard, Improving Radar Range and Angle Detection with Frequency Agility, The Microwave Journal, May 1966, pp. 63 68. * |
Cited By (46)
| Publication number | Priority date | Publication date | Assignee | Title |
|---|---|---|---|---|
| US4723553A (en) * | 1985-06-26 | 1988-02-09 | Fujitsu Limited | Ultrasound medium characteristics measuring apparatus |
| US4984567A (en) * | 1986-09-27 | 1991-01-15 | Hitachi Construction Machinery Co., Ltd. | Apparatus for measuring intracranial pressure |
| US5197019A (en) * | 1989-07-20 | 1993-03-23 | Asulab S.A. | Method of measuring distance using ultrasonic waves |
| US5663502A (en) * | 1994-10-18 | 1997-09-02 | Hitachi, Ltd. | Method and apparatus for measuring thickness of layer using acoustic waves |
| US6184981B1 (en) * | 1998-07-28 | 2001-02-06 | Textron Systems Corporation | Speckle mitigation for coherent detection employing a wide band signal |
| US20040138569A1 (en) * | 1999-08-20 | 2004-07-15 | Sorin Grunwald | User interface for handheld imaging devices |
| US7022075B2 (en) | 1999-08-20 | 2006-04-04 | Zonare Medical Systems, Inc. | User interface for handheld imaging devices |
| US20060116578A1 (en) * | 1999-08-20 | 2006-06-01 | Sorin Grunwald | User interface for handheld imaging devices |
| US8226561B2 (en) | 1999-08-20 | 2012-07-24 | Zonare Medical Systems, Inc. | Ultrasound imaging system |
| US8764661B2 (en) | 1999-08-20 | 2014-07-01 | Zonare Medical Systems, Inc. | Echolocation data generation |
| US8679018B2 (en) | 1999-08-20 | 2014-03-25 | Zonare Medical Systems, Inc. | Broad-beam imaging |
| US20100268083A1 (en) * | 1999-08-20 | 2010-10-21 | Mclaughlin Glen | Echolocation Data Generation |
| US20100268082A1 (en) * | 1999-08-20 | 2010-10-21 | Mclaughlin Glen | Ultrasound Imaging System |
| US6704437B1 (en) * | 1999-10-29 | 2004-03-09 | Acuson Corporation | Noise estimation method and apparatus for noise adaptive ultrasonic image processing |
| US7878062B2 (en) * | 2005-06-28 | 2011-02-01 | Nimtech Inc. | Advanced ultrasonic interferometer and method of non-linear classification and identification of matter using same |
| US20100132468A1 (en) * | 2005-06-28 | 2010-06-03 | Nimtech Inc. | Advanced Ultrasonic Interferometer and Method of Non-Linear Classification and Identification of Matter using Same |
| US8527574B2 (en) * | 2006-07-07 | 2013-09-03 | Rohde & Schwarz Gmbh & Co. Kg | Device and method for high resolution time measurements |
| US20100001780A1 (en) * | 2006-07-07 | 2010-01-07 | Rohde & Schwarz Gmbh & Co. Kg | Device and Method for High Resolution Time Measurements |
| EP2169424A1 (de) * | 2008-09-03 | 2010-03-31 | Esaote S.p.A. | Verfahren und Vorrichtung zur Bestimmung lokaler Charakteristika eines Gegenstands, insbesondere mit Ultraschall |
| US20120186349A1 (en) * | 2009-07-31 | 2012-07-26 | Kyushu University, National University Corporation | Method and system for non-destructive testing |
| US8776603B2 (en) * | 2009-07-31 | 2014-07-15 | Kyushu University, National University Corporation | Method and system for non-destructive testing |
| US11921210B2 (en) | 2016-11-29 | 2024-03-05 | Aurora Operations, Inc. | Method and system for classification of an object in a point cloud data set |
| US11537808B2 (en) | 2016-11-29 | 2022-12-27 | Blackmore Sensors & Analytics, Llc | Method and system for classification of an object in a point cloud data set |
| US12461239B2 (en) | 2016-11-30 | 2025-11-04 | Aurora Operations, Inc. | Method and system for doppler detection and doppler correction of optical chirped range detection |
| US11874375B2 (en) | 2016-11-30 | 2024-01-16 | Blackmore Sensors & Analytics, LLC. | Method and system for automatic real-time adaptive scanning with optical ranging systems |
| US11802965B2 (en) | 2016-11-30 | 2023-10-31 | Blackmore Sensors & Analytics Llc | Method and system for doppler detection and doppler correction of optical chirped range detection |
| US11249192B2 (en) | 2016-11-30 | 2022-02-15 | Blackmore Sensors & Analytics, Llc | Method and system for automatic real-time adaptive scanning with optical ranging systems |
| US11624828B2 (en) | 2016-11-30 | 2023-04-11 | Blackmore Sensors & Analytics, Llc | Method and system for adaptive scanning with optical ranging systems |
| US10422880B2 (en) * | 2017-02-03 | 2019-09-24 | Blackmore Sensors and Analytics Inc. | Method and system for doppler detection and doppler correction of optical phase-encoded range detection |
| US11585925B2 (en) | 2017-02-03 | 2023-02-21 | Blackmore Sensors & Analytics, Llc | LIDAR system to adjust doppler effects |
| US12196854B2 (en) | 2017-02-03 | 2025-01-14 | Aurora Operations, Inc. | LIDAR system to adjust doppler effects |
| US20180224547A1 (en) * | 2017-02-03 | 2018-08-09 | Blackmore Sensors and Analytics Inc. | Method and system for doppler detection and doppler correction of optical phase-encoded range detection |
| US11366228B2 (en) | 2017-07-10 | 2022-06-21 | Blackmore Sensors & Analytics, Llc | Method and system for time separated quadrature detection of doppler effects in optical range measurements |
| US11041954B2 (en) | 2017-07-10 | 2021-06-22 | Blackmore Sensors & Analytics, Llc | Lidar system to detect doppler effects |
| EP3658952A4 (de) * | 2017-07-27 | 2021-03-10 | Blackmore Sensors & Analytics, LLC | Verfahren und system zur verwendung eines digitalen chirp-rechtecksignals zur optischen chirpbereichsdetektion |
| US11579292B2 (en) | 2017-07-27 | 2023-02-14 | Blackmore Sensors & Analytics, Llc | Method and system for using square wave digital chirp signal for optical chirped range detection |
| US11947017B2 (en) | 2018-04-23 | 2024-04-02 | Aurora Operations, Inc. | Lidar system for autonomous vehicle |
| US10914841B2 (en) | 2018-04-23 | 2021-02-09 | Blackmore Sensors And Analytics, Llc | LIDAR system for autonomous vehicle |
| US11500106B2 (en) | 2018-04-23 | 2022-11-15 | Blackmore Sensors & Analytics, Llc | LIDAR system for autonomous vehicle |
| US11822010B2 (en) | 2019-01-04 | 2023-11-21 | Blackmore Sensors & Analytics, Llc | LIDAR system |
| US12481032B2 (en) | 2019-01-04 | 2025-11-25 | Aurora Operations, Inc. | Systems and methods for refractive beam-steering |
| US12461203B2 (en) | 2019-01-04 | 2025-11-04 | Aurora Operations, Inc. | LIDAR system |
| US12130363B2 (en) | 2022-02-03 | 2024-10-29 | Aurora Operations, Inc. | LIDAR system |
| US20230273182A1 (en) * | 2022-02-28 | 2023-08-31 | Wipro Limited | Method and system for assessing health of a wood specimen |
| US12313621B2 (en) * | 2022-02-28 | 2025-05-27 | Wipro Limited | Method and system for assessing health of a wood specimen |
| US12571914B2 (en) | 2023-10-05 | 2026-03-10 | Aurora Operations, Inc. | Systems and methods of LIDAR sensor systems having amplifier protection circuits |
Also Published As
| Publication number | Publication date |
|---|---|
| EP0150997B1 (de) | 1992-03-25 |
| EP0150997A2 (de) | 1985-08-07 |
| DE3585694D1 (de) | 1992-04-30 |
| EP0150997A3 (en) | 1987-06-16 |
Similar Documents
| Publication | Publication Date | Title |
|---|---|---|
| US4648276A (en) | Apparatus for measuring the characteristics of an ultrasonic wave medium | |
| US5379770A (en) | Method and apparatus for transcranial doppler sonography | |
| US5086775A (en) | Method and apparatus for using Doppler modulation parameters for estimation of vibration amplitude | |
| US4936308A (en) | Method and apparatus for measuring acoustic characteristics and temperature | |
| JP2849827B2 (ja) | パルスドップラ信号のフーリエプロセッシング方法および装置 | |
| US5662115A (en) | Method for determining the velocity-time spectrum of blood flow | |
| US4848354A (en) | Method and apparatus for investigating a circulatory system in living biological structures | |
| US4265126A (en) | Measurement of true blood velocity by an ultrasound system | |
| US6095980A (en) | Pulse inversion doppler ultrasonic diagnostic imaging | |
| US5177691A (en) | Measuring velocity of a target by Doppler shift, using improvements in calculating discrete Fourier transform | |
| EP1175613B1 (de) | Messung vektorieller geschwindigkeit | |
| US4182173A (en) | Duplex ultrasonic imaging system with repetitive excitation of common transducer in doppler modality | |
| US4542657A (en) | Time domain technique to determine mean frequency | |
| US5097836A (en) | Untrasound diagnostic equipment for calculating and displaying integrated backscatter or scattering coefficients by using scattering power or scattering power spectrum of blood | |
| JPH06504453A (ja) | 乳房組織の画像を生成するための方法および装置 | |
| EP0228070A2 (de) | Mit Doppler-Effekt arbeitendes Ultraschall-Diagnosegerät | |
| US5164730A (en) | Method and apparatus for determining a cross-range scale factor in inverse synthetic aperture radar systems | |
| US6176143B1 (en) | Method and apparatus for estimation and display of spectral broadening error margin for doppler time-velocity waveforms | |
| US5107466A (en) | Ultrasonic doppler flow meter | |
| US5560363A (en) | Method for calculation of blood velocity and blood velocity spread from multi gated doppler signals | |
| Tortoli et al. | A review of experimental transverse Doppler studies | |
| US4884448A (en) | Ultrasonic doppler meter | |
| EP0166782A1 (de) | Vorrichtung zur messung der ultraschall-kennzeichen-werte eines mediums | |
| JP3281435B2 (ja) | 超音波ドプラ診断装置 | |
| JPS61751A (ja) | 超音波媒体の特性測定装置 |
Legal Events
| Date | Code | Title | Description |
|---|---|---|---|
| STCF | Information on status: patent grant |
Free format text: PATENTED CASE |
|
| CC | Certificate of correction | ||
| FEPP | Fee payment procedure |
Free format text: PAYOR NUMBER ASSIGNED (ORIGINAL EVENT CODE: ASPN); ENTITY STATUS OF PATENT OWNER: LARGE ENTITY |
|
| FPAY | Fee payment |
Year of fee payment: 4 |
|
| FPAY | Fee payment |
Year of fee payment: 8 |
|
| FPAY | Fee payment |
Year of fee payment: 12 |