US6151555A - Seismic signal processing method and apparatus for generating a cube of variance values - Google Patents
Seismic signal processing method and apparatus for generating a cube of variance values Download PDFInfo
- Publication number
- US6151555A US6151555A US09/377,573 US37757399A US6151555A US 6151555 A US6151555 A US 6151555A US 37757399 A US37757399 A US 37757399A US 6151555 A US6151555 A US 6151555A
- Authority
- US
- United States
- Prior art keywords
- sub
- seismic data
- cube
- cell
- data samples
- Prior art date
- Legal status (The legal status is an assumption and is not a legal conclusion. Google has not performed a legal analysis and makes no representation as to the accuracy of the status listed.)
- Expired - Lifetime
Links
Images

Classifications
-
- G—PHYSICS
- G01—MEASURING; TESTING
- G01V—GEOPHYSICS; GRAVITATIONAL MEASUREMENTS; DETECTING MASSES OR OBJECTS; TAGS
- G01V1/00—Seismology; Seismic or acoustic prospecting or detecting
- G01V1/28—Processing seismic data, e.g. for interpretation or for event detection
- G01V1/34—Displaying seismic recordings or visualisation of seismic data or attributes
Definitions
- the subject matter of the present invention relates to a seismic signal processing method and apparatus and, in particular, a workstation computer system, and its associated method and program storage device, which stores a novel software package known as "Variance Cube".
- the computer system is responsive to a plurality of seismic signals, which propagated through a cubic volume of an earth formation, for generating a cube representing said cubic volume of earth.
- the cube includes a plurality of seismic data samples, each seismic data sample having a corresponding "variance value" and a unique color assigned thereto.
- the computer system further generates one or more maps, such as a time slice map, representing one or more slices through the cube, each map displaying and being used to determine certain geologic features which exist along the corresponding slice through the cube.
- Each map includes a plurality of the variance values representing the geologic features, each such variance value being defined as the degree to which an amplitude of each seismic data sample in a cell in the cube at a particular reflection time "t" varies about an average amplitude of the samples in the cell.
- Two dimensional seismic data is acquired along lines that consist of geophone arrays onshore or hydrophone streamers offshore.
- the geophones or hydrophones act as sensors which receive seismic energy from an earth formation.
- the seismic energy is transmitted into the earth formation, reflected back toward a surface of the earth from subsurface horizon interfaces in the earth formation, and propagates through a cubic volume of the earth formation before reaching the sensors.
- three dimensional (3-D) seismic the principle is the same except that the arrays of geophones and hydrophones are more closely spaced to provide more detailed subsurface coverage.
- the processing of the digital seismic data requires computer resources which store and execute complex software for enhancing the received digital data/seismic signals and for muting any accompanying noise which masks the signals.
- the resultant processed signals are recorded and displayed in the form of a "cube” and a plurality of "maps" which represent slices through the cube, such as horizontal time slice maps or horizon maps, which display various geologic features situated on the corresponding slice through the cube.
- three dimensional seismic is used extensively to provide a more detailed structural and stratigraphic image of subsurface reservoirs.
- the computer responds to a set of seismic data which was digitally generated when seismic energy "sound" waves were transmitted through a cubic volume of earth.
- the computer operates on a cubic portion of the received seismic data (hereinafter called a "cube") which corresponds to that portion of the seismic energy that propagated through the cubic volume of earth.
- the seismic data in the cube comprises a plurality of seismic traces, where each trace further comprises a multitude of seismic data samples. If a horizontal plane were to pass through corresponding seismic data samples in the cube, that plane would be called a "time slice", since all the corresponding seismic data samples on that time slice have the same reflection time.
- a plurality of such time slices pass through a plurality of corresponding seismic data samples in the cube (see FIG. 2).
- a cell on a first time slice in the cube encompasses a first seismic data sample on the first time slice in the cube, similar such cells on other time slices in the cube encompass the same corresponding first seismic data sample on the other time slices in the cube, and a mathematical operation is performed on the seismic data samples in each of the plurality of cells on each of the plurality of time slices in the cube thereby producing a plurality of values or results corresponding, respectively, to a first plurality of the first seismic data samples in the plurality of cells of the cube.
- the plurality of values or results are then assigned, respectively, to the first plurality of first seismic data samples in the respective plurality of cells of the cube, one such value or result being assigned to each of the first seismic data samples.
- the plurality of cells on each time slice in the cube move (or sequentially progress) from the first plurality of first seismic data samples to a second plurality of second seismic data samples, the above referenced mathematical operation is performed on the seismic data samples in each of the plurality of cells which now encompass the second plurality of second seismic data samples, and a second plurality of values or results is produced corresponding, respectively, to the second plurality of second seismic data samples in the plurality of cells of the cube, one such value or result being assigned to each of the second plurality of second seismic data samples.
- the plurality of cells move or sequentially progress from the second plurality of second seismic data samples to a third plurality of third seismic data samples, and the above process is repeated until all of the seismic data samples on each of the time slices in the cube have a value or result assigned thereto.
- a color is assigned to each value or result corresponding to each seismic data sample. Therefore, each of the seismic data samples in the cube have a unique color assigned thereto.
- the method disclosed in the Bahorich patent (which discloses a mathematical operation for calculating the geometric mean of two coherency values to represent the value to assign to a seismic data sample in each cell on a time slice of a cube) and the method disclosed in the Van Bemmel application (which discloses a mathematical operation for calculating the cross correlation between a seismic trace and its quadrature trace) represent only two such methods and mathematical operations for generating a "cube” and a plurality of corresponding "maps" that display a set of geologic features of the earth formation in the cube.
- a value or result i.e., a "variance value”
- a "Variance Cube” software is disclosed which is adapted for storage in a memory of a computer workstation.
- the Variance Cube software is initially stored on a program storage device, such as a CD-Rom, the software being loaded from the program storage device into the memory of the computer workstation.
- That workstation includes a processor, and when the processor executes the Variance Cube software stored in the memory, a method is practiced.
- the workstation processor executes the Variance Cube software, the workstation processor will respond to a set of seismic data which was digitally generated when seismic energy "sound" waves were transmitted through a cubic volume of earth.
- the computer operates on a cubic portion of the received seismic data (hereinafter called a "cube") which corresponds to that portion of the seismic energy that is propagated through the cubic volume of earth.
- the seismic data in the cube comprises a plurality of seismic traces, where each trace further comprises a multitude of seismic data samples.
- ⁇ time slices ⁇ When a plurality of horizontal planes (called ⁇ time slices ⁇ ) pass through each corresponding set of seismic data samples in the cube, that cube is divided into a plurality of the time slices where each time slice has a particular reflection time "j".
- a first plurality of cells on the respective plurality of time slices in the cube will encompass a corresponding first plurality of seismic data samples on the plurality of time slices of the cube.
- Each cell on each time slice includes a plurality of seismic data samples having a corresponding plurality of amplitudes at the reflection time "j", the plurality of seismic data samples in said each cell including a center seismic data sample.
- a mathematical operation is performed in each cell on each time slice.
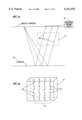
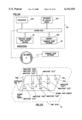
- FIGS. 1a-1b and 2 illustrate a plurality of seismic traces reflecting off a horizon in an earth formation and propagating through a cubic volume (i.e., a "cube") of the formation;
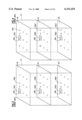
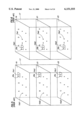
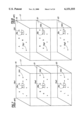
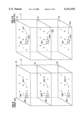
- FIGS. 3 through 12 illustrate how a mathematical operation is performed in each cell in connection with a plurality of corresponding cells on a plurality of time slices associated with a plurality of corresponding seismic data samples in the cube and how the plurality of corresponding cells sequentially progress through the cube for the purpose of determining a unique value or result for each seismic data sample in the cube, each value or result corresponding to a unique color which is subsequently assigned to each seismic data sample in the cube;
- FIGS. 13-15 illustrate time slice maps resulting from the cube of FIG. 12
- FIGS. 16 through 22 illustrate the specific mathematical operation performed in each of the cells of FIGS. 3-12 as disclosed in U.S. Pat. No. 5,563,949 to Bahorich et al;
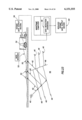
- FIG. 23 illustrates a seismic operation where the resultant seismic data output record undergoes data reduction to produce a reduced seismic data output record;
- FIG. 24 illustrate a computer system, such as a workstation, which stores the "variance cube software" in accordance with the present invention
- FIGS. 25 through 28 illustrate the specific "variance oriented" mathematical operation (different from the mathematical operation of FIGS. 16-22 in the Bahorich patent, and different from the mathematical operation of the Van Bemmel application) performed in each of the cells of FIGS. 3-12 as disclosed in the present application when the "variance cube software" of the present invention is executed by the workstation processor of FIG. 24;
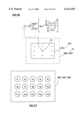
- FIGS. 29 through 31 illustrate a set of user interface dialogs which are presented to the operator of the computer workstation of FIG. 24 via the "recorder or display device" when the variance cube software of the present invention is being executed;
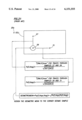
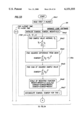
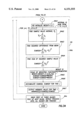
- FIG. 32 explains the structure of a flowchart depicting the structure of the "variance cube software" of the present invention of FIGS. 33 and 34;
- FIGS. 33 and 34 illustrate a flowchart depicting the structure of the "variance cube software" of the present invention.
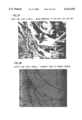
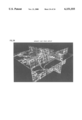
- FIGS. 35 through 39 illustrate different "maps", such as time slice maps, which are generated by the recorder or display device of FIG. 24 when the "variance cube software" of the present invention is executed by the workstation processor of FIG. 24.
- FIGS. 1a through 15 the following paragraphs will discuss a prior art "sequential progression" method for determining a unique value or result for each seismic data sample in a cube (i.e., a cubic volume of earth) and a corresponding unique color for each such seismic data sample in the cube and for generating one or more "maps" associated with each slice through the cube.
- a cube i.e., a cubic volume of earth
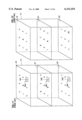
- FIGS. 1a and 1b starting with FIG. 1a, a plurality of seismic waves 10 originating from an explosive energy source reflect off a horizon 12 in an earth formation.
- the seismic waves 10 will propagate through a cubic volume of earth 17 (hereinafter, called a "cube 17") during its travel toward the Earth's surface.
- the seismic waves 10 are received, in the form of seismic traces 31.
- each of the seismic traces 31 actually consist of a sequential series of seismic data samples.
- FIG. 1b the seismic traces 31 propagating through the cube 17 is illustrated.
- Each of the traces 31 include a series of interconnected seismic data samples 15. Therefore, in FIG. 1b, the cube 17 (representing the cubic volume of earth 17 in FIG. 1a) contains a plurality of seismic data samples 15 representing a plurality of seismic traces 31 propagating through the cube 17.
- each of the seismic traces 10 include three (3) seismic data samples, a top sample, a middle sample, and a bottom sample.
- a time slice 19 passes through each of the top seismic data samples
- a time slice 21 passes through each of the middle seismic data samples
- a time slice 23 passes through each of the bottom seismic data samples.
- a plurality of cells enclosed corresponding seismic data samples on the time slices of the cube.
- a first cell 25a encloses a first seismic data sample 15a1 on time slice 19
- a second cell 25b encloses a corresponding first seismic data sample 15a2 on time slice 21
- a third cell 25c encloses a corresponding first seismic data sample 15a3 on time slice 23.
- a mathematical operation takes place in each cell 15a1, 15a2, 15a3, and a value or result "A" is determined for sample 15a1, a value or result "B” is determined for sample 15a2, and a value or result "C” is determined for sample 15a3.
- the cells 25a, 25b, and 25c "sequentially progress" to the next adjacent samples 15b1, 15b2, 15b3.
- FIG. 4 note that "A” is assigned to sample 15a1, "B” is assigned to sample 15a2, and "C” is assigned to sample 15a3.
- the first cell 25a encloses a second seismic data sample 15b1 on time slice 19
- the second cell 25b encloses a corresponding second seismic data sample 15b2 on time slice 21
- the third cell 25c encloses a corresponding second seismic data sample 15b3 on time slice 23.
- the mathematical operation takes place in each cell 15b1, 15b2, 15b3, and a value or result "D" is determined for sample 15b1, a value or result "E” is determined for sample 15b2, and a value or result “F” is determined for sample 15b3.
- the cells 25a, 25b, and 25c "sequentially progress" to the next adjacent samples 15c1, 15c2, 15c3.
- the first, second, and third cells 25a, 25b, and 25c enclose the third and corresponding seismic data samples 15c1, 15c2, 15c3, the mathematical operation is performed in the cells 25a, 25b, 25c and a value or result "G", "H", and "I” is determined for samples 15c1, 15c2, and 15c3, respectively.
- the cells 25a-25c sequentially progress to the next adjacent samples 15d1, 15d2, 15d3 and note, in FIG. 6, that values G, H, and I have been assigned to samples 15c1, 15c2, and 15c3, respectively.
- the first, second, and third cells 25a, 25b, and 25c enclose the fourth and corresponding seismic data samples 15d1, 15d2, 15d3, the mathematical operation is performed in the cells 25a, 25b, 25c and a value or result "J", "K", and "L" is determined for samples 15d1, 15d2, and 15d3, respectively.
- the cells 25a-25c sequentially progress to the next adjacent samples 15c1, 15c2, 15c3 and note, in FIG. 7, that values J, K, and L have been assigned to samples 15d1, 15d2, and 15d3, respectively.
- the first, second, and third cells 25a, 25b, and 25c enclose the fifth and corresponding seismic data samples 15e1, 15e2, 15e3, the mathematical operation is performed in the cells 25a, 25b, 25c and a value or result "M", "M", and "O" is determined for samples 15e1, 15e2, and 15e3, respectively.
- the cells 25a-25c sequentially progress to the next adjacent samples 15f1, 15f2, 15f3 and note, in FIG. 8, that values M, N, and O have been assigned to samples 15e1, 15e2, and 15e3, respectively.
- the first, second, and third cells 25a, 25b, and 25c enclose the sixth and corresponding seismic data samples 15f1, 15f2, 15f3, the mathematical operation is performed in the cells 25a, 25b, 25c and a value or result "P", "Q”, and "R" is determined for samples 15f1, 15f2, and 15f3, respectively.
- the cells 25a-25c sequentially progress to the next adjacent samples 15g1, 15g2, 15g3 and note, in FIG. 9, that values P, Q, and R have been assigned to samples 15f1, 15f2, and 15f3, respectively.
- the first, second, and third cells 25a, 25b, and 25c enclose the seventh and corresponding seismic data samples 15g1, 15g2, 15g3, the mathematical operation is performed in the cells 25a, 25b, 25c and a value or result "S", "T", and "U” is determined for samples 15g1, 15g2, and 15g3, respectively.
- the cells 25a-25c sequentially progress to the next adjacent samples 15h1, 15h2, 15h3 and note, in FIG. 10, that values S, T, and U have been assigned to samples 15g1, 15g2, and 15g3, respectively.
- the first, second, and third cells 25a, 25b, and 25c enclose the eighth and corresponding seismic data samples 15h1, 15h2, 15h3, the mathematical operation is performed in the cells 25a, 25b, 25c and a value or result "V", "W”, and "X" is determined for samples 15h1, 15h2, and 15h3, respectively.
- the cells 25a-25c sequentially progress to the next adjacent samples 15i1, 15i2, 15i3 and note, in FIG. 11, that values V, W, and X have been assigned to samples 15h1, 15h2, and 15h3, respectively.
- the first, second, and third cells 25a, 25b, and 25c enclose the ninth and corresponding seismic data samples 15i1, 15i2, 15i3, the mathematical operation is performed in the cells 25a, 25b, 25c and a value or result "Y", "Z”, and "AB" is determined for samples 15i1, 15i2, and 15i3, respectively.
- the sequential progression of the cells 25a-25c stops at this point, since values or results have been assigned to each and all of the seismic data samples in the cube 17. Note, in FIG. 12, that values Y, Z, and AB have been assigned to samples 15i1, 15i2, and 15i3, respectively.
- FIGS. 13 through 15 a simple time slice map 19a is illustrated corresponding to time slice 19 of FIG. 12, a simple time slice map 23a is illustrated corresponding to time slice 21 of FIG. 12, and a simple time slice map 23a is illustrated corresponding to time slice 23 of FIG. 12.
- FIGS. 35 through 39 for more realistic time slice (and vertical slice) maps which are generated in accordance with the present invention.
- the time slice 19 of FIG. 3 is illustrated.
- the time slice 19 includes the sequentially progressing cell 25a of FIG. 3.
- Each cell 25a contains four seismic data samples "x", three of the seismic data samples "x" being used during "cross correlation".
- FIG. 17 one of the cells 25a of FIG. 16 is illustrated.
- the cell 25a contains three seismic data samples "x": seismic sample 22, seismic sample 24, and seismic sample 26.
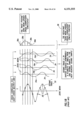
- An "in-line” cross correlation 28 takes place between samples 24 and 26 thereby producing a "coherency” value along the x-direction: "Px(t, tlagx)".
- a "cross-line” cross correlation 30 takes place between samples 22 and 24 thereby producing a "coherency” value along the y-direction: "Py(t, tlagy)”.
- the "Geometric mean" of the two coherency values "Px(t, tlagx)" and "Py(t, tlagy)" is determined.
- FIGS. 18 and 19 the method for performing the "in-line” cross correlation 28 and the "cross-line” cross correlation 30 of FIG. 17 is illustrated.
- "seismic trace 1" 32 is “cross correlated” with “seismic trace 2" 34.
- "Seismic trace 1" 32 in FIG. 18 can be seismic trace 24 in FIG. 17 and "seismic trace 2" 34 in FIG. 18 can be either seismic trace 22 or seismic trace 26 in FIG. 17.
- the “seismic trace 1" 32 has a “zero mean” and it includes a plurality of seismic samples 36.
- the “seismic trace 2" 34 also has a “zero mean” and it is successively shifted or "lagged” downwardly in FIG.
- “seismic trace 2" 34a has a “zero mean” and it is not shifted or lagged downwardly;
- “seismic trace 2" 34b has a “zero mean” and it is shifted or lagged downwardly by one seismic sample 36;
- “seismic trace 2" 34c has a “zero mean” and it is shifted or lagged downwardly by two seismic samples 36;
- “seismic trace 2" 34d has a "zero mean” and it is shifted or lagged downwardly by three seismic samples 36.
- a "shift and cross multiply and add” operation is performed, and, when the "seismic trace 1" 32 (which has a “zero mean") is successively cross correlated with each of the "seismic traces 2" 34a through 34d (each of which have a “zero mean” and are successively “lagged” downwardly in FIG. 18), a “Zero Mean Lagged Cross Correlation (ZMLCC)" function 38 is produced.
- ZMLCC Zero Mean Lagged Cross Correlation
- "seismic trace 1" 32 and “seismic trace 2" 34a are cross correlated by cross multiplying and adding (no shifting required here) thereby producing a first zero mean lagged cross correlation value 38a
- "seismic trace 1" 32 and “seismic trace 2" 34b are cross correlated by shifting and cross multiplying and adding thereby producing a second zero mean lagged cross correlation value 38b
- "seismic trace 1" 32 and “seismic trace 2" 34c are cross correlated by shifting and cross multiplying and adding thereby producing a third zero mean lagged cross correlation value 38c
- "seismic trace 1" 32 and “seismic trace 2" 34d are cross correlated by shifting and cross multiplying and adding thereby producing a fourth zero mean lagged cross correlation value 38d.
- a "zero mean lagged cross correlation (ZMLCC) function" 38 is produced.
- the "second zero mean lagged cross correlation” value 38b is the "Most Positive” Zero Mean Lagged Cross Correlation, the "Most Positive Zero Mean Lagged Cross Correlation” being hereinafter denoted by the term: "(ZMLCC)max”.
- ZMLCC Zero Mean Lagged Cross Correlation
- the "seismic trace 1" 32 is cross correlated with “seismic trace 2" 34 in the manner discussed above with respect to FIGS. 18 and 19 to produce the (ZMLCC) function 38.
- the "autocorrelation of seismic trace 1" 32 is "(AC1)”
- the “autocorrelation of seismic trace 2" 34 is “(AC2)”.
- an "autocorrelation" of a seismic trace is defined.
- a cell 25a is illustrated.
- a cross correlation is performed between seismic trace 1 (27) and seismic trace 2 (29) to produce a "coherency value in the y-direction" which is defined to be the term "Py(t, tlagy)".
- a cross correlation is performed between seismic trace 2 (29) and seismic trace 3 (31) to produce a "coherency value in the x-direction" which is defined to be the term "Px(t, tlagx)".
- a “Geometric Mean” is then calculated which is defined to be the square root of the coherency value in the x-direction "Px(t, tlagx)" multiplied by the coherency value in the y-direction "Py(t, tlagy)”. That "Geometric mean” is then assigned to the corner seismic data sample "x" for seismic trace 2 (29).
- FIGS. 23 through 39 in accordance with the present invention, another "second mathematical operation" is performed in each of the cells 25a, 25b, and 25c of FIGS. 3 through 12 for the purpose of determining a value or result to assign to each seismic data sample "x" in the cube. That "second mathematical operation”, performed in each of the cells 25 of each time slice in the cube of FIG. 3 in accordance with the present invention, is discussed below with reference to FIGS. 23 through 39 of the drawings.
- an explosive energy source 40 produces a sound vibration 42 which reflects off a horizon 46 of an earth formation 44 which is separated by a fault 48.
- the sound vibrations 42 are received by geophone receivers 50 thereby producing an electrical signal representing data received 52.
- the data received signal 52 is received by a computer 54 of a recording truck, that computer 54 generating a seismic data output record 56.
- the seismic data output record 56 undergoes a data reduction operation 58 in a mainframe computer thereby producing a reduced seismic data output record 60.
- a workstation computer 62 is illustrated in FIG. 24.
- the workstation computer 62 includes a processor 62a, a memory 62b which stores a "Variance Cube software" 64 in accordance with the present invention, and a recorder or display device 62c.
- the reduced seismic data output record 60 is received by a system bus of the workstation 62 and that record 60 is made available to the workstation processor 62a during the processor's execution of the Variance Cube software 64 of the present invention.
- the Variance Cube software 64 is initially stored on program storage device, such as a CD-Rom.
- That program storage device, having the Variance Cube software stored thereon, is inserted into the workstation 62 and the Variance Cube software is then loaded from the program storage device into the memory 62b of the workstation 62 for subsequent execution by the processor 62a.
- the recorder or display device 62c can print or display a map, such as a time slice map, which reflects the geologic characteristics of the slice (such as time slice 19 of FIG. 2).
- These maps, such as the time slice maps, which are generated by the "Variance Cube software" of the present invention are illustrated in FIGS. 35 through 39.
- the "Variance Cube” software 64 will be discussed below in connection with the "second mathematical relation” and a plurality of seismic traces which intersect a time slice at a particular reflection time "j".
- a set of values or results are computed by a second mathematical relation and such values or results are assigned to each seismic data sample "x" in each ⁇ cell ⁇ on each time slice of a cube (such as cells 25a and 25b and 25c on time slices 19 and 21 and 23 of cube 17 of FIGS. 3 through 12).
- Such values or results are computed using the following "second mathematical relation": ##EQU2##
- Such values or results, that are assigned to each seismic data sample "x" in each cell on each time slice of a cube such as cells 25a and 25b and 25c on time slices 19 and 21 and 23 of cube 17 of FIGS.
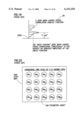
- FIG. 25 nine seismic data samples "x" are enclosed by the cell 25a (or the cells 25b and 25c) of time slice 19 (or time slice 21 or 23) of FIGS. 3 through 12.
- An amplitude of a particular seismic data sample is denoted generically by the notation "X ij ", where "x” is an amplitude, the "i” denotes a particular seismic trace having that amplitude "x”, and the "j” denotes a particular reflection time along that particular seismic trace "i” (e.g., the "j” would be a reflection time for a seismic data sample along seismic trace "i”).
- the amplitude X ij of seismic data sample 1 "x" on the time slice 19 is "x(1)".
- FIG. 25 the amplitude of seismic data sample 1 "x" on the time slice 19 is "x(1)".
- the amplitude X ij of seismic data sample 2 "x" on time slice 19 is "x(2)"
- the amplitude X ij of seismic data sample 3 "x" on time slice 19 is "x(3)”
- the amplitude X ij of seismic trace 9 "x" on time slice 19 is "x(9)”.
- the following table summarizes the amplitudes X ij of each of the seismic data samples 1 through 9 in the cell 25a of time slice 19 in FIG. 25:
- the average of each of these amplitudes is defined to be X j , where the "j" refers to the particular time slice (recall, in a cube, a plurality of time slices pass through a plurality of corresponding seismic data samples at time "j"). Therefore, in our example of FIG. 25, the average "X j " of each of these amplitudes is defined as follows:
- the variance value "V" which is equal to " ⁇ t 2 " is assigned to the center seismic data sample 72 of the nine seismic data samples enclosed by the cell 25a in FIG. 25.
- a plurality of cells 25a, 25b, 25c are sequentially moving or progressing in rows along a plurality of time slices and a corresponding plurality of variance values "V" are calculated for each center seismic data sample "x" in each cell (25a, 25b, 25c).
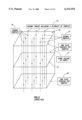
- a cubic volume of earth 74 (a cube 74) is divided into five time slices 76, 78, 80, 82, and 84.
- plurality of cells (25a, 25b, 25c of FIGS. 3 through 12) sequentially progress along a time slice (19, 21, 23) and, during that sequential progression, a corresponding plurality of variance values "V" are calculated for each of the center seismic data samples "x" (72 of FIG. 25) associated with each of the cells.
- a plurality of cells 76a, 78a, 80a, 82a, and 84a, associated with the plurality of time slices 76, 78, 80, 82, and 84 in the cube 74 begin their sequential progression, the cells 76a-84a moving, in synchronism, from left to right, in their respective time slices 76-84, as denoted by the arrows 76b-84b.
- the "center seismic data samples" (72 of FIG. 25) in the cells 76a-84a are denoted by "X1" through "X5".
- the "smoothing" variance value ⁇ t 2 is assigned to the center seismic data sample 72 of FIG. 25.
- the “smoothing" variance value ⁇ t 2 is a function of two parts: (1) a triangular weighting part 86, and (2) a variance part 88, that is:
- the triangular weighting part 86 and the variance part 88 for each of the "center seismic data samples" X1 through X5 is illustrated.
- locate the center seismic data sample X1 (identified by element numeral 90), center seismic data sample X2 (element numeral 92), center seismic data sample X3 (numeral 94), center seismic data sample X4 (numeral 96), and center seismic data sample X5 (numeral 98).
- center seismic data sample X1 (90), locate its corresponding triangular weighting part 90a and its variance part 90b; then, for center seismic data sample X2 (92), locate its corresponding triangular weighting part 92a and its variance part 92b; and for center seismic data sample X3 (94), locate its corresponding triangular weighting part 94a and its variance part 94b; and for center seismic data sample X4 (96), locate its corresponding triangular weighting part 96a and its variance part 96b; and for center seismic data sample X5 (98), locate its corresponding triangular weighting part 98a and its variance part 98b.
- each of the variance parts 90b through 98b undergo a "cross multiply and add” operation 100 with its corresponding triangular weighting parts 90a through 98a to thereby yield the "smoothing" variance values "V1" through "V5".
- variance part 90b undergoes the cross multiply and add operation 100 with the triangular weighting part 90a to yield the "smoothing" variance value "V1”.
- variance part 92b undergoes the cross multiply and add operation 100 with the triangular weighting part 92a to yield the "smoothing" variance value "V2”.
- Variance part 94b undergoes the cross multiply and add operation 100 with the triangular weighting part 94a to yield the "smoothing" variance value "V3".
- Variance part 96b undergoes the cross multiply and add operation 100 with the triangular weighting part 96a to yield the "smoothing" variance value "V4".
- Variance part 98b undergoes the cross multiply and add operation 100 with the triangular weighting part 98a to yield the "smoothing" variance value "V5".
- Smoothing variance value V1 is assigned to the center seismic data sample X1 of cell 76a and a unique color is assigned to the variance value V1.
- smoothing variance value V2 is assigned to the center seismic data sample X2 of cell 78a and another unique color is assigned to the variance value V2.
- Smoothing variance value V3 is assigned to the center seismic data sample X3 of cell 80a and another unique color is assigned to the variance value V3.
- Smoothing variance value V4 is assigned to the center seismic data sample X4 of cell 82a and another unique color is assigned to the variance value V4.
- Smoothing variance value V5 is assigned to the center seismic data sample X5 of cell 84a and another unique color is assigned to the variance value V5.
- FIGS. 35 through 39 realistic examples of slices, such as time slices, through the cube 17 of FIG. 12 are illustrated.
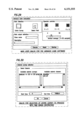
- FIGS. 29 through 31 a plurality of user interface dialogs which are presented to the operator of workstation 62 via the recorder or display device 62c of FIG. 24 are illustrated.
- the parameter requirements for the Variance Cube software 64 of FIG. 24 are: Area of Interest (AOI), Variance Window length, and Output Volume Name. These parameter selections are illustrated in FIGS. 29, 30, and 31.
- the user/operator has the option to select the Area of Interest (AOI) as the entire survey or from a subset of the survey.
- the "Entire Survey” button in FIG. 29, when selected or “clicked on”, will bring up the dialog of FIG. 30, the dialog of FIG. 30 allowing the user operator to select any available 3D seismic survey and, additionally, to set a restrictive time range over which to compute the variance cube values.
- AOI Area of Interest
- Variance Window length Variance Window length
- Output Volume Name Output Volume Name
- the dialog box of FIG. 31 also allows the selection of a previously defined rectangular path, restricting the inline and crossline ranges, in addition to the time range restriction which is still allowed.
- the user can now select the processing parameters for the variance cube calculation.
- the right side of FIG. 29 shows the operator controls.
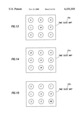
- the icons on the right side of FIG. 29 illustrate the user's options to select the specific input seismic traces to use in the calculation of variance. The three options shown are: 3 ⁇ 3, 5+5, and 5 ⁇ 5.
- the variance cube calculation outputs the results for one trace at a time, but it uses the ⁇ surround traces ⁇ in the computation of the variance value.
- the ⁇ variance cube ⁇ algorithm will use the sample values from the eight traces which surround the center trace (or operator trace), as the icon illustrates.
- the original input seismic data is used for the eight traces which surround the new trace, etc.
- the other parameter setting at the user's control is labelled "vertical average" on the main dialog. This parameter is used in the algorithm to set the number of samples (such as eight in FIG. 25), which are located above and below the sample at which the calculation is currently being performed, to use in the variance calculation.
- the user must name the output variance volume.
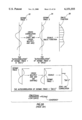
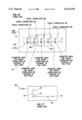
- FIG. 32 Before beginning to discuss the flowcharts of FIGS. 33 and 34 which depict the structure of the "variance cube" software 64 of FIG. 24 of the present invention, FIG. 32 explains the two-part structure of the flowcharts, namely, the first flowchart of FIG. 33 and the second flowchart of FIG. 34.
- the triangular weighting part 86 and the variance part 88 of FIG. 28 is again illustrated; however, in FIG. 32, only the one triangular weighting part 90a and its one corresponding variance part 90b is illustrated for purposes of this discussion. Still referring to FIG. 32, recall from FIG.
- FIGS. 33 and 34 and note that this flowchart comprises a first flowchart of FIG. 33 and a second flowchart of FIG. 34.
- the top half of the variance part 90b undergoes the cross multiply and add operation 100 with respect to the top half of the triangular weighting part 90a; and, when the flowchart of FIG. 34 is executed, the bottom half of the variance part 90b undergoes the cross multiply and add operation 100 with respect to the bottom half of the triangular weighting part 90a.
- W j-t is a triangular weighting function, where the sum of said weighting functions is unity: ##EQU12## is the sum of the squares of each subtraction or the sum of the squares of a plurality of differences, ##EQU13## is a sum of the squares of a plurality of amplitudes of a corresponding plurality of seismic data samples in each cell (i.e., cells 25a, 25b, 25c of FIGS. 3-11),
- X ij is the amplitude of each seismic data sample in a cell (25a-25c)
- X j is the average of the amplitudes of all the seismic data samples in a cell.
- second mathematical relation can also be expressed or set forth in a slightly different form (hereinafter called an “additional second mathematical relation”) which can also be used to calculate the “smoothing variance values" ⁇ t 2 that are assigned to the center seismic data samples "X1-X5" of the cells (76a-84a in FIG. 28) on the time slices (76-84 in FIG. 28) for generating the time slice maps of FIGS. 13-15, the “additional second mathematical relation” being set forth below, as follows: ##EQU14## where: ⁇ t 2 is the variance value,
- W j-t is the triangular weighting function
- ##EQU15## is a sum of the squares of each subtraction or the sum of the squares of a plurality of differences
- ##EQU16## is a sum of the squares of a plurality of amplitudes of a corresponding plurality of seismic data samples in each cell (i.e., cells 25a, 25b, 25c of FIGS. 3-11)
- X ij is the seismic amplitude at time "j" for trace "i"
- X j is the average amplitude at time "j" for all traces "i”.
- FIGS. 33 and 34 wherein a flowchart 64 of the "variance cube” software 64 of FIG. 24 of the present invention is illustrated.
- the flowcharts of FIGS. 33 and 34 are divided into two parts, the first flowchart 64a of FIG. 33 and the second flowchart 64b of FIG. 34.
- the flowcharts of FIGS. 33 and 34 utilize the above referenced “additional second mathematical relation" which is set forth again below, as follows: ##EQU17##
- the top half of the variance part 90b in FIG. 32 will undergo the "cross multiply and add operation" 100 with respect to the top half of the triangular weighting part 90a in FIG. 32.
- FIG. 33 in the first flowchart 64a, the top half of the variance part 90b in FIG. 32 will undergo the "cross multiply and add operation" 100 with respect to the top half of the triangular weighting part 90a in FIG. 32.
- a "program listing" representing the execution portion of the Variance Cube software 64 of the present invention of FIG. 24 is set forth in the following pages.
- the "program listing” utilizes the "additional second mathematical relation” set forth above.
Landscapes
- Engineering & Computer Science (AREA)
- Remote Sensing (AREA)
- Physics & Mathematics (AREA)
- Life Sciences & Earth Sciences (AREA)
- Acoustics & Sound (AREA)
- Environmental & Geological Engineering (AREA)
- Geology (AREA)
- General Life Sciences & Earth Sciences (AREA)
- General Physics & Mathematics (AREA)
- Geophysics (AREA)
- Geophysics And Detection Of Objects (AREA)
- Measurement Of Mechanical Vibrations Or Ultrasonic Waves (AREA)
- Management, Administration, Business Operations System, And Electronic Commerce (AREA)
Priority Applications (9)
| Application Number | Priority Date | Filing Date | Title |
|---|---|---|---|
| US09/377,573 US6151555A (en) | 1999-03-09 | 1999-08-19 | Seismic signal processing method and apparatus for generating a cube of variance values |
| MXPA01009090A MXPA01009090A (es) | 1999-03-09 | 2000-03-02 | Metodo y aparato de procesamiento de senal sismica para generar un cubo de valores de variancia. |
| AU38663/00A AU3866300A (en) | 1999-03-09 | 2000-03-02 | Seismic signal processing method and apparatus for generating a cube of variancevalues |
| CA002362848A CA2362848C (fr) | 1999-03-09 | 2000-03-02 | Procede et appareil de traitement de signaux sismiques pour generer un cube de valeurs de variances |
| EP00917734A EP1198776B1 (fr) | 1999-03-09 | 2000-03-02 | Procede et appareil de traitement de signaux sismiques pour generer un cube de valeurs de variances |
| AT00917734T ATE528667T1 (de) | 1999-03-09 | 2000-03-02 | Verfahren zum verarbeiten seismischer daten und anlage zur generierung eines würfels von varianzwerten |
| PCT/US2000/005694 WO2000054207A1 (fr) | 1999-03-09 | 2000-03-02 | Procede et appareil de traitement de signaux sismiques pour generer un cube de valeurs de variances |
| GB0119742A GB2370878B (en) | 1999-03-09 | 2000-03-02 | Seismic signal processing method and apparatus for generating a cube of variance values |
| NO20014353A NO320796B1 (no) | 1999-03-09 | 2001-09-07 | Fremgangsmate for prosessering av seismiske signaler, samt apparat for generering av en kube med variansverdier |
Applications Claiming Priority (2)
| Application Number | Priority Date | Filing Date | Title |
|---|---|---|---|
| US12341299P | 1999-03-09 | 1999-03-09 | |
| US09/377,573 US6151555A (en) | 1999-03-09 | 1999-08-19 | Seismic signal processing method and apparatus for generating a cube of variance values |
Publications (1)
| Publication Number | Publication Date |
|---|---|
| US6151555A true US6151555A (en) | 2000-11-21 |
Family
ID=26821522
Family Applications (1)
| Application Number | Title | Priority Date | Filing Date |
|---|---|---|---|
| US09/377,573 Expired - Lifetime US6151555A (en) | 1999-03-09 | 1999-08-19 | Seismic signal processing method and apparatus for generating a cube of variance values |
Country Status (9)
| Country | Link |
|---|---|
| US (1) | US6151555A (fr) |
| EP (1) | EP1198776B1 (fr) |
| AT (1) | ATE528667T1 (fr) |
| AU (1) | AU3866300A (fr) |
| CA (1) | CA2362848C (fr) |
| GB (1) | GB2370878B (fr) |
| MX (1) | MXPA01009090A (fr) |
| NO (1) | NO320796B1 (fr) |
| WO (1) | WO2000054207A1 (fr) |
Cited By (48)
| Publication number | Priority date | Publication date | Assignee | Title |
|---|---|---|---|---|
| US20020126896A1 (en) * | 2001-03-07 | 2002-09-12 | Schlumberger Technology Corporation | Image feature extraction |
| US6463388B1 (en) * | 2000-09-08 | 2002-10-08 | Pgs Americas, Inc. | Method and system for attenuation of acquisition geometry imprint in seismic data |
| GB2376527A (en) * | 2001-06-16 | 2002-12-18 | Westerngeco Ltd | Method of determining the spread of seismic data between inividual sensors |
| US20030004817A1 (en) * | 2001-06-27 | 2003-01-02 | Conoco Inc | Visual database for linking geography to seismic data |
| US20030023383A1 (en) * | 2001-07-20 | 2003-01-30 | Stark Tracy Joseph | System for information extraction from geologic time volumes |
| DE10142786A1 (de) * | 2001-08-31 | 2003-04-03 | Henning Trappe | Verfahren zur Ähnlichkeitsanalyse sowie Verwendung dafür |
| DE10142785A1 (de) * | 2001-08-31 | 2003-04-03 | Henning Trappe | Verfahren zur Bestimmung lokaler Ähnlichkeit aus seismischen 3D-Meßdaten |
| US20030132934A1 (en) * | 2001-12-12 | 2003-07-17 | Technoguide As | Three dimensional geological model construction |
| DE10142784C2 (de) * | 2001-08-31 | 2003-09-18 | Henning Trappe | Verfahren zur Anisotropiebestimmung geologischer Einheiten |
| FR2841344A1 (fr) * | 2002-06-19 | 2003-12-26 | Tsurf | Procede, dispositif et produit-programme de lissage d'une propriete de subsurface |
| FR2841345A1 (fr) * | 2002-06-19 | 2003-12-26 | Tsurf | Procede, dispositif et produit-programme pour determiner localement le profil des horizons geologiques |
| FR2841343A1 (fr) * | 2002-06-19 | 2003-12-26 | Tsurf | Dispositif et produit-programme pour extraire un horizon geologique et des proprietes associees |
| US6708118B2 (en) | 2001-07-20 | 2004-03-16 | Tracy Joseph Stark | System for utilizing geologic time volumes |
| US6757614B2 (en) * | 2000-12-18 | 2004-06-29 | Schlumberger Technology Corporation | Seismic signal processing method and apparatus for generating correlation spectral volumes to determine geologic features |
| US7069150B2 (en) * | 2000-12-15 | 2006-06-27 | Fairfield Industries, Inc. | Method for optimizing migration fields using time slice analysis |
| WO2007021622A2 (fr) | 2005-08-10 | 2007-02-22 | Baker Hughes Incorporated | Procede et dispositif permettant d'ameliorer la qualite d'images de la resistivite de formations obtenues a l'aide d'outils galvaniques de fond de trou |
| US20080249789A1 (en) * | 2007-04-05 | 2008-10-09 | Agelio Networks, Inc. | System and method for providing royalty offers to mineral interest owners |
| US20090024326A1 (en) * | 2000-06-14 | 2009-01-22 | Gary Neal Young | Utility mapping and data distribution system and method |
| US20100259438A1 (en) * | 2006-05-16 | 2010-10-14 | Ross Peter Jones | Sensor cart positioning system and method |
| US8600708B1 (en) | 2009-06-01 | 2013-12-03 | Paradigm Sciences Ltd. | Systems and processes for building multiple equiprobable coherent geometrical models of the subsurface |
| US8711140B1 (en) | 2009-06-01 | 2014-04-29 | Paradigm Sciences Ltd. | Systems and methods for building axes, co-axes and paleo-geographic coordinates related to a stratified geological volume |
| RU2516590C1 (ru) * | 2012-12-11 | 2014-05-20 | Федеральное государственное учреждение науки Институт нефтегазовой геологии и геофизики им. А.А. Трофимука Сибирского отделения Российской академии наук (ИНГГ СО РАН) | Способ построения непрерывных сейсмостратиграфических моделей разрезов/кубов |
| US8743115B1 (en) | 2009-10-23 | 2014-06-03 | Paradigm Sciences Ltd. | Systems and methods for coordinated editing of seismic data in dual model |
| CN104820237A (zh) * | 2015-04-30 | 2015-08-05 | 中国石油集团川庆钻探工程有限公司地球物理勘探公司 | 计算地层的方差体的方法 |
| US9217802B2 (en) | 2011-04-05 | 2015-12-22 | Schlumberger Technology Corporation | Seismic image enhancement |
| US9341729B2 (en) | 2011-04-06 | 2016-05-17 | Schlumberger Technology Corporation | Amplitude contrast seismic attribute |
| US9348020B2 (en) | 2012-03-12 | 2016-05-24 | Vermeer Manufacturing Company | Offset frequency homodyne ground penetrating radar |
| WO2016099764A1 (fr) * | 2014-12-19 | 2016-06-23 | Baker Hughes Incorporated | Mise à l'échelle corrective de fractures interprétées, sur la base de la correction de polarisation de plage de détection microsismique |
| US9418182B2 (en) | 2009-06-01 | 2016-08-16 | Paradigm Sciences Ltd. | Systems and methods for building axes, co-axes and paleo-geographic coordinates related to a stratified geological volume |
| US9477010B2 (en) | 2013-03-15 | 2016-10-25 | Paradigm Sciences Ltd. | Systems and methods to build sedimentary attributes |
| US9536022B1 (en) | 2009-06-01 | 2017-01-03 | Paradigm Sciences Ltd. | Systems and methods for modeling faults in the subsurface |
| US9612359B2 (en) | 2013-06-12 | 2017-04-04 | Baker Hughes Incorporated | Generation of fracture networks using seismic data |
| US9646415B2 (en) * | 2006-05-16 | 2017-05-09 | Underground Imaging Technologies, Inc. | System and method for visualizing multiple-sensor subsurface imaging data |
| US9690002B2 (en) | 2015-06-18 | 2017-06-27 | Paradigm Sciences Ltd. | Device, system and method for geological-time refinement |
| US9739133B2 (en) | 2013-03-15 | 2017-08-22 | Vermeer Corporation | Imaging underground objects using spatial sampling customization |
| US9759826B2 (en) | 2012-04-03 | 2017-09-12 | Paradigm Sciences Ltd. | System and method for generating an implicit model of geological horizons |
| US9829591B1 (en) * | 2013-01-07 | 2017-11-28 | IHS Global, Inc. | Determining seismic stratigraphic features using a symmetry attribute |
| US10114134B2 (en) | 2012-03-02 | 2018-10-30 | Emerson Paradigm Holding Llc | Systems and methods for generating a geological model honoring horizons and faults |
| US10422923B2 (en) | 2014-03-28 | 2019-09-24 | Emerson Paradigm Holding Llc | Systems and methods for modeling fracture networks in reservoir volumes from microseismic events |
| US10466388B2 (en) | 2016-09-07 | 2019-11-05 | Emerson Paradigm Holding Llc | System and method for editing geological models by switching between volume-based models and surface-based structural models augmented with stratigraphic fiber bundles |
| US10520644B1 (en) | 2019-01-10 | 2019-12-31 | Emerson Paradigm Holding Llc | Imaging a subsurface geological model at a past intermediate restoration time |
| WO2020130845A1 (fr) * | 2018-12-18 | 2020-06-25 | Equinor Energy As | Procédé d'analyse de données sismiques pour détecter des hydrocarbures |
| CN111580156A (zh) * | 2019-02-18 | 2020-08-25 | 中国石油天然气股份有限公司 | 一种地震零值切片自动拾取方法及系统 |
| US10795053B2 (en) | 2013-10-29 | 2020-10-06 | Emerson Paradigm Holding Llc | Systems and methods of multi-scale meshing for geologic time modeling |
| US11143771B2 (en) | 2019-10-17 | 2021-10-12 | Saudi Arabian Oil Company | Dolomite mapping using multiscale fracture characterization |
| US11143776B2 (en) | 2020-02-17 | 2021-10-12 | China Petroleum & Chemical Corporation | Computer-implemented method and system for small cave recognition using seismic reflection data |
| US11156744B2 (en) | 2019-01-10 | 2021-10-26 | Emerson Paradigm Holding Llc | Imaging a subsurface geological model at a past intermediate restoration time |
| US11403495B2 (en) | 2019-11-26 | 2022-08-02 | Board Of Regents, The University Of Texas System | Using synthetic data sets to train a neural network for three-dimensional seismic fault segmentation |
Families Citing this family (2)
| Publication number | Priority date | Publication date | Assignee | Title |
|---|---|---|---|---|
| WO2011083495A2 (fr) * | 2010-01-07 | 2011-07-14 | Msn Laboratories Limited | Procédé de préparation de dérivés protégés par un dihydroxy et nouveaux composés intermédiaires |
| CN108181655B (zh) * | 2017-12-18 | 2020-07-10 | 中国石油天然气股份有限公司 | 暗河垮塌体系形态的确定方法和装置 |
Citations (7)
| Publication number | Priority date | Publication date | Assignee | Title |
|---|---|---|---|---|
| US4799200A (en) * | 1985-10-21 | 1989-01-17 | Schlumberger Technology Corporation | Method of acoustically detecting fractures in a borehole |
| US5245587A (en) * | 1990-12-14 | 1993-09-14 | Hutson William H | Multi-dimensional signal processing and display |
| US5563949A (en) * | 1994-12-12 | 1996-10-08 | Amoco Corporation | Method of seismic signal processing and exploration |
| US5870691A (en) * | 1996-12-06 | 1999-02-09 | Amoco Corporation | Spectral decomposition for seismic interpretation |
| US5920828A (en) * | 1997-06-02 | 1999-07-06 | Baker Hughes Incorporated | Quality control seismic data processing system |
| US5940778A (en) * | 1997-07-31 | 1999-08-17 | Bp Amoco Corporation | Method of seismic attribute generation and seismic exploration |
| US5995907A (en) * | 1998-02-05 | 1999-11-30 | Geoquest | Seismic signal processing method and apparatus for generating time slice or horizon maps in response to seismic traces and quadrature traces to determine geologic features |
-
1999
- 1999-08-19 US US09/377,573 patent/US6151555A/en not_active Expired - Lifetime
-
2000
- 2000-03-02 AU AU38663/00A patent/AU3866300A/en not_active Abandoned
- 2000-03-02 AT AT00917734T patent/ATE528667T1/de not_active IP Right Cessation
- 2000-03-02 WO PCT/US2000/005694 patent/WO2000054207A1/fr not_active Ceased
- 2000-03-02 CA CA002362848A patent/CA2362848C/fr not_active Expired - Lifetime
- 2000-03-02 EP EP00917734A patent/EP1198776B1/fr not_active Expired - Lifetime
- 2000-03-02 MX MXPA01009090A patent/MXPA01009090A/es active IP Right Grant
- 2000-03-02 GB GB0119742A patent/GB2370878B/en not_active Expired - Lifetime
-
2001
- 2001-09-07 NO NO20014353A patent/NO320796B1/no not_active IP Right Cessation
Patent Citations (7)
| Publication number | Priority date | Publication date | Assignee | Title |
|---|---|---|---|---|
| US4799200A (en) * | 1985-10-21 | 1989-01-17 | Schlumberger Technology Corporation | Method of acoustically detecting fractures in a borehole |
| US5245587A (en) * | 1990-12-14 | 1993-09-14 | Hutson William H | Multi-dimensional signal processing and display |
| US5563949A (en) * | 1994-12-12 | 1996-10-08 | Amoco Corporation | Method of seismic signal processing and exploration |
| US5870691A (en) * | 1996-12-06 | 1999-02-09 | Amoco Corporation | Spectral decomposition for seismic interpretation |
| US5920828A (en) * | 1997-06-02 | 1999-07-06 | Baker Hughes Incorporated | Quality control seismic data processing system |
| US5940778A (en) * | 1997-07-31 | 1999-08-17 | Bp Amoco Corporation | Method of seismic attribute generation and seismic exploration |
| US5995907A (en) * | 1998-02-05 | 1999-11-30 | Geoquest | Seismic signal processing method and apparatus for generating time slice or horizon maps in response to seismic traces and quadrature traces to determine geologic features |
Non-Patent Citations (4)
| Title |
|---|
| A software product called ASSESS publically released in 1982. * |
| A software product called AutoPix publically released on Sep. 23, 1990. * |
| Article by Phillip S. Schlutz and August Lau, "Poststack estimation of three dimensional crossline statics" appearing in "Geophysics", vol. 49, No. 3, Mar. 1984, pp. 227-236. |
| Article by Phillip S. Schlutz and August Lau, Poststack estimation of three dimensional crossline statics appearing in Geophysics , vol. 49, No. 3, Mar. 1984, pp. 227 236. * |
Cited By (88)
| Publication number | Priority date | Publication date | Assignee | Title |
|---|---|---|---|---|
| US20110213585A1 (en) * | 2000-06-14 | 2011-09-01 | Gary Neal Young | Utility Mapping and Data Distribution System and Method |
| US20090024326A1 (en) * | 2000-06-14 | 2009-01-22 | Gary Neal Young | Utility mapping and data distribution system and method |
| US7930103B2 (en) | 2000-06-14 | 2011-04-19 | Vermeer Manufacturing Company | Utility mapping and data distribution system and method |
| US8280634B2 (en) | 2000-06-14 | 2012-10-02 | Underground Imaging Technologies | Utility mapping and data distribution system and method |
| US9360588B2 (en) | 2000-06-14 | 2016-06-07 | Vermeer Corporation | Utility mapping and data distribution system and method |
| US8775083B2 (en) | 2000-06-14 | 2014-07-08 | Vermeer Manufacturing Company | Utility mapping and data distribution system and method |
| US6463388B1 (en) * | 2000-09-08 | 2002-10-08 | Pgs Americas, Inc. | Method and system for attenuation of acquisition geometry imprint in seismic data |
| US7069150B2 (en) * | 2000-12-15 | 2006-06-27 | Fairfield Industries, Inc. | Method for optimizing migration fields using time slice analysis |
| US6757614B2 (en) * | 2000-12-18 | 2004-06-29 | Schlumberger Technology Corporation | Seismic signal processing method and apparatus for generating correlation spectral volumes to determine geologic features |
| US8055026B2 (en) | 2001-03-07 | 2011-11-08 | Schlumberger Technology Corporation | Image feature extraction |
| US20070234230A1 (en) * | 2001-03-07 | 2007-10-04 | Schlumberger Technology Corporation | Image feature extraction |
| US7203342B2 (en) | 2001-03-07 | 2007-04-10 | Schlumberger Technology Corporation | Image feature extraction |
| US20020126896A1 (en) * | 2001-03-07 | 2002-09-12 | Schlumberger Technology Corporation | Image feature extraction |
| GB2376527A (en) * | 2001-06-16 | 2002-12-18 | Westerngeco Ltd | Method of determining the spread of seismic data between inividual sensors |
| GB2376527B (en) * | 2001-06-16 | 2004-12-15 | Westerngeco Ltd | A method of processing data |
| US20030004817A1 (en) * | 2001-06-27 | 2003-01-02 | Conoco Inc | Visual database for linking geography to seismic data |
| US7340418B2 (en) | 2001-06-27 | 2008-03-04 | Conocophillips Company | Visual database for linking geography to seismic data |
| US20070067226A1 (en) * | 2001-06-27 | 2007-03-22 | Caine Bobby J | Visual database for linking geography to seismic data |
| US6853922B2 (en) | 2001-07-20 | 2005-02-08 | Tracy Joseph Stark | System for information extraction from geologic time volumes |
| US20030023383A1 (en) * | 2001-07-20 | 2003-01-30 | Stark Tracy Joseph | System for information extraction from geologic time volumes |
| US6708118B2 (en) | 2001-07-20 | 2004-03-16 | Tracy Joseph Stark | System for utilizing geologic time volumes |
| US6850845B2 (en) | 2001-07-20 | 2005-02-01 | Tracy Joseph Stark | System for multi-dimensional data analysis |
| DE10142785C2 (de) * | 2001-08-31 | 2003-07-03 | Henning Trappe | Verfahren zur Bestimmung lokaler Ähnlichkeit aus seismischen 3D-Meßdaten |
| DE10142786C2 (de) * | 2001-08-31 | 2003-07-03 | Henning Trappe | Verfahren zur Ähnlichkeitsanalyse sowie Verwendung dafür |
| US6988038B2 (en) * | 2001-08-31 | 2006-01-17 | Henning Trappe | Method for the determination of local similitude from seismic 3d measured data |
| DE10142786A1 (de) * | 2001-08-31 | 2003-04-03 | Henning Trappe | Verfahren zur Ähnlichkeitsanalyse sowie Verwendung dafür |
| DE10142785A1 (de) * | 2001-08-31 | 2003-04-03 | Henning Trappe | Verfahren zur Bestimmung lokaler Ähnlichkeit aus seismischen 3D-Meßdaten |
| US20040210394A1 (en) * | 2001-08-31 | 2004-10-21 | Henning Trappe | Method for the determination of local similitude from seismic 3d measured data |
| DE10142784C2 (de) * | 2001-08-31 | 2003-09-18 | Henning Trappe | Verfahren zur Anisotropiebestimmung geologischer Einheiten |
| US20030132934A1 (en) * | 2001-12-12 | 2003-07-17 | Technoguide As | Three dimensional geological model construction |
| US20060197759A1 (en) * | 2001-12-12 | 2006-09-07 | Technoguide As | Three dimensional geological model construction |
| US7542037B2 (en) | 2001-12-12 | 2009-06-02 | Schlumberger Technology Corporation | Three dimensional geological model construction |
| US7248259B2 (en) * | 2001-12-12 | 2007-07-24 | Technoguide As | Three dimensional geological model construction |
| US20060129359A1 (en) * | 2002-06-19 | 2006-06-15 | Jean-Claude Dulac | Device and software package for extracting a geological horizon and related properties |
| WO2004001449A1 (fr) * | 2002-06-19 | 2003-12-31 | Earth Decision Sciences | Procede, dispositif et produit-programme pour determiner localement la forme des horizons geologiques |
| US7295929B2 (en) | 2002-06-19 | 2007-11-13 | Earth Decision Sciences | Process, device and software package for locally determining the shape of geological horizons |
| US7328139B2 (en) | 2002-06-19 | 2008-02-05 | Earth Decision Sciences | Device and software package for extracting a geological horizon and related properties |
| FR2841344A1 (fr) * | 2002-06-19 | 2003-12-26 | Tsurf | Procede, dispositif et produit-programme de lissage d'une propriete de subsurface |
| FR2841345A1 (fr) * | 2002-06-19 | 2003-12-26 | Tsurf | Procede, dispositif et produit-programme pour determiner localement le profil des horizons geologiques |
| FR2841343A1 (fr) * | 2002-06-19 | 2003-12-26 | Tsurf | Dispositif et produit-programme pour extraire un horizon geologique et des proprietes associees |
| US7295930B2 (en) | 2002-06-19 | 2007-11-13 | Earth Decision Sciences | Method, device and software package for smoothing a subsurface property |
| WO2004001450A1 (fr) * | 2002-06-19 | 2003-12-31 | Earth Decision Sciences | Dispositif et produit-programme pour extraire un horizon geologique et des proprietes associees |
| WO2004001451A1 (fr) * | 2002-06-19 | 2003-12-31 | Earth Decision Sciences | Procede, dispositif et produit-programme de lissage d'une propriete de subsurface |
| US20060041383A1 (en) * | 2002-06-19 | 2006-02-23 | Jean-Claude Dulac | Method, device and software package for locally determining the shape of geological horizons |
| US20050222774A1 (en) * | 2002-06-19 | 2005-10-06 | Jean-Claude Dulac | Method, device and software package for smoothing a subsurface property |
| EP1920272A4 (fr) * | 2005-08-10 | 2011-10-05 | Baker Hughes Inc | Procede et dispositif permettant d'ameliorer la qualite d'images de la resistivite de formations obtenues a l'aide d'outils galvaniques de fond de trou |
| WO2007021622A2 (fr) | 2005-08-10 | 2007-02-22 | Baker Hughes Incorporated | Procede et dispositif permettant d'ameliorer la qualite d'images de la resistivite de formations obtenues a l'aide d'outils galvaniques de fond de trou |
| US8779967B2 (en) | 2006-05-16 | 2014-07-15 | Underground Imaging Technologies, Inc. | Sensor cart positioning system and method |
| US9646415B2 (en) * | 2006-05-16 | 2017-05-09 | Underground Imaging Technologies, Inc. | System and method for visualizing multiple-sensor subsurface imaging data |
| US8089390B2 (en) | 2006-05-16 | 2012-01-03 | Underground Imaging Technologies, Inc. | Sensor cart positioning system and method |
| US20100259438A1 (en) * | 2006-05-16 | 2010-10-14 | Ross Peter Jones | Sensor cart positioning system and method |
| US9470789B2 (en) | 2006-05-16 | 2016-10-18 | Underground Imaging Technologies, Inc. | Sensor cart positioning system and method |
| US20080249789A1 (en) * | 2007-04-05 | 2008-10-09 | Agelio Networks, Inc. | System and method for providing royalty offers to mineral interest owners |
| US8711140B1 (en) | 2009-06-01 | 2014-04-29 | Paradigm Sciences Ltd. | Systems and methods for building axes, co-axes and paleo-geographic coordinates related to a stratified geological volume |
| US8600708B1 (en) | 2009-06-01 | 2013-12-03 | Paradigm Sciences Ltd. | Systems and processes for building multiple equiprobable coherent geometrical models of the subsurface |
| US9536022B1 (en) | 2009-06-01 | 2017-01-03 | Paradigm Sciences Ltd. | Systems and methods for modeling faults in the subsurface |
| US9418182B2 (en) | 2009-06-01 | 2016-08-16 | Paradigm Sciences Ltd. | Systems and methods for building axes, co-axes and paleo-geographic coordinates related to a stratified geological volume |
| US9142059B1 (en) | 2009-10-23 | 2015-09-22 | Paradigm Sciences Ltd. | Systems and methods for coordinated editing of seismic data in dual model |
| US8743115B1 (en) | 2009-10-23 | 2014-06-03 | Paradigm Sciences Ltd. | Systems and methods for coordinated editing of seismic data in dual model |
| US9217802B2 (en) | 2011-04-05 | 2015-12-22 | Schlumberger Technology Corporation | Seismic image enhancement |
| US9341729B2 (en) | 2011-04-06 | 2016-05-17 | Schlumberger Technology Corporation | Amplitude contrast seismic attribute |
| US10114134B2 (en) | 2012-03-02 | 2018-10-30 | Emerson Paradigm Holding Llc | Systems and methods for generating a geological model honoring horizons and faults |
| US9348020B2 (en) | 2012-03-12 | 2016-05-24 | Vermeer Manufacturing Company | Offset frequency homodyne ground penetrating radar |
| US9759826B2 (en) | 2012-04-03 | 2017-09-12 | Paradigm Sciences Ltd. | System and method for generating an implicit model of geological horizons |
| RU2516590C1 (ru) * | 2012-12-11 | 2014-05-20 | Федеральное государственное учреждение науки Институт нефтегазовой геологии и геофизики им. А.А. Трофимука Сибирского отделения Российской академии наук (ИНГГ СО РАН) | Способ построения непрерывных сейсмостратиграфических моделей разрезов/кубов |
| US9829591B1 (en) * | 2013-01-07 | 2017-11-28 | IHS Global, Inc. | Determining seismic stratigraphic features using a symmetry attribute |
| US10598819B2 (en) | 2013-03-15 | 2020-03-24 | Emerson Paradigm Holding Llc | Systems and methods to build sedimentary attributes |
| US9739133B2 (en) | 2013-03-15 | 2017-08-22 | Vermeer Corporation | Imaging underground objects using spatial sampling customization |
| US9477010B2 (en) | 2013-03-15 | 2016-10-25 | Paradigm Sciences Ltd. | Systems and methods to build sedimentary attributes |
| US9612359B2 (en) | 2013-06-12 | 2017-04-04 | Baker Hughes Incorporated | Generation of fracture networks using seismic data |
| US10795053B2 (en) | 2013-10-29 | 2020-10-06 | Emerson Paradigm Holding Llc | Systems and methods of multi-scale meshing for geologic time modeling |
| US10422923B2 (en) | 2014-03-28 | 2019-09-24 | Emerson Paradigm Holding Llc | Systems and methods for modeling fracture networks in reservoir volumes from microseismic events |
| WO2016099764A1 (fr) * | 2014-12-19 | 2016-06-23 | Baker Hughes Incorporated | Mise à l'échelle corrective de fractures interprétées, sur la base de la correction de polarisation de plage de détection microsismique |
| US10197704B2 (en) | 2014-12-19 | 2019-02-05 | Baker Hughes, A Ge Company, Llc | Corrective scaling of interpreted fractures based on the microseismic detection range bias correction |
| CN104820237B (zh) * | 2015-04-30 | 2017-04-05 | 中国石油集团川庆钻探工程有限公司地球物理勘探公司 | 计算地层的方差体的方法 |
| CN104820237A (zh) * | 2015-04-30 | 2015-08-05 | 中国石油集团川庆钻探工程有限公司地球物理勘探公司 | 计算地层的方差体的方法 |
| US9690002B2 (en) | 2015-06-18 | 2017-06-27 | Paradigm Sciences Ltd. | Device, system and method for geological-time refinement |
| US10466388B2 (en) | 2016-09-07 | 2019-11-05 | Emerson Paradigm Holding Llc | System and method for editing geological models by switching between volume-based models and surface-based structural models augmented with stratigraphic fiber bundles |
| WO2020130845A1 (fr) * | 2018-12-18 | 2020-06-25 | Equinor Energy As | Procédé d'analyse de données sismiques pour détecter des hydrocarbures |
| US20220057537A1 (en) * | 2018-12-18 | 2022-02-24 | Equinor Energy As | Method of analysing seismic data to detect hydrocarbons |
| US11815640B2 (en) * | 2018-12-18 | 2023-11-14 | Equinor Energy As | Method of analysing seismic data to detect hydrocarbons |
| US10520644B1 (en) | 2019-01-10 | 2019-12-31 | Emerson Paradigm Holding Llc | Imaging a subsurface geological model at a past intermediate restoration time |
| US10705254B1 (en) | 2019-01-10 | 2020-07-07 | Emerson Paradigm Holding Llc | Imaging a subsurface geological model at a past intermediate restoration time |
| US11156744B2 (en) | 2019-01-10 | 2021-10-26 | Emerson Paradigm Holding Llc | Imaging a subsurface geological model at a past intermediate restoration time |
| CN111580156A (zh) * | 2019-02-18 | 2020-08-25 | 中国石油天然气股份有限公司 | 一种地震零值切片自动拾取方法及系统 |
| US11143771B2 (en) | 2019-10-17 | 2021-10-12 | Saudi Arabian Oil Company | Dolomite mapping using multiscale fracture characterization |
| US11403495B2 (en) | 2019-11-26 | 2022-08-02 | Board Of Regents, The University Of Texas System | Using synthetic data sets to train a neural network for three-dimensional seismic fault segmentation |
| US11143776B2 (en) | 2020-02-17 | 2021-10-12 | China Petroleum & Chemical Corporation | Computer-implemented method and system for small cave recognition using seismic reflection data |
Also Published As
| Publication number | Publication date |
|---|---|
| GB2370878A (en) | 2002-07-10 |
| EP1198776A4 (fr) | 2008-05-28 |
| ATE528667T1 (de) | 2011-10-15 |
| GB0119742D0 (en) | 2001-10-03 |
| NO320796B1 (no) | 2006-01-30 |
| AU3866300A (en) | 2000-09-28 |
| CA2362848C (fr) | 2008-06-10 |
| MXPA01009090A (es) | 2002-04-24 |
| CA2362848A1 (fr) | 2000-09-14 |
| WO2000054207A1 (fr) | 2000-09-14 |
| EP1198776B1 (fr) | 2011-10-12 |
| GB2370878B (en) | 2003-01-22 |
| NO20014353L (no) | 2001-09-07 |
| EP1198776A1 (fr) | 2002-04-24 |
| NO20014353D0 (no) | 2001-09-07 |
Similar Documents
| Publication | Publication Date | Title |
|---|---|---|
| CA2362848C (fr) | Procede et appareil de traitement de signaux sismiques pour generer un cube de valeurs de variances | |
| CA2318224C (fr) | Procede et appareil de traitement de signaux sismiques | |
| US6819628B2 (en) | Wave migration by a krylov space expansion of the square root exponent operator, for use in seismic imaging | |
| AU2009201055B9 (en) | Method for deghosting marine seismic streamer data with irregular receiver positions | |
| CN103069303B (zh) | 用于将同时发生的独立震源分离的方法 | |
| US8335651B2 (en) | Estimation of propagation angles of seismic waves in geology with application to determination of propagation velocity and angle-domain imaging | |
| AU2005282945B2 (en) | System for the attenuation of water bottom multiples in seismic data recorded by pressure sensors and particle motion sensors | |
| US8325560B2 (en) | Technique and system for deriving a time lapse low frequency model using both seismic data and a flow simulation model | |
| MXPA06012781A (es) | Inversion de forma de onda llena en pila previa en 3-d. | |
| CA2731985A1 (fr) | Procede pour separer des sources simultanees independantes | |
| CA2856335A1 (fr) | Separation de donnees de source simultanee | |
| EP2260331A1 (fr) | Procédé efficace pour inversion de données géophysiques | |
| NO322089B1 (no) | Fremgangsmate for simulering av lokale prestakk dypmigrerte seismiske bilder | |
| CN101017204A (zh) | 三维双向声波动方程叠前成像系统和方法 | |
| CN103245969A (zh) | 用于在震源虚反射去除之后确定源特征波形的方法和系统 | |
| US20120065891A1 (en) | System, machine, and computer-readable storage medium for forming an enhanced seismic trace using a virtual seismic array | |
| USH482H (en) | Seismic migration method | |
| US7069200B2 (en) | Method intended to obtain reflection travel times from an interpretation of migrated cylindrical wave seismic data | |
| AU2013359562B2 (en) | Methods and systems for seismic modeling using multiple seismic source types | |
| GB2511937A (en) | Method for optimizing the design of multiple-source arrays used in marine seismic surveys | |
| If et al. | Regular and staggered grids in spectral approximations of the elastic wave equation | |
| Tejero et al. | Downward continuation of marine seismic reflection data: An undervalued tool to improve velocity models | |
| Julien et al. | 3-D prestack depth migration on real data | |
| GB2476519A (en) | Technique and system for deriving a time lapse low frequency model using both seismic data and a flow simulation model | |
| Chang et al. | Multi-valued two-point raytracing |
Legal Events
| Date | Code | Title | Description |
|---|---|---|---|
| AS | Assignment |
Owner name: SCHLUMBERGER TECHNOLOGY CORPORATION, TEXAS Free format text: ASSIGNMENT OF ASSIGNORS INTEREST;ASSIGNOR:PEPPER, RANDOLPH E.F.;REEL/FRAME:010195/0230 Effective date: 19990812 Owner name: SCHLUMBERGER TECHNOLOGY CORPORATION, TEXAS Free format text: ASSIGNMENT OF ASSIGNORS INTEREST;ASSIGNOR:VAN BEMMEL, PETER P.;REEL/FRAME:010195/0245 Effective date: 19990812 |
|
| STCF | Information on status: patent grant |
Free format text: PATENTED CASE |
|
| FPAY | Fee payment |
Year of fee payment: 4 |
|
| FPAY | Fee payment |
Year of fee payment: 8 |
|
| FPAY | Fee payment |
Year of fee payment: 12 |