US6636862B2 - Method and system for the dynamic analysis of data - Google Patents
Method and system for the dynamic analysis of data Download PDFInfo
- Publication number
- US6636862B2 US6636862B2 US09/899,227 US89922701A US6636862B2 US 6636862 B2 US6636862 B2 US 6636862B2 US 89922701 A US89922701 A US 89922701A US 6636862 B2 US6636862 B2 US 6636862B2
- Authority
- US
- United States
- Prior art keywords
- data
- matrix
- row
- cluster
- data matrix
- Prior art date
- Legal status (The legal status is an assumption and is not a legal conclusion. Google has not performed a legal analysis and makes no representation as to the accuracy of the status listed.)
- Expired - Fee Related, expires
Links
Images
Classifications
-
- G—PHYSICS
- G06—COMPUTING OR CALCULATING; COUNTING
- G06Q—INFORMATION AND COMMUNICATION TECHNOLOGY [ICT] SPECIALLY ADAPTED FOR ADMINISTRATIVE, COMMERCIAL, FINANCIAL, MANAGERIAL OR SUPERVISORY PURPOSES; SYSTEMS OR METHODS SPECIALLY ADAPTED FOR ADMINISTRATIVE, COMMERCIAL, FINANCIAL, MANAGERIAL OR SUPERVISORY PURPOSES, NOT OTHERWISE PROVIDED FOR
- G06Q30/00—Commerce
- G06Q30/02—Marketing; Price estimation or determination; Fundraising
-
- G—PHYSICS
- G06—COMPUTING OR CALCULATING; COUNTING
- G06F—ELECTRIC DIGITAL DATA PROCESSING
- G06F16/00—Information retrieval; Database structures therefor; File system structures therefor
- G06F16/20—Information retrieval; Database structures therefor; File system structures therefor of structured data, e.g. relational data
- G06F16/28—Databases characterised by their database models, e.g. relational or object models
- G06F16/284—Relational databases
- G06F16/285—Clustering or classification
-
- G—PHYSICS
- G06—COMPUTING OR CALCULATING; COUNTING
- G06F—ELECTRIC DIGITAL DATA PROCESSING
- G06F16/00—Information retrieval; Database structures therefor; File system structures therefor
- G06F16/30—Information retrieval; Database structures therefor; File system structures therefor of unstructured textual data
- G06F16/35—Clustering; Classification
-
- G—PHYSICS
- G06—COMPUTING OR CALCULATING; COUNTING
- G06F—ELECTRIC DIGITAL DATA PROCESSING
- G06F18/00—Pattern recognition
- G06F18/20—Analysing
- G06F18/21—Design or setup of recognition systems or techniques; Extraction of features in feature space; Blind source separation
- G06F18/213—Feature extraction, e.g. by transforming the feature space; Summarisation; Mappings, e.g. subspace methods
- G06F18/2135—Feature extraction, e.g. by transforming the feature space; Summarisation; Mappings, e.g. subspace methods based on approximation criteria, e.g. principal component analysis
-
- G—PHYSICS
- G06—COMPUTING OR CALCULATING; COUNTING
- G06F—ELECTRIC DIGITAL DATA PROCESSING
- G06F18/00—Pattern recognition
- G06F18/20—Analysing
- G06F18/23—Clustering techniques
-
- G—PHYSICS
- G06—COMPUTING OR CALCULATING; COUNTING
- G06F—ELECTRIC DIGITAL DATA PROCESSING
- G06F18/00—Pattern recognition
- G06F18/20—Analysing
- G06F18/24—Classification techniques
- G06F18/243—Classification techniques relating to the number of classes
- G06F18/2433—Single-class perspective, e.g. one-against-all classification; Novelty detection; Outlier detection
-
- Y—GENERAL TAGGING OF NEW TECHNOLOGICAL DEVELOPMENTS; GENERAL TAGGING OF CROSS-SECTIONAL TECHNOLOGIES SPANNING OVER SEVERAL SECTIONS OF THE IPC; TECHNICAL SUBJECTS COVERED BY FORMER USPC CROSS-REFERENCE ART COLLECTIONS [XRACs] AND DIGESTS
- Y10—TECHNICAL SUBJECTS COVERED BY FORMER USPC
- Y10S—TECHNICAL SUBJECTS COVERED BY FORMER USPC CROSS-REFERENCE ART COLLECTIONS [XRACs] AND DIGESTS
- Y10S707/00—Data processing: database and file management or data structures
- Y10S707/99941—Database schema or data structure
- Y10S707/99942—Manipulating data structure, e.g. compression, compaction, compilation
Definitions
- This application relates to a method and system for the dynamic analysis of data, especially data represented in distinct matrices, for example, X, Y and Z data matrices. If two data matrices X and Y are present in which corresponding rows of X and Y each refer to the same underlying object, a relationship can developed between the X and Y data matrices, which allows the method and system of the present invention to predict responses in Y on the basis of inputted X-data.
- this application relates to a method and system for the dynamic analysis of data, for example, data related to consumer choice modeling or quality control programs.
- prior art approaches commonly are designed to can relate two types of at objects (i.e., row and column objects) on the basis of some measure, e.g., correspondence analysis, principal components analysis, and factor analysis. While such approaches assist in developing an understanding of data relationships or associations, they do not allow for the incorporation of the respective independent qualities of objects into models, qualities that that define predictive (e.g., cause and effect) relationships between independent objects. Similarly, prior art approaches do not allow for the grouping of segments of objects of one type with respect to some measure on another set of objects of another type, nor do they allow for the use of the qualities of the respective objects to build predictive models relating the qualities of the two respective types of objects.
- some measure e.g., correspondence analysis, principal components analysis, and factor analysis.
- the present invention is a method and system for the dynamic analysis of data that is comprised of a series of computational steps achieved through the use of a digital computer program.
- a cluster analysis or clustering sequence is performed on a data matrix Y in order to segment the data into appropriate clusters for subsequent computational analysis.
- the second phase is a modeling phase. If a second data matrix X is present such that corresponding rows of X and Y each refer to the same underlying object, in the second phase, a relationship can developed between the X and Y data matrices, which allows the method and system of the present invention to predict responses in Y on the basis of inputted X-data.
- the third phase is also a modeling phase.
- a third data matrix Z is present in which corresponding columns of Y and row of Z each refer to the same underlying object, a relationship can developed between the X Y and Z data matrices, which allows the method and system of the present invention to link X with Z through Y.
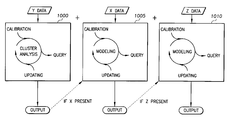
- FIG. 1 is a schematic depiction of the three phases of the dynamic data analysis in the method and system of the present invention
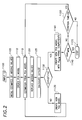
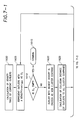
- FIG. 2 is a flow chart detailing the process of filling in missing values in a data asset in accordance with the method and system of the present invention
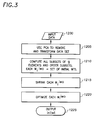
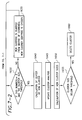
- FIG. 3 is a is a flow chart detailing an initial weight optimization process in accordance with the method and system of the present invention
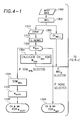
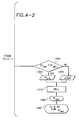
- FIG. 4 is a is a flow chart detailing a clustering sequence in accordance with the method and system of the present invention.
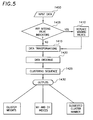
- FIG. 5 is a flow chart detailing generation of clusters and an estimation of the optimal cluster number in accordance with the method and system of the present invention
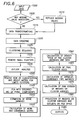
- FIG. 6 is a flow chart detailing calibration of a cluster model in accordance with the method and system of the present invention.
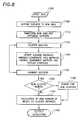
- FIG. 7 is a flow chart detailing a search for new cluster formations in a data set in accordance with the method and system of the present invention.
- FIG. 8 is a flow chart detailing the updating of a cluster model in accordance with the method and system of the present invention.
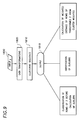
- FIG. 9 is a flow chart detailing the querying of a cluster model in accordance with the method and system of the present invention.
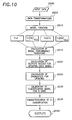
- FIG. 10 is a flow chart detailing the modeling of two data sets with respect to one another in accordance with the method and system of the present invention.
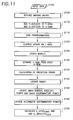
- FIG. 11 is a flow chart detailing the updating of the model relating two data sets in accordance with the method and system of the present invention.
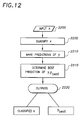
- FIG. 12 is a flow chart detailing the querying of the model relating two data sets in accordance with the method and system of the present invention.
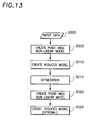
- FIG. 13 is a flow chart detailing the calibration of a model relating three data sets with respect to one another in accordance with the method and system of the present invention.
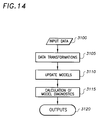
- FIG. 14 is a flow chart detailing the optimization and updating of a model relating three data sets with respect to one another in accordance with the method and system of the present invention.
- the present invention is a method and system for the dynamic analysis of data that overcomes the inefficiencies and shortcomings of prior art methods and systems, a method and system that allow for the incorporation of the respective independent qualities of objects into models, qualities that that define predictive relationships between independent objects.
- Matrices are generally represented by bold-faced, upper case letters, e.g., X, Y, Z. However, a single row or column matrix is generally represented by bold-faced, lower case letters, e.g., x, y, z.
- the ith element of a vector v is denoted by v(i) or v i .
- M(i,:) The ith row of the matrix M is denoted by M(i,:) and the jth column of M is denoted by M(:,j).
- M(r 1 :r 2 ,:) represents the submatrix of M determined by rows r 1 through r 2 .
- M(:,c 1 :c 2 ) represent the submatrix determined by columns c 1 through c 2 .
- the transpose of a matrix is denoted by ‘′’, i.e., the transpose of matrix M is M′.
- the standard matrix product of two matrices, A and B, is denoted as AB or A*B.
- a + The Moore-Penrose inverse of a matrix A is denoted as A + .
- a generalized inverse of A is denoted as A ⁇ .
- a matrix may have more than one generalized inverse.
- A is an n ⁇ m matrix
- min(a, b) is the minimum of a and b, while min(v) is the minimum of the real-valued components of v.
- the covariance matrix associated with matrix A, Cov(A), is defined by A′A/(n ⁇ 1).
- v is an eigenvector associated with ⁇ .
- the notation f:x ⁇ y means that the function f maps x onto y, or the function f evaluated at x is equal to y.
- the notation x ⁇ y connotes the same thing, the underlying function being implicit.
- ⁇ denotes updating of a quantity, e.g., x ⁇ x+t means that x is updated by the addition of t.
- a linear space, ⁇ is a set of objects along with the operations of addition and multiplication by a scalar such that:
- An example of a finite dimensional linear space is r for any positive integer r.
- the rank of a matrix is maximum number of linearly independent rows (or columns) of the matrix.
- every element of r can be expressed as a linear combination of basis elements.
- An orthogonal set of basis vectors is linearly independent.
- mean centering or centering of Y is defined as subtracting the mean of a given column from each element of that column.
- the resulting matrix has an overall mean of 0 as each column has a mean of zero.
- Scaling a matrix Y refers to the division of each entry in a given column by the sample standard deviation of that column. Thus, if A is a scaled matrix, then each column of A has a sample variance or standard deviation of one.
- Row-mean-centering refers to the subtraction of the mean of a row from the given row so that each row of the row-mean-centered matrix has a mean of zero.
- RMSEC refers to the root mean square error of calibration, where Y est is the estimated Y of calibration (i.e., a prediction model that is applied to the data with which the model was created, as will be described more fully below).
- RMSEP refers to the root mean square error of prediction, where the estimation error is on a data set not used in calibration, e.g., a test set.
- RMSEP represents a measure of the prediction error during the updating of regression models.
- T is sometimes called a scores matrix
- P is sometimes called a loadings matrix.
- the rows of P also called principal components, are orthonormal, and, if X′*X is full rank, form a basis for the rows of X.
- the columns of P are eigenvectors of X′*X/(n ⁇ 1). It is standard practice that the first column (eigenvector) of P corresponds to the largest eigenvalue of X′*X/(n ⁇ 1), the second row to the second largest eigenvalue, and so on.
- P is a an transformation matrix in that, through P, the coordinates of points in the original space (i.e., the rows of X) are transformed to the coordinates of a new, rotated space.
- One application of PCA is to represent a data set by a lower dimensional one.
- T(:,1:m)*P(:,1:m)′ where m ⁇ p.
- the first three columns of T could be viewed as representing the real “structure” of X while the remaining 7 columns of T (T(:,4:10)) might be considered “noise,” the importance of which will be come clearer in the description of the method and system of the present invention that follows.
- Partial least squares is a bilinear method relating two matrices, X and Y.
- the number of columns in the T, P, Q and W matrices is called the number of principal components.
- Various methods, such as leave-k-out cross-validation can be used to determine the optimal number of principal components.
- EV A 1 - sum ⁇ ⁇ of ⁇ ⁇ squares ⁇ ⁇ of ⁇ ⁇ all ⁇ ⁇ the ⁇ ⁇ elements ⁇ ⁇ of ⁇ ⁇ E A sum ⁇ ⁇ of ⁇ ⁇ squares ⁇ ⁇ of ⁇ ⁇ all ⁇ ⁇ the ⁇ ⁇ elements ⁇ ⁇ of ⁇ ⁇ X .
- the leverage of an object relative to a given model is a measure of the effect of the object on the model.
- the leverage has a value between zero and one, with a higher value indicating a greater effect.
- leverage is related to PCA and PLS models.
- X be a n ⁇ q data matrix
- T be the corresponding n ⁇ A scores matrix, where A is the number of principal components in the model.
- SIMCA Soft Independent Modeling of Class Analogies
- T i and P i are the respective PCA scores and loadings for class i with A i ⁇ p principal components.
- x be a 1 ⁇ p vector from the same domain space as the rows of X.
- t x,i (x ⁇ m i )*P i with t x,i representing the projection of x on class i after being centered on class i.
- s x,i 2 e x,i *e x,i ′. Then, s x,i can be used by itself or adjusted by degrees of freedom to determine which class x is closest to. Nevertheless, x could still be an outlier. In this regard, to evaluate whether or not x is an outlier, confidence limits are calculated for both s x,i and t x,i .
- the class subscript i is temporarily removed.
- q i, ⁇ be the confidence limit for s x,i .
- t x,i the Hotelling's T 2 test which used the F distribution is used.
- Modeling power provides a measure of the importance of each variable in a given class PCA model.
- v i var(X i )
- modeling power of variable j in class i is “high,” then the product of the residuals for variable j in class i, E i (:,j)′E i (:,j), must be relatively low compared to the sample variance of variable j in class i, v i (j).
- modeling power generally ranges between zero and one, although it can occasionally be a negative value.
- Discriminatory power is a measure of the ability of a variable to distinguish between classes.
- E i,j be the residuals when group i is “projected onto” group j.
- T i,j (X i ⁇ (1 i *m j ))*P j be the scores when X i , adjusted for the mean of group j, is projected onto the subspace determined by the eigenvectors in P j .
- E i,j X i ⁇ (1 i *m j ) ⁇ T i,j *P j ′.
- Weights or neuron weights are terms used in the present application to denote the estimates of cluster or segment centers. The terms come from the field of artificial neural networks, one such network being described in Section 1.3 of the present application.
- the terms calibration, updating and querying refer generally to modeling and/or functional relationships within or between data sets.
- a population e.g., a data set comprising all the people in the United States
- a sample of that population e.g., a data set comprising about 1% of the people in the United States.
- the term calibration typically refers to the creation of a model based on an initial population sample.
- the term updating typically refers to adapting the model created in calibration based on new information about the population, i.e., new samples from the population.
- querying typically refers to the use of a given model to make a prediction or estimate.
- Each of the data matrices (X, Y and Z) is preferably contained in an ASCII or similar computer-readable file which can then be input or entered into a digital computer program for carrying out the computational steps of the method and system of the present invention.
- a segmentation or cluster analysis is performed on the Y data matrix, which represents the consumers' answers to twenty demographic and lifestyle questions, in order to determine the number of clusters in the data.
- a predetermined range of clusters So.) (preferably 2-10 clusters) is evaluated, and one or more optimal clusterings is output for further computation.
- cluster analysis determines that there are possible optimal clusterings at 3 or 6 clusters, and recommends the 3-cluster solution.
- Cluster 1 contains 40 consumers who generally prefer diet soda.
- Cluster 2 contains 30 consumers people who prefer regular soda.
- Cluster 3 contains 30 consumers who strongly dislike simple flavored drinks like tonic water and club soda.
- a calibration routine in run on the Y data matrix that divides the latter into 3 clusters, and, based on a preselected confidence level, removes data points that are not representative (so-called outliers).
- outliers data points that are not representative
- models are created that relate the X and Y data matrices.
- the X-variables are “significant” for modeling Y.
- four models are created relating the X and Y data matrices.
- the models can be used by an interested user to further examine the data to gain an understanding of the relationship between the X and Y data matrices, in this example, the relationship between consumers' ratings of carbonated beverages and their answers to certain demographic and lifestyle questions.
- the cluster analysis and modeling functions are carried out “behind-the-scenes,” it is contemplated and preferred that a user-friendly interface be employed to allow querying of the models by interested users.
- an interested user may submit a query through an Internet web browser installed on a personal computer operably connected to a computer network (e.g., the Internet), the model and data associated therewith being stored and maintained on a computer server also operably connected to the computer network.
- Cluster 1 consumers are generally health conscious, and a question that has high modeling power for Cluster 1 is “I occasionally shop at Natural Foods stores.” Similarly, it may be determined that Cluster 2 consumers generally have a fast-paced lifestyle, and Cluster 3 consumers are individuals who tend to plan and organize. Such relational information would be clearly valuable to marketers of carbonated beverages.
- the interested user can also attempt to identify the questions that tend to separate or distinguish one cluster from another. For example, it may be recognized that answers to the question “I regularly buy food from the hot deli store” has the highest discriminatory power as between Cluster 1 and Cluster 2, whereas answers to “Marital Status” have are of little or no value in distinguishing between Cluster 1 and Cluster 2.
- models can also created that relate the X, Y and Z data matrices.
- such modeling allows for a prediction of the optimal product profile (i.e., the criteria of an optimal product) for a given consumer.
- a non-linear response surface calibration routine is performed on the data resulting in a family of many linear models, each representing the X and Z relationship to Y over a small subset of values of X and Z.
- an optimization routine is applied to provide an interested user with the optimal X for a given Z which maximizes Y.
- the interested user can input a consumer profile (X) of interest, and the method and system of the present invention allows for a prediction of the optimal carbonated beverage qualities (Z) for that consumer profile which maximizes preference (Y).
- the data could be related to manufacturing and production, in which one data matrix (X) represents the characteristics of raw material, a second data matrix (Z) represents the control settings of certain machinery, and a third data matrix (Y) represents the number of non-defective products manufactured from the raw material using the certain machinery, thereby allowing for a prediction of the appropriate control settings to reduce the number of product defects for given raw material characteristics.
- X data matrix
- Z second data matrix
- Y represents the number of non-defective products manufactured from the raw material using the certain machinery
- the data could be related to credit risk management, in which one data matrix (X) represents the demographics of previous loan holders, a second data matrix (Z) represents loan characteristics, and a third data matrix (Y) represents the loan non-default rate, thereby allowing for a prediction of whether an individual defined by certain demographics is a good candidate for a specific type of loan.
- X data matrix
- Z second data matrix
- Y third data matrix
- the data could be related to Internet-based advertising, in which one data matrix (X) represents user demographics, a second data matrix (Z) represents advertised product characteristics and layout, and a third data matrix (Y) represents the percentage of time an advertised link is selected, thereby allowing for a prediction of which advertising links to display for a particular user.
- one data matrix (X) represents user demographics
- a second data matrix (Z) represents advertised product characteristics and layout
- a third data matrix (Y) represents the percentage of time an advertised link is selected, thereby allowing for a prediction of which advertising links to display for a particular user.
- the data analyzed could again be related to Internet-based advertising, the various data matrices including: numerical measures of the outcomes of a web-viewing event; common measures of qualities of a web page viewer; and common measures of the content displayed on a web page.
- the data analyzed could be related to e-commerce, the various data matrices including: numerical measures of the outcomes of an e-commerce sales event; common measures of qualities of an e-commerce consumer; and common measures of the qualities of the item or set of items offered to the consumer during the e-commerce sales event.
- the data could be related to Customer Relationship Management (“CRM”) processes, the various data matrices including: numerical measures of the response by a prospect to a step in the CRM process; common measures of the qualities of the sales prospect; and common numerical measures of the information presented to the sales prospect during the sales step.
- CRM Customer Relationship Management
- the data could be related to surveying, the various data matrices including: numerical measures of a response by a respondent to a survey question with respect to the survey goal, common measures of the qualities of the respondent, and common numerical measures of the elements of the question or series of questions in the survey.
- the present invention is a method and system for the dynamic analysis of data.
- there are three phases of the dynamic data analysis as generally indicated in FIG. 1 .
- a cluster analysis or clustering sequence is performed on a data matrix Y in order to segment the data into appropriate clusters, as generally indicated by reference numeral 1000 .
- This first phase is comprised of calibration, querying, and updating.
- the second phase is a modeling phase. If a second data matrix X is present such that corresponding rows of X and Y each refer to the same underlying object, in the second phase, a relationship can developed between the X and Y data matrices, which allows the method and system of the present invention to predict responses in Y on the basis of inputted X-data, as generally indicated by reference numeral 1005 .
- This second phase is also comprised of calibration, querying, and updating.
- the third phase is also a modeling phase. If a third data matrix Z is present in which corresponding columns of Y and row of Z each refer to the same underlying object, a relationship can developed between the X, Y and Z data matrices, which allows the method and system of the present invention to link X with Z through Y, as generally indicated by reference numeral 1010 .
- This third phase is also comprised of calibration, querying, and updating.
- the first phase of the dynamic data analysis in accordance with the method and system of the present invention is a cluster analysis or clustering sequence 1000 .
- Y matrix has any missing values, such data needs to be replaced or filled with appropriate estimates before the cluster analysis proceeds.
- the non-missing values are referred to as known values. Assuming Y is a n ⁇ p matrix that is inputted with appropriate missing value indicators, a preferred method of estimating the missing values proceeds as follows.
- Y is again an n ⁇ p matrix, the data comprising the matrix again being inputted with appropriate missing value indicators, as represented by INPUT 1100 of the flow chart of FIG. 2 .
- initial estimates of the missing values are computed using equations (1)-(8) as described above.
- This new matrix containing initial estimates of the missing values is referred to as Y fillold , and P old is the p ⁇ p identity matrix.
- a PCA model of Y fillold is created using the validation method described below to determine the “optimal” number, A, of principal components, as indicated by BLOCK 1110 of FIG. 2 .
- A the “optimal” number
- the PCA model be centered. Let m be the mean of the current Y fillold , and let I be a n ⁇ 1 column of ones.
- T and P new are defined as the respective scores and loadings matrices for the PCA model.
- Y fillold is then estimated by:
- Y est are used to replace the missing values in Y, as indicated by BLOCK 1120 of FIG. 2, resulting in a new matrix referred to as Y fillnew .
- nrmdif [norm( P new ) ⁇ norm( P old )]/norm( P new ) (10)
- DECISION 1130 of FIG. 2 a decision is made at DECISION 1130 of FIG. 2 by comparing nrmdif as calculated in equation (10) with tol. If nrmdif>tol, Y fillold is replaced with Y fillnew . Similarly, P old is replaced with P new . A new PCA model of Y fillnew is created using A principal components, as indicated by BLOCK 1135 of FIG. 2, and the above steps are reiterated until nrmdif ⁇ tol.
- Y fillold is replaced with Y fillnew
- P old is replaced with P new .
- a list, L is formed using the criterion: if s(i) ⁇ h 1 , then i is added to the list, where the default value for h 1 is 0.1.
- the mean and standard deviation of the list are calculated, and elements lying further than one standard deviation from the mean are deleted.
- j 1 is the smallest index such that d(j 1 )>1.
- L(1), L(2), . . . L(j 1 ) must be consecutive.
- a sublist, L 1 of these numbers is formed.
- j 2 is the next smallest index such that d(j 2 )>1.
- L(j 1 +1), L(j 1 +2), . . . , L(j 2 ) are consecutive, and this sublist goes to form L 2 , and so on.
- each sublist is taken to be an “optimal number.” If there is more than one minimum, then the minima are ranked as follows. If a sublist has one member, this element is given the lowest ranking. The minimum of the minima of all sublists (with more than one member) is given the highest ranking. The highest ranking number is output, and the computation proceeds as follows.
- a piecewise linear graph is made by connecting the sequence of cumulative explained variances using PCA. A determination is made as to when this piecewise linear graph starts to level off, and lv 1 is determined, the optimal number of principal components.
- lv 2 be the number of eigenvalues greater than a defined threshold.
- the initial weight optimizer attempts to estimate an optimal partitioning of a data set based on some function of the data (Y) relating to cluster measure.
- the Calinski-Harabasz (CH) index is given by
- T The total variation, of the data is the sum of the between-cluster variation, B, and the within-cluster variation, L.
- B the between-cluster variation
- L the within-cluster variation
- the IWO routine can be divided into two stages, IWO 1 (as depicted in the flow chart of FIG. 3) and IWO 2 .
- Each stage can be employed independently of the other.
- the second stage does require an input of an initial set of group means or weights, as will be come clearer in the discussion that follows.
- samples of g starting points are selected from the data, each such sample being a potential set of cluster center estimates.
- PCA is performed on the data set (entered at INPUT 1200 ) to remove the outliers, those points that have high leverage and are presumed to not be representative of the data.
- the data set is then transformed to a new set of coordinate axes via the PCA results, and the dimension of the data set is reduced resulting in transformed data set, T data , as indicated by BLOCK 1205 of FIG. 3 .
- g widely separated points are selected.
- the convex hull of a set of points is the smallest convex set containing all of the points.
- the boundary of the convex hull gives an idea of the shape of a data set. Therefore, a set of points, Bd, of the raw data generally correspond to points along the boundary of the convex hull of T data .
- a predetermined number of samples of size g are chosen based on the dispersion of the points within a sample relative to each other. Specifically, as indicated by BLOCK 1210 of FIG. 3, a first sample from Bd is that subset of size g such that the sum of the inter-point distances within the sample is the highest of all samples.
- the second sample is the subset of size g such that the sum of the inter-point distances within the sample is the second highest of all samples, and so on.
- a MATLAB® routine called convhull be used to collect the convex hulls of a number of 2-dimensional subsets of T data .
- MATLAB® is the brand name of a commercially available software product of The Mathworks, Inc. of Natwick, Mass., USA.
- Bd is the union of all these sets.
- the 2-dimensional subsets are all unique combinations of pairs of columns of T data . If T data is 1-dimensional, then the minimum and maximum of the set are taken to be Bd. If the number of points in Bd is less than g, then a new set of data points is generated from the full Y rather than T data .
- m could be the median (which is used in the preferred embodiment) or the trimmed mean.
- a value for a parameter, ⁇ is then chosen, and a convex combination of each point of a sample and m is calculated. Symbolically, if w is a point in a sample, then w is transformed according to w ⁇ (1 ⁇ )w+ ⁇ m.
- the chosen index of each sample is optimized within the data set by iteratively replacing current values with samples from the raw data, as indicated by BLOCK 1220 of FIG. 3 .
- g ⁇ 1 of the points are held fixed, while different points from the data set are substituted for the remaining point.
- the chosen index is calculated. This substitution/calculation routine is continued until each point in the entire data set has been substituted for the remaining point.
- the data point providing the best index value is selected to be in the sample while the other point, if different, is removed from the sample.
- Another of the g sample points is then chosen to vary while the others remain fixed. Again, every data point is substituted for the chosen point, and an index value is calculated.
- the data point providing the best index value is selected to be in the sample while the other point, if different, is removed from the sample. This process is repeated until there is no improvement in the index, or until an iteration limit is reached. Of course, the entire process is performed with to respect to each sample. For example, if there were ten samples initially, then there will be 10 associated sets of size g each with an assigned index value. In the preferred embodiment described herein, only the sample with the highest CH index is used and the iteration limit is set to one. Finally, the set with the best index, referred to as the initial weight (“initwt”), is used for subsequent computations, as indicated by OUTPUT 1225 of FIG. 3 .
- a second optimization stage is employed to further optimize the index by searching various directions of the data space.
- This second optimization stage can be carried out through one of two preferred subroutines.
- a process that similar to that of a Kohonen Self-Organizing Map (“SOM”) is used, and the data order is fixed by sorting by “density” as with a density trace (which is described in further detail below) and then presented to a “network” one data point at a time.
- SOM Kohonen Self-Organizing Map
- the sample point (weight) closest to the presented data point “wins” and is chosen to be updated using the same formula as the Kohonen SOM.
- the index is calculated. If the index increases, the updated weight remains, and the same data point is again presented to the network. If the index decreases or remains the same, the update is negated, and the next data point from the ordered data list is presented.
- Each weight, w has an associated learning parameter, ⁇ w . If a neuron weight has not been updated after being presented all or most of the data points in its neighborhood, its learning parameter is reduced according to the formula:
- the sample weights are moved in the directions of the eigenvectors of the data covariance matrix, rather than updated in the directions of the locations of the presented data points.
- these directions are linear combinations of the eigenvectors of the covariance matrix, i.e., the eigenvectors of the covariance matrix form an orthogonal basis for the data space.
- a matrix of the (orthonormal) eigenvectors and their opposites is formed. So, if the data space is r-dimensional, and the rank of the covariance matrix is r 1 ⁇ r, then the matrix has 2*r 1 rows.
- a new direction eigenvector
- a magnitude of change in the given direction is presented.
- the updating procedure then follows that described above with respect to the first routine, except that each direction is presented to each neuron, one at a time. If an update improves the chosen index, the same direction and magnitude are presented again. If not, the same direction is presented to the next neuron until all neurons have seen that direction. Then, the next direction is presented.
- the magnitude of change of an update, ⁇ is analogous to ⁇ in the first routine. Again, each weight has an associated ⁇ that updates after the weight has not changed upon “seeing” all the directions. Therefore:
- this process continues until the index no longer improves for some number of iterations or an iteration limit is reached, and the output matrix becomes the initial weight matrix.
- this process terminates if there is no improvement in the CH index over one thousand iterations, or if the total number of iterations reaches ten thousand.
- cluster analysis determining the number of clusters; and (2) recovery, i.e., the ability of the cluster analysis to recover or classify the clusters correctly.
- Kohonen's Self-Organizing Feature Map (“SOFM”) or Self-Organizing Map (“SOM”) is a type of artificial neural network used in various applications, including cluster analysis and pattern recognition.
- SOFM Self-Organizing Feature Map
- SOM Self-Organizing Map
- the present invention employs a variant referred to as an SOM MHL with enhanced recovery capabilities.
- the Kohonen SOM is an iterative system that can be described as follows.
- Each neuron in a neural network is denoted by an index, which is an element of a set D ⁇ Z k , the k-dimensional integer lattice.
- s be a metric on the latter space, and assume that D ⁇ Z + , the set of positive integers.
- W is the weight matrix for the network, with W(i,:,t) ⁇ r , the weight of neuron i ⁇ D at time t ⁇ Z + , where r is r-dimensional real space with a metric d.
- the winning neuron, or index is defined as:
- the function z selects a row, z t , of Y to be presented or input to the neural network.
- the distances from Y(z t ,:) to all of the weights [rows of W(:,:,t ⁇ 1)] are calculated according to the metric d.
- the weight closest to the input Y(z t ,:) “wins” unless more than one weight is equidistant from Y(z t ,:). In that case, since only one weight can win, the closest weight with the smallest index wins.
- i t * is the index associated with the winning weight.
- b(t) is a positive, typically non-increasing function of time called the range parameter at time t.
- W ( i,:,t+ 1) W ( i,:,t )+ h ( i, b ( t )) ⁇ ( t )( Y ( z t ,:) ⁇ W ( i,:,t )) (15)
- the latter metric is called the Mahalanobis metric.
- nbhd(j, t) represents the rows of Y associated with neuron j at time t, then for some y ⁇ r ,
- partition elements are typically called clusters.
- the Euclidean metric is used in the SOM, where the application is cluster analysis, the clusters tend to be hyper-spherically shaped; however, hyper-ellipsoidally shaped clusters are not uncommon.
- hyper-spherically shaped and hyper-ellipsoidally shaped clusters see J. Mao and A. K. Jain, “A self-organizing network for Hyperellipsoidal Clustering (HEC),” 7 IEEE Transactions on Neural Networks , pps. 16-29 (1996), an article which is incorporated herein by this reference.
- HEC Hyperellipsoidal Clustering
- C i (t) (Cov(nbhd(i, t))+ ⁇ I) + , where typically 0 ⁇ 1 and where nbhd(i, t) represents both a set and a matrix whose rows are the set elements.
- ⁇ is added to the diagonal elements of the covariance matrix to insure matrix invertibility.
- the metric is defined as:
- initial weights may be chosen randomly or may all be assigned to the center of the data ranges.
- Parameters ⁇ (t) and b(t) are usually “larger,” e.g., 0.2 ⁇ (t) ⁇ 0.9, and b(t) ⁇ 2. Both a and b may are commonly non-increasing functions of t.
- the data set Y may be presented to or input into the network a number of times, e.g., five to more than one hundred times.
- the data set Y is presented to the network a number of times. In this regard, Applicant prefers that the data be presented to the SOM MHL three times.
- SOM MHL and/or SOM E are just used in the tuning phase, with IWO 1 , IWO 2 or KM (individually or in combination) substituting for the ordering phase.
- the clustering sequence proceeds as follows.
- initwt is input at INPUT 1310 , and the k-means routine is run on the data starting with initwt for the centroid estimates, as indicated by BLOCK 1315 of FIG. 4 .
- the output k-means cluster centroids are denoted by w km , as indicated by OUTPUT 1320 of FIG. 4 .
- the CH indices are calculated for the segmentations determined by (1) initwt, as indicated by BLOCK 1355 ; and (2) w km , as indicated by OUTPUT 1345 .
- the Modified Hubert (“MH”) index is also calculated for w km , as indicated by BLOCK 1345 and BLOCK 1350 ; the MH index is further described below in Section 1.5 (“Cluster Number Determination”) of the present application.
- initwt is used for the initial cluster averages.
- the IWO 2 clustering is then carried out at BLOCK 1375 , and the resulting cluster centroids are referred to as w iwo , as indicated by BLOCK 1380 .
- w km is used for the initial cluster averages.
- the IWO 2 clustering is again carried out at BLOCK 1375 , and the resulting cluster centroids are referred to as w iwo , as indicated by BLOCK 1380 .
- SOM MHL is selected for clustering, w km is used for the starting weights.
- the SOM MHL clustering is carried out at BLOCK 1325 , and the resultant cluster centroids are referred to as w som , as indicated by BLOCK 1330 .
- CH and MH indices (if any) for the segmentations determined by w iwo and w som are calculated, as respectively indicated by OUTPUT 1385 and OUTPUT 1335 .
- a density trace relies on the assignment of a “density” to each data point so that those data points with many nearby neighboring data points have a higher density than those points that are fairly isolated. Specifically, if y ⁇ r is a data point, V(r, h) is the volume of an r-dimensional hypersphere of radius h, and if n is the total number of data points, then the local density at y is defined as:
- a more general approach weights the data points in the ball around y according to their distance from y.
- d be the Euclidean metric
- f(y,h) be the density of the point y with ball radius h
- w be the weighting function
- the density trace for a given data set and a given h is the graph of f, or, alternatively, the set f. For example, if w ⁇ 1, then equation (19) essentially becomes equation (18).
- the data is then preferably sorted from lowest to highest density, although it could also be sorted from highest to lowest density without departing from the spirit and scope of the present invention.
- h is preferably equal to two times the standard deviation of Y.
- a data set may contain a number of clusters or “distinguishable” subgroups.
- methods for determining the appropriate cluster number there are a variety of methods for determining the appropriate cluster number.
- each such method may provide a different cluster number for the same data set.
- G. W. Milligan and M. C. Cooper “An examination of procedures for determining the number of clusters in a data set,” 50 Psychometrica, pps. 159-179 (1985).
- a given method may indicate that there is more than one optimal grouping or partitioning of a set of data points.
- the data matrix Y is input successively to a clustering program with neuron or cluster numbers, for example, 2, 3, . . . min(n, n max ), where n max is determined by the user. For each cluster number, a weight matrix and a classification matrix is calculated.
- the pertinent cluster indices which are typically functions of the classification matrix and the data, are computed, and whatever associated methods for analyzing them are applied, using the data matrix Y and the classification matrices. From these cluster indices, the optimal number of clusters is estimated.
- the following cluster indices are used in determining optimal cluster number, each such index being a function of the data matrix and the classification matrix.
- the first cluster index is the Modified Hubert (“MH”) index, which is further described in R. C. Dubes, “How many clusters are best?—An Experiment,” 20 Pattern Recognition , pps. 645-663 (1987), an article which is incorporated herein by this reference.
- the MH index is calculated for each partition of the data matrix Y.
- the second cluster index is the Calinski-Harabasz (“CH”) index, which is fully described in T. Calinski and J. Harabasz, “A dendrite method for cluster analysis,” 3 Commun. Stat. , pps. 1-27 (1974), an article which is incorporated herein by this reference.
- the CH index is first calculated for each partition of the data matrix Y (min(n,n max ) ⁇ 1 values). The results are plotted against the number of neurons and displayed for the user. Local maxima indicate possible optimal partitions, with more weight accorded to higher maxima.
- the optimal cluster number is determined as follows.
- ⁇ be the list of cluster numbers to be evaluated, i.e., n 1 , n 2 , . . . min(n,n max ). If only one cluster number is input such that the length of ⁇ is 1, then that cluster number is output as the optimal cluster number.
- clusnum the estimated optimal cluster number, which is determined as follows:
- the data matrix Y is entered into the digital computer program used to carry out the computational steps of the method and system of the present invention at INPUT 1400 .
- any appropriate data transformations are performed on the data matrix Y, including, for example, row-mean-centering or scaling, as indicated by BLOCK 1415 , and the data is appropriately ordered, as indicated by BLOCK 1420 .
- the determination of the cluster number commences with a range of different cluster numbers being evaluated, i.e. the clustering sequence is run for each cluster number in the cluster number range, as described above and indicated by BLOCK 1425 .
- the following outputs are achieved, as indicated at OUTPUT 1430 of FIG. 5 : (1) the weights or cluster averages for k-means and each selected method and for each cluster number in the cluster range; (2) the MH and CH indices for k-means and each selected method for each cluster number in the cluster range; and (3) a suggested cluster number for the last chosen method in the following chain of computation: k-means, IWO 2 , and SOM MHL .
- outliers are those data points that have high leverage and are presumed to not be representative of the data as a whole, and thus are deleted from modeling or set aside in some manner.
- at least three criteria are used to determine which data points are outliers. First, if the number of members of a cluster is less than or equal to a preselected cluster size threshold, that entire cluster is removed, and all of its data points are classified as outliers. Secondly, each class that consists solely of one data point or multiple copies of a data point is so denoted as a one-point class; a one-point class is removed if its size is less than or equal to the number of data set columns (or variables). Thirdly, cluster boundaries can be determined using statistical methods; data points outside of these cluster boundaries are also classified as outliers.
- the first outlier method is preferably employed; otherwise, the second method is employed.
- W be the matrix of cluster averages, where W(i,:) is the average of cluster i.
- W(i,:) is the average of cluster i.
- the weighted distance from the cluster average is calculated and this distance is used to determine whether or not a member of a cluster should be reclassified as an outlier.
- F p,s(i) ⁇ p ( ⁇ ) is the value of the F distribution with p, s(i) ⁇ p degrees of freedom at the a significance level.
- Y i (j,:) is an outlier if d w (W(i,:),Y i (j,:), C i )>t(i).
- SIMCA classifier is applied as described above.
- a hypothesis might be that the mean of a population is m.
- H 1 might be that the mean of the population is not m. Since the population parameters cannot be ascertained directly in many cases, a sample of the population is taken, and inferences about the population are made from that sample. Based on this sample, testing rules are applied to determine when to accept or reject H 0 . These testing rules involve probability distributions and associated levels of uncertainty.
- the level of significance, ⁇ , of a test is the probability that H 0 is rejected when it should have been accepted. This is commonly called a Type I error. Typical values of ⁇ are 0.05 and 0.01.
- the power of a test is the probability of accepting H 0 when H 0 actually holds for that test. This is commonly called a Type II error. If ⁇ is the probability of making a Type II error for a test, the power of the test is 1 ⁇ or 100(1 ⁇ )%.
- a confidence level, 1 ⁇ , and a power, ⁇ are bother preselected, with the latter taking precedence.
- M the matrix of cluster centers
- M(1,:) is the center of group 1
- M(2,:) is the center of group 2
- m 0 be the mean of Y
- D i Y l ⁇ 1 i *M(i,:), the set of differences between the elements of group i and M(i,:).
- a range, r, of confidence levels and the number, n r are entered into the digital computer program used to carry out the computational steps of the method and system of the is present invention.
- R(x,v 1 ,v 2 , ⁇ ) be the probability of being less than or equal to x of the non-central F distribution, with v 1 , v 2 degrees of freedom and noncentrality parameter ⁇ .
- B(i,j) R(F(i,j),p,s(i) ⁇ p, ⁇ ).
- cf(i) of the outlier test for group i
- calibration refers to the creation of a model based on an initial sample.
- the model is a classifier in that, if an appropriate data point is input, the model or function output is a class number.
- Y be a real data matrix with dimensions n ⁇ p.
- the rows of this matrix are called points or objects, and y is the set of possible row vectors for Y.
- the data matrix Y is entered into the digital computer program used to carry out the computational steps its of the method and system of the present invention at INPUT 1500 .
- the cluster size threshold such that if the size of any cluster is less than or equal to this number, that cluster is deleted with its members being classed as outliers; (7) the number of principal components for a PCA model for a potential PCA plot of the data and cluster averages with the cluster membership shown; and (8) parameters affecting the confidence level of the outlier tests, including for example, (a) desired confidence level, (b) power of outlier test parameter, ⁇ , where 1 ⁇ , is the power of the test, (c) interpolation range of the confidence level, and (d) number of interpolation points for confidence level.
- any appropriate data transformations are performed on the data matrix Y, including, for example, row-mean-centering or scaling, as indicated by BLOCK 1515 , and the data is appropriately ordered, as indicated by BLOCK 1520 .
- the data is clustered according to the input cluster number, as described above and indicated by BLOCK 1525 . Then, any small clusters are removed from the data set, as indicated by BLOCK 1530 ; at the same time, any one-point classes are removed if their respective size is less than or equal to the number of data set columns, p. An outlier analysis is run on the remaining clusters, as indicated by BLOCK 1535 of FIG. 6 .
- the cluster sizes are calculated. If any cluster sizes are less than or equal to the cluster size threshold, they become outliers. The outlier analysis continues with respect to the remaining clusters, and those outliers are removed. If any of the subsequent clusters sizes fall below the cluster size threshold, they are removed. Weights or cluster averages corresponding to the deleted clusters are also removed. Then, once it is determined which clusters are to remain, the original members of those clusters are used to determine cluster boundary-type outliers according to the methods described in detail below in Section 1.9 (“Classification of New Y-Data”) of the present application.
- a PCA is then run on Y in with the specified number of principal components, as indicated by BLOCK 1545 .
- This latter PCA model will only by used for potential display purposes.
- a PCA model of Y in is made, and the variance of the model residuals is calculated. This is taken to be an estimation of noise variance of Y in , as indicated by BLOCK 1550 .
- the mean and covariance matrix of Y in are calculated, as indicated by BLOCK 1555 .
- the density trace of the cluster averages and the data are calculated, as indicated by BLOCK 1560 , and the final cluster sizes are calculated, as indicated by BLOCK 1565 .
- variance-covariance matrices are calculated for each cluster, as indicated by BLOCK 1570 , and a raw version of the weights or cluster averages is calculated, as indicated by BLOCK 1575 .
- a projection of Y in , the weights or cluster averages and the outliers on the PCA space is made, as indicated by BLOCK 1580 .
- These are concatenated into one matrix with, except for the weights or cluster averages, the corresponding row number from Y, identification number and class number. Outliers are given a class number of zero, and the weights are given a class number of one hundred. The row and identification numbers for the weights are zeros.
- This matrix is referred to as “outputmat” in the computational steps that follow.
- a OUTPUTS (a) cluster averages. (b) neural network weights, provided that SOM MHL is selected for the initial weight optimizer. (c) outlier information, including: (i) row indices and identification numbers of outliers; (ii) outliers in raw data form; (iii) row indices and identification numbers of the inliers; (iv) confidence thresholds for each cluster and parameters indicating which type of outlier analysis corresponds to which cluster; (v) a measure of total within cluster variances, as described in Section 1.7 of the present application; and (vi) actual confidence levels for each cluster, as described in Section 1.7 of the present application. (d) regularized inverse covariance matrices for each cluster.
- the cluster model can be used to classify new Y-type data, y (y ⁇ y ).
- j* the initial classification of y based on the minimal weighted distance of y from the cluster averages
- F p,s(j) ⁇ p ( ⁇ ) is the value of the F-distribution with p, s(j) ⁇ p degrees of freedom at the ⁇ significance level.
- y is in class j* if d j* ⁇ t(j*); otherwise, y is an outlier.
- SIMCA classifier is applied as described above.
- outliers may form new clusters.
- the method and system of the present invention first calculates the density trace of all current outliers, O, and sorts them according to magnitude, as indicated by BLOCK 1600 . Now, let those outliers with a density greater than or equal to min den (if any) be represented by O 1 , where O 1 (1,:) has the highest density, O 1 (2,:) has the second highest density, and so on, as indicated by BLOCK 1605 . At DECISION 1610 , a determination is made as to whether O 1 is empty; is so, the process terminates, as indicated at TERMINAL 1615 .
- the outlier with the highest density above min den , O 1 (1,:), is chosen to become a new cluster centroid and is concatenated with other current cluster centroids, as indicated by BLOCK 1620 .
- the Euclidean distances of all outliers to all the cluster centroids are then calculated, and the number closest to the new centroid, O 0 (1,:), is recorded, as indicated by BLOCK 1625 . If this number is greater than or equal to the minimum of three (3) and the cluster size threshold, as determined at DECISION 1630 , then the process proceeds to BLOCK 1640 , as more fully described below.
- the classification routine as described above in Section 1.9 (“Classification of New Y Data”) is then updated with the new cluster information, and all of the current outliers, O, are run through it. This creates a set of inliers, In O , of the set O, as well as outliers, Out O , of the set O. Out O now becomes the current set of outliers. So O is set equal to Out O and the process starts again. This process continues until no new clusters are formed, as indicated by BLOCK 1645 .
- the new cluster sizes are calculated. If any new cluster has a size below the cluster size threshold, as determined at DECISION 1655 , then that cluster and its corresponding parameters are deleted, and its elements once again become outliers, as indicated by BLOCK 166 . For example, the corresponding row of Waug y is removed.
- Part of the updating phase is changing cluster means and other quantities when new data is added and classified as belonging to any of various clusters.
- the new cluster average for cluster i is updated according to: W y ⁇ ( i , : ) ⁇ gsz ⁇ ( i ) * W y ⁇ ( i , : ) + sum ⁇ ( Y i , new ) gsz ⁇ ( i ) + n i ( 24 )
- the “sums of squares” matrices for each cluster are also stored during calibration for use in updating. For cluster i, this matrix is YY i ⁇ Y i ′Y i .
- YY i is updated by adding the sums of squares of the new data, i.e., YY i ⁇ *YY i +Y i,new ′Y i,new , where ⁇ is referred to as the forgetting factor.
- the cluster covariance matrix for cluster i, Cv i can be updated according to: Cv i ⁇ YY i gsz ⁇ ( i ) + n i - W y ⁇ ( i , : ) ′ ⁇ W , ( i , : ) gsz ⁇ ( i ) + n i - 1 gsz ⁇ ( i ) + n i ( 26 )
- Cv i is an intermediate result not stored for future updates. Its use is in calculating the new cluster regularized inverse covariance matrix for cluster i, C i .
- Y new be a matrix of new inputs where each row is in D y .
- INPUT 1700 of FIG. 8 various inputs are required, including those inputs described in Section 1.8 (“Calibration”) of the present application with reference to BLOCK 1500 of FIG. 6, along with (1) the new data, Y new ; (2) identification numbers for the new data; (3) a “search-for-new-clusters indicator,” which controls whether new clusters are searched for among the outliers; (4) forgetting factor; and (5) parameters affecting the confidence level of the outlier tests, including (a) the power of outlier test parameter, ⁇ , where 1 ⁇ , is the power of the test, (b) the interpolation range of the confidence level, and (c) the number of interpolation points for the confidence level.
- outliers from the calibration process or the most recent update are appended to the new data, as indicated by BLOCK 1705 .
- Such outliers can thus be classified as “in,” as cluster averages and boundaries change with updating.
- This new augmented matrix is referred to as Y new+ in the subsequent computational steps.
- the new data and appended outliers are then transformed according to the calibration inputs, for example, row-mean-centering or scaling, as indicated by BLOCK 1710 , and this new matrix is referred to Yt new+ .
- a classification program is initiated, as indicated by BLOCK 1715 , in which all rows of Yt new+ are classified into existing classes.
- the outlier routine is applied to these new members, and the new outliers are separated out as current outliers.
- the cluster averages, variance-covariance type matrices, inverse covariance matrices and outlier statistics are updated according to the new data and its classification, as indicated by BLOCK 1720 .
- the current outliers, represented by BLOCK 1725 are classified as described above with reference to BLOCK 1715 .
- the cluster averages, variance-covariance type matrices, inverse covariance matrices and outlier statistics are again updated, if necessary, as indicated by BLOCK 1720 .
- the new cluster search routine is then initiated, as indicated by BLOCK 1735 of FIG. 8 and described in detail in Section 1.10 (“New Cluster Formation from Outliers”) of the present application.
- the classifier model described in Section 1.9 (“Classification of New Y Data”) of the present application can be used to predict the class (if any) of the new Y-data.
- a vector or matrix, y that is to be classified is entered.
- This vector or matrix, y is then transformed according to the inputs of the calibration described above in Section 1.8 (“Calibration”) of the present application, as indicated by BLOCK 1805 .
- the transformed y vector or matrix is then run through the classification program described above in Section 1.12 (“Updating”) of the present application, as indicated by BLOCK 1810 .
- the rows of the original Y data matrix are first classified as belonging to a certain group, or are classified as outliers.
- clustering is arrived out through preselected inputs or by evaluating a number of different clusterings using one or more clustering methods.
- a model can be created to predict the class (if any) of new Y-type data.
- the model can be updated with the incorporation of new Y-type data, and new clusters may be identified as a result of such updating.
- a relationship can developed between the X and Y data matrices, which allows the method and system of the present invention to predict responses in Y on the basis of inputted X-data, as generally indicated by reference numeral 1005 .
- X and Y be real data matrices with dimensions n ⁇ q and n ⁇ p, respectively.
- the rows of these matrices are called points or objects.
- x be the set of possible row vectors for X.
- y is the set of possible row vectors for Y.
- the rows of Y are first classed as outliers, and those rows that are not outliers are referred to as inliers.
- discriminatory power For a given clustering of data, it is often useful to understand how each of the data variables “discriminate” between the classes. This variable descriptor is called discriminatory power, and a measure of it can be calculated as part of the SIMCA classification algorithm. However, in the method and system of the present invention, an alternate approach is contemplated, which is referred to as alternate discriminatory power.
- X and Y are be data matrices with dimensions n ⁇ q and n ⁇ p, and a clustering analysis has been performed on Y. Assuming that G is the classification of Y in , this classification is imposed on X in . Now, to find the discriminatory power of the various X-variables, assume that the X-data are integers with finite scale ranges. The X-variables are represented by the columns of X.
- variable j (column j), and let m j and M j be the respective, allowable minimum and maximum of the variable j. Then, the variable j can only take on the values m j , m j +1, m j +2, . . . M j ⁇ 1, M j .
- the frequencies with which variable j takes on values is defined by:
- D j (i 1 ,i 2 ) is the so-called discriminatory power of variable j to distinguish between classes i 1 and i 2 :
- i 1 ) - freq ⁇ ( j k
- the data matrices X and Y are entered into the digital computer program used to carry out the computational steps of the method and system of the present invention at INPUT 2000 .
- INPUT 2000 For purposes of this description, it is assumed that any missing values have already been filled or estimated in accordance with the techniques described in Section 1.1 (“Filling of Missing Values”) of the present application.
- any data transformations are to be performed, such as row-mean-centering of the Y data, centering, and/or scaling of the data matrices X and/or Y; (2) the classification matrix, G, from clustering, along with the vector, in, and the row indices of the outliers, which are denoted by out; (3) the scale ranges of the X-variables and the Y-variables; (4) the X-variables to use in constructing the models; (5) the X-variables to use to build the X-classifier; (6) an indicator as to whether or not the data is in integer form; (7) the integer, k, for in leave-k-out cross-validation of the PLS models; and (8) the confidence level for the X-classifier.
- any data transformations such as row-mean-centering of the Y data, centering, and/or scaling of the data matrices X and/or Y
- the classification matrix, G from clustering, along with the
- any appropriate data transformations are performed on the data matrices X and Y, including, for example, row-mean-centering or scaling, as indicated by BLOCK 2005 , and the associated parameters are saved for updating.
- X t is similarly defined, but, in the case where no X transformations are preferred, then X t differs from X in in that a column of ones is added to X in to form X t . Also if the X data is non-centered and scaled then a column of ones is concatenated with the scaled X in to form X t .
- the information in G is used in modeling Y in .
- the classes are treated as predictor variables.
- the first three models are PLS models.
- Each of the PLS models require a cross-validation step to determine the optimal number of principal components.
- Y t is the response variable, and the predictor matrix is G t .
- Y X
- a predefined threshold e.g., fifteen in the preferred embodiment described herein.
- Y [G X] PLS .
- X OLS be the analog of X aug for this model.
- B OLS (X OLS ′ X OLS )+X OLS ′Y t .
- This model exists even when the regular OLS model between X OLS and Y t does not exist, i.e., when (X OLS ′ X OLS ) ⁇ 1 is undefined.
- Y [G X] OLS is the OLS model.
- model performance indicators are calculated, as indicated by BLOCK 2015 .
- the RMSEC is calculated for each group within each model, yielding a 4 ⁇ g matrix referred to as RMSEC, where RMSEC(i,j) is the RMSEC for group j using model i.
- the data matrix is saved for use in updating and querying, as will be further described below.
- correlations between predicted and actual response variables are calculated for each Y-variable and for each model, but not on a group basis.
- the explained Y-variance of each model is calculated.
- the calibration process proceeds to a calculation of the outputs needed for updating each model, as indicated by BLOCK 2020 .
- a classification model for X-data is calibrated, as indicated by BLOCK 2030 .
- a supervised classifier e.g., SIMCA in the preferred embodiment described herein
- This calibrated classification model is then used in subsequent updating and querying processes.
- the calibration proceeds to a characterization of the X-classification as indicated by BLOCK 2035 .
- the following are calculated: (1) a measure of X-class separation, referred to as group distance, using SIMCA; (2) the modeling power of each X-variable for each group using SIMCA; and (3) a measure of the ability of the X-variables to discriminate between X-classes using both SIMCA and another sub-routine, i.e., alternate discriminatory power.
- the calibration process outputs another vector, x_descrim rank , that is used for ranking the X-classification variables for their so-called discriminatory power from the alternate discriminatory power method.
- m x be the matrix of group means from calibration where mx(i,:) is the mean of group i, and let gsz(i) be the number of members of group i from calibration.
- Cov i is set equal to C i /(gsz(i) ⁇ 1).
- C i is updated to X i ′*X i +Xu i ′*Xu i for all i.
- C i ⁇ C i +Xu i ′*Xu i .
- gsz is also updated to reflect additional class members, and Cov i is calculated as before with the updated C i and gsz(i).
- MPOW modeling power
- a i is the number of principal components in the PCA model for group i from calibration
- E i is the matrix of residuals from the model for group i.
- Discriminatory power can be similarly updated.
- E ij represents the residuals when group i is projected onto group j.
- S i,j (k) E i,j (:,k)′E i,j (:,k)/gsz(i) when i ⁇ j
- the S i,j (k) are saved for all i,j,k in the current update or calibration to be used in the subsequent update.
- DPOW i , j ⁇ ( k ) S i , j ⁇ ( k ) + S j , i ⁇ ( k ) S i , i ⁇ ( k ) + S j , j ⁇ ( k ) ( 34 )
- G and Y [G X] OLS .
- the forgetting factor allows for a downweighting of old data, essentially discounting model history and assigning increased importance or weight to more recent data.
- forgetting factors see, e.g., B. Dayal and J. MacGregor, “Recursive exponentially weighted PLS and its applications to adaptive control and prediction,” 7 J. Proc. Cont , pps. 169-179 (1997), an article which is incorporated herein by this reference.
- the Dayal-MacGregor article also describes a PLS algorithm (i.e., a method of calculating the scores matrix T, the weight matrix W and loadings matrices, P and Q) that is used in the preferred embodiment of the present invention, along with a method of updating it.
- this article details the standard recursive least squares (RLS) algorithm.
- the present invention also uses the a similar algorithm, except that instead of using the matrix inversion lemma, in the present invention, a generalized inverse is calculated, increasing the stability of the algorithm.
- a prediction error tolerance indicator which is a proportion or percentage such that if the RMSEP for the best model increases by more than this percentage from the calibration RMSEP, a notification is provided;
- missing value indicators for Y data (2) missing value indicators for Y data; (3) an indicator of whether to use fixed or variable forgetting; (4) a minimum forgetting factor when variable forgetting is used; and (5) user inputs for cluster updating, as described in Section 1.12 (“Updating”) of the present application.
- the digital computer program used to carry out the computational steps of the method and system of the present invention already has saved certain necessary data and information, including (1) data transformation parameters from calibration; (2) outputs needed to update models, each of which is specifically referred to in Section 2.2 (“Calibration”) of the present application with reference to BLOCK 2020 of FIG. 10; (3) parameters needed for X-classification and for the SIMCA model update; (4) parameters needed to update discriminatory power; and (5) inputs for cluster updating, as described in Section 1.12 (“Updating”) of the present application.
- missing values are filled or estimated using the corresponding values from Y best from Section 2.6 (“Querying”) of the present application, as indicated by BLOCK 2105 .
- the Y-outliers are added to the new Y data, and corresponding X-outliers are added to the new X data, as indicated by BLOCK 2110 .
- the updating process continues and any appropriate data transformations are performed on the data matrices X and Y, including, for example, row-mean-centering or scaling, as indicated by BLOCK 2115 .
- a cluster update as described in Section 1.12 (“Updating”) of the present application, is then performed on the filled Y data, as indicated by BLOCK 2120 . If a new cluster is added in the cluster update, the updating process terminates with an assigned a value of one to a output referred to as addclus. If no new clusters were added, addclus maintains its default value of zero.
- the models are updated using cluster update classification, i.e., only the inliers are used to update each model.
- Models are updated one Y-row and corresponding X-row at a time.
- PLS models are updated using recursive-PLS routine, and the OLS model is updated using a recursive least squares algorithm. This is further described in Section 2.4 (“Forgetting Factor; Recursive PLS and RLS”) of the present application.
- the models are then used to estimate a Y-row based on a given X-row, as indicated by BLOCK 2130 .
- BLOCK 2130 After transforming the Y-estimate from the last step back to raw form, i.e., all of the data transformations are “reversed” so that the Y-estimate is on the original scale of the Y data. Thus, if the Y data was scaled and centered, then the Y-estimate is unscaled and the data center is added back in.
- the prediction error of each model is then calculated, as indicated by BLOCK 2135 .
- the RMSEP, SIMCA models, modeling power, and SIMCA discriminatory power are updated in the manner described in Section 2.3 (“Updating SIMCA”) of the present application, as indicated by BLOCK 2140 .
- the alternative discriminatory power model is also updated, as indicated by BLOCK 2145 .
- new x_pred rank and x_descrim rank are calculated, as indicated by BLOCK 2155 .
- the models can be queried for prediction and classification of data.
- the data vector x (or matrix X) is entered into the digital computer program used to carry out the computational steps of the method and system of the present invention at INPUT 2200 .
- the digital computer program already has saved certain necessary data and information associated to the X and Y data matrices and the relationship between them.
- x is classified according to the X-classification (SIMCA) analysis described above, as indicated by BLOCK 2205 .
- This classification is referred to as a.
- BLOCK 2210 the best prediction for each row of x is then determined by selecting the prediction with the lowest RMSEP per group per model, as indicated by BLOCK 2215 .
- This best prediction is referred to as vector Y best (or matrix Y best ).
- the following outputs are achieved, as indicated at OUTPUT 2220 of FIG. 12 : (1) a, the X-classification (SIMCA) of the input data vector x; and (2) y best , the best prediction of y based on the input data vector x.
- SIMCA X-classification
- a classification model of X is created that is based on: the clustering of Y; and X-class descriptors such as modeling power, group distance and discriminatory power.
- X-class descriptors such as modeling power, group distance and discriminatory power.
- X data was demographic and lifestyle data
- Y data was product preference data.
- the Y clustering was imposed on the X data, such that a prediction of product preference could be made based on a give demographic and lifestyle profile.
- a relationship can developed between the X, Y and Z data matrices, which allows the method and system of the present invention to link X with Z through Y, as generally indicated by reference numeral 1010 .
- X, Y and Z be real data matrices with dimensions n ⁇ q, n ⁇ p and p ⁇ a, respectively.
- the rows of these matrices are called points or objects.
- X and Y have the same number of rows, and the number of columns of Y equals the number of rows of Z.
- z be the set of possible row vectors for Z.
- y and x are as defined in Section 2.0 (“Phase II—X ⁇ Y Modeling”) of the present application.
- the objective is to use the X and Z data to predict or model Y.
- a preferred method of achieving this begins with the construction of a mapping, X(i,:), Z(j,:) ⁇ Y(i,j) for each i and j:
- XZ(1,:) is X(1,:) adjoined to Z(1,:);
- XZ(2,:) is X(2,:) adjoined to Z(1,:); and
- XZ(n+1,:) is X(1,:) adjoined to Z(2,:).
- a regression method is used to construct a model, f, using XZ(n*(j ⁇ 1)+i,:) as a predictor and Y(i,j) as a response for all i and j.
- One such regression method is a feed-forward, back-propagation neural network.
- a second regression method the method that is employed in the preferred embodiment described herein, is a point-wise, non-linear method, which is described in further detail below.
- A be a n ⁇ q predictor matrix for a n ⁇ p response matrix
- B n ⁇ p response matrix
- a ⁇ A where the latter is the set of all possible vectors of the type found in the rows of A.
- d be a vector of distances of a from all the rows of A, sorted from smallest to largest, and let ind be the corresponding row indices. For example, if A(20,:) is the closest to a of all the rows of A, then the first entry of d is the distance between a and A(20,:), and the first element of ind is 20.
- D i is defined as:
- D a,m is a q ⁇ p matrix.
- mopt is the number of point-models to combine in equation (39) to make a model for a given input.
- A is referred to as the reference matrix
- mopt is the combination number.
- This modeling technique can be used “as is,” or it can be “reduced” or “smoothed” using various approaches.
- a data partitioning method is used to partition a concatenation of A and B into u clusters or groups.
- the above model is then validated using the predicted y-values from the non-reduced model and performing a leave-k-out cross-validation (in the preferred embodiment described herein), or, alternatively, by performing a test validation using the full A and B.
- mopt_u be the optimal number of point-wise models to combine. Since this reduction or smoothing approach can be performed over a range of different partition numbers, u, let uopt be an optimal partitioning in terms of giving the lowest prediction error when the model is applied to A to predict B.
- a partitioning method may be used to create a new reference matrix XZ red from XZ.
- XZ and Y the point models and the combination number are input into the digital computer program used to carry out the computational steps of the method and system of the present invention.
- Pertinent data transformation parameters, an iteration number for the SOM, a cluster range, and a cutoff number are also entered.
- a SOM with a Euclidean metric is applied to XZ, and then run over the input number of iterations.
- the SOM outputs j weights, and the number of points of XZ associated with each weight is calculated. Each weight that has no associated points is deleted.
- the “weeded” resultant weights from the SOM are input into a k-means routine as initial weights.
- the k-means weights are also inspected for empty clusters and trimmed accordingly.
- the resultant weights are then taken to be XZ red,j and are input into the XZ ⁇ Y col model, thereby giving the model predictions, Y pred,j .
- the model, XZ red,j ⁇ Y pred,j is created.
- the models do not change. For example, suppose the cluster range is 25 to 100. Further suppose that different models are made for cluster numbers 25 through 50, but that models 50, 51, 52, 53, . . . are identical because the SOM and k-means are unable to form any more than 50 non-empty clusters. In other words, all subsequent clusters are empty and are consequently removed.
- the reduced model with the lowest prediction error is used for XZred ⁇ Ypred.
- the model XZ red,j* ⁇ Y pred,j* is selected for the reduced model, and that model is output.
- Optimization typically refers to function minimization or maximization, specifically, what value(s) of the function domain gives the global (as opposed to local) maximum or minimum of the function.
- the function to be minimized/maximized is referred to as the objective function.
- the optimization solution can be calculated analytically. Often, however, this is not the case. Therefore, search routines have been developed that attempt to find an optimum. Performance of these routines for a given objective function varies in both time and accuracy.
- optimization refers to function minimization, in that that the objective is to maximize f: XZ ⁇ Y col . Since the objective function is ⁇ f, maximizing f is equivalent to minimizing ⁇ f.
- SIMPS an optimization routine called Zeljko Bajzer and Ivo Penzar of the Mayo Clinic and Foundation, Rochester, Minn., USA; SIMPS is available on the Internet through the MathWorksTM web site at http://www.mathworks.com. Similar to other such optimization routines, SIMPS requires inputs of the objective function; a starting point, x 0 , from which to begin searching for the minimum; and the variable constraints, i.e., the lower and upper bounds of the domain variables.
- SIMPS allows for the option of holding specified variables fixed during the search routine, which is useful in finding an optimal z ⁇ z given x ⁇ x , or an optimal x ⁇ x given z ⁇ z .
- z ⁇ z given x ⁇ x it can be specified that the x variables in the mapping f x,z ⁇ y are held fixed. This effectively creates a new function, f x , such that f x :z ⁇ y with corresponding objective function ⁇ f x .
- the search routine is then conducted solely over the z domain (defined by the constraints) to try to minimize ⁇ f x .
- XZ is constructed from X and Z
- Y col is constructed from Y.
- any appropriate data transformations are performed on the data matrices XZ and Y col , including, for example, row-mean-centering or scaling.
- This yields outputs: XZ red , the optimal “weight” matrix from the clustering of XZ; ⁇ B i red ⁇ i 1 uopt ; and m opt — red, the number of point-models to combine to make a prediction for a given input with uopt representing the number of rows of XZ red .
- the X-variables are held constant in the optimization routine, and X in is input, thereby yielding outputs Zopt red and Zopt full .
- the Z-variables are held constant is in the optimization routine, and Z is input, again yielding outputs Xopt red and Xopt full .
- a given non-linear point-wise model referred to as MOD
- MOD is to be updated.
- a ⁇ A and b ⁇ B where B is defined similarly to A .
- MOD is a full model, it can be updated by first calculating the point model coefficients:
- D k* min(argmin j d E (a,A(j,:))), where d E is the Euclidean metric.
- k* is the row of A that is closest to a, and with the lowest row number (in the case of a tie).
- D k* is updated as the weighted average of D k* and D n+1 :
- D k * update gsz ⁇ ( k * ) * ⁇ D k * + D n + 1 gsz ⁇ ( k * ) + 1 ( 43 )
- a ⁇ ( k * , : ) update gsz ⁇ ( k * ) * ⁇ A ⁇ ( k * , : ) + a gsz ⁇ ( k * ) + 1 ( 44 )
- the purpose of updating is to adjust the non-linear models created in calibration to incorporate new X, Y and Z data.
- the new data matrices X new and Y new are entered into the digital computer program used to carry out the computational steps of the method and system of the present invention at INPUT 3100 .
- classification information on the new data including inlier and outlier indices, as well as cluster number for each row of X new and Y new .
- the digital computer program used to carry out the computational steps of the method and system of the present invention already has saved certain necessary data and information, including: data transformation parameters, variable selection numbers, the various model parameters, and model diagnostics.
- the new data and the Z matrix is transformed according to the calibration inputs on a per model basis, an indicated by BLOCK 3105 .
- the models are then updated in the manner described above in Section 3.6 (“Updating Non-linear Point-wise Models”) of the present application, an indicated by BLOCK 3110 .
- model diagnostics including prediction error, are calculated as indicated by BLOCK 3115 , and the updated models are output along with the diagnostic information at OUTPUT 3120 .
- querying refers to use of one or more of the models to predict an optimal z ⁇ z given x ⁇ x , or an optimal x ⁇ x given z ⁇ z .
- an indication is made as to whether a determination of zopt for a given x, or xopt for a given z is desired.
- the optimization routine holds the x-variables constant while searching over the z-variables .
- the optimization routine holds the z-variables constant while searching over the x-variables.
- This is similar to the linear regression models described in Section 2.2 (“Calibration”) of the present application.
- models relating X and Z to Y are created, and then, in conjunction with an optimization routine, these models are used to relate X-type data and Z-type data. These models can also be updated to incorporate new X, Y and Z information and can be queried.
- a user-friendly interface be employed to allow querying of the models by interested users.
- an interested user may submit a query through an Internet web browser installed on a personal computer operably connected to a computer network (e.g., the Internet), the model and data associated therewith being stored and maintained on a computer server also operably connected to the computer network.
- a computer network e.g., the Internet
Landscapes
- Engineering & Computer Science (AREA)
- Theoretical Computer Science (AREA)
- Data Mining & Analysis (AREA)
- General Physics & Mathematics (AREA)
- Physics & Mathematics (AREA)
- General Engineering & Computer Science (AREA)
- Computer Vision & Pattern Recognition (AREA)
- Databases & Information Systems (AREA)
- Evolutionary Biology (AREA)
- Evolutionary Computation (AREA)
- Bioinformatics & Computational Biology (AREA)
- Bioinformatics & Cheminformatics (AREA)
- Artificial Intelligence (AREA)
- Life Sciences & Earth Sciences (AREA)
- Business, Economics & Management (AREA)
- Development Economics (AREA)
- Finance (AREA)
- Strategic Management (AREA)
- Accounting & Taxation (AREA)
- Entrepreneurship & Innovation (AREA)
- Game Theory and Decision Science (AREA)
- Economics (AREA)
- Marketing (AREA)
- General Business, Economics & Management (AREA)
- Management, Administration, Business Operations System, And Electronic Commerce (AREA)
- Complex Calculations (AREA)
Priority Applications (1)
| Application Number | Priority Date | Filing Date | Title |
|---|---|---|---|
| US09/899,227 US6636862B2 (en) | 2000-07-05 | 2001-07-05 | Method and system for the dynamic analysis of data |
Applications Claiming Priority (2)
| Application Number | Priority Date | Filing Date | Title |
|---|---|---|---|
| US21623100P | 2000-07-05 | 2000-07-05 | |
| US09/899,227 US6636862B2 (en) | 2000-07-05 | 2001-07-05 | Method and system for the dynamic analysis of data |
Publications (2)
| Publication Number | Publication Date |
|---|---|
| US20020107858A1 US20020107858A1 (en) | 2002-08-08 |
| US6636862B2 true US6636862B2 (en) | 2003-10-21 |
Family
ID=22806279
Family Applications (1)
| Application Number | Title | Priority Date | Filing Date |
|---|---|---|---|
| US09/899,227 Expired - Fee Related US6636862B2 (en) | 2000-07-05 | 2001-07-05 | Method and system for the dynamic analysis of data |
Country Status (3)
| Country | Link |
|---|---|
| US (1) | US6636862B2 (fr) |
| AU (1) | AU2001273306A1 (fr) |
| WO (1) | WO2002003256A1 (fr) |
Cited By (66)
| Publication number | Priority date | Publication date | Assignee | Title |
|---|---|---|---|---|
| US20020032645A1 (en) * | 2000-09-13 | 2002-03-14 | Ken Nozaki | System and method for score calculation |
| US20020042793A1 (en) * | 2000-08-23 | 2002-04-11 | Jun-Hyeog Choi | Method of order-ranking document clusters using entropy data and bayesian self-organizing feature maps |
| US20020099702A1 (en) * | 2001-01-19 | 2002-07-25 | Oddo Anthony Scott | Method and apparatus for data clustering |
| US20020116174A1 (en) * | 2000-10-11 | 2002-08-22 | Lee Chin-Hui | Method and apparatus using discriminative training in natural language call routing and document retrieval |
| US20020138466A1 (en) * | 2001-01-13 | 2002-09-26 | International Business Machines Corporation | Method, computer program and data processing system for data clustering |
| US20020165755A1 (en) * | 2001-03-29 | 2002-11-07 | Kitts Brendan J. | Method of predicting behavior of a customer at a future date and a data processing system readable medium |
| US20020169783A1 (en) * | 2001-04-18 | 2002-11-14 | International Busines Machines Corporation | Method and apparatus for discovering knowledge gaps between problems and solutions in text databases |
| US20030014280A1 (en) * | 2001-03-01 | 2003-01-16 | Pharmetrics, Inc. | Healthcare claims data analysis |
| US20030154181A1 (en) * | 2002-01-25 | 2003-08-14 | Nec Usa, Inc. | Document clustering with cluster refinement and model selection capabilities |
| US20030182176A1 (en) * | 2002-03-25 | 2003-09-25 | Jurgen Monnerjahn | Method of computer-supported assortment optimization and computer system |
| US20040068493A1 (en) * | 2002-10-04 | 2004-04-08 | International Business Machines Corporation | Data retrieval method, system and program product |
| US20040093296A1 (en) * | 2002-04-30 | 2004-05-13 | Phelan William L. | Marketing optimization system |
| US20040098412A1 (en) * | 2002-11-19 | 2004-05-20 | International Business Machines Corporation | System and method for clustering a set of records |
| US20040103051A1 (en) * | 2002-11-22 | 2004-05-27 | Accenture Global Services, Gmbh | Multi-dimensional segmentation for use in a customer interaction |
| US20040103017A1 (en) * | 2002-11-22 | 2004-05-27 | Accenture Global Services, Gmbh | Adaptive marketing using insight driven customer interaction |
| US20040107195A1 (en) * | 2002-11-27 | 2004-06-03 | Trepess David William | Information storage and retrieval |
| US20040123253A1 (en) * | 2002-09-27 | 2004-06-24 | Chandandumar Aladahalli | Sensitivity based pattern search algorithm for component layout |
| US20040130569A1 (en) * | 2002-09-19 | 2004-07-08 | Thorpe Jonathan Richard | Information storage and retrieval |
| US20040254957A1 (en) * | 2003-06-13 | 2004-12-16 | Nokia Corporation | Method and a system for modeling user preferences |
| US20050027663A1 (en) * | 2001-09-04 | 2005-02-03 | Frank Beekmann | Sampling approach for data mining of association rules |
| US20050096874A1 (en) * | 2003-10-31 | 2005-05-05 | Smiley Karen J. | Transformer testing |
| US20050096886A1 (en) * | 2003-10-31 | 2005-05-05 | Smiley Karen J. | Method for generating and using a transformer model |
| US20050097119A1 (en) * | 2003-10-31 | 2005-05-05 | Bayoumi Deia S. | Industrial information technology (IT) paperless operator workstation |
| US20050096769A1 (en) * | 2003-10-31 | 2005-05-05 | Bayoumi Deia S. | Industrial information technology (IT) workflow optimizer for discrete manufacturing |
| US20050096774A1 (en) * | 2003-10-31 | 2005-05-05 | Bayoumi Deia S. | System and method for integrating transactional and real-time manufacturing data |
| US20050097134A1 (en) * | 2003-10-31 | 2005-05-05 | Smiley Karen J. | Method for evaluating a transformer design |
| US20050096957A1 (en) * | 2003-10-31 | 2005-05-05 | Bayoumi Deia S. | System and method for manufacturing job rescheduling |
| US20050096772A1 (en) * | 2003-10-31 | 2005-05-05 | Cox David N. | Transformer performance prediction |
| US20050163218A1 (en) * | 2001-12-19 | 2005-07-28 | Thomson Licensing S.A. | Method for estimating the dominant motion in a sequence of images |
| US20050187972A1 (en) * | 2004-02-20 | 2005-08-25 | Kruger Michael W. | System and method for analyzing and correcting retail data |
| US20050234753A1 (en) * | 2004-04-16 | 2005-10-20 | Pinto Stephen K | Predictive model validation |
| US20050234762A1 (en) * | 2004-04-16 | 2005-10-20 | Pinto Stephen K | Dimension reduction in predictive model development |
| WO2005109244A1 (fr) * | 2004-05-11 | 2005-11-17 | Angoss Software Corporation | Procede et systeme de modification et de visualisation d'un arbre decisionnel interactif |
| US20060004621A1 (en) * | 2004-06-30 | 2006-01-05 | Malek Kamal M | Real-time selection of survey candidates |
| US20060122888A1 (en) * | 2003-09-05 | 2006-06-08 | Jerome Caron | Techniques for estimating sales of items through a particular channel |
| US20060287755A1 (en) * | 2003-05-15 | 2006-12-21 | Waldemar Kubli | Configuration of tools and processes for metal forming |
| WO2007075707A1 (fr) * | 2005-12-23 | 2007-07-05 | 3M Innovative Properties Company | Interface utilisateur pour l'analyse de donnees statistiques |
| WO2007075507A1 (fr) * | 2005-12-23 | 2007-07-05 | 3M Innovative Properties Company | Interface utilisateur pour l'analyse de donnees statistiques |
| US20070198252A1 (en) * | 2004-11-01 | 2007-08-23 | Fujitsu Limited | Optimum design management apparatus, optimum design calculation system, optimum design management method, and optimum design management program |
| US20070270667A1 (en) * | 2004-11-03 | 2007-11-22 | Andreas Coppi | Musical personal trainer |
| US20080103721A1 (en) * | 2006-10-30 | 2008-05-01 | Institute For Information Industry | Systems and methods for measuring behavior characteristics |
| US20080249647A1 (en) * | 2007-04-03 | 2008-10-09 | Honeywell International, Inc. | System and Method of Data Harvesting |
| US20080319829A1 (en) * | 2004-02-20 | 2008-12-25 | Herbert Dennis Hunt | Bias reduction using data fusion of household panel data and transaction data |
| US20090006490A1 (en) * | 2004-02-20 | 2009-01-01 | Herbert Dennis Hunt | Attribute segments and data table bias reduction |
| US20090043547A1 (en) * | 2006-09-05 | 2009-02-12 | Colorado State University Research Foundation | Nonlinear function approximation over high-dimensional domains |
| US7516096B1 (en) * | 2002-06-21 | 2009-04-07 | Taiwan Semiconductor Manufacturing Company, Ltd. | Fabrication facility major excursion event cost forecast model |
| US20090164171A1 (en) * | 2007-12-21 | 2009-06-25 | Mks Instruments, Inc. | Hierarchically Organizing Data Using a Partial Least Squares Analysis (PLS-Trees) |
| US20090228328A1 (en) * | 2006-04-27 | 2009-09-10 | Jonathan Cagan | Method and Apparatus for Quantifying Aesthetic Preferences in Product Design Using Production Rules |
| US20100125608A1 (en) * | 2008-11-19 | 2010-05-20 | Electronics And Telecommunication Research Institute | Rotation based transformation method and apparatus for preserving data privacy |
| US20110071956A1 (en) * | 2004-04-16 | 2011-03-24 | Fortelligent, Inc., a Delaware corporation | Predictive model development |
| US8185547B1 (en) * | 2005-07-29 | 2012-05-22 | Teradata Us, Inc. | Data analysis based on manipulation of large matrices on a persistent storage medium |
| US20120191678A1 (en) * | 2011-01-21 | 2012-07-26 | Ying Liu | Providing Reconstructed Data Based On Stored Aggregate Data in Response to Queries for Unavailable Data |
| US8271866B2 (en) | 2004-08-19 | 2012-09-18 | International Business Machines Corporation | User-controlled web browser table reduction |
| US8719266B2 (en) | 2007-01-26 | 2014-05-06 | Information Resources, Inc. | Data perturbation of non-unique values |
| US20140279794A1 (en) * | 2013-03-15 | 2014-09-18 | Konstantinos (Constantin) F. Aliferis | Data Analysis Computer System and Method for Organizing, Presenting, and Optimizing Predictive Modeling |
| US8868446B2 (en) | 2011-03-08 | 2014-10-21 | Affinnova, Inc. | System and method for concept development |
| US9208132B2 (en) | 2011-03-08 | 2015-12-08 | The Nielsen Company (Us), Llc | System and method for concept development with content aware text editor |
| US9311383B1 (en) | 2012-01-13 | 2016-04-12 | The Nielsen Company (Us), Llc | Optimal solution identification system and method |
| US20160125439A1 (en) * | 2014-10-31 | 2016-05-05 | The Nielsen Company (Us), Llc | Methods and apparatus to correct segmentation errors |
| USRE46178E1 (en) | 2000-11-10 | 2016-10-11 | The Nielsen Company (Us), Llc | Method and apparatus for evolutionary design |
| US9785995B2 (en) | 2013-03-15 | 2017-10-10 | The Nielsen Company (Us), Llc | Method and apparatus for interactive evolutionary algorithms with respondent directed breeding |
| US9799041B2 (en) | 2013-03-15 | 2017-10-24 | The Nielsen Company (Us), Llc | Method and apparatus for interactive evolutionary optimization of concepts |
| US10147108B2 (en) | 2015-04-02 | 2018-12-04 | The Nielsen Company (Us), Llc | Methods and apparatus to identify affinity between segment attributes and product characteristics |
| US10354263B2 (en) | 2011-04-07 | 2019-07-16 | The Nielsen Company (Us), Llc | Methods and apparatus to model consumer choice sourcing |
| US11226993B2 (en) | 2017-05-31 | 2022-01-18 | Advanced New Technologies Co., Ltd. | Method and apparatus for clustering data stream |
| US20220366439A1 (en) * | 2021-04-29 | 2022-11-17 | Intuit Inc. | Object segmentation based on multiple sets of metrics |
Families Citing this family (91)
| Publication number | Priority date | Publication date | Assignee | Title |
|---|---|---|---|---|
| US8086697B2 (en) | 2005-06-28 | 2011-12-27 | Claria Innovations, Llc | Techniques for displaying impressions in documents delivered over a computer network |
| WO2002003441A1 (fr) * | 2000-07-04 | 2002-01-10 | Tokyo Electron Limited | Procede de surveillance de fonctionnement pour appareil de traitement |
| AUPR208000A0 (en) * | 2000-12-15 | 2001-01-11 | 80-20 Software Pty Limited | Method of document searching |
| JP2003022376A (ja) * | 2001-07-06 | 2003-01-24 | Hitachi Ltd | 情報提供事業システムおよび情報提供事業方法 |
| US6941301B2 (en) * | 2002-01-18 | 2005-09-06 | Pavilion Technologies, Inc. | Pre-processing input data with outlier values for a support vector machine |
| SE0202359D0 (sv) * | 2002-05-24 | 2002-08-02 | Affibody Ab | New method |
| US7802236B2 (en) * | 2002-09-09 | 2010-09-21 | The Regents Of The University Of California | Method and apparatus for identifying similar regions of a program's execution |
| US20080275587A1 (en) * | 2002-09-25 | 2008-11-06 | Advanced Micro Devices, Inc. | Fault detection on a multivariate sub-model |
| US7603341B2 (en) | 2002-11-05 | 2009-10-13 | Claria Corporation | Updating the content of a presentation vehicle in a computer network |
| JP4400706B2 (ja) * | 2002-11-25 | 2010-01-20 | 富士ゼロックス株式会社 | 色データ精度算出方法、色データ精度算出装置、色処理方法、色処理装置、色データ精度算出プログラム、色処理プログラム、記憶媒体 |
| JP4245928B2 (ja) * | 2003-01-17 | 2009-04-02 | 富士通株式会社 | 設計支援装置、設計支援方法、及び設計支援プログラム |
| WO2013126281A1 (fr) * | 2012-02-24 | 2013-08-29 | Lexisnexis Risk Solutions Fl Inc. | Systèmes et procédés pour l'analyse présumée de groupement |
| US10438308B2 (en) | 2003-02-04 | 2019-10-08 | Lexisnexis Risk Solutions Fl Inc. | Systems and methods for identifying entities using geographical and social mapping |
| US9412141B2 (en) | 2003-02-04 | 2016-08-09 | Lexisnexis Risk Solutions Fl Inc | Systems and methods for identifying entities using geographical and social mapping |
| US7620674B2 (en) * | 2003-03-07 | 2009-11-17 | Sensys Medical, Inc. | Method and apparatus for enhanced estimation of an analyte property through multiple region transformation |
| US7546578B2 (en) * | 2003-05-16 | 2009-06-09 | Oracle International Corporation | High level mathematical programming modeling language in an object oriented programming language |
| US7328126B2 (en) * | 2003-09-12 | 2008-02-05 | Tokyo Electron Limited | Method and system of diagnosing a processing system using adaptive multivariate analysis |
| US20050210027A1 (en) * | 2004-03-16 | 2005-09-22 | International Business Machines Corporation | Methods and apparatus for data stream clustering for abnormality monitoring |
| US7367011B2 (en) * | 2004-04-13 | 2008-04-29 | International Business Machines Corporation | Method, system and program product for developing a data model in a data mining system |
| US20070214133A1 (en) * | 2004-06-23 | 2007-09-13 | Edo Liberty | Methods for filtering data and filling in missing data using nonlinear inference |
| US8078602B2 (en) | 2004-12-17 | 2011-12-13 | Claria Innovations, Llc | Search engine for a computer network |
| US8255413B2 (en) | 2004-08-19 | 2012-08-28 | Carhamm Ltd., Llc | Method and apparatus for responding to request for information-personalization |
| US8744877B2 (en) * | 2004-08-26 | 2014-06-03 | Barclays Capital Inc. | Methods and systems for providing GMWB hedging and GMDB reinsurance |
| US7970682B2 (en) * | 2004-08-26 | 2011-06-28 | Barclays Capital Inc. | Methods and systems for variable annuity risk management |
| US8676538B2 (en) * | 2004-11-02 | 2014-03-18 | Advanced Micro Devices, Inc. | Adjusting weighting of a parameter relating to fault detection based on a detected fault |
| US7693863B2 (en) | 2004-12-20 | 2010-04-06 | Claria Corporation | Method and device for publishing cross-network user behavioral data |
| US8645941B2 (en) | 2005-03-07 | 2014-02-04 | Carhamm Ltd., Llc | Method for attributing and allocating revenue related to embedded software |
| US8073866B2 (en) | 2005-03-17 | 2011-12-06 | Claria Innovations, Llc | Method for providing content to an internet user based on the user's demonstrated content preferences |
| US20060293957A1 (en) * | 2005-06-28 | 2006-12-28 | Claria Corporation | Method for providing advertising content to an internet user based on the user's demonstrated content preferences |
| US20070174234A1 (en) * | 2006-01-24 | 2007-07-26 | International Business Machines Corporation | Data quality and validation within a relational database management system |
| US8417568B2 (en) * | 2006-02-15 | 2013-04-09 | Microsoft Corporation | Generation of contextual image-containing advertisements |
| US8606544B2 (en) * | 2006-07-25 | 2013-12-10 | Fisher-Rosemount Systems, Inc. | Methods and systems for detecting deviation of a process variable from expected values |
| US8145358B2 (en) | 2006-07-25 | 2012-03-27 | Fisher-Rosemount Systems, Inc. | Method and system for detecting abnormal operation of a level regulatory control loop |
| US7657399B2 (en) | 2006-07-25 | 2010-02-02 | Fisher-Rosemount Systems, Inc. | Methods and systems for detecting deviation of a process variable from expected values |
| US7912676B2 (en) | 2006-07-25 | 2011-03-22 | Fisher-Rosemount Systems, Inc. | Method and system for detecting abnormal operation in a process plant |
| JP5197610B2 (ja) | 2006-09-28 | 2013-05-15 | フィッシャー−ローズマウント システムズ,インコーポレイテッド | 熱交換器における異常状態の防止 |
| US9087335B2 (en) | 2006-09-29 | 2015-07-21 | American Express Travel Related Services Company, Inc. | Multidimensional personal behavioral tomography |
| US20080086493A1 (en) * | 2006-10-09 | 2008-04-10 | Board Of Regents Of University Of Nebraska | Apparatus and method for organization, segmentation, characterization, and discrimination of complex data sets from multi-heterogeneous sources |
| US20080140345A1 (en) * | 2006-12-07 | 2008-06-12 | International Business Machines Corporation | Statistical summarization of event data |
| US8032341B2 (en) | 2007-01-04 | 2011-10-04 | Fisher-Rosemount Systems, Inc. | Modeling a process using a composite model comprising a plurality of regression models |
| US8032340B2 (en) * | 2007-01-04 | 2011-10-04 | Fisher-Rosemount Systems, Inc. | Method and system for modeling a process variable in a process plant |
| US7827006B2 (en) | 2007-01-31 | 2010-11-02 | Fisher-Rosemount Systems, Inc. | Heat exchanger fouling detection |
| US8301676B2 (en) | 2007-08-23 | 2012-10-30 | Fisher-Rosemount Systems, Inc. | Field device with capability of calculating digital filter coefficients |
| US7702401B2 (en) | 2007-09-05 | 2010-04-20 | Fisher-Rosemount Systems, Inc. | System for preserving and displaying process control data associated with an abnormal situation |
| US8055479B2 (en) | 2007-10-10 | 2011-11-08 | Fisher-Rosemount Systems, Inc. | Simplified algorithm for abnormal situation prevention in load following applications including plugged line diagnostics in a dynamic process |
| US8775230B2 (en) | 2008-11-03 | 2014-07-08 | Oracle International Corporation | Hybrid prediction model for a sales prospector |
| US20100169158A1 (en) * | 2008-12-30 | 2010-07-01 | Yahoo! Inc. | Squashed matrix factorization for modeling incomplete dyadic data |
| US9069345B2 (en) * | 2009-01-23 | 2015-06-30 | Mks Instruments, Inc. | Controlling a manufacturing process with a multivariate model |
| US10248697B2 (en) * | 2009-07-24 | 2019-04-02 | Raytheon Company | Method and system for facilitating interactive review of data |
| TWI385544B (zh) * | 2009-09-01 | 2013-02-11 | Univ Nat Pingtung Sci & Tech | 基於密度式之資料分群方法 |
| TWI391837B (zh) * | 2009-09-23 | 2013-04-01 | Univ Nat Pingtung Sci & Tech | 基於密度式之資料分群方法 |
| CN102681999A (zh) * | 2011-03-08 | 2012-09-19 | 阿里巴巴集团控股有限公司 | 一种用户行为信息收集及信息发送方法及装置 |
| US20140201339A1 (en) * | 2011-05-27 | 2014-07-17 | Telefonaktiebolaget L M Ericsson (Publ) | Method of conditioning communication network data relating to a distribution of network entities across a space |
| US9541471B2 (en) | 2012-04-06 | 2017-01-10 | Mks Instruments, Inc. | Multivariate prediction of a batch manufacturing process |
| US9429939B2 (en) | 2012-04-06 | 2016-08-30 | Mks Instruments, Inc. | Multivariate monitoring of a batch manufacturing process |
| US9152458B1 (en) | 2012-08-30 | 2015-10-06 | Google Inc. | Mirrored stateful workers |
| US9355105B2 (en) * | 2012-12-19 | 2016-05-31 | International Business Machines Corporation | Indexing of large scale patient set |
| US20140222515A1 (en) * | 2012-12-31 | 2014-08-07 | Pitney Bowes Inc. | Systems and methods for enhanced principal components analysis |
| WO2015120255A1 (fr) * | 2014-02-06 | 2015-08-13 | University Of Massachusetts | Système et procédés de reconnaissance de modèles de trajectoires |
| US11093954B2 (en) * | 2015-03-04 | 2021-08-17 | Walmart Apollo, Llc | System and method for predicting the sales behavior of a new item |
| WO2016148703A1 (fr) * | 2015-03-17 | 2016-09-22 | Hewlett-Packard Development Company, L.P. | Identification visualisée sur une base temporelle de pluralités de points de données produites à partir de distances pondérées et d'un groupement basé sur la densité |
| US10812496B2 (en) * | 2015-10-01 | 2020-10-20 | Cisco Technology, Inc. | Automatic generation of cluster descriptions |
| US20170228743A1 (en) * | 2016-02-05 | 2017-08-10 | Weather Analytics, LLC | Crop forecasting with incremental feature selection and spectrum constrained scenario generation |
| US9741047B1 (en) * | 2016-07-15 | 2017-08-22 | Merkle, Inc. | System and method for creating segmentation of a population |
| US12079825B2 (en) * | 2016-09-03 | 2024-09-03 | Neustar, Inc. | Automated learning of models for domain theories |
| JP6150934B1 (ja) * | 2016-10-17 | 2017-06-21 | 三菱重工業株式会社 | 情報処理方法、情報処理装置、プログラム、及び情報処理システム |
| WO2018237051A1 (fr) | 2017-06-20 | 2018-12-27 | Catalina Marketing Corporation | Apprentissage automatique pour la commercialisation de produits de consommation de marque |
| US10649882B2 (en) * | 2017-08-29 | 2020-05-12 | Fmr Llc | Automated log analysis and problem solving using intelligent operation and deep learning |
| US11055318B2 (en) * | 2017-08-31 | 2021-07-06 | Intel Corporation | Target number of clusters based on internal index Fibonacci search |
| CN109947749B (zh) * | 2018-06-27 | 2023-06-20 | 广东工业大学 | 一种具有遗忘学习能力的智能家居操控行为习惯挖掘方法 |
| US11188865B2 (en) * | 2018-07-13 | 2021-11-30 | Dimensional Insight Incorporated | Assisted analytics |
| JP6740290B2 (ja) * | 2018-07-17 | 2020-08-12 | ファナック株式会社 | 機械学習装置、制御装置、及び機械学習方法 |
| EP3847429A4 (fr) * | 2018-09-06 | 2022-06-01 | Shaw Industries Group, Inc. | Test de résistance au jeu de terrain de gazon |
| JP7361122B2 (ja) * | 2018-09-11 | 2023-10-13 | スリーエム イノベイティブ プロパティズ カンパニー | アクティブバッテリ管理方法 |
| US11709910B1 (en) * | 2019-03-18 | 2023-07-25 | Cigna Intellectual Property, Inc. | Systems and methods for imputing missing values in data sets |
| EP3959530A2 (fr) * | 2019-04-25 | 2022-03-02 | Insightec Ltd. | Thermométrie à résonance magnétique accélérée |
| CN110705750A (zh) * | 2019-09-03 | 2020-01-17 | 中国电力科学研究院有限公司 | 一种区域内支柱性电力用户的电量预测方法和系统 |
| CN110569912B (zh) * | 2019-09-09 | 2022-02-01 | 自然资源部第一海洋研究所 | 一种海水剖面观测数据奇异值剔除方法 |
| TWI723626B (zh) * | 2019-11-12 | 2021-04-01 | 國立中山大學 | 具隱私保護機制的預測方法、電子裝置與電腦程式產品 |
| CN110941648A (zh) * | 2019-11-19 | 2020-03-31 | 广州市自来水有限公司 | 基于聚类分析的异常数据识别方法、系统和存储介质 |
| CN111309718B (zh) * | 2020-02-19 | 2023-05-23 | 南方电网科学研究院有限责任公司 | 一种配网电压数据缺失填补方法及装置 |
| US11734626B2 (en) * | 2020-07-06 | 2023-08-22 | International Business Machines Corporation | Cognitive analysis of a project description |
| US12536465B2 (en) * | 2020-09-11 | 2026-01-27 | Fortinet, Inc. | Inductive learning and inductive forgetting for bolstering machine-learning model performance |
| CN112579582A (zh) * | 2020-11-30 | 2021-03-30 | 贵州力创科技发展有限公司 | 一种数据分析引擎的数据探索方法及系统 |
| CN112190269B (zh) * | 2020-12-04 | 2024-03-12 | 兰州大学 | 基于多源脑电数据融合的抑郁症辅助识别模型构建方法 |
| CN112966808B (zh) * | 2021-01-25 | 2024-12-20 | 咪咕音乐有限公司 | 数据分析方法、装置、服务器和可读存储介质 |
| US12488063B2 (en) * | 2021-09-01 | 2025-12-02 | Unitedhealth Group Incorporated | Generating input processing rules engines using probabilistic clustering techniques |
| CN116610968B (zh) * | 2023-05-26 | 2025-12-09 | 中国工商银行股份有限公司 | 基于半监督密度梯度监测Kmeans异常日志检索方法 |
| US12314261B1 (en) * | 2023-11-13 | 2025-05-27 | Macronix International Co., Ltd. | Filtered search method |
| CN119042313B (zh) * | 2024-08-05 | 2025-10-24 | 中国重汽集团济南动力有限公司 | 一种基于工况预测的amt换挡策略选择方法、系统、设备及介质 |
| CN119442103B (zh) * | 2024-10-31 | 2025-09-02 | 北京联创高科信息技术有限公司 | 一种基于主成分分析法处理煤矿灾害数据的方法及系统 |
Citations (7)
| Publication number | Priority date | Publication date | Assignee | Title |
|---|---|---|---|---|
| GB2215891A (en) | 1988-02-16 | 1989-09-27 | Amoco Corp | Formation log responses processing |
| US5325298A (en) * | 1990-11-07 | 1994-06-28 | Hnc, Inc. | Methods for generating or revising context vectors for a plurality of word stems |
| US5442778A (en) | 1991-11-12 | 1995-08-15 | Xerox Corporation | Scatter-gather: a cluster-based method and apparatus for browsing large document collections |
| US5945675A (en) | 1996-03-18 | 1999-08-31 | Pacific Northwest Research Foundation | Methods of screening for a tumor or tumor progression to the metastatic state |
| US6012058A (en) * | 1998-03-17 | 2000-01-04 | Microsoft Corporation | Scalable system for K-means clustering of large databases |
| US6256633B1 (en) | 1998-06-25 | 2001-07-03 | U.S. Philips Corporation | Context-based and user-profile driven information retrieval |
| US6263334B1 (en) | 1998-11-11 | 2001-07-17 | Microsoft Corporation | Density-based indexing method for efficient execution of high dimensional nearest-neighbor queries on large databases |
-
2001
- 2001-07-05 AU AU2001273306A patent/AU2001273306A1/en not_active Abandoned
- 2001-07-05 US US09/899,227 patent/US6636862B2/en not_active Expired - Fee Related
- 2001-07-05 WO PCT/US2001/021663 patent/WO2002003256A1/fr not_active Ceased
Patent Citations (7)
| Publication number | Priority date | Publication date | Assignee | Title |
|---|---|---|---|---|
| GB2215891A (en) | 1988-02-16 | 1989-09-27 | Amoco Corp | Formation log responses processing |
| US5325298A (en) * | 1990-11-07 | 1994-06-28 | Hnc, Inc. | Methods for generating or revising context vectors for a plurality of word stems |
| US5442778A (en) | 1991-11-12 | 1995-08-15 | Xerox Corporation | Scatter-gather: a cluster-based method and apparatus for browsing large document collections |
| US5945675A (en) | 1996-03-18 | 1999-08-31 | Pacific Northwest Research Foundation | Methods of screening for a tumor or tumor progression to the metastatic state |
| US6012058A (en) * | 1998-03-17 | 2000-01-04 | Microsoft Corporation | Scalable system for K-means clustering of large databases |
| US6256633B1 (en) | 1998-06-25 | 2001-07-03 | U.S. Philips Corporation | Context-based and user-profile driven information retrieval |
| US6263334B1 (en) | 1998-11-11 | 2001-07-17 | Microsoft Corporation | Density-based indexing method for efficient execution of high dimensional nearest-neighbor queries on large databases |
Non-Patent Citations (14)
| Title |
|---|
| Anick, Peter G. et al., Exploiting clustering and phrases for context-based information retrieval, Proceedings of the 20th annual international ACM SIGIR conference on Research and development in information retrieval, Jul. 27-31 , 1997, p. 314-323, Philadelphia, Pennsylvania, USA. |
| Data Clustering: A Review By Jain et al., ACM Computing Surveys, vol. 31, No. 3, Sep. 1999.* * |
| Dayal, Bhupinder, S. and Macgregor, John F.; Recursive exponentially weighted PLS and its application to adaptive control and prediction: J. Proc. Cont. vol. 7, No. 3, pp. 169-179 (1997) (Elsevier Science Ltd., Great Britain). |
| Dubes, Richard C.; How Many Clusters are Best?-An Experiment; Pattern Recognition; vol. 20, No. 6, pp. 645-663 (1987) (Pergamon Journals Ltd., Great Britain). |
| Geladi, Paul and Kowalski, Bruce R.; Partial Least Squares Regression: A Tutorial; Analytical Chimica Acta, 185 (1986) 1-17 (Elsevier Science Publishers B.V., Amsterdam). |
| International Search Report for International Application No. PCT/US01/21663, mailed Nov. 15, 2001. |
| Kohdnen, Teuvo; Self-Organized Formation of Topologically Correct Feature Maps; Biol. Cybern. 43, 59-69 (1982). |
| Lee, Daeryong et al., Generalization of the Codebook Updating Method of the k-Means Algorithm, Communications 1999, APCC/DECC '99 Fifth Asia Conference on . . . And Forth Optoelectronics and Communications, Oct. 1999, vol. 1, p. 566-569. |
| Lee, Daeryong, et al., Modified K-Means Algorithm for Vector Quantizer Design, IEEE Signal PRocessing Letters, Jan. 1997, p. 2-4, vol. 4, Issue 1. |
| Mao, Jianchang and Jang, Anil K.; A Self-Organizing Network for Hyperellipsoidal Clustering; IEEE Transactions on Neural Networks, vol. 7, No. 1 (1996). |
| Newton, S.C., et al., Adaptive Fuzzy Leader Clustering of Complex Data Sets in Recognition, Neural Networks, IEEE Transactions On, Sep. 1992, vol. 3 Issue 5, p. 794-800. |
| Rose, K., et al., Hierarchical Clustering Using Determistic Annealing, Neural Networks, 1992, IJCNN, Internation Joint Conference on, Jun. 1992, vol. 4, p. 85-90. |
| Sjostrom, Michael and Wold, Svante; Simca: A Pattern Recognition Method Based on Principal Component Models; Pattern Recognition in Practice, pp. 351-359 (1980) (North-Holland Publishing Company). |
| Zamir, Owen et al., Web document clustering: a feasibility demonstration, Proceedings of the 21st annual international ACM SIGIR conference on Research and development in information retrieval, Aug. 24-28, 1998, p. 46-54, Melbourne, Australia. |
Cited By (111)
| Publication number | Priority date | Publication date | Assignee | Title |
|---|---|---|---|---|
| US20020042793A1 (en) * | 2000-08-23 | 2002-04-11 | Jun-Hyeog Choi | Method of order-ranking document clusters using entropy data and bayesian self-organizing feature maps |
| US20020032645A1 (en) * | 2000-09-13 | 2002-03-14 | Ken Nozaki | System and method for score calculation |
| US20020116174A1 (en) * | 2000-10-11 | 2002-08-22 | Lee Chin-Hui | Method and apparatus using discriminative training in natural language call routing and document retrieval |
| US6925432B2 (en) * | 2000-10-11 | 2005-08-02 | Lucent Technologies Inc. | Method and apparatus using discriminative training in natural language call routing and document retrieval |
| USRE46178E1 (en) | 2000-11-10 | 2016-10-11 | The Nielsen Company (Us), Llc | Method and apparatus for evolutionary design |
| US20020138466A1 (en) * | 2001-01-13 | 2002-09-26 | International Business Machines Corporation | Method, computer program and data processing system for data clustering |
| US20020099702A1 (en) * | 2001-01-19 | 2002-07-25 | Oddo Anthony Scott | Method and apparatus for data clustering |
| US20030014280A1 (en) * | 2001-03-01 | 2003-01-16 | Pharmetrics, Inc. | Healthcare claims data analysis |
| US20020165755A1 (en) * | 2001-03-29 | 2002-11-07 | Kitts Brendan J. | Method of predicting behavior of a customer at a future date and a data processing system readable medium |
| US6804665B2 (en) * | 2001-04-18 | 2004-10-12 | International Business Machines Corporation | Method and apparatus for discovering knowledge gaps between problems and solutions in text databases |
| US20020169783A1 (en) * | 2001-04-18 | 2002-11-14 | International Busines Machines Corporation | Method and apparatus for discovering knowledge gaps between problems and solutions in text databases |
| US20080147688A1 (en) * | 2001-09-04 | 2008-06-19 | Frank Beekmann | Sampling approach for data mining of association rules |
| US20050027663A1 (en) * | 2001-09-04 | 2005-02-03 | Frank Beekmann | Sampling approach for data mining of association rules |
| US7289984B2 (en) * | 2001-09-04 | 2007-10-30 | International Business Machines Corporation | Sampling approach for data mining of association rules |
| US20050163218A1 (en) * | 2001-12-19 | 2005-07-28 | Thomson Licensing S.A. | Method for estimating the dominant motion in a sequence of images |
| US20030154181A1 (en) * | 2002-01-25 | 2003-08-14 | Nec Usa, Inc. | Document clustering with cluster refinement and model selection capabilities |
| US20030182176A1 (en) * | 2002-03-25 | 2003-09-25 | Jurgen Monnerjahn | Method of computer-supported assortment optimization and computer system |
| US20040093296A1 (en) * | 2002-04-30 | 2004-05-13 | Phelan William L. | Marketing optimization system |
| US7516096B1 (en) * | 2002-06-21 | 2009-04-07 | Taiwan Semiconductor Manufacturing Company, Ltd. | Fabrication facility major excursion event cost forecast model |
| US20040130569A1 (en) * | 2002-09-19 | 2004-07-08 | Thorpe Jonathan Richard | Information storage and retrieval |
| US20040123253A1 (en) * | 2002-09-27 | 2004-06-24 | Chandandumar Aladahalli | Sensitivity based pattern search algorithm for component layout |
| US20040068493A1 (en) * | 2002-10-04 | 2004-04-08 | International Business Machines Corporation | Data retrieval method, system and program product |
| US7219089B2 (en) * | 2002-10-04 | 2007-05-15 | International Business Machines Corporation | Data retrieval method, system and program product |
| US20040098412A1 (en) * | 2002-11-19 | 2004-05-20 | International Business Machines Corporation | System and method for clustering a set of records |
| US7996253B2 (en) | 2002-11-22 | 2011-08-09 | Accenture Global Services Limited | Adaptive marketing using insight driven customer interaction |
| US7698163B2 (en) * | 2002-11-22 | 2010-04-13 | Accenture Global Services Gmbh | Multi-dimensional segmentation for use in a customer interaction |
| US7707059B2 (en) | 2002-11-22 | 2010-04-27 | Accenture Global Services Gmbh | Adaptive marketing using insight driven customer interaction |
| US20100211456A1 (en) * | 2002-11-22 | 2010-08-19 | Accenture Global Services Gmbh | Adaptive Marketing Using Insight Driven Customer Interaction |
| US20040103017A1 (en) * | 2002-11-22 | 2004-05-27 | Accenture Global Services, Gmbh | Adaptive marketing using insight driven customer interaction |
| US20040103051A1 (en) * | 2002-11-22 | 2004-05-27 | Accenture Global Services, Gmbh | Multi-dimensional segmentation for use in a customer interaction |
| US20040107195A1 (en) * | 2002-11-27 | 2004-06-03 | Trepess David William | Information storage and retrieval |
| US8280708B2 (en) * | 2003-05-15 | 2012-10-02 | Autoform Engineering Gmbh | Configuration of tools and processes for metal forming |
| US20060287755A1 (en) * | 2003-05-15 | 2006-12-21 | Waldemar Kubli | Configuration of tools and processes for metal forming |
| US20040254957A1 (en) * | 2003-06-13 | 2004-12-16 | Nokia Corporation | Method and a system for modeling user preferences |
| US8452635B2 (en) * | 2003-09-05 | 2013-05-28 | Ims Software Services Ltd. | Techniques for estimating sales of items through a particular channel |
| US20060122888A1 (en) * | 2003-09-05 | 2006-06-08 | Jerome Caron | Techniques for estimating sales of items through a particular channel |
| US7107186B2 (en) | 2003-10-31 | 2006-09-12 | Abb Research Ltd. | Transformer testing |
| US20050097134A1 (en) * | 2003-10-31 | 2005-05-05 | Smiley Karen J. | Method for evaluating a transformer design |
| US20050096772A1 (en) * | 2003-10-31 | 2005-05-05 | Cox David N. | Transformer performance prediction |
| US20050096957A1 (en) * | 2003-10-31 | 2005-05-05 | Bayoumi Deia S. | System and method for manufacturing job rescheduling |
| US20050096774A1 (en) * | 2003-10-31 | 2005-05-05 | Bayoumi Deia S. | System and method for integrating transactional and real-time manufacturing data |
| US20050096769A1 (en) * | 2003-10-31 | 2005-05-05 | Bayoumi Deia S. | Industrial information technology (IT) workflow optimizer for discrete manufacturing |
| US20050097119A1 (en) * | 2003-10-31 | 2005-05-05 | Bayoumi Deia S. | Industrial information technology (IT) paperless operator workstation |
| US20050096886A1 (en) * | 2003-10-31 | 2005-05-05 | Smiley Karen J. | Method for generating and using a transformer model |
| US20050096874A1 (en) * | 2003-10-31 | 2005-05-05 | Smiley Karen J. | Transformer testing |
| US7376664B2 (en) | 2003-10-31 | 2008-05-20 | Abb Research Ltd. | Method for evaluating a transformer design |
| US20080319829A1 (en) * | 2004-02-20 | 2008-12-25 | Herbert Dennis Hunt | Bias reduction using data fusion of household panel data and transaction data |
| US10325272B2 (en) | 2004-02-20 | 2019-06-18 | Information Resources, Inc. | Bias reduction using data fusion of household panel data and transaction data |
| US20050187972A1 (en) * | 2004-02-20 | 2005-08-25 | Kruger Michael W. | System and method for analyzing and correcting retail data |
| US7949639B2 (en) | 2004-02-20 | 2011-05-24 | Symphonyiri Group, Inc. | Attribute segments and data table bias reduction |
| US20090006490A1 (en) * | 2004-02-20 | 2009-01-01 | Herbert Dennis Hunt | Attribute segments and data table bias reduction |
| US7873529B2 (en) | 2004-02-20 | 2011-01-18 | Symphonyiri Group, Inc. | System and method for analyzing and correcting retail data |
| US8170841B2 (en) | 2004-04-16 | 2012-05-01 | Knowledgebase Marketing, Inc. | Predictive model validation |
| US8165853B2 (en) | 2004-04-16 | 2012-04-24 | Knowledgebase Marketing, Inc. | Dimension reduction in predictive model development |
| US20110071956A1 (en) * | 2004-04-16 | 2011-03-24 | Fortelligent, Inc., a Delaware corporation | Predictive model development |
| US8751273B2 (en) * | 2004-04-16 | 2014-06-10 | Brindle Data L.L.C. | Predictor variable selection and dimensionality reduction for a predictive model |
| US20050234753A1 (en) * | 2004-04-16 | 2005-10-20 | Pinto Stephen K | Predictive model validation |
| US20050234762A1 (en) * | 2004-04-16 | 2005-10-20 | Pinto Stephen K | Dimension reduction in predictive model development |
| WO2005109244A1 (fr) * | 2004-05-11 | 2005-11-17 | Angoss Software Corporation | Procede et systeme de modification et de visualisation d'un arbre decisionnel interactif |
| US20060047640A1 (en) * | 2004-05-11 | 2006-03-02 | Angoss Software Corporation | Method and system for interactive decision tree modification and visualization |
| US7873651B2 (en) | 2004-05-11 | 2011-01-18 | Angoss Software Corporation | Method and system for interactive decision tree modification and visualization |
| US20060004621A1 (en) * | 2004-06-30 | 2006-01-05 | Malek Kamal M | Real-time selection of survey candidates |
| US8271866B2 (en) | 2004-08-19 | 2012-09-18 | International Business Machines Corporation | User-controlled web browser table reduction |
| US7991617B2 (en) * | 2004-11-01 | 2011-08-02 | Fujitsu Limited | Optimum design management apparatus from response surface calculation and method thereof |
| US20070198252A1 (en) * | 2004-11-01 | 2007-08-23 | Fujitsu Limited | Optimum design management apparatus, optimum design calculation system, optimum design management method, and optimum design management program |
| US20070270667A1 (en) * | 2004-11-03 | 2007-11-22 | Andreas Coppi | Musical personal trainer |
| US8185547B1 (en) * | 2005-07-29 | 2012-05-22 | Teradata Us, Inc. | Data analysis based on manipulation of large matrices on a persistent storage medium |
| WO2007075707A1 (fr) * | 2005-12-23 | 2007-07-05 | 3M Innovative Properties Company | Interface utilisateur pour l'analyse de donnees statistiques |
| WO2007075507A1 (fr) * | 2005-12-23 | 2007-07-05 | 3M Innovative Properties Company | Interface utilisateur pour l'analyse de donnees statistiques |
| US20070168154A1 (en) * | 2005-12-23 | 2007-07-19 | Ericson Richard E | User interface for statistical data analysis |
| US20090228328A1 (en) * | 2006-04-27 | 2009-09-10 | Jonathan Cagan | Method and Apparatus for Quantifying Aesthetic Preferences in Product Design Using Production Rules |
| US20090043547A1 (en) * | 2006-09-05 | 2009-02-12 | Colorado State University Research Foundation | Nonlinear function approximation over high-dimensional domains |
| US8046200B2 (en) * | 2006-09-05 | 2011-10-25 | Colorado State University Research Foundation | Nonlinear function approximation over high-dimensional domains |
| US8521488B2 (en) | 2006-09-05 | 2013-08-27 | National Science Foundation | Nonlinear function approximation over high-dimensional domains |
| US8055663B2 (en) * | 2006-10-30 | 2011-11-08 | Institute For Information Industry | Systems and methods for measuring behavior characteristics |
| US20080103721A1 (en) * | 2006-10-30 | 2008-05-01 | Institute For Information Industry | Systems and methods for measuring behavior characteristics |
| US8719266B2 (en) | 2007-01-26 | 2014-05-06 | Information Resources, Inc. | Data perturbation of non-unique values |
| US20080249647A1 (en) * | 2007-04-03 | 2008-10-09 | Honeywell International, Inc. | System and Method of Data Harvesting |
| US7664613B2 (en) * | 2007-04-03 | 2010-02-16 | Honeywell International Inc. | System and method of data harvesting |
| US8244498B2 (en) * | 2007-12-21 | 2012-08-14 | Mks Instruments, Inc. | Hierarchically organizing data using a partial least squares analysis (PLS-trees) |
| US20090164171A1 (en) * | 2007-12-21 | 2009-06-25 | Mks Instruments, Inc. | Hierarchically Organizing Data Using a Partial Least Squares Analysis (PLS-Trees) |
| US20100125608A1 (en) * | 2008-11-19 | 2010-05-20 | Electronics And Telecommunication Research Institute | Rotation based transformation method and apparatus for preserving data privacy |
| US8112386B2 (en) * | 2008-11-19 | 2012-02-07 | Electronics And Telecommunications Research Institute | Rotation based transformation method and apparatus for preserving data privacy |
| US8484212B2 (en) * | 2011-01-21 | 2013-07-09 | Cisco Technology, Inc. | Providing reconstructed data based on stored aggregate data in response to queries for unavailable data |
| US10394821B2 (en) | 2011-01-21 | 2019-08-27 | Cisco Technology, Inc. | Providing reconstructed data based on stored aggregate data in response to queries for unavailable data |
| US20120191678A1 (en) * | 2011-01-21 | 2012-07-26 | Ying Liu | Providing Reconstructed Data Based On Stored Aggregate Data in Response to Queries for Unavailable Data |
| US9449071B2 (en) | 2011-01-21 | 2016-09-20 | Cisco Technology, Inc. | Providing reconstructed data based on stored aggregate data in response to queries for unavailable data |
| US8868446B2 (en) | 2011-03-08 | 2014-10-21 | Affinnova, Inc. | System and method for concept development |
| US9111298B2 (en) | 2011-03-08 | 2015-08-18 | Affinova, Inc. | System and method for concept development |
| US9208515B2 (en) | 2011-03-08 | 2015-12-08 | Affinnova, Inc. | System and method for concept development |
| US9208132B2 (en) | 2011-03-08 | 2015-12-08 | The Nielsen Company (Us), Llc | System and method for concept development with content aware text editor |
| US9218614B2 (en) | 2011-03-08 | 2015-12-22 | The Nielsen Company (Us), Llc | System and method for concept development |
| US9262776B2 (en) | 2011-03-08 | 2016-02-16 | The Nielsen Company (Us), Llc | System and method for concept development |
| US10354263B2 (en) | 2011-04-07 | 2019-07-16 | The Nielsen Company (Us), Llc | Methods and apparatus to model consumer choice sourcing |
| US11037179B2 (en) | 2011-04-07 | 2021-06-15 | Nielsen Consumer Llc | Methods and apparatus to model consumer choice sourcing |
| US11842358B2 (en) | 2011-04-07 | 2023-12-12 | Nielsen Consumer Llc | Methods and apparatus to model consumer choice sourcing |
| US9311383B1 (en) | 2012-01-13 | 2016-04-12 | The Nielsen Company (Us), Llc | Optimal solution identification system and method |
| US9785995B2 (en) | 2013-03-15 | 2017-10-10 | The Nielsen Company (Us), Llc | Method and apparatus for interactive evolutionary algorithms with respondent directed breeding |
| US9799041B2 (en) | 2013-03-15 | 2017-10-24 | The Nielsen Company (Us), Llc | Method and apparatus for interactive evolutionary optimization of concepts |
| US9772741B2 (en) * | 2013-03-15 | 2017-09-26 | Konstantinos (Constantin) F. Aliferis | Data analysis computer system and method for organizing, presenting, and optimizing predictive modeling |
| US20140279794A1 (en) * | 2013-03-15 | 2014-09-18 | Konstantinos (Constantin) F. Aliferis | Data Analysis Computer System and Method for Organizing, Presenting, and Optimizing Predictive Modeling |
| US11574354B2 (en) | 2013-03-15 | 2023-02-07 | Nielsen Consumer Llc | Methods and apparatus for interactive evolutionary algorithms with respondent directed breeding |
| US10839445B2 (en) | 2013-03-15 | 2020-11-17 | The Nielsen Company (Us), Llc | Method and apparatus for interactive evolutionary algorithms with respondent directed breeding |
| US11195223B2 (en) | 2013-03-15 | 2021-12-07 | Nielsen Consumer Llc | Methods and apparatus for interactive evolutionary algorithms with respondent directed breeding |
| US20160125439A1 (en) * | 2014-10-31 | 2016-05-05 | The Nielsen Company (Us), Llc | Methods and apparatus to correct segmentation errors |
| US20200219117A1 (en) * | 2014-10-31 | 2020-07-09 | The Nielsen Company (Us), Llc | Methods and apparatus to correct segmentation errors |
| US10909560B2 (en) | 2015-04-02 | 2021-02-02 | The Nielsen Company (Us), Llc | Methods and apparatus to identify affinity between segment attributes and product characteristics |
| US11657417B2 (en) | 2015-04-02 | 2023-05-23 | Nielsen Consumer Llc | Methods and apparatus to identify affinity between segment attributes and product characteristics |
| US10147108B2 (en) | 2015-04-02 | 2018-12-04 | The Nielsen Company (Us), Llc | Methods and apparatus to identify affinity between segment attributes and product characteristics |
| US11226993B2 (en) | 2017-05-31 | 2022-01-18 | Advanced New Technologies Co., Ltd. | Method and apparatus for clustering data stream |
| US20220366439A1 (en) * | 2021-04-29 | 2022-11-17 | Intuit Inc. | Object segmentation based on multiple sets of metrics |
Also Published As
| Publication number | Publication date |
|---|---|
| AU2001273306A1 (en) | 2002-01-14 |
| US20020107858A1 (en) | 2002-08-08 |
| WO2002003256A8 (fr) | 2002-07-18 |
| WO2002003256A1 (fr) | 2002-01-10 |
Similar Documents
| Publication | Publication Date | Title |
|---|---|---|
| US6636862B2 (en) | Method and system for the dynamic analysis of data | |
| US11893467B2 (en) | Model interpretation | |
| US20260044787A1 (en) | Method and system for model auto-selection using an ensemble of machine learning models | |
| US20220335501A1 (en) | Item recommendations using convolutions on weighted graphs | |
| US20250390794A1 (en) | System and method for utilizing grouped partial dependence plots and game-theoretic concepts and their extensions in the generation of adverse action reason codes | |
| Kou et al. | Evaluation of clustering algorithms for financial risk analysis using MCDM methods | |
| US10068186B2 (en) | Model vector generation for machine learning algorithms | |
| CN119226629B (zh) | 基于关联规则挖掘的搭配推荐方法及系统 | |
| Maldonado et al. | Advanced conjoint analysis using feature selection via support vector machines | |
| US20080104000A1 (en) | Determining Utility Functions from Ordinal Rankings | |
| US12086721B1 (en) | System and methods for an adaptive machine learning model selection based on data complexity and user goals | |
| CN119295188B (zh) | 会员订单处理方法、装置、设备及存储介质 | |
| CN118468061A (zh) | 一种算法自动匹配及参数优化方法及系统 | |
| CN110516950A (zh) | 一种面向实体解析任务的风险分析方法 | |
| CN112991026A (zh) | 一种商品推荐方法、系统、设备及计算机可读存储介质 | |
| Acampora et al. | A hybrid computational intelligence approach for efficiently evaluating customer sentiments in E-commerce reviews | |
| Rofik et al. | Improving the accuracy of the logistic regression algorithm model using SelectKBest in customer prediction based on purchasing behavior patterns | |
| CN118396687A (zh) | 一种商品评级分布预测方法、装置及存储介质 | |
| Kharwal | Machine Learning Algorithms: Handbook: A step-by-step guide to all Machine Learning algorithms with implementation using Python! | |
| Ruiz et al. | A principled approach to network-based classification and data representation | |
| WO2022245853A1 (fr) | Système et procédé pour utiliser des graphiques de dépendance partielle groupés et de concepts de la théorie des jeux et leurs extensions dans la génération de codes de raison d'action adverse | |
| CN114117251A (zh) | 一种智慧文博下融合多因素的矩阵分解个性化推荐方法 | |
| Dhandayudam et al. | Rough set approach for characterizing customer behavior | |
| CN119599752B (zh) | 基于家财险的家政服务推荐方法、装置、设备及存储介质 | |
| CN113706195B (zh) | 一种基于两阶段组合的在线消费行为预测方法及系统 |
Legal Events
| Date | Code | Title | Description |
|---|---|---|---|
| AS | Assignment |
Owner name: CAMO, INC., OREGON Free format text: ASSIGNMENT OF ASSIGNORS INTEREST;ASSIGNORS:LUNDAHL, DAVID S.;PLAEHN, DAVID C.;REEL/FRAME:011966/0321 Effective date: 20010703 |
|
| REMI | Maintenance fee reminder mailed | ||
| LAPS | Lapse for failure to pay maintenance fees | ||
| STCH | Information on status: patent discontinuation |
Free format text: PATENT EXPIRED DUE TO NONPAYMENT OF MAINTENANCE FEES UNDER 37 CFR 1.362 |
|
| FP | Lapsed due to failure to pay maintenance fee |
Effective date: 20071021 |