US6690817B1 - Spectral bio-imaging data for cell classification using internal reference - Google Patents
Spectral bio-imaging data for cell classification using internal reference Download PDFInfo
- Publication number
- US6690817B1 US6690817B1 US09/157,138 US15713898A US6690817B1 US 6690817 B1 US6690817 B1 US 6690817B1 US 15713898 A US15713898 A US 15713898A US 6690817 B1 US6690817 B1 US 6690817B1
- Authority
- US
- United States
- Prior art keywords
- spectral
- classification
- image
- sample
- stain
- Prior art date
- Legal status (The legal status is an assumption and is not a legal conclusion. Google has not performed a legal analysis and makes no representation as to the accuracy of the status listed.)
- Expired - Fee Related
Links
Images




Classifications
-
- G—PHYSICS
- G01—MEASURING; TESTING
- G01B—MEASURING LENGTH, THICKNESS OR SIMILAR LINEAR DIMENSIONS; MEASURING ANGLES; MEASURING AREAS; MEASURING IRREGULARITIES OF SURFACES OR CONTOURS
- G01B11/00—Measuring arrangements characterised by the use of optical techniques
- G01B11/02—Measuring arrangements characterised by the use of optical techniques for measuring length, width or thickness
- G01B11/06—Measuring arrangements characterised by the use of optical techniques for measuring length, width or thickness for measuring thickness ; e.g. of sheet material
- G01B11/0616—Measuring arrangements characterised by the use of optical techniques for measuring length, width or thickness for measuring thickness ; e.g. of sheet material of coating
- G01B11/0675—Measuring arrangements characterised by the use of optical techniques for measuring length, width or thickness for measuring thickness ; e.g. of sheet material of coating using interferometry
-
- G—PHYSICS
- G01—MEASURING; TESTING
- G01J—MEASUREMENT OF INTENSITY, VELOCITY, SPECTRAL CONTENT, POLARISATION, PHASE OR PULSE CHARACTERISTICS OF INFRARED, VISIBLE OR ULTRAVIOLET LIGHT; COLORIMETRY; RADIATION PYROMETRY
- G01J3/00—Spectrometry; Spectrophotometry; Monochromators; Measuring colours
- G01J3/12—Generating the spectrum; Monochromators
-
- G—PHYSICS
- G01—MEASURING; TESTING
- G01J—MEASUREMENT OF INTENSITY, VELOCITY, SPECTRAL CONTENT, POLARISATION, PHASE OR PULSE CHARACTERISTICS OF INFRARED, VISIBLE OR ULTRAVIOLET LIGHT; COLORIMETRY; RADIATION PYROMETRY
- G01J3/00—Spectrometry; Spectrophotometry; Monochromators; Measuring colours
- G01J3/12—Generating the spectrum; Monochromators
- G01J3/1256—Generating the spectrum; Monochromators using acousto-optic tunable filter
-
- G—PHYSICS
- G01—MEASURING; TESTING
- G01J—MEASUREMENT OF INTENSITY, VELOCITY, SPECTRAL CONTENT, POLARISATION, PHASE OR PULSE CHARACTERISTICS OF INFRARED, VISIBLE OR ULTRAVIOLET LIGHT; COLORIMETRY; RADIATION PYROMETRY
- G01J3/00—Spectrometry; Spectrophotometry; Monochromators; Measuring colours
- G01J3/12—Generating the spectrum; Monochromators
- G01J3/26—Generating the spectrum; Monochromators using multiple reflection, e.g. Fabry-Perot interferometer, variable interference filters
-
- G—PHYSICS
- G01—MEASURING; TESTING
- G01J—MEASUREMENT OF INTENSITY, VELOCITY, SPECTRAL CONTENT, POLARISATION, PHASE OR PULSE CHARACTERISTICS OF INFRARED, VISIBLE OR ULTRAVIOLET LIGHT; COLORIMETRY; RADIATION PYROMETRY
- G01J3/00—Spectrometry; Spectrophotometry; Monochromators; Measuring colours
- G01J3/28—Investigating the spectrum
- G01J3/2823—Imaging spectrometer
-
- G—PHYSICS
- G01—MEASURING; TESTING
- G01J—MEASUREMENT OF INTENSITY, VELOCITY, SPECTRAL CONTENT, POLARISATION, PHASE OR PULSE CHARACTERISTICS OF INFRARED, VISIBLE OR ULTRAVIOLET LIGHT; COLORIMETRY; RADIATION PYROMETRY
- G01J3/00—Spectrometry; Spectrophotometry; Monochromators; Measuring colours
- G01J3/28—Investigating the spectrum
- G01J3/44—Raman spectrometry; Scattering spectrometry ; Fluorescence spectrometry
- G01J3/4406—Fluorescence spectrometry
-
- G—PHYSICS
- G01—MEASURING; TESTING
- G01J—MEASUREMENT OF INTENSITY, VELOCITY, SPECTRAL CONTENT, POLARISATION, PHASE OR PULSE CHARACTERISTICS OF INFRARED, VISIBLE OR ULTRAVIOLET LIGHT; COLORIMETRY; RADIATION PYROMETRY
- G01J3/00—Spectrometry; Spectrophotometry; Monochromators; Measuring colours
- G01J3/28—Investigating the spectrum
- G01J3/45—Interferometric spectrometry
- G01J3/453—Interferometric spectrometry by correlation of the amplitudes
-
- G—PHYSICS
- G01—MEASURING; TESTING
- G01J—MEASUREMENT OF INTENSITY, VELOCITY, SPECTRAL CONTENT, POLARISATION, PHASE OR PULSE CHARACTERISTICS OF INFRARED, VISIBLE OR ULTRAVIOLET LIGHT; COLORIMETRY; RADIATION PYROMETRY
- G01J5/00—Radiation pyrometry, e.g. infrared or optical thermometry
- G01J5/10—Radiation pyrometry, e.g. infrared or optical thermometry using electric radiation detectors
-
- G—PHYSICS
- G01—MEASURING; TESTING
- G01N—INVESTIGATING OR ANALYSING MATERIALS BY DETERMINING THEIR CHEMICAL OR PHYSICAL PROPERTIES
- G01N1/00—Sampling; Preparing specimens for investigation
- G01N1/28—Preparing specimens for investigation including physical details of (bio-)chemical methods covered elsewhere, e.g. G01N33/50, C12Q
- G01N1/30—Staining; Impregnating ; Fixation; Dehydration; Multistep processes for preparing samples of tissue, cell or nucleic acid material and the like for analysis
-
- G—PHYSICS
- G01—MEASURING; TESTING
- G01N—INVESTIGATING OR ANALYSING MATERIALS BY DETERMINING THEIR CHEMICAL OR PHYSICAL PROPERTIES
- G01N15/00—Investigating characteristics of particles; Investigating permeability, pore-volume or surface-area of porous materials
- G01N15/10—Investigating individual particles
- G01N15/14—Optical investigation techniques, e.g. flow cytometry
- G01N15/1429—Signal processing
- G01N15/1433—Signal processing using image recognition
-
- G—PHYSICS
- G01—MEASURING; TESTING
- G01N—INVESTIGATING OR ANALYSING MATERIALS BY DETERMINING THEIR CHEMICAL OR PHYSICAL PROPERTIES
- G01N21/00—Investigating or analysing materials by the use of optical means, i.e. using sub-millimetre waves, infrared, visible or ultraviolet light
- G01N21/62—Systems in which the material investigated is excited whereby it emits light or causes a change in wavelength of the incident light
- G01N21/63—Systems in which the material investigated is excited whereby it emits light or causes a change in wavelength of the incident light optically excited
- G01N21/64—Fluorescence; Phosphorescence
- G01N21/6428—Measuring fluorescence of fluorescent products of reactions or of fluorochrome labelled reactive substances, e.g. measuring quenching effects, using measuring "optrodes"
-
- G—PHYSICS
- G01—MEASURING; TESTING
- G01N—INVESTIGATING OR ANALYSING MATERIALS BY DETERMINING THEIR CHEMICAL OR PHYSICAL PROPERTIES
- G01N21/00—Investigating or analysing materials by the use of optical means, i.e. using sub-millimetre waves, infrared, visible or ultraviolet light
- G01N21/62—Systems in which the material investigated is excited whereby it emits light or causes a change in wavelength of the incident light
- G01N21/63—Systems in which the material investigated is excited whereby it emits light or causes a change in wavelength of the incident light optically excited
- G01N21/64—Fluorescence; Phosphorescence
- G01N21/645—Specially adapted constructive features of fluorimeters
- G01N21/6456—Spatial resolved fluorescence measurements; Imaging
- G01N21/6458—Fluorescence microscopy
-
- G—PHYSICS
- G01—MEASURING; TESTING
- G01N—INVESTIGATING OR ANALYSING MATERIALS BY DETERMINING THEIR CHEMICAL OR PHYSICAL PROPERTIES
- G01N33/00—Investigating or analysing materials by specific methods not covered by groups G01N1/00 - G01N31/00
- G01N33/48—Biological material, e.g. blood, urine; Haemocytometers
- G01N33/50—Chemical analysis of biological material, e.g. blood, urine; Testing involving biospecific ligand binding methods; Immunological testing
- G01N33/5005—Chemical analysis of biological material, e.g. blood, urine; Testing involving biospecific ligand binding methods; Immunological testing involving human or animal cells
-
- G—PHYSICS
- G01—MEASURING; TESTING
- G01N—INVESTIGATING OR ANALYSING MATERIALS BY DETERMINING THEIR CHEMICAL OR PHYSICAL PROPERTIES
- G01N33/00—Investigating or analysing materials by specific methods not covered by groups G01N1/00 - G01N31/00
- G01N33/48—Biological material, e.g. blood, urine; Haemocytometers
- G01N33/50—Chemical analysis of biological material, e.g. blood, urine; Testing involving biospecific ligand binding methods; Immunological testing
- G01N33/53—Immunoassay; Biospecific binding assay; Materials therefor
- G01N33/569—Immunoassay; Biospecific binding assay; Materials therefor for microorganisms, e.g. protozoa, bacteria, viruses
- G01N33/56966—Animal cells
-
- G—PHYSICS
- G01—MEASURING; TESTING
- G01N—INVESTIGATING OR ANALYSING MATERIALS BY DETERMINING THEIR CHEMICAL OR PHYSICAL PROPERTIES
- G01N33/00—Investigating or analysing materials by specific methods not covered by groups G01N1/00 - G01N31/00
- G01N33/48—Biological material, e.g. blood, urine; Haemocytometers
- G01N33/50—Chemical analysis of biological material, e.g. blood, urine; Testing involving biospecific ligand binding methods; Immunological testing
- G01N33/58—Chemical analysis of biological material, e.g. blood, urine; Testing involving biospecific ligand binding methods; Immunological testing involving labelled substances
- G01N33/582—Chemical analysis of biological material, e.g. blood, urine; Testing involving biospecific ligand binding methods; Immunological testing involving labelled substances with fluorescent label
-
- G—PHYSICS
- G06—COMPUTING OR CALCULATING; COUNTING
- G06V—IMAGE OR VIDEO RECOGNITION OR UNDERSTANDING
- G06V10/00—Arrangements for image or video recognition or understanding
- G06V10/88—Image or video recognition using optical means, e.g. reference filters, holographic masks, frequency domain filters or spatial domain filters
-
- G—PHYSICS
- G06—COMPUTING OR CALCULATING; COUNTING
- G06V—IMAGE OR VIDEO RECOGNITION OR UNDERSTANDING
- G06V20/00—Scenes; Scene-specific elements
- G06V20/60—Type of objects
- G06V20/69—Microscopic objects, e.g. biological cells or cellular parts
-
- G—PHYSICS
- G01—MEASURING; TESTING
- G01J—MEASUREMENT OF INTENSITY, VELOCITY, SPECTRAL CONTENT, POLARISATION, PHASE OR PULSE CHARACTERISTICS OF INFRARED, VISIBLE OR ULTRAVIOLET LIGHT; COLORIMETRY; RADIATION PYROMETRY
- G01J3/00—Spectrometry; Spectrophotometry; Monochromators; Measuring colours
- G01J3/28—Investigating the spectrum
- G01J2003/2866—Markers; Calibrating of scan
-
- G—PHYSICS
- G01—MEASURING; TESTING
- G01J—MEASUREMENT OF INTENSITY, VELOCITY, SPECTRAL CONTENT, POLARISATION, PHASE OR PULSE CHARACTERISTICS OF INFRARED, VISIBLE OR ULTRAVIOLET LIGHT; COLORIMETRY; RADIATION PYROMETRY
- G01J3/00—Spectrometry; Spectrophotometry; Monochromators; Measuring colours
- G01J3/02—Details
-
- G—PHYSICS
- G01—MEASURING; TESTING
- G01N—INVESTIGATING OR ANALYSING MATERIALS BY DETERMINING THEIR CHEMICAL OR PHYSICAL PROPERTIES
- G01N21/00—Investigating or analysing materials by the use of optical means, i.e. using sub-millimetre waves, infrared, visible or ultraviolet light
- G01N21/62—Systems in which the material investigated is excited whereby it emits light or causes a change in wavelength of the incident light
- G01N21/63—Systems in which the material investigated is excited whereby it emits light or causes a change in wavelength of the incident light optically excited
- G01N21/64—Fluorescence; Phosphorescence
- G01N2021/6417—Spectrofluorimetric devices
Definitions
- the present invention relates to spectral methods in general and, more particularly, to spectral imaging methods for cell classification, biological research, medical diagnostics and therapy, which methods are referred to hereinbelow as spectral bio-imaging methods.
- the spectral bio-imaging methods of the present invention can be used to provide automatic and/or semiautomatic spectrally resolved morphometric classification (e.g., detection, grading) of neoplasm, by standardizing the measured spectra of biological material present in biological samples in general, but more specifically when these samples are stained for microscopy imaging, and as a result enabling the building of libraries of spectral signatures for these biological objects, and therefore allowing automatic and semiautomatic analysis of such samples.
- semiautomatic morphometric classification e.g., detection, grading
- cytological or tissue section specimen which are generally stained with chromogenic dyes, simultaneously with, or without, specific tagged or marked expressed proteins and/or genes and/or DNA segments, to be measured by bright field light microscopy have the advantages over fluorescently dyed, tagged and/or marked specimen, of being significantly more permanent and therefore of providing means to repeat the tests at later times, of avoiding the background signals due to auto fluorescence of the specimen itself, and in general of being less expensive, at least at present.
- the methods can be used for the improvement and automatization of the detection of the spatial organization and of the qualification and quantification of cellular and tissue constituents and structures associated with, for example, tumorogenesis, using, for example, light transmission microscopy combined with high spatial and spectral resolutions.
- the methods of the present invention can be used to improve the detection of cellular spatial organization and the quantification of cellular and tissue natural constituents, domains and structures, including, but not limited to, proteins, genes, DNA sections, subcellular organelles, and the like, using light transmission, reflection, scattering and fluorescence emission strategies, with high spatial and spectral resolutions, and may therefore be employed for classification of cancer cells and/or grading and/or staging the progression of cancer, using, what is referred herein as, spectrally resolved morphometry, mainly for diagnostic and prognostic applications.
- the methods of the present invention can be used for classification of cells to developmental stages, and to qualify and quantify metabolic processes within cells.
- the methods can further be used to develop new and more fine tuned indexes for neoplasm classification (including grading), which will eventually replace the existing indexes.
- neoplasm classification including grading
- grading fine tuned indexes for neoplasm classification
- the explanations and the treatment is shown for full spectral measurements encompassing a large number of wavelengths, it will be recognized on the basis of the description of the method, the assumptions and the provided mathematical modeling, that the method of the present invention is useful and valid for spectral imaging measurements which contain an arbitrary number of wavelengths in the defined spectral range, from one single wavelength to hundreds (the usual maximum number used in this technology), and more.
- a spectrometer is an apparatus designed to accept light, to separate (disperse) it into its component wavelengths, and measure the lights spectrum, that is the intensity of the light as a function of its wavelength.
- An imaging spectrometer is a spectrometer which collects incident light from a scene and measures the spectra of each pixel (i.e., picture element) thereof.
- Spectroscopy is a well known analytical tool which has been used for decades in science and industry to characterize materials and processes based on the spectral signatures of chemical constituents therein.
- the physical basis of spectroscopy is the interaction of light with matter.
- spectroscopy is the measurement of the light intensity emitted, scattered or reflected from or transmitted through a sample, as a function of wavelength, at high spectral resolution, but without any spatial information.
- Spectral imaging is a combination of high resolution spectroscopy and high resolution imaging (i.e., spatial information).
- high resolution spectroscopy i.e., spatial information
- Most of the works so far described concern either obtaining high spatial resolution information from a biological sample, yet providing only limited spectral information, for example, when high spatial resolution imaging is performed with one or several discrete band-pass filters [See, Andersson-Engels et al. (1990) Proceedings of SPIE—Bioimaging and Two-Dimensional Spectroscopy, 1205, pp. 179-189], or alternatively, obtaining high spectral resolution (e.g., a full spectrum), yet limited in spatial resolution to a small number of points of the sample or averaged over the whole sample [See for example, U.S. Pat. No. 4,930,516, to Alfano et al.].
- a spectral bio-imaging system consists of (i) a measurement system, and (ii) an analysis software.
- the measurement system includes all of the optics, electronics and the manner in which the sample is illuminated (e.g., light source selection), the mode of measurement (e.g., fluorescence or transmission), as well as the calibration best suited for extracting the desired results from the measurement.
- the analysis software includes all of the software and mathematical algorithms necessary to analyze and display important results in a meaningful way.
- Spectral imaging has been used for decades in the area of remote sensing to provide important insights in the study of Earth and other planets by identifying characteristic spectral absorption features originating therefrom.
- the high cost, size and configuration of remote sensing spectral imaging systems e.g., Landsat, AVIRIS
- has limited their use to air and satellite-born applications See, Maymon and Neeck (1988) Proceedings of SPIE—Recent Advances in Sensors, Radiometry and Data Processing for Remote Sensing, 924, pp. 10-22; Dozier (1988) Proceedings of SPIE—Recent Advances in Sensors, Radiometry and Data Processing for Remote Sensing, 924, pp. 23-30].
- spectral dispersion methods There are three basic types of spectral dispersion methods that might be considered for a spectral bio-imaging system: (i) spectral grating or prism, (ii) spectral filters and (iii) interferometric spectroscopy. As will be described below, the latter is best suited to implement the method of the present invention, yet as will be appreciated by one ordinarily skilled in the art, grating, prism and filters based spectral bio-imaging systems may also be found useful in some applications.
- a grating or prism (i.e., monochromator) based systems also known as slit-type imaging spectrometers, such as for example the DILOR system: [see, Valisa et al. (September 1995) presentation at the SPIE Conference European Medical Optics Week, BiOS Europe 1995, Barcelona, Spain], only one axis of a CCD (charge coupled device) array detector (the spatial axis) provides real imagery data, while a second (spectral) axis is used for sampling the intensity of the light which is dispersed by the grating or prism as function of wavelength.
- the system also has a slit in a first focal plane, limiting the field of view at any given time to a line of pixels.
- a full image can only be obtained after scanning the grating (or prism) or the incoming beam in a direction parallel to the spectral axis of the CCD in a method known in the literature as line scanning.
- the inability to visualize the two-dimensional image before the whole measurement is completed makes it impossible to choose, prior to making the measurement, a desired region of interest from within the field of view and/or to optimize the system focus, exposure time, etc.
- Grating and prism based spectral imagers are in use for remote sensing applications, because an airplane (or satellite) flying over the surface of the Earth provides the system with a natural line scanning mechanism.
- slit-type imaging spectrometers have a major disadvantage since most of the pixels of one frame are not measured at any given time, even though the fore-optics of the instrument actually collects incident light from all of them simultaneously. The result is that either a relatively large measurement time is required to obtain the necessary information with a given signal-to-noise ratio, or the signal-to-noise ratio (sensitivity) is substantially reduced for a given measurement time. Furthermore, slit-type spectral imagers require line scanning to collect the necessary information for the whole scene, which may introduce inaccuracies to the results thus obtained.
- Filter based spectral dispersion methods can be further categorized into discrete filters and tunable filters.
- the spectral image is built by filtering the radiation for all the pixels of the scene simultaneously at a different wavelength at a time by inserting in succession narrow band filters in the optical path, or by electronically scanning the bands using acousto-optic tunable filters (AOTF) or liquid-crystal tunable filter (LCTF), see below.
- AOTF acousto-optic tunable filters
- LCTF liquid-crystal tunable filter
- Tunable filters such as AOTFs and LCTFs have no moving parts and can be tuned to any particular wavelength in the spectral range of the device in which they are implemented.
- One advantage of using tunable filters as a dispersion method for spectral imaging is their random wavelength access; i.e., the ability to measure the intensity of an image at a number of wavelengths, in any desired sequence without the use of filter wheels.
- a method of analyzing an optical image of a scene to determine the spectral intensity of each pixel thereof by collecting incident light from the scene; passing the light through an interferometer which outputs modulated light corresponding to a predetermined set of linear combinations of the spectral intensity of the light emitted from each pixel; focusing the light outputted from the interferometer on a detector array, scanning the optical path difference (OPD) generated in the interferometer for all pixels independently and simultaneously and processing the outputs of the detector array (the interferograms of all pixels separately) to determine the spectral intensity of each pixel thereof.
- OPD optical path difference
- This method may be practiced by is utilizing various types of interferometers wherein the OPD is varied to build the interferograms by moving the entire interferometer, an element within the interferometer, or the angle of incidence of the incoming radiation. In all of these cases, when the scanner completes one scan of the interferometer, the interferograms for all pixels of the scene are completed.
- Apparatuses in accordance with the above features differ from the conventional slit- and filter type imaging spectrometers by utilizing an interferometer as described above, therefore not limiting the collected energy with an aperture or slit or limiting the incoming wavelength with narrow band interference or tunable filters, thereby substantially increasing the total throughput of the system.
- interferometer based apparatuses better utilize all the information available from the incident light of the scene to be analyzed, thereby substantially decreasing the measurement time and/or substantially increasing the signal-to-noise ratio (i.e., sensitivity).
- n be the number of detectors in the linear array, m ⁇ m the number of pixels in a frame and T the frame time.
- the total time spent on each pixel in one frame summed over all the detectors of the array is nT/m 2 .
- the energy seen by every detector at any time is of the order of 1/n of the total, because the wavelength resolution is 1/n of the range
- the energy is of the order of unity, because the modulating function is an oscillating function (e.g., sinusoidal (Michelson) or similar periodic function such as low finesse Airy function with Fabry-Perot) whose average over a large OPD range is 50%.
- an oscillating function e.g., sinusoidal (Michelson) or similar periodic function such as low finesse Airy function with Fabry-Perot
- Spectral bio-imaging systems are potentially useful in all applications in which subtle spectral differences exist between chemical constituents whose spatial distribution and organization within an image are of interest.
- the measurement can be carried out using virtually any optical system attached to the system described in U.S. Pat. No. 5,539,517, for example, an upright or inverted microscope, a fluorescence microscope, a macro lens, an endoscope and a fundus camera.
- any standard experimental method can be used, including light transmission (bright field and dark field), auto-fluorescence and fluorescence of administered probes, etc.
- Fluorescence measurements can be made with any standard filter cube (consisting of a barrier filter, excitation filter and a dichroic mirror), or any customized filter cube for special applications, provided that the emission spectra fall within the spectral range of the system sensitivity.
- Spectral bio-imaging can also be used in conjunction with any standard spatial filtering method such as dark field and phase contrast, and even with polarized light microscopy. The effects on spectral information when using such methods must, of course, be understood to correctly interpret the measured spectral images.
- a sample including at least a portion of at least one cell is prepared to be spectrally imaged;
- the sample is viewed through an optical device optically connected to an imaging spectrometer for obtaining a spectrum of each pixel of the sample;
- each of the pixels is classified into classification groups according to the pixels spectra; and
- by analyzing the classification groups of pixels the cells of the sample are classified into cell classes.
- Morphometric classification of various tumor types such as, but not limited to, leukemias, lymphomas, sarcomas and other carcinomas [see, for example, Clarke A M, Reid W A and Jack A S (1993) Combined proliferating cell nuclear antigen and morphometric analysis in the diagnosis of cancerous lymphoid infiltrates. J. Clin. Pathol. 46:129-134] are vastly implemented both in research medical practice.
- Characterization of nuclear features by different techniques is used for determination of diagnosis, treatment and prognosis. Quantitative estimation of various histopathological parameters such as two dimensional estimates of nuclear profile area, nuclear profile densities and mitotic profile numbers have been shown to correlate with differentiation and prognosis. Alterations in nuclear structure are the morphologic hallmark of cancer diagnosis. Nuclear size, shape, chromatin pattern have all been reported to change in various cancer types. For example, blood cancer cells (e.g., leukemia and lymphoma cells) are unique in their morphological features, which render them amenable for detection and classification via morphometric analysis. The following provides few examples. B-ALL is characterized by lymphoblasts having a small cytoplasm, lacking a nucleolus and having an open chromatin structure.
- CLL is characterized by small yet apparently mature lymphocytes having a small cytoplasm and condensed chromatin structure.
- PLL is characterized by lymphocytes having a large cytoplasm, round nucleus and pronounced nucleolus.
- HCL is characterized by lymphocytes featuring cytoplasmatic projections, giving them a “hairy” appearance.
- T-ALL is characterized by lymphoblasts having a cleaved or convoluted nucleus and open chromatin structure.
- Sezary syndrome is characterized by small or large cells featuring cerebriformed nucleus and/or vacuoles and condensed chromatin structure. Additional examples and descriptions associated with these and other diseases and available in Foon K A, Todd R F. Immunologic classification of leukemia and lymphoma.
- spectral bio-imaging methods which can be used for automatic and/or semiautomatic spectrally resolved morphometric classification (e.g., grading) of cells (e.g., neoplasm).
- the methods can also be used for classification of cells into grades, developmental stages, and to qualify and quantify metabolic processes within cells.
- the method can further be used to develop new and more fine tuned indexes for neoplasm and embryonic cells classification.
- a method of spectral-morphometric analysis of biological samples comprising the steps of (a) using a spectral data collection device for collecting spectral data of picture elements of the biological samples; (b) defining a spectral vector associated with picture elements representing a constant component of at least one of the biological samples; (c) using the spectral vector for defining a correcting function being selected such that when operated on spectral vectors associated with picture elements representing other constant components, spectral vectors of the other constant components are modified to substantially resemble the spectral vector; (d) operating the correcting function on spectral vectors associated with at least the variable components for obtaining corrected spectral vectors thereof; and (e) classifying the corrected spectral vectors into classification groups.
- the method further comprising the step of (f) presenting pixels associated with each of the classification groups in a distinctive color.
- the substantially constant components are red blood cells.
- the red blood cells are added to the biological sample.
- the red blood cells are inherent to the biological sample.
- the suspected variable components are tumor cells, tumor tissues or parts thereof.
- the tumor cells are hematopoietic tumor cells.
- the biological sample is a blood sample of a patient suspected to have or having a hematopoietic tumor.
- the hematopoietic tumor is selected from the group consisting of leukemia and lymphoma.
- the biological sample is of a patient suspected of having or having a disease selected from the group consisting of ALL, CLL, IM, PCL, PLL and Sezary syndrome.
- the biological sample is stained.
- staining the biological sample is effected via a stain selected from the group consisting of an immunohistochemical stain, a histological stain, a DNA ploidy stain, a nucleic acid sequence specific probe and any combination thereof.
- the histological stain is selected from the group consisting of Hematoxylin-Eosin stain, May Grunwald Giemsa stain, Romanowsky Giemsa, Masson's trichrome and Papanicolaou stain.
- collecting spectral data of picture elements of the biological samples is effected by (i) collecting incident light simultaneously from all pixels of the sample using collimating optics; (ii) passing the incident collimated light through an interferometer system having a number of elements, so that the light is first split into two coherent beams which travel in different directions inside the interferometer and then the two coherent beams recombine to interfere with each other to form an exiting light beam; (iii) passing the exiting light beam through a focusing optical system which focuses the exiting light beam on a detector having a two-dimensional array of detector elements, so that at each instant each of the detector elements is the image of one and always the same pixel of the sample for the entire duration of the measurement, so that the real image of the sample is stationary on the plane of the detector array and at any time during the measurement the image is still visible and recognizable, and so that each of the detector elements produces a signal which is a particular linear combination of light intensity emitted by the pixel at different
- collecting spectral data of picture elements of the biological samples is effected by (i) illuminating the sample with broadband light through a step-scan interferometer and condenser; (ii) collecting and optically imaging transmitted or reflected light through the sample onto a two-dimensional array of detector elements (such as a CCD or focal plane array); (iii) recording a number of frames from all the pixels of the sample in synchronization with each step-scanned position of the interferometer; (iv) mathematically processing each interferogram function so obtained for each pixel of the image to obtain a spectrum as function of wavelength for each of said pixels; and optionally, (v) performing spectral correction, classification or color display of the pixels based on their so obtained and corrected spectral vectors, as described herein.
- the spectral data collection device includes an element selected from the group consisting of a dispersion element, a filter and an interferometer.
- classifying the corrected spectral vectors into classification groups is effected using a classification map algorithm which employs reference spectral vectors for associating picture elements into the classification groups.
- the reference spectral vectors for classification are of a previously prepared reference library.
- At least one of the reference spectral vectors for classification is of picture elements derived from a cell domain selected from the group consisting of nucleolus, inter-chromosomal region, cytoplasm, a first chromatin region of the nucleus, a second chromatin region of the nucleus and background.
- the spectral vector is a normalized spectral vector.
- classifying the corrected spectral vectors into classification groups is effected by spectral vector maxima classification.
- the present invention successfully addresses the shortcomings of the presently known configurations by providing a method for automatic or semi automatic and internally referenced method for classification and grading of neoplasm. Furthermore, the method of the present invention provides spectrally resolved morphometric classification images which may be used by pathologists for classification and grading of neoplasm, which images replace the prior art RGB images and lead to more objective interpretation of the results and therefore, to a more accurate classification. This in turn may affect diagnosis, treatment and prognosis.
- FIG. 1 illustrates a conventional (prior art) slit-type imaging spectrometer.
- FIG. 2 is a block diagram illustrating the main components of an imaging spectrometer constructed in accordance with U.S. Pat. No. 5,539,517 (prior art).
- FIG. 3 illustrates a non-moving type interferometer, namely, a Sagnac interferometer, as used in an imaging spectrometer in accordance with U.S. Pat. No. 5,539,517 (prior art).
- FIG. 4 shows a definition of pseudo-RGB (Red, Green and Blue) colors for emphasizing chosen spectral ranges.
- the intensity for each of the RGB components is calculated by integrating the area under the spectrum of the pixel, after multiplying it by one of the three curves.
- FIG. 5 presents leukemia cells classified using the SPECTRACUBETM system.
- the classification technique employed was based on pixel's spectrum classification according to the wavelength at which the spectrum is maximum. Classification colors are according to the definitions of Table 2 below. The black color stands for both background pixels, and pixels which remained unclassified because their spectrum was too different from any of the other classes.
- Peripheral blood samples were from normal healthy individuals (N) and from patients with typical acute lymphocytic leukemia (ALL), chronic lymphocytic leukemia (CLL), infectious mononucleosis (IM), plasma cell lymphoma (PCL), prolymphocytic leukemia (PLL) and Sezary syndrome (SEZARY), which were diagnosed according to established criteria.
- ALL acute lymphocytic leukemia
- CLL chronic lymphocytic leukemia
- IM infectious mononucleosis
- PCL plasma cell lymphoma
- PLL prolymphocytic leukemia
- SEZARY S
- FIG. 6 presents variations among red blood cells (RBC's) spectra from various patients ALL212, CLL97, IM10, N7, PCL28, PLL11, PLL24, SEZARY20 and SEZARY24, wherein the numbers indicate a specific patient of the specified disease.
- RBC's red blood cells
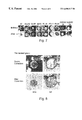
- FIG. 7 presents cells derived from the various patients listed in FIG. 6 before (upper row) and after (lower row) modification using the correcting algorithm according to the present invention.
- FIGS. 8-14 show before and after correction results from various patients of the Normal, ALL, CLL, IM, PCL, PLL and SEZARY groups. Please note the identity of the RBC's after correction, among all measurements, and the similar appearance of the cells after correction within each group and among the different groups.
- FIG. 15 is a flow chart diagram showing sequential steps of a method of spectral-morphometric analysis of biological samples according to the teachings of the present invention.
- the present invention is of standardization of spectral measurements which can be used to allow automatic and/or semiautomatic spectrally resolved morphometric classification (e.g., grading) of cells (e.g., neoplasm, embryonic cells, etc.), despite the well known difficulties encountered in this field due to staining variability and/or instrumental drifts.
- the present invention can be used to detect cellular spatial organization and to quantify cellular and tissue constituents and structures associated with tumorogenesis using light transmission microscopy combined with high spatial and spectral resolutions. This includes staining of cytological preparations or tissue sections with chromogenic dyes in the presence or absence of additional stained and/or tagged probes for the detection of protein and/or nucleic acid markers.
- the methods can also be used for classification of cells into developmental stages, and to qualify and quantify metabolic processes within cells.
- the method can further be used to develop new and more fine tuned indexes for neoplasm classification, bacterial infections, and other pathological states.
- FIGS. 4-14 of the drawings For purposes of better understanding the present invention, as illustrated in FIGS. 4-14 of the drawings, reference is first made to the construction and operation of some spectral imaging systems (i.e., imaging spectrometers).
- spectral imaging systems i.e., imaging spectrometers
- the prior art slit-type imaging spectrometer as illustrated in FIG. 1 comprises a collection optical system as indicated at 2 , for collecting the incident is light from a scene, schematically indicated at 4 and focusing the substantially parallel light of the scene 4 onto a first focal plane occupied by a slit 6 to define the field of view.
- the light exiting from slit 6 is collimated in a collimator lens 8 and is passed through a spectral dispersion element 10 (e.g., a grating or a prism) to separate the various wavelengths.
- the output from spectral dispersion element 10 is focused by a focusing lens 12 onto a two-dimensional detector array 14 in a second focal plane.
- the output of detector array 14 is fed to a signal processor 16 .
- the movement of the system effects the scanning along one dimension.
- the scanning along the second dimension is effected by the slit 6 which is oriented perpendicularly to the direction of movement of the system.
- the slit 6 thus assures that each detector within the array 14 sees only the contribution of one pixel at a single wavelength at any time. This is necessary to separate the spectra of each pixel.
- the disadvantage of the prior art method illustrated in FIG. 1 is that most of the pixels of one frame are not measured at any given time even though the optical system 2 actually collects light energy from all of them simultaneously. As a result, the required frame time is significantly increased, and/or the signal-to-noise ratio (sensitivity) is substantially decreased with respect to a system which does not have the need for such a slit.
- FIG. 2 is a block diagram illustrating the main components of an improved prior art imaging spectrometer disclosed in U.S. patent application Ser. No. 08/392,019 to Cabib et al., filed Feb. 21st, 1995, now U.S. Pat. No. 5,539,517, issued Jul. 23, 1996, which is incorporated by reference as if fully set forth herein.
- This imaging spectrometer is constructed highly suitable to implement the methods of the present invention.
- the prior art imaging spectrometer of FIG. 2 includes: a collection optical system, generally designated 20 ; a one-dimensional scanner, as indicated by block 22 ; an optical path difference (OPD) generator or interferometer, as indicated by block 24 ; a one-dimensional or two-dimensional detector array, as indicated by block 26 ; and a signal processor and display, as indicated by block 28 .
- a collection optical system generally designated 20
- a one-dimensional scanner as indicated by block 22
- an optical path difference (OPD) generator or interferometer as indicated by block 24
- a one-dimensional or two-dimensional detector array as indicated by block 26
- a signal processor and display as indicated by block 28 .
- a critical element in system 20 is the OPD generator or interferometer 24 , which outputs modulated light corresponding to a predetermined set of linear combinations of the spectral intensity of the light emitted from each pixel of the scene to be analyzed.
- the output of the interferometer is focused onto the detector array 26 .
- all the required optical phase differences are scanned simultaneously for all the pixels of the field of view, in order to obtain all the information required to reconstruct the spectrum of each pixel.
- the spectra of all the pixels in the scene are thus collected simultaneously with the imaging information, thereby permitting analysis of the image in a real-time manner.
- the apparatus according to U.S. Pat. No. 5,539,517 may be practiced in a large variety of configurations. Specifically, the interferometer used may be combined with other mirrors as described in the relevant Figures of U.S. Pat. No. 5,539,517.
- interferometers may be employed. These include (i) a moving type interferometer in which the OPD is varied to modulate the light, namely, a Fabry-Perot interferometer with scanned thickness; (ii) a Michelson type interferometer which includes a beamsplitter receiving the beam from an optical collection system and a scanner, and splitting the beam into two paths; (iii) a Sagnac interferometer optionally combined with other optical means in which interferometer the OPD varies with the angle of incidence of the incoming radiation, and (iv) a four-mirror plus beamsplitter interferometer as further described and exemplified in the cited U.S. Pat. application.
- a moving type interferometer in which the OPD is varied to modulate the light namely, a Fabry-Perot interferometer with scanned thickness
- Michelson type interferometer which includes a beamsplitter receiving the beam from an optical collection system and a scanner, and splitting the beam into two paths
- FIG. 3 illustrates an imaging spectrometer constructed in accordance with U.S. Pat. No. 5,539,517 utilizing an interferometer in which the OPD varies with the angle of incidence of the incoming radiation.
- a beam entering the interferometer at a small angle to the optical axis undergoes an OPD which varies linearly with this angle.
- the light is then passed through a beamsplitter 33 to a first reflector 34 and then to a second reflector 35 , which reflects the light back through the beamsplitter 33 and then through a focusing lens 36 to an array of detectors 37 (e.g., a CCD).
- This beam interferes with the beam which is reflected by 33 , then by second reflector 35 , and finally by first reflector 34 .
- SPECTRACUBETM An imaging spectrometer in accordance with the invention disclosed in U.S. Pat. No. 5,539,517 was developed by Applied Spectral Imaging (ASI) Ltd., Industrial Park, Migdal Haemek, Israel and is referred hereinbelow as SPECTRACUBETM.
- the SPECTRACUBETM system has the following characteristics, listed hereinbelow in Table 1:
- the SPECTRACUBETM system easily attaches to any microscope or macro lens with, for example, C-mount or F-mount connectors, and can stand in any orientation during the measurement.
- the system may as well be connected to other magnification means and to various types of endoscopes and cameras. Therefore, spectral images of cells and tissues in various magnification and lighting strategies may be obtained.
- the SPECTRACUBETM system has numerous utilities. For examples of the use of the SpectaCubeTM system for various biological applications, the reader is referred to U.S. patent application Ser. No. 08/571,047, and to E. Schroeck et al. (1996) Multicolor spectral karyotyping of human chromosomes. Science, 273, 494-497; Garini et al. (1996) Spectral Karyotyping, Bioimaging 4, 65-72; Malik et al. (1996) Fourier transform multipixel spectroscopy and spectral imaging of protoporphyrin in single melanoma cells, Photochemistry and photobiology 63, 608-614; Malik et al.
- any spectral imager i.e., an instrument that measures and stores in memory for later retrieval and analysis the spectrum of light emitted by every point of an object which is placed in its field of view, including filter (e.g., acousto-optic tunable filters (AOTF) or liquid-crystal tunable filter (LCTF)) and dispersive element (e.g., grating or prism) and spectral imagers based on interferometers built in a different configuration than SPECTRACUBE, can be used to acquire the required spectral data. Therefore, it is intended not to limit the scope of the present invention for use of any specific type of spectral imager.
- filter e.g., acousto-optic tunable filters (AOTF) or liquid-crystal tunable filter (LCTF)
- dispersive element e.g., grating or prism
- a spectral image is a three dimensional array of data, I(x,y, ⁇ ), that combines spectral information with spatial organization of the image.
- a spectral image is a set of data called a spectral cube, due to its dimensionality, which enables the extraction of features and the evaluation of quantities that are difficult, and in some cases even impossible, to obtain otherwise. Since both spectroscopy and digital image analysis are well known fields that are covered by an enormous amount of literature [see, for example, Jain (1989) Fundamentals of Digital Image Processing, Prentice-Hall International], the following discussion will focus primarily on the benefit of combining spectroscopic and imaging information in a single data set, i.e., a spectral cube.
- One possible type of analysis of a spectral cube is to use spectral and spatial data separately, i.e., to apply spectral algorithms to the spectral data and two-dimensional image processing algorithms to the spatial data.
- a spectral algorithm consider an algorithm computing the similarity between a reference spectrum and the spectra of all pixels (i.e., similarity mapping) resulting in a gray (or other color) scale image (i.e., a similarity map) in which the intensity at each pixel is proportional to the degree of ‘similarity’.
- This gray scale image can then be further analyzed using image processing and computer vision techniques (e.g., image enhancement, pattern recognition, etc.) to extract the desired features and parameters.
- similarity mapping involves computing the integral of the absolute value of the difference between the spectrum of each pixel of the spectral image with respect to a reference spectrum (either previously memorized in a library, or belonging to a pixel of the same or other spectral image), and displaying a gray level or pseudocolor (black and white or color) image, in which the bright pixels correspond to a small spectral difference, and dark pixels correspond to a large spectral difference, or vice versa.
- classification mapping perform the same calculation as described for similarity mapping, yet takes several spectra as reference spectra, and paints each pixel of the displayed image with a different predetermined pseudocolor, according to its classification as being most similar to one of the several reference spectra.
- similarity and classification mapping may employ any of the four following Equations.
- the reference spectrum can be one corresponding to a pixel in the same image, or from a library or from another image.
- G x , y ( 1 ) I max 2 40 ⁇ ( ( 1 n ⁇ ⁇ ⁇ ⁇ ( I xy ⁇ ( ⁇ ) - R ⁇ ) 2 ) 1 2 + I max 40 )
- G x , y ( 2 ) I max 2 20 ⁇ ( ( 1 n ⁇ ⁇ ⁇ ⁇ ( I xy ⁇ ( ⁇ ) - R ⁇ ) 2 ) 1 2 + I max 20 )
- G x , y ( 3 ) I max 2 40 ⁇ ( R max S max ⁇ ( 1 n ⁇ ( I xy ⁇ ( ⁇ ) - R ⁇ ) 2 ) 1 2 + I max 40 )
- G x , y ( 4 ) I max 2 40 ⁇ ( R max T max ⁇ ( 1 n ⁇ ( ⁇ I xy ⁇ ( l ) ⁇ - R l
- I max is the maximum intensity of the image
- G x,y is the brightness with which a pixel (of coordinates x and y) is displayed on the screen
- I x,y ( ⁇ ) is its spectrum
- ⁇ I xv ( ⁇ )> is the average of I xv ( ⁇ ) over the group of 3 ⁇ 3 neighboring pixels
- S max is the peak intensity of I xv ( ⁇ )
- T max is the peak intensity of ⁇ I xv ( ⁇ )>
- R ⁇ is the reference spectrum with respect to which the similarity map is calculated
- R max is the peak intensity of the reference spectrum R ⁇
- n is the number of wavelengths of the measurement.
- spectral image algorithms based on non-separable operations; i.e., algorithms that include both local spectral information and spatial correlation between adjacent pixels (one of these algorithms is, as will be seen below, a principal component analysis).
- a spectral image is a sequence of images representing the intensity of the same two-dimensional plane (i.e., the sample) at different wavelengths.
- the two most intuitive ways to view a spectral cube of data is to either view the image plane (spatial data) or the intensity of one pixel or a set of pixels as function of wavelength in a three-dimensional mountain-valley display.
- the image plane can be used for displaying either the intensity measured at any single wavelength or the gray scale image that results after applying a spectral analysis algorithm, over a desired spectral region, at every image pixel.
- the spectral axis can, in general, be used to present the resultant spectrum of some spatial operation performed in the vicinity of any desired pixel (e.g., averaging the spectrum).
- w( ⁇ ) is a general weighting response function that provides maximum flexibility in computing a variety of gray scale images, all based on the integration of an appropriately weighted spectral image over some spectral range.
- ⁇ W r ( ⁇ ), w g ( ⁇ ), W b ( ⁇ ) ⁇ corresponding to the tristimulus response functions for red (R), green (G) and blue (B), respectively.
- FIG. 4 presents an example of the power of this simple algorithm.
- ⁇ W r , W g , W b ⁇ to be Gaussian functions distributed “inside” a spectrum of interest
- the resulting pseudo-color image that is displayed in this case emphasizes only data in the spectral regions corresponding to the weighting functions, enabling spectral differences in these three regions to be detected more clearly.
- each pixel has its own intensity function (spectrum), i.e., an n-dimensional vector V 1 ( ⁇ ); ⁇ [ ⁇ 1 , ⁇ n ].
- a point operation applied to a spectral image can be defined as one that maps the spectrum of each pixel into a scalar (i.e., an intensity value) according to a transformation function:
- a point operation maps the spectrum (vector) of each pixel into another vector according to a transformation function:
- V 2 ( l ) g ( V 1 ( ⁇ )); l ⁇ [ 1, N], ⁇ [ ⁇ 1 , ⁇ n ],
- a spectral image is transformed into another spectral image.
- optical density analysis Optical density is employed to highlight and graphically represent regions of an object being studied spectroscopically with higher dynamic range than the transmission spectrum.
- the optical density is related to transmission by a logarithmic operation and is therefore always a positive function.
- OD( ⁇ ) is the optical density as a function of wavelength
- I( ⁇ ) is the measured spectrum
- I O ( ⁇ ) is a measured reference spectrum
- ⁇ ( ⁇ ) is the spectral transmittance of the sample.
- I O ( ⁇ ) is selected from (i) a pixel in the same spectral cube for which OD is calculated; (ii) a corresponding pixel in a second cube; and (iii) a spectrum from a library.
- optical density does not depend on either the spectral response of the measuring system or the non-uniformity of the CCD detector. This algorithm is useful to map the relative concentration, and in some cases the absolute concentration of absorbers in a sample, when their absorption coefficients and the sample thickness are known.
- Additional examples include various linear combination analyses, such as for example: (i) applying a given spectrum to the spectrum of each of the pixels in a spectral image by an arithmetical function such as addition, subtraction, multiplication division and combinations thereof to yield a new spectral cube, in which the resulting spectrum of each pixel is the sum, difference, product ratio or combination between each spectrum of the first cube and the selected spectrum; and (ii) applying a given scalar to the spectra of each of the pixels of the spectral image by an arithmetical function as described above.
- Such linear combinations may be used, for example, for background subtraction in which a spectrum of a pixel located in the background region is subtracted from the spectrum of each of the pixels; and for a calibration procedure in which a spectrum measured prior to sample analysis is used to divide the spectrum of each of the pixels in the spectral image.
- Another example includes a ratio image computation and display as a gray level image.
- This algorithm computes the ratio between the intensities at two different wavelengths for every pixel of the spectral image and paints each of the pixels in a lighter or darker artificial color accordingly. For example, it paints the pixel bright for high ratio, and dark for low ratio (or the opposite), to display distributions of spectrally sensitive materials.
- a sample contains k cell types stained with k different fluorophores (the term ‘cell’ here is used both for a biological cell, and also as ‘a region in the field of view of the instrument’).
- Each fluorophore has a distinct fluorescence emission spectrum and binds to only one of the k cell types. It is important to find the average fluorescence intensity per cell for each one of the k cell types.
- the relevant spectral data takes the form of characteristic cell spectra (i.e., spectral “signatures”), while the spatial data consists of data about various types of cells (i.e., cell blobs) many of which appear similar to the eye.
- the ideal type of measurement for this type of situation is a spectral image.
- cells can be differentiated by their characteristic spectral signature.
- a suitable point operation will be performed to generate a synthetic image in which each pixel is assigned one of k+1 values.
- R ⁇ is the spectral region of interest.
- Each point [pixel (x, y)] in the image can then be classified into one of the k+1 classes using the following criterion:
- n 1, 2, . . . , k.
- Arithmetic operations may similarly be applied to two or more spectral cubes and/or spectra of given pixels or from a library. For example consider applying an arithmetic operations between corresponding wavelengths of corresponding pairs of pixels belonging to a first spectral cube of data and a second spectral cube of data to obtain a resulting third spectral cube of data for the purpose of, for example, averaging two spectral cubes of data, time changes follow-up, spectral normalization, etc.
- objects e.g., cancer cells
- a decorrelation statistical analysis such as principal component analysis by producing covariance or correlation matrices enhances these small differences.
- Decorrelation statistical analysis is directed at extracting decorrelated data out of a greater amount of data, and average over the correlated portions thereof.
- related statistical decorrelation methods include but not limited to principal component analysis (PCA), canonical variable analysis and singular value decomposition, etc., of these methods PCA is perhaps the more common one, and is used according to the present invention for decorrelation of spectral data.
- PCA principal component analysis
- canonical variable analysis and singular value decomposition, etc. of these methods
- PCA is perhaps the more common one, and is used according to the present invention for decorrelation of spectral data.
- Principal component analysis is one of a number of powerful techniques used in multivariate statistical analysis. It is advantageous in cases where a large number of “results”, which depend on a large number of possibly correlated variables forms the basic data set. Its strength lies in the fact that this data decomposition provides a transformation to decorrelated variables, while simultaneously averaging over correlated variables.
- the basic data set i.e., the spectral cube
- the data set is composed of k spectral slices of the same object, where each spectral slice is obtained at a different spectral band.
- the data set is composed of the spectra of all the pixels of the object.
- One of the objectives of looking at such a data set can be the characterization of the pixels into groups of similar spectra.
- each spectral slice as a vector whose elements are the image pixels arranged into the column vector using a predetermined code. Call the spectral slices X m , so that the term x nm signifies the n-th pixel of the m-th spectral slice.
- a matrix y derived from matrix x by subtracting from each column, the column average.
- the various columns of the y matrix may be correlated, so that, some of the information carried by the data is correlated.
- the PCA technique decorrelates the information and reduces it only to decorrelated variables, so that the amount of “real” data pixels is smaller and easier to handle.
- y′ is the transpose of y.
- the i,j term of c is the covariance of the i-th slice with the j-th slice, i.e. if they are decorrelated this term vanishes.
- the diagonal of c is composed of the variances of each spectral slice, which can be regarded as a scale for the amount of information in this particular slice. Alternatively, this variance (its square root) can be regarded as the average contrast of this particular slice.
- Linear algebra describes this situation as follows.
- the objects of interest (the pixels of the spectral slices, k of them) are points in a k dimensional space.
- the fact that the covariance matrix c shows correlations is represented by its having a rank smaller than k.
- This situation is called degeneracy and it means that the k (narrow band) spectral slices provide too much data relative to the information content.
- Reduction of the data is performed by finding the eigen system of the covariance matrix.
- this operation means that one has to find k vectors v m called eigenvectors and k scalars ⁇ m called eigenvalues so that:
- such an analysis can be performed on a whole spectral cube.
- the analysis is performed only for selected pixels or mathematically manipulated (e.g., after background subtraction and averaging) selected pixels to improve the results and enable better classification later on.
- the preferred approach is described in more detail below, nevertheless, there is no intention to limit the scope of the present invention to the preferred approach employed, as different mathematical manipulations may be found useful for different data collection approaches (e.g., filter or dispersion element based spectral imagers).
- Light microscopy is one of the most fundamental techniques for the visualization of cells and tissues in biology and pathology. Transmission microscopy suffers greatly from the inherently low contrast of cell organelles and structural details. Many methods have been developed to improve this contrast, among them staining, spatial filtering and others.
- the use of the spectral bio-imaging methods of the present invention with stained cells and tissues is one of the most straightforward methods to increase even further their apparent contrast, when examined under a transmission microscope, thereby improving dramatically the identification and discrimination capabilities of this popular microscopic method.
- the basic approach proposed herein is to measure a spectral image, and to then use this large amount of information in conjunction with spectral and morphological analysis methods and algorithms in order to identify and map cellular and subcellular details.
- the Romanowsky-Giemsa staining procedure uses a combination of two dyes, one of which is Azure-B (trimethyl methionine), a thiazin dye, and the second being Eosin Y (hydroxyxanthene bromide).
- Azure-B trimethyl methionine
- Eosin Y hydroxyxanthene bromide
- the thiazines are cationic dyes and therefore bind to acidic cellular constituents
- Eosin is an anionic dye and tends to bind to basic cellular constituents. It is widely accepted that the use of these two components creates the so-called Romanowsky-Giemsa effect, which is expressed as the development of a specific purple color, a new dye complex, in some stained sites.
- azure-B-Eosin complex The molecular basis of the azure-B-Eosin complex is obscure. Some authors think that azure-B binds to anionic structures such as the phosphate groups of DNA, and that Eosin simultaneously binds both with an adjacent cationic site on the DNA and with the azure-B. In a more recently proposed model of the azure-B-Eosin complex, Friedrich and colleagues [Friedrich et al. (1990) Histochemistry 93, pp. 247-256] have suggested that azure-B first binds to phosphodiester residues of the DNA molecule.
- the phenyl group of the Eosin molecule is the portion that binds to the azure-B molecule (which lies in a single plane).
- the color purple is a result of a red shift of the Eosin absorption peak, which in turn is caused by the dielectric polarization of bound Eosin.
- the very existence of such an azure-B-Eosin complex is still questioned by others [see, Friedrich et al. (1990) Histochemistry 93, pp. 247-256; Bottiroli et al. (1994) Lasers in Surgery and Medicine; Profio (1984) IEEE Journal of Quantum Electronics QE-20 pp.
- morphometric spectral image (as opposed to simple morphometric image) analysis enables the evaluation of subtle cytological and histological features to yield useful ultrastructural and medical information for diagnostic and prognostic evaluation.
- spectral images acquired using transmission methods and unstained tissue may provide useful information, similar to that found in fluorescence microscopy techniques.
- One of the advantages of combining spectral bio-imaging and transmission microscopy without staining is the ability to use a “clean” measurement technique, i.e., no need for working with potentially toxic dyes or fixation agents.
- a method of spectral-morphometric analysis of biological samples which include substantially constant components and suspected variable components.
- the method is effected by executing the following method steps, in which, in a first step a spectral data collection device is employed for collecting spectral data of picture elements of the biological samples.
- a spectral vector associated with picture elements representing a constant component of at least one of the biological samples is defined.
- a third step of the method that spectral vector is used for defining a correcting function which is selected such that when operated on spectral vectors associated with picture elements representing other constant components, the spectral vectors of the other constant components are modified to substantially resemble the above spectral vector.
- the correcting function is operated on spectral vectors associated with at least the variable components for obtaining corrected spectral vectors thereof. Finally, the corrected spectral vectors are classified into classification groups.
- the method according to the present invention preferably further includes a step in which pixels associated with each of the classification groups are presented in a distinctive color, e.g., on a display (monitor, computer screen, print, etc.).
- the method according to the present invention is thus designed to provide modified spectral vectors of pixels associated with suspected variable components, which modified spectral vectors provide a better basis for classification by neutralizing variability of staining and/or instrumentation instability.
- the spectral vectors of the variable components are rendered independent of the measurement itself, and therefore allow for the building of spectral vector libraries and aid in the automatization of the analysis of the samples.
- spectral vector refers to any type of spectral data, including, but not limited to, a spectrum. Also spectral data collected using, for example, a plurality (two or more) of specific band filters, e.g., narrow band filters, falls under this term.
- biological sample refers to a sample retrieved from an animal, mammals and human beings in particular.
- the sample may be of a healthy tissue, disease tissue or tissue suspected of being disease tissue.
- the sample may be a biopsy taken, for example, during a surgical procedure.
- the sample may be collected via means of fine needle aspiration, scraping or washing a cavity to collects cells or tissue therefrom.
- the sample may be of a tumor both solid and hematopoietic tumors, as well as of neighboring healthy tissue.
- the sample may be a smear of individual cells or a tissue section.
- substantially constant components refers to objects which should have the same spectrum when measured at different times under the same conditions, irrespective of the type of sample in which they are present.
- red blood cells RBC's
- red blood cells should have the same spectrum whether they are in a sample derived from a healthy person or from a leukemia patient, because it is assumed that their chemical composition does not change with the disease. Therefore, red blood cells are presently the preferred substantially constant components.
- inherently or substantially constant red blood cells derived from healthy blood or other constant biological material can be added to the sample to serve as the reference according to the present invention.
- red blood cells are inherently present in the examined samples.
- solid tumors they are preferably added to at least a portion of the sample and otherwise they are used invariably as the reference material as described herein.
- the phrase “suspected variable components” refers to objects which may have different characterizing spectra in patients of different diseases, as opposed to healthy individuals.
- the suspected variable components are tumor cells, being analyzed for classification into tumor type and grade.
- the method provided herein is basically a “calibration” or spectral “standardization” method, which allows a more meaningful comparison between different measurements by correcting out spectral shifts or distortions due to stain variability and/or instrumental instabilities.
- Hematopoietic tumors include leukemias, lymphomas and other blood diseases, including, but not limited to, ALL, CLL, IM, PCL, PLL and Sezary syndrome.
- Suitable stains include but are not limited to Hematoxylin-Eosin staining and Giemsa staining or for some applications immunostaining [see, for example, Goto M, Nagatomo Y, Hasui K, Yamanaka H Murashima S and Sato E (1992) Chromaticity analysis of immunostained tumor specimens. Pathol. Res. Pract. 188:433].
- cells which have not been stained are also suitable or preferred. This depends in part on lighting strategy and type of microscope employed, all as well known in the art.
- the biological samples are stained, e.g., via immunohistochemical stain, a histological stain, a DNA ploidy stain, nucleic acid (DNA or RNA) sequence specific probes (from single locus, gene or EST sequence to whole chromosome or chromosomes paints) or any combination thereof.
- the histological stain can be, for example, Hematoxylin-Eosin stain, Giemsa stains of different types, Masson's trichrome or Papanicolaou stain.
- stains are presently widely used in tumor classification and grading as they differentially stain different classes and grades.
- Such stains can enhance the unique features of the tumor cells according to the present invention by attributing distinctive spectral signatures in a spatial dependent manner, resulting in improved spectral morphometry.
- the term “stained” or “staining” refers to a process in which coloration is produced by foreign matter having penetrated into and/or interacted with the biological sample.
- stain refers to colorants, either fluorescent, luminescent and/or non-fluorescent (chromogenes) and further to reagents or matter used for effecting coloration.
- immunohistochemical stain refers to colorants, reactions and associated reagents in which a primary antibody which binds a cytological marker is used to directly or indirectly (via “sandwich” reagents and/or an enzymatic reaction) stain the biological sample examined.
- Immunohistochemical stains are in many cases referred to in the scientific literature as immunostains, immunocytostains, immunohistopathological stains, etc.
- the term “histological stain” refers to any colorant, reaction and/or associated reagents used to stain cells and tissues in association with cell components such as types of proteins (acidic, basic), DNA, RNA, lipids, cytoplasm components, nuclear components, membrane components, etc. Histological stains are in many cases referred to as counterstains, cytological stains, histopathological stains, etc.
- DNA ploidy stain refers to stains which stoichiometrically bind to chromosome components, such as, but not limited to, DNA or histones.
- chromosome components such as, but not limited to, DNA or histones.
- an antibody such as anti-histone antibody
- such stains are also known as DNA immunoploidy stains.
- nucleic acid sequence specific probe refers to polynucleotides labeled with a label moiety which is either directly or indirectly detectable, which polynucleotides being capable of base-pairing with matching nucleic acid sequences present in the biological sample.
- spectral data collection device refers to any device capable of detecting light intensity associated with a plurality, typically four or more, of distinct spectral bands in each spatial element (pixel) of the examined sample.
- the SPECTRACUBETM system optically connected to a microscope preferably serves as the spectral data collection device according to the present invention.
- any spectral imager i.e., an instrument that measures and stores in memory for later retrieval and analysis the spectrum of light emitted by every point of an object which is placed in its field of view, including filters (e.g., conventional, acousto-optic tunable filter (AOTF) or liquid-crystal tunable filter (LCTF)) and dispersive element (e.g., grating or prism) based spectral imagers, or other spectral data or multi-band light collection devices (e.g., a device in accordance with the disclosure in Speicher R. M., Ballard S. G. and Ward C. D. (1996) Karyotyping human chromosomes by combinatorial multi-fluor FISH.
- filters e.g., conventional, acousto-optic tunable filter (AOTF) or liquid-crystal tunable filter (LCTF)
- dispersive element e.g., grating or prism
- spectral data collection device An additional possible type of spectral data collection device that can be used according to the present invention is one that is known in the literature as a “Step-scan infrared imaging system” sold by BioRad Laboratories Inc. of Cambridge Mass., USA, and described in: Fourier Transform Spectroscopic Imaging Using an Infrared Focal-Plane Array Detector, by E. Neil Lewis et al., Analytical Chemistry, Vol. 67, No. 19, Oct. 1, 1995, pp. 3377-3381, and histopathological applications of it are described in: Infrared Spectroscopic Imaging as a Tool for Pathology, by Linda H. Kidder et al., SPIE Proceedings Vol. No. 3257, Conference held in S.
- a commercial FT-IR step-scan interferometer is coupled to an IR microscope; samples mounted on quartz microscope slides are analyzed in transmission mode.
- the IR image is collected with a Cassegrain (reflective) objective.
- the image is projected to a liquid nitrogen-cooled InSb FPA (Focal Plane Array) detector (128 ⁇ 128 pixels) with a CaF 2 imaging lens.
- InSb FPA Fecal Plane Array
- the focal plane array should be replaced by a CCD or similar detector sensitive to visible light
- the imaging lenses and other optics should be adapted to transmit and/or reflect visible light
- other system modifications should be introduced to make sure that the field, of view, spectral resolution, spatial resolution, measurement time, etc. are all reasonable and within feasible ranges.
- the interferometer timing and image acquisition are controlled externally via a computer. Therefore, it is intended not to limit the scope of the present invention for use of any specific type of spectral data collection device, nor to any specific type of spectral imager.
- the spectral data collection device can be an interferometer-based spectral data collection device of any kind, filter(s)-based spectral data collection device and a dispersion element-based spectral data collection device.
- collecting spectral data of picture elements of the biological samples is effected by (i) collecting incident light simultaneously from all pixels of the sample using collimating optics; (ii) passing the incident collimated light through an interferometer system having a number of elements, so that the light is first split into two coherent beams which travel in different directions inside the interferometer and then the two coherent beams recombine to interfere with each other to form an exiting light beam; (iii) passing the exiting light beam through a focusing optical system which focuses the exiting light beam on a detector having a two-dimensional array of detector elements, so that at each instant each of the detector elements is the image of one and always the same pixel of the sample for the entire duration of the measurement, so that the real image of the sample is stationary on the plane of the detector array and at any time during the measurement the image is still visible and recognizable, and so that each of the detector elements produces a signal which is a particular linear combination of light intensity emitted by the pixel at different
- classifying the corrected spectral vectors into classification groups is effected using a classification map algorithm which employs reference spectral vectors for associating picture elements into the classification groups.
- the reference spectral vectors used for classification can be derived from a previously prepared reference spectral vectors library.
- at least one of the reference spectral vectors for classification is of picture element(s) derived from a cell domain selected from the group consisting of nucleolus, inter-chromosomal region, cytoplasm, a first chromatin region of the nucleus, a second chromatin region of the nucleus and background.
- Classification can alternatively be effected by spectral maxima classification, as further exemplified in the Examples section below.
- MCG May Grunwald Giemsa
- Peripheral blood was obtained from normal healthy individuals and from patients with typical acute lymphocytic leukemia (ALL), chronic lymphocytic leukemia (CLL), infectious mononucleosis (IM), plasma cell lymphoma (PCL), prolymphocytic leukemia (PLL) and Sezary syndrome (SEZARY), which were diagnosed according to established criteria.
- ALL acute lymphocytic leukemia
- CLL chronic lymphocytic leukemia
- IM infectious mononucleosis
- PCL plasma cell lymphoma
- PLL prolymphocytic leukemia
- SEZARY Sezary syndrome
- the SPECTRACUBETM system (Applied Spectral Imaging (ASI) Ltd., Industrial Park, Migdal Haemek, Israel) was used for spectral imaging of the samples.
- the SPECTRACUBETM system employed includes a Sagnac interferometer which is a particular type of triangular interferometer (see FIG. 3 above) and has high mechanical and thermal stability.
- the light beam passing through the specimen is split in the interferometer in different directions, and is united again at the exit with an optical path difference (OPD) which is a function of the angle ( ⁇ ) between the incoming beam and the optical axis of the interferometer itself.
- OPD optical path difference
- the OPD arises because for non-zero angles the two beams undergo different optical paths in the beamsplitter.
- Wavelength calibration is performed by measuring a series of known monochromatic sources and then building a quadratic best-fit table of the wavelength versus “channel” parameter, the independent variable proportional to 1/ ⁇ (resulting from the fast Fourier transform, FFT).
- the interferometer forms interference fringes at infinity, so that they show up on the CCD focal plane as lines of intensity modulation superimposed on the image of the sample.
- the actual measurement is done by recording successive CCD frames in synchronization with the steps of the motor used to rotate the collimated beam, so that the instantaneous OPD is known for every pixel in every recorded frame and can be used in the FFT calculation.
- each detector element of the CCD (512 ⁇ 512, in this case) is collecting an interferogram, which is then Fourier transformed to give the spectrum of the corresponding pixel.
- the spectral and spatial resolutions, spectral range and other characteristics of the system employed are summarized in Table 1, above.
- Spectral correction or standardization using the spectrum of pixels associated with red blood cells, as further detailed hereinbelow was used prior to classification to enhance thereafter spectral features and to correct for spectral differences associated with e.g., sample preparation, source, etc. This latter procedure, in effect, is the gist of the present invention.
- SR( ⁇ ) the spectrum of the substantially constant component (red blood cells averaged, for example, over 5 pixels in the examples used in this specifications) taken from one of the spectral image measurements, as SR( ⁇ ), where ⁇ is the wavelength.
- SRBC( ⁇ ) the spectrum of the substantially constant component taken from another spectral image measurement, or a second measurement, for the purposes of this explanation, be it SRBC( ⁇ ).
- IR( ⁇ ), I( ⁇ ) spectral intensity functions of the illumination on the sample
- CR, C attenuation constants independent of wavelength and of pixel position, which may be due to dirt on the optics or any other cause;
- KR( ⁇ ), K( ⁇ ) spectral response functions of the measurement system including the spectral transmission of the optics and the spectral response function of the detector array;
- SMR( ⁇ ), SM( ⁇ ) measured spectra of the same type of object M in the two different measurements (it could be cytoplasm, heterochromatin, euchromatin, an organelle, a stained protein by immunological labeling, a stained DNA section or gene, etc.)
- DR( ⁇ ), D( ⁇ ), DMR( ⁇ ), DM( ⁇ ) spectral transmission due to staining variability from measurement to measurement and from object to object.
- DR( ⁇ ) and D( ⁇ ) correspond to the RBC's of the reference and the second measurement respectively
- DMR( ⁇ ) and DM( ⁇ ) correspond to the object, M, measured respectively in the reference and in the second measurement.
- the next step is to build a new spectral image by multiplying the correction function X( ⁇ ) by the spectrum of each pixel of the second measurement.
- the resulting spectrum of an RBC cell will be:
- DR( ⁇ ), D( ⁇ ), DMR( ⁇ ), DM ( ⁇ ) are related by a distortion variability function Y( ⁇ ) as follows:
- FIG. 11 shows that this is a reasonable assumption: for example, all cells measured in IM10, IM11, PLL24, and SEZARY20 spectral images, while looking very different from the corresponding cells of the same disease of different patients before the correction, they show a very similar pixel classification after the correction method explained above has been applied to them.
- FIG. 5 presents leukemia cells classification using the SPECTRACUBETM system, before any correction was applied.
- the classification technique employed was based on pixel's spectrum classification according to the spectral band in which the spectrum maximum occurs as follows. First, a spectral image (spectral cube) was measured. Second, the cube was normalized, i.e., stretched to a full dynamic range (0-1), by dividing it by a constant equal to the maximum signal present in the cube. Then, based on spectral maxima, each pixel was assigned a specific artificial color, according to the definition of Table 2 below. Table 2 below associates spectral bands of spectral maxima with classification colors. A total of nine classification groups were used: 8 for different cell features, and one, black, for all the pixels which are either background or are not classified in any of the other 8 groups. Similar results were obtained using a conventional classification approach as described hereinabove.
- RBC red blood cell
- Such a technique which is the gist of the present invention, is based on the stipulation that the properties of the red blood cell are inherently invariant, so that their spectrum should be invariant as well, and that a spectral change or shift due to differential staining affects the RBC's and the rest of the sample in a similar way.
- the spectral standardization procedure according to the present invention as described hereinabove was carried out for the nine cubes under discussion (ALL212, CLL97, IM10, N7, PCL28, PLL11, PLL24, SEZARY20 and to SEZARY24). After the spectral correction was performed, the corrected cubes were classified, using the same procedure as described with respect to FIG. 5 .
- FIGS. 8-14 show results from various patients of the Normal, ALL, CLL, IM, PCL, PLL and SEZARY groups before and after correction. Please note the homogeneous appearance of the cells after correction in all groups and among groups.
Landscapes
- Physics & Mathematics (AREA)
- Health & Medical Sciences (AREA)
- Life Sciences & Earth Sciences (AREA)
- General Physics & Mathematics (AREA)
- Engineering & Computer Science (AREA)
- Spectroscopy & Molecular Physics (AREA)
- Immunology (AREA)
- Chemical & Material Sciences (AREA)
- Biomedical Technology (AREA)
- Molecular Biology (AREA)
- General Health & Medical Sciences (AREA)
- Analytical Chemistry (AREA)
- Biochemistry (AREA)
- Pathology (AREA)
- Urology & Nephrology (AREA)
- Hematology (AREA)
- Cell Biology (AREA)
- Medicinal Chemistry (AREA)
- Microbiology (AREA)
- Food Science & Technology (AREA)
- Biotechnology (AREA)
- Tropical Medicine & Parasitology (AREA)
- Nuclear Medicine, Radiotherapy & Molecular Imaging (AREA)
- Theoretical Computer Science (AREA)
- Multimedia (AREA)
- Optics & Photonics (AREA)
- Chemical Kinetics & Catalysis (AREA)
- Zoology (AREA)
- Virology (AREA)
- Signal Processing (AREA)
- Dispersion Chemistry (AREA)
- Investigating Or Analysing Materials By Optical Means (AREA)
- Investigating, Analyzing Materials By Fluorescence Or Luminescence (AREA)
Priority Applications (5)
| Application Number | Priority Date | Filing Date | Title |
|---|---|---|---|
| US09/157,138 US6690817B1 (en) | 1993-08-18 | 1998-09-18 | Spectral bio-imaging data for cell classification using internal reference |
| EP99946816A EP1114393A1 (fr) | 1998-09-18 | 1999-09-10 | Donnees spectrales d'imagerie biologique servant a un classement cellulaire par references internes |
| IL141902A IL141902A (en) | 1998-09-18 | 1999-09-10 | Spectral imaging to classify cells using internal reference |
| PCT/US1999/020636 WO2000017808A1 (fr) | 1998-09-18 | 1999-09-10 | Donnees spectrales d'imagerie biologique servant a un classement cellulaire par references internes |
| AU59141/99A AU5914199A (en) | 1998-09-18 | 1999-09-10 | Spectral bio-imaging data for cell classification using internal reference |
Applications Claiming Priority (5)
| Application Number | Priority Date | Filing Date | Title |
|---|---|---|---|
| US10767393A | 1993-08-18 | 1993-08-18 | |
| US08/392,019 US5539517A (en) | 1993-07-22 | 1995-02-21 | Method for simultaneously measuring the spectral intensity as a function of wavelength of all the pixels of a two dimensional scene |
| US08/571,047 US5784162A (en) | 1993-08-18 | 1995-12-12 | Spectral bio-imaging methods for biological research, medical diagnostics and therapy |
| US08/824,234 US5991028A (en) | 1991-02-22 | 1997-03-25 | Spectral bio-imaging methods for cell classification |
| US09/157,138 US6690817B1 (en) | 1993-08-18 | 1998-09-18 | Spectral bio-imaging data for cell classification using internal reference |
Related Parent Applications (1)
| Application Number | Title | Priority Date | Filing Date |
|---|---|---|---|
| US08/824,234 Continuation-In-Part US5991028A (en) | 1991-02-22 | 1997-03-25 | Spectral bio-imaging methods for cell classification |
Publications (1)
| Publication Number | Publication Date |
|---|---|
| US6690817B1 true US6690817B1 (en) | 2004-02-10 |
Family
ID=22562477
Family Applications (1)
| Application Number | Title | Priority Date | Filing Date |
|---|---|---|---|
| US09/157,138 Expired - Fee Related US6690817B1 (en) | 1993-08-18 | 1998-09-18 | Spectral bio-imaging data for cell classification using internal reference |
Country Status (5)
| Country | Link |
|---|---|
| US (1) | US6690817B1 (fr) |
| EP (1) | EP1114393A1 (fr) |
| AU (1) | AU5914199A (fr) |
| IL (1) | IL141902A (fr) |
| WO (1) | WO2000017808A1 (fr) |
Cited By (45)
| Publication number | Priority date | Publication date | Assignee | Title |
|---|---|---|---|---|
| US20020123977A1 (en) * | 1995-09-19 | 2002-09-05 | Ryan Raz | Neural network assisted multi-spectral segmentation system |
| US20030064025A1 (en) * | 2001-04-05 | 2003-04-03 | Xiaoming Yang | Imaging systems for in vivo protocols |
| US20030072496A1 (en) * | 2001-06-25 | 2003-04-17 | Science And Technology Corporation | Method of improving a digital image as a function of its dynamic range |
| US20040071341A1 (en) * | 2000-12-07 | 2004-04-15 | Walid Mahdi | Method for classifying a colour image as to whether it is an exterior or an interior shot |
| US20050046836A1 (en) * | 2003-08-27 | 2005-03-03 | Leica Microsystems Heidelberg Gmbh | Method for separating fluorescence spectra of dyes present in a sample |
| US20050149360A1 (en) * | 1999-08-09 | 2005-07-07 | Michael Galperin | Object based image retrieval |
| US20050180651A1 (en) * | 2003-01-31 | 2005-08-18 | Bernstein Lawrence S. | Methods for determining a measure of atmospheric aerosol optical properties using a multi- or hyperspectral, multi-pixel image |
| US20060039603A1 (en) * | 2004-08-19 | 2006-02-23 | Koutsky Keith A | Automated color classification for biological samples |
| US20060157652A1 (en) * | 2000-10-13 | 2006-07-20 | Chemimage Corporation | Near infrared chemical imaging microscope |
| US20070016082A1 (en) * | 2003-09-23 | 2007-01-18 | Richard Levenson | Spectral imaging |
| US20070036725A1 (en) * | 2005-08-11 | 2007-02-15 | The Board Of Trustees Of The Leland Stanford Junior University | Imaging of protease activity in live cells using activity based probes |
| US20070211930A1 (en) * | 2006-03-09 | 2007-09-13 | Terry Dolwick | Attribute based image enhancement and display for medical imaging applications |
| US20070247463A1 (en) * | 2006-04-21 | 2007-10-25 | Beckman Coulter, Inc. | Displaying cellular analysis result data using a template |
| WO2007081691A3 (fr) * | 2006-01-04 | 2008-07-03 | Chemimage Corp | Procédé et appareil pour ségrégation des spectres denses et reconstruction d'image d'un échantillon |
| US20080294032A1 (en) * | 2003-09-23 | 2008-11-27 | Cambridge Research And Instrumentation, Inc. | Spectral Imaging of Biological Samples |
| US20090082637A1 (en) * | 2007-09-21 | 2009-03-26 | Michael Galperin | Multi-modality fusion classifier with integrated non-imaging factors |
| US20090161928A1 (en) * | 2007-12-06 | 2009-06-25 | Siemens Corporate Research, Inc. | System and method for unsupervised detection and gleason grading of prostate cancer whole mounts using nir fluorscence |
| US20100155587A1 (en) * | 2008-12-23 | 2010-06-24 | Fluke Corporation | System and method for improving the quality of thermal images |
| WO2011087778A1 (fr) * | 2009-12-22 | 2011-07-21 | The Children's Hospital Of Philadelphia | Analyse volumétrique multidimensionnelle quantitative automatisée et visualisation |
| US20110206291A1 (en) * | 2010-02-04 | 2011-08-25 | University Of Southern California | Combined spectral and polarimetry imaging and diagnostics |
| US20110228072A1 (en) * | 2008-11-27 | 2011-09-22 | Koninklijke Philips Electronics N.V. | Generation of a multicolour image of an unstained biological specimen |
| US20120134571A1 (en) * | 2009-08-07 | 2012-05-31 | Nikon Corporation | Cell classification method, image processing program and image processing device using the method, and method for producing cell aggregation |
| US20120134570A1 (en) * | 2010-11-12 | 2012-05-31 | Abbott Laboratories | High throughput, optical method and system for determining the effect of a test substance on non-contiguous living cells |
| US8280140B2 (en) | 2005-01-27 | 2012-10-02 | Cambridge Research & Instrumentation, Inc. | Classifying image features |
| US8767205B2 (en) * | 2008-05-21 | 2014-07-01 | Ecotone As | Underwater hyperspectral imaging |
| US20140219538A1 (en) * | 2011-03-04 | 2014-08-07 | Lusia Halina Guthrie | Method and software for analysing microbial growth |
| US20140270457A1 (en) * | 2013-03-15 | 2014-09-18 | The Board Of Trustees Of The University Of Illinois | Stain-free histopathology by chemical imaging |
| DE102014101302B3 (de) * | 2014-02-03 | 2015-01-22 | Fraunhofer-Gesellschaft zur Förderung der angewandten Forschung e.V. | Verfahren zur Spektrometrie und Spektrometer |
| US9404868B2 (en) | 2010-09-09 | 2016-08-02 | Sharp Kabushiki Kaisha | Measuring device, measuring system, measuring method, control program, and recording medium |
| US9418414B2 (en) | 2012-05-30 | 2016-08-16 | Panasonic Intellectual Property Management Co., Ltd. | Image measurement apparatus, image measurement method and image measurement system |
| US20170178361A1 (en) * | 2015-12-18 | 2017-06-22 | Abbott Laboratories | Methods and Systems for Assessing Histological Stains |
| EP3222997A4 (fr) * | 2014-11-21 | 2017-11-29 | Sumitomo Electric Industries, Ltd. | Procédé d'évaluation de qualité et dispositif d'évaluation de qualité |
| US20180082153A1 (en) * | 2015-03-11 | 2018-03-22 | Siemens Aktiengesellschaft | Systems and methods for deconvolutional network based classification of cellular images and videos |
| US20180195955A1 (en) * | 2015-08-13 | 2018-07-12 | Halliburton Energy Services, Inc. | Calibration of optical computing devices using traceable filters |
| RU2731880C1 (ru) * | 2020-01-20 | 2020-09-08 | федеральное государственное бюджетное образовательное учреждение высшего образования "Новгородский государственный университет имени Ярослава Мудрого" | Способ формирования цифровых спектрозональных телевизионных сигналов |
| CN113168529A (zh) * | 2018-12-20 | 2021-07-23 | 索尼集团公司 | 信息处理设备、信息处理方法和程序 |
| CN113227752A (zh) * | 2018-08-23 | 2021-08-06 | Essenlix 公司 | 增强、快速、均相细胞染色和测定 |
| RU2756578C1 (ru) * | 2020-11-24 | 2021-10-04 | Федеральное государственное бюджетное образовательное учреждение высшего образования «Новгородский государственный университет имени Ярослава Мудрого» | Способ формирования цифровых спектрозональных телевизионных сигналов |
| CN113705318A (zh) * | 2021-04-22 | 2021-11-26 | 腾讯科技(深圳)有限公司 | 基于图像的识别方法、装置、设备及可读存储介质 |
| US11187651B2 (en) * | 2017-01-31 | 2021-11-30 | Labrador Diagnostics Llc | Methods and devices for improved signal detection from biological samples |
| US20220146311A1 (en) * | 2019-07-24 | 2022-05-12 | Bar-Ilan University | Device and method for spectral imaging |
| US20220375604A1 (en) * | 2021-04-18 | 2022-11-24 | Mary Hitchcock Memorial Hospital, For Itself And On Behalf Of Dartmouth-Hitchcock Clinic | System and method for automation of surgical pathology processes using artificial intelligence |
| US11513004B2 (en) | 2019-08-08 | 2022-11-29 | Apple Inc. | Terahertz spectroscopy and imaging in dynamic environments |
| US11555792B2 (en) * | 2019-08-08 | 2023-01-17 | Apple Inc. | Terahertz spectroscopy and imaging in dynamic environments with performance enhancements using ambient sensors |
| RU2859373C1 (ru) * | 2025-10-29 | 2026-03-31 | Общество С Ограниченной Ответственностью "Вингзби" | Высокоскоростная гиперспектральная камера ближнего ИК-диапазона |
Families Citing this family (14)
| Publication number | Priority date | Publication date | Assignee | Title |
|---|---|---|---|---|
| US6651008B1 (en) | 1999-05-14 | 2003-11-18 | Cytokinetics, Inc. | Database system including computer code for predictive cellular bioinformatics |
| US6743576B1 (en) | 1999-05-14 | 2004-06-01 | Cytokinetics, Inc. | Database system for predictive cellular bioinformatics |
| US7151847B2 (en) | 2001-02-20 | 2006-12-19 | Cytokinetics, Inc. | Image analysis of the golgi complex |
| US7218764B2 (en) | 2000-12-04 | 2007-05-15 | Cytokinetics, Inc. | Ploidy classification method |
| US6599694B2 (en) | 2000-12-18 | 2003-07-29 | Cytokinetics, Inc. | Method of characterizing potential therapeutics by determining cell-cell interactions |
| US6956961B2 (en) | 2001-02-20 | 2005-10-18 | Cytokinetics, Inc. | Extracting shape information contained in cell images |
| US7016787B2 (en) | 2001-02-20 | 2006-03-21 | Cytokinetics, Inc. | Characterizing biological stimuli by response curves |
| US7289285B2 (en) | 2002-10-24 | 2007-10-30 | Charles Frederick James Barnes | Information storage systems |
| EP1646926A2 (fr) | 2003-07-18 | 2006-04-19 | Cytokinetics, Inc. | Caracterisation de stimuli biologiques par courbes de reponse |
| US7235353B2 (en) | 2003-07-18 | 2007-06-26 | Cytokinetics, Inc. | Predicting hepatotoxicity using cell based assays |
| US20050014217A1 (en) | 2003-07-18 | 2005-01-20 | Cytokinetics, Inc. | Predicting hepatotoxicity using cell based assays |
| US7323318B2 (en) | 2004-07-15 | 2008-01-29 | Cytokinetics, Inc. | Assay for distinguishing live and dead cells |
| US8244021B2 (en) | 2006-12-20 | 2012-08-14 | Ventana Medical Systems, Inc. | Quantitative, multispectral image analysis of tissue specimens stained with quantum dots |
| CN110046564B (zh) * | 2019-04-02 | 2021-07-20 | 深圳市合飞科技有限公司 | 一种多光谱活体指纹识别设备及识别方法 |
Citations (10)
| Publication number | Priority date | Publication date | Assignee | Title |
|---|---|---|---|---|
| US3873974A (en) * | 1973-10-12 | 1975-03-25 | Geometric Data Corp | Scanning system for location and classification of patterns |
| US4207554A (en) * | 1972-08-04 | 1980-06-10 | Med-El Inc. | Method and apparatus for automated classification and analysis of cells |
| US4850024A (en) * | 1984-04-05 | 1989-07-18 | Hitachi, Ltd. | Method and apparatus for classifying white blood cells |
| US5016283A (en) * | 1985-11-04 | 1991-05-14 | Cell Analysis Systems, Inc. | Methods and apparatus for immunoploidy analysis |
| US5335293A (en) * | 1992-06-16 | 1994-08-02 | Key Technology, Inc. | Product inspection method and apparatus |
| US5539517A (en) * | 1993-07-22 | 1996-07-23 | Numetrix Ltd. | Method for simultaneously measuring the spectral intensity as a function of wavelength of all the pixels of a two dimensional scene |
| US5568400A (en) * | 1989-09-01 | 1996-10-22 | Stark; Edward W. | Multiplicative signal correction method and apparatus |
| US5605805A (en) * | 1993-02-09 | 1997-02-25 | Becton, Dickinson And Company | Automatic lineage assignment of acute leukemias by flow cytometry |
| US5732150A (en) | 1995-09-19 | 1998-03-24 | Ihc Health Services, Inc. | Method and system for multiple wavelength microscopy image analysis |
| US5834203A (en) * | 1997-08-25 | 1998-11-10 | Applied Spectral Imaging | Method for classification of pixels into groups according to their spectra using a plurality of wide band filters and hardwire therefore |
-
1998
- 1998-09-18 US US09/157,138 patent/US6690817B1/en not_active Expired - Fee Related
-
1999
- 1999-09-10 EP EP99946816A patent/EP1114393A1/fr not_active Withdrawn
- 1999-09-10 IL IL141902A patent/IL141902A/en not_active IP Right Cessation
- 1999-09-10 WO PCT/US1999/020636 patent/WO2000017808A1/fr not_active Ceased
- 1999-09-10 AU AU59141/99A patent/AU5914199A/en not_active Abandoned
Patent Citations (10)
| Publication number | Priority date | Publication date | Assignee | Title |
|---|---|---|---|---|
| US4207554A (en) * | 1972-08-04 | 1980-06-10 | Med-El Inc. | Method and apparatus for automated classification and analysis of cells |
| US3873974A (en) * | 1973-10-12 | 1975-03-25 | Geometric Data Corp | Scanning system for location and classification of patterns |
| US4850024A (en) * | 1984-04-05 | 1989-07-18 | Hitachi, Ltd. | Method and apparatus for classifying white blood cells |
| US5016283A (en) * | 1985-11-04 | 1991-05-14 | Cell Analysis Systems, Inc. | Methods and apparatus for immunoploidy analysis |
| US5568400A (en) * | 1989-09-01 | 1996-10-22 | Stark; Edward W. | Multiplicative signal correction method and apparatus |
| US5335293A (en) * | 1992-06-16 | 1994-08-02 | Key Technology, Inc. | Product inspection method and apparatus |
| US5605805A (en) * | 1993-02-09 | 1997-02-25 | Becton, Dickinson And Company | Automatic lineage assignment of acute leukemias by flow cytometry |
| US5539517A (en) * | 1993-07-22 | 1996-07-23 | Numetrix Ltd. | Method for simultaneously measuring the spectral intensity as a function of wavelength of all the pixels of a two dimensional scene |
| US5732150A (en) | 1995-09-19 | 1998-03-24 | Ihc Health Services, Inc. | Method and system for multiple wavelength microscopy image analysis |
| US5834203A (en) * | 1997-08-25 | 1998-11-10 | Applied Spectral Imaging | Method for classification of pixels into groups according to their spectra using a plurality of wide band filters and hardwire therefore |
Non-Patent Citations (4)
| Title |
|---|
| Cabib et al. "Spatially resolved Fourier Transform Spectroscopy (Spectral Imaging): a powerful tool for quantitative analytical microscopy," Proc. of SPIE, vol. 2678, pp. 278-291, Jan. 1996.* * |
| Garini et al. "Spectral Karyotyping." Bioimaging, vol. 4, pp. 65-72, Jan. 1996.* * |
| Malik et al. "Fourier Transform Multipixel Spectroscopy for Quantitative Cytology," Journal of Microscopy, vol. 182, pt. 2, pp. 133-140, May 1996.* * |
| Soenksen et al. "Multicolor FISH Using a Novel Spectral Bioimaging Sytem," Proceedings of SPIE, vol. 2678, pp. 303-309, Feb. 1996. * |
Cited By (82)
| Publication number | Priority date | Publication date | Assignee | Title |
|---|---|---|---|---|
| US20020123977A1 (en) * | 1995-09-19 | 2002-09-05 | Ryan Raz | Neural network assisted multi-spectral segmentation system |
| US20050149360A1 (en) * | 1999-08-09 | 2005-07-07 | Michael Galperin | Object based image retrieval |
| US7483919B2 (en) | 1999-08-09 | 2009-01-27 | Almen Laboratories | Object based image retrieval |
| US8775451B2 (en) | 1999-08-09 | 2014-07-08 | Almen Laboratories, Inc. | Object based image retrieval |
| US7268862B2 (en) * | 2000-10-13 | 2007-09-11 | Chem Image Corporation | Near infrared chemical imaging microscope |
| US20060157652A1 (en) * | 2000-10-13 | 2006-07-20 | Chemimage Corporation | Near infrared chemical imaging microscope |
| US20040071341A1 (en) * | 2000-12-07 | 2004-04-15 | Walid Mahdi | Method for classifying a colour image as to whether it is an exterior or an interior shot |
| US20030064025A1 (en) * | 2001-04-05 | 2003-04-03 | Xiaoming Yang | Imaging systems for in vivo protocols |
| US6834125B2 (en) * | 2001-06-25 | 2004-12-21 | Science And Technology Corp. | Method of improving a digital image as a function of its dynamic range |
| US20030072496A1 (en) * | 2001-06-25 | 2003-04-17 | Science And Technology Corporation | Method of improving a digital image as a function of its dynamic range |
| US20050180651A1 (en) * | 2003-01-31 | 2005-08-18 | Bernstein Lawrence S. | Methods for determining a measure of atmospheric aerosol optical properties using a multi- or hyperspectral, multi-pixel image |
| US7046859B2 (en) * | 2003-01-31 | 2006-05-16 | Bernstein Lawrence S | Methods for determining a measure of atmospheric aerosol optical properties using a multi- or hyperspectral, multi-pixel image |
| US20050046836A1 (en) * | 2003-08-27 | 2005-03-03 | Leica Microsystems Heidelberg Gmbh | Method for separating fluorescence spectra of dyes present in a sample |
| US7319520B2 (en) * | 2003-08-27 | 2008-01-15 | Leica Microsystems Cms Gmbh | Method for separating fluorescence spectra of dyes present in a sample |
| US8879812B2 (en) | 2003-09-23 | 2014-11-04 | Cambridge Research & Instrumentation, Inc. | Spectral imaging of biological samples |
| US9588099B2 (en) | 2003-09-23 | 2017-03-07 | Cambridge Research & Intrumentation, Inc. | Spectral imaging |
| US8385615B2 (en) | 2003-09-23 | 2013-02-26 | Cambridge Research & Instrumentation, Inc. | Spectral imaging of biological samples |
| US8634607B2 (en) | 2003-09-23 | 2014-01-21 | Cambridge Research & Instrumentation, Inc. | Spectral imaging of biological samples |
| US20070016082A1 (en) * | 2003-09-23 | 2007-01-18 | Richard Levenson | Spectral imaging |
| US8391961B2 (en) | 2003-09-23 | 2013-03-05 | Cambridge Research & Instrumentation, Inc. | Spectral imaging |
| US20080294032A1 (en) * | 2003-09-23 | 2008-11-27 | Cambridge Research And Instrumentation, Inc. | Spectral Imaging of Biological Samples |
| US20090245605A1 (en) * | 2003-09-23 | 2009-10-01 | Richard Levenson | Spectral imaging of biological samples |
| US20060039603A1 (en) * | 2004-08-19 | 2006-02-23 | Koutsky Keith A | Automated color classification for biological samples |
| US8280140B2 (en) | 2005-01-27 | 2012-10-02 | Cambridge Research & Instrumentation, Inc. | Classifying image features |
| US8639043B2 (en) | 2005-01-27 | 2014-01-28 | Cambridge Research & Instrumentation, Inc. | Classifying image features |
| US20070036725A1 (en) * | 2005-08-11 | 2007-02-15 | The Board Of Trustees Of The Leland Stanford Junior University | Imaging of protease activity in live cells using activity based probes |
| US8968700B2 (en) | 2005-08-11 | 2015-03-03 | The Board Of Trustees Of The Leland Stanford Junior University | Imaging of protease activity in live cells using activity based probes |
| WO2007081692A3 (fr) * | 2006-01-04 | 2008-10-02 | Chemimage Corp | Procédé et appareil pour ségrégation des spectres denses et reconstruction d'image d'un échantillon |
| WO2007081691A3 (fr) * | 2006-01-04 | 2008-07-03 | Chemimage Corp | Procédé et appareil pour ségrégation des spectres denses et reconstruction d'image d'un échantillon |
| US20070211930A1 (en) * | 2006-03-09 | 2007-09-13 | Terry Dolwick | Attribute based image enhancement and display for medical imaging applications |
| US20070247463A1 (en) * | 2006-04-21 | 2007-10-25 | Beckman Coulter, Inc. | Displaying cellular analysis result data using a template |
| WO2007124233A3 (fr) * | 2006-04-21 | 2008-07-31 | Beckman Coulter Inc | Affichage de donnees de resultats d'analyse cellulaire en utilisant un modele |
| US8217943B2 (en) | 2006-04-21 | 2012-07-10 | Beckman Coulter, Inc. | Displaying cellular analysis result data using a template |
| US20090082637A1 (en) * | 2007-09-21 | 2009-03-26 | Michael Galperin | Multi-modality fusion classifier with integrated non-imaging factors |
| US8139831B2 (en) * | 2007-12-06 | 2012-03-20 | Siemens Aktiengesellschaft | System and method for unsupervised detection and gleason grading of prostate cancer whole mounts using NIR fluorscence |
| US20090161928A1 (en) * | 2007-12-06 | 2009-06-25 | Siemens Corporate Research, Inc. | System and method for unsupervised detection and gleason grading of prostate cancer whole mounts using nir fluorscence |
| US8767205B2 (en) * | 2008-05-21 | 2014-07-01 | Ecotone As | Underwater hyperspectral imaging |
| US9041792B2 (en) * | 2008-11-27 | 2015-05-26 | Koninklijke Philips N.V. | Generation of a multicolour image of an unstained biological specimen |
| US20110228072A1 (en) * | 2008-11-27 | 2011-09-22 | Koninklijke Philips Electronics N.V. | Generation of a multicolour image of an unstained biological specimen |
| US8481918B2 (en) | 2008-12-23 | 2013-07-09 | Fluke Corporation | System and method for improving the quality of thermal images |
| US8158928B2 (en) * | 2008-12-23 | 2012-04-17 | Fluke Corporation | System and method for improving the quality of thermal images |
| US20100155587A1 (en) * | 2008-12-23 | 2010-06-24 | Fluke Corporation | System and method for improving the quality of thermal images |
| US20120134571A1 (en) * | 2009-08-07 | 2012-05-31 | Nikon Corporation | Cell classification method, image processing program and image processing device using the method, and method for producing cell aggregation |
| WO2011087778A1 (fr) * | 2009-12-22 | 2011-07-21 | The Children's Hospital Of Philadelphia | Analyse volumétrique multidimensionnelle quantitative automatisée et visualisation |
| US8649008B2 (en) | 2010-02-04 | 2014-02-11 | University Of Southern California | Combined spectral and polarimetry imaging and diagnostics |
| US20110206291A1 (en) * | 2010-02-04 | 2011-08-25 | University Of Southern California | Combined spectral and polarimetry imaging and diagnostics |
| US9404868B2 (en) | 2010-09-09 | 2016-08-02 | Sharp Kabushiki Kaisha | Measuring device, measuring system, measuring method, control program, and recording medium |
| US20120134570A1 (en) * | 2010-11-12 | 2012-05-31 | Abbott Laboratories | High throughput, optical method and system for determining the effect of a test substance on non-contiguous living cells |
| US9053352B2 (en) * | 2010-11-12 | 2015-06-09 | Abbvie Inc. | High throughput, optical method and system for determining the effect of a test substance on non-contiguous living cells |
| US20140219538A1 (en) * | 2011-03-04 | 2014-08-07 | Lusia Halina Guthrie | Method and software for analysing microbial growth |
| US9292729B2 (en) * | 2011-03-04 | 2016-03-22 | Lbt Innovations Limited | Method and software for analysing microbial growth |
| US9418414B2 (en) | 2012-05-30 | 2016-08-16 | Panasonic Intellectual Property Management Co., Ltd. | Image measurement apparatus, image measurement method and image measurement system |
| US10013760B2 (en) * | 2013-03-15 | 2018-07-03 | Board Of Trustees Of The University Of Illinois | Stain-free histopathology by chemical imaging |
| US9786050B2 (en) * | 2013-03-15 | 2017-10-10 | The Board Of Trustees Of The University Of Illinois | Stain-free histopathology by chemical imaging |
| US20140270457A1 (en) * | 2013-03-15 | 2014-09-18 | The Board Of Trustees Of The University Of Illinois | Stain-free histopathology by chemical imaging |
| DE102014101302B3 (de) * | 2014-02-03 | 2015-01-22 | Fraunhofer-Gesellschaft zur Förderung der angewandten Forschung e.V. | Verfahren zur Spektrometrie und Spektrometer |
| US9360419B2 (en) | 2014-02-03 | 2016-06-07 | HÜBNER GmbH & Co. KG | Method of spectrometry and spectrometer |
| EP3222997A4 (fr) * | 2014-11-21 | 2017-11-29 | Sumitomo Electric Industries, Ltd. | Procédé d'évaluation de qualité et dispositif d'évaluation de qualité |
| US20180082153A1 (en) * | 2015-03-11 | 2018-03-22 | Siemens Aktiengesellschaft | Systems and methods for deconvolutional network based classification of cellular images and videos |
| US10551302B2 (en) * | 2015-08-13 | 2020-02-04 | Halliburton Energy Services, Inc. | Calibration of optical computing devices using traceable filters |
| US20180195955A1 (en) * | 2015-08-13 | 2018-07-12 | Halliburton Energy Services, Inc. | Calibration of optical computing devices using traceable filters |
| CN109121437A (zh) * | 2015-12-18 | 2019-01-01 | 雅培实验室 | 用于评估组织学染色的方法和系统 |
| US10395368B2 (en) * | 2015-12-18 | 2019-08-27 | Abbott Laboratories | Methods and systems for assessing histological stains |
| US11158049B2 (en) | 2015-12-18 | 2021-10-26 | Abbott Laboratories | Methods and systems for assessing histological stains |
| US20170178361A1 (en) * | 2015-12-18 | 2017-06-22 | Abbott Laboratories | Methods and Systems for Assessing Histological Stains |
| US11187651B2 (en) * | 2017-01-31 | 2021-11-30 | Labrador Diagnostics Llc | Methods and devices for improved signal detection from biological samples |
| CN113227752A (zh) * | 2018-08-23 | 2021-08-06 | Essenlix 公司 | 增强、快速、均相细胞染色和测定 |
| CN113168529A (zh) * | 2018-12-20 | 2021-07-23 | 索尼集团公司 | 信息处理设备、信息处理方法和程序 |
| CN113168529B (zh) * | 2018-12-20 | 2024-04-09 | 索尼集团公司 | 信息处理设备、信息处理方法和程序 |
| US20220146311A1 (en) * | 2019-07-24 | 2022-05-12 | Bar-Ilan University | Device and method for spectral imaging |
| US12287240B2 (en) * | 2019-07-24 | 2025-04-29 | Bar-Han University | Device and method for spectral imaging |
| US11555792B2 (en) * | 2019-08-08 | 2023-01-17 | Apple Inc. | Terahertz spectroscopy and imaging in dynamic environments with performance enhancements using ambient sensors |
| US11513004B2 (en) | 2019-08-08 | 2022-11-29 | Apple Inc. | Terahertz spectroscopy and imaging in dynamic environments |
| RU2731880C1 (ru) * | 2020-01-20 | 2020-09-08 | федеральное государственное бюджетное образовательное учреждение высшего образования "Новгородский государственный университет имени Ярослава Мудрого" | Способ формирования цифровых спектрозональных телевизионных сигналов |
| RU2756578C1 (ru) * | 2020-11-24 | 2021-10-04 | Федеральное государственное бюджетное образовательное учреждение высшего образования «Новгородский государственный университет имени Ярослава Мудрого» | Способ формирования цифровых спектрозональных телевизионных сигналов |
| US20220375604A1 (en) * | 2021-04-18 | 2022-11-24 | Mary Hitchcock Memorial Hospital, For Itself And On Behalf Of Dartmouth-Hitchcock Clinic | System and method for automation of surgical pathology processes using artificial intelligence |
| US12014830B2 (en) * | 2021-04-18 | 2024-06-18 | Mary Hitchcock Memorial Hospital, For Itself And On Behalf Of Dartmouth-Hitchcock Clinic | System and method for automation of surgical pathology processes using artificial intelligence |
| US20240420845A1 (en) * | 2021-04-18 | 2024-12-19 | Mary Hitchcock Memorial Hospital, For Itself And On Behalf Of Dartmouth-Hitchcock Clinic | System and method for automation of surgical pathology processes using artificial intelligence |
| US12315636B2 (en) * | 2021-04-18 | 2025-05-27 | Mary Hitchcock Memorial Hospital | System and method for automation of surgical pathology processes using artificial intelligence |
| CN113705318A (zh) * | 2021-04-22 | 2021-11-26 | 腾讯科技(深圳)有限公司 | 基于图像的识别方法、装置、设备及可读存储介质 |
| CN113705318B (zh) * | 2021-04-22 | 2023-04-18 | 腾讯医疗健康(深圳)有限公司 | 基于图像的识别方法、装置、设备及可读存储介质 |
| RU2859373C1 (ru) * | 2025-10-29 | 2026-03-31 | Общество С Ограниченной Ответственностью "Вингзби" | Высокоскоростная гиперспектральная камера ближнего ИК-диапазона |
Also Published As
| Publication number | Publication date |
|---|---|
| IL141902A (en) | 2007-02-11 |
| IL141902A0 (en) | 2002-03-10 |
| AU5914199A (en) | 2000-04-10 |
| WO2000017808A1 (fr) | 2000-03-30 |
| EP1114393A1 (fr) | 2001-07-11 |
Similar Documents
| Publication | Publication Date | Title |
|---|---|---|
| US5991028A (en) | Spectral bio-imaging methods for cell classification | |
| EP1114393A1 (fr) | Donnees spectrales d'imagerie biologique servant a un classement cellulaire par references internes | |
| US5995645A (en) | Method of cancer cell detection | |
| EP0832417B1 (fr) | Procede de detection simultanee de multiples fluorophores en vue de l'hybridation in situ et de la coloration de chromosomes | |
| WO1998043042A9 (fr) | Procedes de bio-imagerie spectrale pour la classification de cellules | |
| Pelagotti et al. | Multispectral imaging of paintings | |
| Malik et al. | Fourier transform multipixel spectroscopy for quantitative cytology | |
| DE69809161T2 (de) | Verfahren und Vorrichtung zum Klassifizieren von Bildpunkten in Gruppen nach deren Spektren mittels einer Mehrzahl von Breitband-Filtern | |
| JP3280035B2 (ja) | 生物学研究、医療診断および治療用の分光生物撮像法、蛍光交配方法および細胞分類方法 | |
| US20120083678A1 (en) | System and method for raman chemical analysis of lung cancer with digital staining | |
| US20080273199A1 (en) | Spectroscopic system and method for predicting outcome of disease | |
| US20070153268A1 (en) | System and method for classifying cells and the pharmaceutical treatment of such cells using Raman spectroscopy | |
| US8280141B2 (en) | Quantitative, multispectral image analysis of tissue specimens stained with quantum dots | |
| EP0935679B1 (fr) | Procede de classification des chromosomes par analyse statistique de decorrelation et materiel associe | |
| Li et al. | AOTF based molecular hyperspectral imaging system and its applications on nerve morphometry | |
| Cabib et al. | Spatially resolved Fourier transform spectroscopy (spectral imaging): a powerful tool for quantitative analytical microscopy | |
| Levenson et al. | Spectral imaging in biomedicine: A selective overview | |
| DE29624210U1 (de) | Vorrichtung zum gleichzeitigen Nachweis von multiplen Fluorophoren bei in situ Hybridisierung und Chromosomenanfärbung | |
| CA2279945A1 (fr) | Spectroscopie infrarouge pour l'imagerie medicale | |
| Shah et al. | Photometric calibration for automated multispectral imaging of biological samples | |
| Perri et al. | A Fourier-transform hyperspectral camera based on a common-path interferometer working from 400 to 2200 nm | |
| Thigpen et al. | Photometric calibration for quantitative spectral microscopy under transmitted illumination | |
| Vo-Dinh | Biological Imaging Spectroscopy | |
| Lerner et al. | Spectral topography of histopathological samples | |
| Arnold et al. | Snapshot spectral imaging system |
Legal Events
| Date | Code | Title | Description |
|---|---|---|---|
| AS | Assignment |
Owner name: APPLIED SPECTRAL IMAGING LTD, ISRAEL Free format text: ASSIGNMENT OF ASSIGNORS INTEREST;ASSIGNORS:CABIB, DARIO;BUCKWALD, ROBERT A.;BEN-YOSEF, NISSIM;REEL/FRAME:009474/0881 Effective date: 19980914 |
|
| FPAY | Fee payment |
Year of fee payment: 4 |
|
| FEPP | Fee payment procedure |
Free format text: PAYOR NUMBER ASSIGNED (ORIGINAL EVENT CODE: ASPN); ENTITY STATUS OF PATENT OWNER: SMALL ENTITY |
|
| FPAY | Fee payment |
Year of fee payment: 8 |
|
| REMI | Maintenance fee reminder mailed | ||
| LAPS | Lapse for failure to pay maintenance fees | ||
| STCH | Information on status: patent discontinuation |
Free format text: PATENT EXPIRED DUE TO NONPAYMENT OF MAINTENANCE FEES UNDER 37 CFR 1.362 |
|
| FP | Lapsed due to failure to pay maintenance fee |
Effective date: 20160210 |