US6865567B1 - Method of generating attribute cardinality maps - Google Patents
Method of generating attribute cardinality maps Download PDFInfo
- Publication number
- US6865567B1 US6865567B1 US09/487,328 US48732800A US6865567B1 US 6865567 B1 US6865567 B1 US 6865567B1 US 48732800 A US48732800 A US 48732800A US 6865567 B1 US6865567 B1 US 6865567B1
- Authority
- US
- United States
- Prior art keywords
- range
- elements
- bin
- value
- mean
- Prior art date
- Legal status (The legal status is an assumption and is not a legal conclusion. Google has not performed a legal analysis and makes no representation as to the accuracy of the status listed.)
- Expired - Lifetime
Links
Images






Classifications
-
- G—PHYSICS
- G06—COMPUTING OR CALCULATING; COUNTING
- G06F—ELECTRIC DIGITAL DATA PROCESSING
- G06F16/00—Information retrieval; Database structures therefor; File system structures therefor
- G06F16/20—Information retrieval; Database structures therefor; File system structures therefor of structured data, e.g. relational data
- G06F16/24—Querying
- G06F16/245—Query processing
- G06F16/2458—Special types of queries, e.g. statistical queries, fuzzy queries or distributed queries
- G06F16/2462—Approximate or statistical queries
-
- G—PHYSICS
- G06—COMPUTING OR CALCULATING; COUNTING
- G06F—ELECTRIC DIGITAL DATA PROCESSING
- G06F16/00—Information retrieval; Database structures therefor; File system structures therefor
- G06F16/20—Information retrieval; Database structures therefor; File system structures therefor of structured data, e.g. relational data
- G06F16/24—Querying
- G06F16/245—Query processing
- G06F16/2453—Query optimisation
- G06F16/24534—Query rewriting; Transformation
- G06F16/24542—Plan optimisation
-
- G—PHYSICS
- G06—COMPUTING OR CALCULATING; COUNTING
- G06F—ELECTRIC DIGITAL DATA PROCESSING
- G06F16/00—Information retrieval; Database structures therefor; File system structures therefor
- G06F16/20—Information retrieval; Database structures therefor; File system structures therefor of structured data, e.g. relational data
- G06F16/24—Querying
- G06F16/245—Query processing
- G06F16/2453—Query optimisation
- G06F16/24534—Query rewriting; Transformation
- G06F16/24542—Plan optimisation
- G06F16/24545—Selectivity estimation or determination
-
- Y—GENERAL TAGGING OF NEW TECHNOLOGICAL DEVELOPMENTS; GENERAL TAGGING OF CROSS-SECTIONAL TECHNOLOGIES SPANNING OVER SEVERAL SECTIONS OF THE IPC; TECHNICAL SUBJECTS COVERED BY FORMER USPC CROSS-REFERENCE ART COLLECTIONS [XRACs] AND DIGESTS
- Y10—TECHNICAL SUBJECTS COVERED BY FORMER USPC
- Y10S—TECHNICAL SUBJECTS COVERED BY FORMER USPC CROSS-REFERENCE ART COLLECTIONS [XRACs] AND DIGESTS
- Y10S707/00—Data processing: database and file management or data structures
- Y10S707/99931—Database or file accessing
- Y10S707/99932—Access augmentation or optimizing
Definitions
- the present invention relates generally to estimation involving generalized histogram structures and more particularly to a method of result size estimation in query optimization.
- the computer system used for this purpose are known as database systems and the software that manages them are known as database management systems (DBMS).
- DBMS database management systems
- the DBMS facilitates the efficient management of data by (i) allowing multiple users concurrent access to a single database, (ii) restricting access to data to authorized users only, and (iii) providing recovery from system failures without loss of data integrity.
- the DBMS usually provides an easy to use high-level query/data manipulation language such as the Structured Query Language (SQL) as the primary interface to access the underlying data.
- SQL Structured Query Language
- SQL the most commonly used language in modern-day DBMSs, is a declarative language. Thus, it shields users from the often complex procedural details of accessing and manipulating data. Statements or commands expressed in SQL are generally issued by the user directly, using a command-line interface.
- the advantage of the declarative SQL is that the statements only need to specify what answer is expected, and not how it should be computed.
- the actual sequence by which an SQL command is computed is known as the procedural Query Evaluation Plan (QEP).
- the procedural QEP for a given non-procedural SQL statement is generated by the DBMS and executed to produce the query result. Typically, for a given query, there are many alternative procedural QEPs that all compute the result required.
- Each QEP however, has its own cost in terms of resource use and response time.
- the cost is usually expressed in terms of the I/O operations such as the number of disk reads and writes, and the amount of CPU work to execute a given QEP.
- the problem of devising the best procedural QEP for a query so as to minimize the cost is termed query optimization.
- the DBMS's Query Optimizer module determines the best possible procedural QEP to answer it.
- the query optimizer uses a model of the underlying system to select from a large set of candidate plans an efficient plan as quickly as possible. Efficiency of the QEP is measured in terms of resource utilization and response time.
- the cost incurred in evaluating a QEP is proportional to the number of operations, including disk reads, writes and CPU work required to compute the final answer from the base relations.
- the size of the final result of a query as well as the sizes of the base relations will be the same regardless of which QEP, from among many possible candidate QEPs, is chosen by the query optimizer.
- the cost of a QEP depends on the size of the intermediate relations generated during the computation of the query, as this is the single most important factor responsible for the difference in the costs of various QEPs of the given query.
- Query optimization for relational database systems is a combinatorial optimization problem, which makes exhaustive search unacceptable as the number of relations in the query increases.
- the query optimization process is generally divided into three distinct phases, namely query decomposition, query optimization and query execution as shown in FIG. 1 .
- the declarative SQL query is first scanned, parsed and validated.
- the scanner sub-module identifies the language components in the text of the query, while the sparser sub-module checks the query syntax.
- the validator checks that all attribute and relation names are valid and semantically meaningful.
- the query is then translated into an internal format expressed in relational algebra in the form of a query Operator Tree.
- the query optimizer module uses this operator tree as its input, the query optimizer module searches for a procedural plan with an optimal ordering of the algebraic operators. This optimal procedural plan is represented by an annotated query tree.
- Such trees encode procedural choices such as the order in which operators are evaluated and the method for computing each operator.
- Each tree node represents one or several relational operators.
- Annotations on the node represent the details of how it is to be executed.
- a join node may be annotated as being executed by a hash-join, and a base relation may be annotated as being accessed by an index-scan.
- the choices of the execution algorithms are based on the database and system characteristics, for example, the size of the relations, available memory, type of indexes on a given attribute etc.
- This fully annotated operator tree with the optimal QEP is then passed on to the query execution engine where all the low level database operations are carried out and the answer to the query is computed.
- An example annotated query tree is shown in FIG. 2 .
- FIG. 3 shows an example relational database from a Property Tax Assessor's office.
- This database consists of three relations, namely,
- a realistic cost model should include many other factors such as various join algorithms, availability of indexes and other auxiliary access methods, effects of caching and available memory, data skew etc.
- the relations TaxPayer and City are joined to determine the city information for each person where he or she lives. This join generate an intermediate relation. This intermediate relation is then joined with the relation Property to compute the final results.
- the first join requires the relations TaxPayer and City to be read. This results in 12 ⁇ 10 6 +4000 reads. Assuming the result of this join is written back to the disk, it would require 12 ⁇ 10 6 writes. Note that the size of the intermediate result is 12 ⁇ 10 6 .
- the first join requires 12 ⁇ 10 6 +3 ⁇ 10 6 reads and 3 ⁇ 10 6 writes.
- the second join requires another 3 ⁇ 10 6 +4000 reads and 3 ⁇ 10 6 writes.
- this short example with two different QEPs illustrates that the cost of one plan is sometimes half of the other.
- Most of the real-world queries are complex queries with many relations, and with a more sophisticated realistic cost model, one can generate QEPs with substantially different costs.
- the task of a query optimizer is to judiciously analyze the possible QEPs and choose the one with the minimal cost.
- a query optimizer The main goals of a query optimizer are that of minimizing both the response time and resource consumption. These optimization goals are often conflicting. For example, a QEP which computes the result of a query quickly but requires all available memory and CPU resources is probably not desirable because it would virtually deprive other users from accessing the database.
- T o be the time taken to find an optimal QEP and let T c be the time taken to execute the optimal QEP and obtain the results. If the average time taken to execute a random QEP is T avg , then ideally T o +T c ⁇ T avg .
- execution space E is the space of QEPs considered by the optimizer.
- Finding an optimal QEP is a computationally intractable problem, especially when the query involves more than, say, ten relations.
- One obvious approach is to decrease the size of the execution space E, but although it would reduce the time and/or space requirement, it has the tradeoff of reducing the chances of finding good plans.
- Another approach consists of estimating the costs of QEPs using the standard statistical information available in the database catalog. In fact, most commercial DBMSs use some form of statistics on the underlying data information about the available resources in order to estimate the cost of a query plan approximately. Since these
- Query optimizers make use of the statistical information stored in the DBMS catalogue to estimate the cost of a QEP.
- Table 1 lists some of the commonly used statistical information utilized in most of the current commercial DBMSs.
- DBMSs In addition to these pieces of information, most DBMSs also maintain information about the indices 2 in their catalogues. These pieces of information include values such as the average fan-out, number of levels in an index etc.
- Disk Access Costs This is the cost of searching for, reading, and writing data blocks that reside on secondary storage, mainly on disk.
- the cost of searching for records in a file depends on the type of access structures on that file, such as its ordering, hashing, and primary or secondary indexes. In addition, factors such as whether the file blocks are allocated contiguously on the same disk cylinder or scattered on the disk affect the access cost.
- the design of a good query optimizer involves developing techniques to efficiently and accurately estimate the various query result sizes.
- the objective of this invention is to provide new techniques that would provide more accurate query result size estimation results than the state-of-the-art methods used in the current database systems.
- There are other topics of concern in query optimization such as implementation algorithms for various relational operations, physical access plans for retrieving records etc., but they are not addressed herein.
- the first step of this procedure involves logical transformation of the query, and thus it is, generally, independent of the underlying data. Hence this step is often handled at compile time. But in order to properly carry out steps (2) and (3), and to generate optimal query evaluation plan, sufficient knowledge about the underlying data distribution is required.
- steps (2) and (3) require some prior knowledge about the underlying data poses a number of difficulties.
- steps (2) and (3) can be carried out only at run time. Consequently some gain in the overall execution efficiency is sacrificed in order to minimize the optimization cost.
- Another difficulty is that the DBMS should maintain a catalogue or a meta-database about the pertinent statistical information about the underlying data distributions. It is obvious that in order to benefit from such as optimization strategy one must compare the costs of gathering and maintaining such information in the DBMS catalogue against the cost savings in the overall optimization process.
- a transformation or equivalence rules says that expressions of two forms are equivalent. This implies that one expression can be transformed to the other while preserving equivalence. When two relations have the same attributes ordered in a different manner, and equal number of tuples, the two expressions that generate them are considered to be preserve equivalent. Modern-day query optimizers heavily use equivalence rules to transform initial expressions into simpler logically equivalent expressions.
- the selection operation distributes with the union, intersection, and set difference operations.
- ⁇ P ( E 1 ⁇ E 2 ) ⁇ P ( E 1 ) ⁇ P ( E 2 ).
- Hashing technique has many variants and its major advantage is that it provides fast direct access to records without requiring that the attribute values are maintained in a sorted order.
- indexes are often combined with multi-list structures.
- the idea of an index is based on a binary relationship between records being accessed. Specifically the index method uses tuple identifiers or keys to establish a binary relationship between records, so that traversal becomes much faster than a sequential search.
- the indexing method is either one-dimensional or multi-dimensional
- a one-dimensional index implements record access based on a single relation attribute, whereas a multidimensional index implements record access based on a combination of attributes.
- Two popular approaches for implementing one-dimensional indexes are ISAM [Corporation, 1966] and B-tree [Bayer and McCreight, 1972] structures. A detailed discussion on multidimensional index structures is found in the work of Bentley and Friedman [Bentley and Friedman, 1979].
- the logical transformation rules are often applied at run time to a query expression to minimize the number of tests applied to an accessed record or attribute value of a relation. Changing the order in which individual expression components are evaluated sometimes results in performance increases. A number of techniques utilizing a priori probabilities of attribute values, to obtain optimal evaluation sequences for specific cases are discussed in [Hanani, 1977].
- Two-Variable Expressions Query expression that describe conditions for the combination of records from two relations are known as two-variable expressions. Usually two-variable expressions are formed by monadic sub-expressions and dyadic sub-expressions. Monadic expressions restrict single variables independently of each other, whereas dyadic expressions provide the relationship between both variables. In what follows the basic strategies for the evaluation of a single dyadic expression, and methods of the evaluation of any two-variable expressions are discussed.
- the nested iteration method is a simple approach that is independent of the order of record access. In this method, every pair of records from the relation is accessed and concatenated if the join predicate is satisfied.
- a nested iteration based join list is Method 1.
- N 1 and N 2 be the number of records of the relations read in the outer and inner loops respectively. It is clear that N 1 +N 1 *N 2 disk accesses are required to evaluate the dyadic term, assuming that each record access requires one disk access.
- the nested iteration method is improved by using an index on the join attribute(s) of the relation R 2 .
- This strategy does not require accessing R 2 sequentially for each record of R 1 as the matching R 2 records are accessed directly [Griffeth, 1978, Klug, 1982].
- N 1 +N 1 *N 2 *j 12 record accesses are needed, where j 12 is a join selectivity factor representing the Cartesian product of R 1 and R 2 .
- a main memory buffer is used to hold one or more pages of both relations, where each page contains a set of records.
- the nested block algorithm is essentially similar to the nested iteration method. The only difference is that memory pages are red instead of single records of the relation.
- P 1 and P 2 are the number of pages required to store the outer and inner relations of the algorithm respectively and B 1 is the number of pages of the outer relation occupying the main memory buffer. It is easy to observe that it is always more efficient to read the smaller relation in the outer loop (i.e., make P 1 ⁇ P 2 ). If the smaller relation is maintained entirely in the main memory buffer, then only P 1 +P 2 disk accesses are needed to form the join.
- the strategies developed to evaluate one-variable expressions and computation of dyadic terms are also used to evaluate any arbitrary two-variable expressions. These strategies mainly differ in the manner they implement the access paths and methods, namely indexing mechanisms and the order in which the component expressions are evaluated.
- a query optimizer designed to process any arbitrary query should incorporate strategies for evaluating multi-variable expressions.
- parallel processing of query components evaluates an expression by avoiding repeated access to the same data. This is usually achieved by simultaneous or parallel evaluation of multiple-query components. Usually all monadic terms associated with a given variable are evaluated first and all dyadic terms in which the same variable participates are partially evaluated parallely [Palermo, 1972]. This also includes parallel evaluation of logical connectors such as AND existing among the various terms, that always minimizes the size of intermediate query results [Jarke and Schmidt, 1982]. A strategy where aggregate functions and complex sub-queries are computed concurrently, has been proposed by Klug [Klug, 1982]. Parallel processing of query components requires appropriate scheduling strategies for the overall efficient optimization. A few interesting techniques for parallel scheduling for query processing have been proposed by Schmidt [Schmidt, 1979].
- the access plan selection strategies use the transformed and simplified query, the storage structures and access paths, and a simple mathematical cost model to generate an optimal access plan. This is usually achieved by the following procedure:
- the sequence of operations or intermediate results leading from the existing data structures to a query result is known as an access plan for a query.
- An ideal query optimizer generates an optimal access plan with a minimal optimization effort.
- the query optimizer chooses a physical access plan for a given query either on the basis of a set of heuristic rules or on the basis of a mathematical cost model involving the underlying data structures and access methods.
- Merrett discussed a top-down approach for cost analysis based on the storage structures [Merrett, T. H., 1977]. Though the techniques presented in [Merrett, T. H., 1977] have been significantly improved on since 1977, it is worth mentioning that Merrett's ideas were seminal and initiated the work in the area of cost analysis in relational database systems.
- Merrett provides general principles that allow a database analyst either to quickly estimate the costs of a wide variety of alternatives, or to analyze fewer possibilities in depth. He also provides a number of techniques that can be used at any level of the iterative design process.
- the number of secondary storage accesses or I/O operations is considered to be the most important one in designing a cost model for analyzing any physical access plan.
- the number of secondary storage accesses is mainly dependent on the size of the operands used in the query, the type of access structures used, and the size of the temporary buffers available in the main memory.
- the sizes of most of the operands are known, at least approximately.
- available index methods for the attribute values involves are also known.
- most intermediate relations are the results of preceding operations, and consequently, the cost model estimates their size by using information about the original data structures and any other information available from the DBMS catalogue, such as the selectivity of the operations already performed on them.
- the cost model estimates their size by using information about the original data structures and any other information available from the DBMS catalogue, such as the selectivity of the operations already performed on them.
- Cost models based on such techniques relate the database state as run time as the result of a random process.
- This random process is assumed to generate relations from the Cartesian product of the attribute value domains, based on some probability distribution and by invoking certain other general principles such as the functional dependencies of the underlying database schema [Glenbe and Grady, 1982, Richard, 1981]. These assumptions enable one to derive parameters in order to compute the size of any intermediate result of more complex relational operations.
- Cost estimates can be used in the access plan selection process in two different ways.
- the first approach estimates the costs of each alternative access plan completely.
- the major advantage of this approach is that it is possible to make use of techniques like parallelism or feedback in such situations. But, obviously the overall optimization effort is high.
- a more popular method is the dynamic-programming query optimization strategy, This is actually an extension to the second method, in which, at each level, only the next operation to be performed is determined based on the optimal sub-plans.
- this method has actual information about all its operands, including intermediate result sizes that are used to update the estimates of the remaining steps.
- This dynamic approach has two obvious drawbacks. Firstly, it has a potential of getting stuck in local optima if no adequate look ahead is planned. Furthermore, in the more general setting, the method leads to prohibitively high optimization cost.
- Query graph is a commonly used pictorial representation of a relational query.
- nodes denote the relation names, and edges represent the respective predicates.
- p references the attributes of two relations, say R i and R j , then an edge labeled p is said to exist between the nodes of these two relations.
- join trees are used to evaluate queries.
- a join tree is defined as an operator tree whose inner nodes are labeled by the relational join operators and whose leaves are labeled by base relations. The computation of the result of a join tree is always carried out in a computed bottom-up fashion.
- the nodes of the join trees are usually annotated to reflect the type of join-algorithm used. These generally include algorithms such nested loops, hash, sort merge and so on. It should be noted that some of the binary trees on the relations of the query are not actually join trees since they may involve the use of Cartesian products.
- the query graphs and join trees are two different forms of representing a given query.
- a query graph merely represents a collection of relations and their corresponding predicate expressions. It does not specify any evaluation order for the expressions involved.
- a join tree specifies clearly the inputs to each relational operator, and the order in which how they should be evaluated.
- FIG. 6 shows a query graph, and two possible operator trees that solve the query.
- Join trees are classified into two major categories, namely linear join trees and bushy join trees. For every join operator in a join tree, if at least one of the two input relations is a base relation, then the join tree is called linear, otherwise it is called bushy. Using this classification, bushy search space is defined as a set of join trees when there is no restriction on the topology of the trees. Similarly a linear search space is defined as a set of join trees where the topology of the trees is restricted to only linear join trees. The linear search space is actually a subset of the bushy search space. Since join trees do not distinguish between right and left subtrees, they are unordered. Since each of the n ⁇ 1 internal nodes of an unordered tree of n leaves can have two choices, a total of 2 n ⁇ 1 ordered trees can be generated from such an unordered tree.
- FIG. 8 depicts a clique on four nodes.
- Optimal join tree selection is a search problem which depends on the three factors, namely the join tree search space, the coat model and the search strategy or search algorithm.
- the join tree search space contains all valid join trees, both bushy and linear.
- the cost model is usually a simple mathematical model that annotates a cost to each operator in the tree.
- the search algorithm is the actual procedure that finds the optimal join tree in the search space using the cost model.
- Most of the modern-day query optimizers use three different search strategies, namely (a) exhaustive search (b) probabilistic techniques (c) non-exhaustive deterministic algorithms.
- Exhaustive search is sometimes efficient when the join tree search spaces are not too large. For most of the relational queries this should be less than ten relations.
- Dynamic Programming Early database systems such as System R described in [Salinger et al., 1979] and Starburst described in [Hasan and Pirahesh, 1988, Ono and Lohman,1990] used dynamic programming to find optimal join trees or query evaluation plans. This strategy is very simple and easy to comprehend.
- the dynamic programming algorithm first considers the individual base relations in a bottom-up fashion and adds new relations until all pairs of relations are joined to generate the final result. A table for storing the intermediate result sizes is maintained so that the sequence of the next join operation can be determined based on the cheapest alternative currently known.
- Transformation-based The Volcano query optimizer and the Cascades described in [Graefe, 1995] query optimizer use the transformation based exhaustive search approach. This strategy works by applying various transformation rules to the initial query tree recursively until no new join trees are generated. These optimizers use an efficient storage structure for storing the information about the partially explored search space, in order to avoid generating the same query trees.
- One approach is to use probabilistic algorithms to eliminate the less promising portions of the search space. These algorithms improve the search performance by avoiding the worst join trees during the search process, instead of looking for the best join tree.
- All of the above probabilistic algorithms look for an optimal join tree in the following manner.
- an arbitrary join tree is generated by the algorithm to represent the given query.
- new join trees are generated.
- the algorithm computes an estimated cost.
- the new join tree is retained as the current solution, if the cost is found to be below a specified value.
- the transformation rules are applied again on the current solution to generate new join trees in a recursive manner. This recursive process is carried out until a stopping condition, such as a time limit or level of cost improvement, is met.
- the algorithm TSA finds the optimal join tree by performing simulated annealing repeatedly. Each time the algorithm picks a new query tree as its starting point.
- the 2PO algorithm combines the features of the II algorithm and the SA algorithm. It first performs II for a given period of time, then using the output from the II phase as its starting query tree, it performs SA until the final globally optimal query tree is obtained.
- Query optimization is an NP-hard problem due to the exponential growth of the number of alternative QEPs with the number of relations in the query. Due to this reason, most database systems are forced to make a number assumptions in order to quickly select an optimal QEP.
- Christodoulakis investigated the relationships of a number of frequently used assumptions and the accuracy of the query optimizer [Christodoulakis, 1983a, Montgomery et al., 1983]. In specific, he considered the following issues in his study:
- the local and distributed cost models based on the uniformity assumption that is used for single table sorting and two table joins in R* were experimentally verified and validated in [Mackert and Lohman, 1986a, Mackert and Lohman, 1986b]. They also further reported that the CPU costs are usually a significant portion of the overall, cost for sort operations. In addition, they also found that size estimation is a significant issue in the overall cost, including I/ 0 and CPU costs.
- Considering the nested loop join method they reported that most query optimizers based on uniformity assumption overstate the evaluation cost, when an access structure is used to retrieve the attribute values and when the inner table fits in main memory. This indicates that the cost of evaluating the nested loop join is usually sensitive to parameters such as join cardinality, the outer table's cardinality, and the memory used to maintain the inner table.
- the probabilistic counting techniques are useful for estimating the number of distinct attribute values in the result of projecting a relation over a given subset of attributes.
- Flajolet and Martin [Flajolet and Martin, 1985] proposed a technique for estimating the number of distinct values in a multi-set, which generates an estimate during a single pass through the data. This technique was extended by Shukla et al for estimating the size of multidimensional projections such as the cube operator [Shukla et al., 1996]. Their experiments have shown that these techniques based on multidimensional projections usually result in more accurate estimates than sampling based techniques. The applicability of these techniques to other operators has not yet been resolved.
- Sampling based techniques are mainly used to compute result estimates during query optimization time. They compute their estimates by collecting and processing random samples of the data. The major advantage of these techniques is that since they do not rely on any precomputed information about the data, they are not usually affected by database changes. Another advantage is that they do not require any storage overhead. These techniques also provide a probabilistic guarantee on the accuracy of the estimates. The major disadvantages of these techniques include the disk I/Os, CPU overhead during query optimization and the extra overhead for recomputing the same information since they are not preserved across queries. The sampling based techniques are highly desirable whenever a parameter needs to be estimated once with high accuracy in a dynamic environment. One good example is in the context of a query profiler. A number of different methods on the sampling based techniques have been extensively discussed in the Prior Art literature.
- sampling based size estimation techniques use two distinct models, namely, point space model [Hou et al., 1991] and urn model [Lipton et al., 1990] for result size estimation. These size estimation techniques can be classified into random sampling and systematic sampling.
- the idea behind the random sampling technique is that the tuples are chosen randomly from their set so that every tuple has an equal probability of being chosen.
- the random sampling techniques are either random sampling with replacement or random sampling without replacement. In random sampling with replacement, a tuple that is drawn randomly is put back into the data set and available for subsequent selections. But, in random sampling without replacement, any selected tuple is not returned to the original data set.
- sampling is divided into two phases.
- x number of tuples are sampled. These samples are used to obtain the estimated mean and variance and to compute the number of samples y to be obtained in the second phase.
- the number of samples y is computed based on the desired level estimation accuracy, confidence level, and the estimated mean and variance obtained in the first phase. If y>x, then an additional y ⁇ x samples are obtained during the second phase of sampling. Otherwise, the number of samples, x, obtained in the first phase is sufficient to provide the desired level of estimation accuracy and confidence level.
- Sequential sampling is a random sampling technique for estimating the sizes of query results [Hass and Swami, 1992]. This is a sequential process in which the sampling is topped after a random number of steps based on a stopping criterion.
- the stopping criterion is usually determined based on the observations obtained from the random samples so far. For a sufficient number of samples, the estimation accuracy is predicted to lie within a certain bound.
- the method is asymptotically efficient and does not require any ad hoc pilot sampling or any assumptions about the underlying data distributions.
- Parametric techniques use a mathematical distribution to approximate the actual data distribution
- a few popular examples include the uniform distribution, multi-variate normal distribution or Zipf distributions.
- the parameters used to construct the mathematical distribution are usually obtained from the actual data distributions, and consequently the accuracy of this parametric approximation mainly depends on the similarity between the actual and parameterized distributions.
- Two major advantages of the parametric technique are (a) their relatively small overhead and (2) small run-time costs. But their downside is that the real-world data hardly conform to any simple mathematical formula. Consequently parametric approximations often result in estimation errors.
- Another disadvantage of this method is that since the parameters for the mathematical distribution are always precomputed, this technique results in further errors whenever there is a change in the actual data distribution.
- the uniform distribution is the simplest and applies to all types of variables, from categorical to numerical and from discrete to continuous. For categorical or discrete variables, the uniform distribution provides equal probability for all distinct categories or values. In the absence of any knowledge of the probability distribution of a variable, the uniform distribution is a conservative, minimax assumption. Early query optimizers such as System R relied on the uniformity and independence assumptions. This was primarily due to the small computational overhead and the ease of obtaining the parameters such as maximum and minimum values.
- Christodoulakis [Christodoulakis, 1983b] demonstrated that many attributes have unimodal distributions that can be approximated by a family of distributions. He proposed a model based on a family of probability density functions, which includes the Pearson types 2 and 7, and the normal distributions. The parameters of the models such as mean, standard variation, and other moments are estimated in one pass and dynamically updated. Christodoulakis demonstrated the superiority of this model over the uniform distribution approach using a set of queries against a population of Canadian engineers.
- Faloutsos [Faloutsos et al., 1996] showed that using multi-fractal distribution and 80-20 law, one better approximates real-world data than with the uniform and Zipf distributions. His method also provides estimates for supersets of a relation, which the uniformity assumption based schemes cannot provide.
- Multidimensional attributes are very common in geographical, image and design databases. A typical query with a multidimensional attribute is to find all the objects that overlap a given grid area. By building histograms on multiple attributes together, their techniques were able to capture dependencies between those attributes. They proposed an algorithm to construct equal-height histograms for multidimensional attributes, a storage structure, and two estimation techniques. Their estimation methods are simpler than the single-dimension version because they assume that multidimensional attributes will not have duplicates.
- variable-width histograms for estimating the result size of selection queries, where the buckets are chosen based on various criteria [Kamel and King, 1985, Kooi, 1980, Muthuswamy and Kerschberg, 1985].
- a detailed description of the use of histograms inside a query optimizer can be found in Kooi's thesis [Kooi, 1980]. It also deals with the concept of variable-width histograms for query optimization.
- the survey by Manning, Chu, and Sager [Mannino et al., 1988] provides a list of good references to work in the area of statistics on choosing the appropriate number of buckets in a histogram for sufficient error reduction. Again this work also mainly deals with the context of selection operations.
- Merrett and Otoo [Merrett, T. H., and Otoo, E., 1979] showed how to model a distribution of tuples in a multidimensional space. They derived distributions for the relations that result from applying the relational algebraic operations.
- a relation was modeled as a multidimensional structure where the dimension was equal to the number of attributes in the relation. They divided each dimension, i, into c i number of equal width sectors. The values for c i , 1 ⁇ i ⁇ n, are chosen such that the resulting structure can completely fit into the available memory, where n is the dimension of the multidimensional array. Scanning through the relation for each attribute, the cells of the multidimensional structure are filled with integer numbers corresponding to the number of tuples that occupy the respective value ranges of the attributes.
- the above value for the join is valid only when the two cells from the relations have overlapping sectors on the joining attribute.
- the above join estimation depends on the number of overlapping attribute values, n. Since there is no way to compute the value of n, they resort to estimate it based on how the two sectors overlap along the joining attributes. They showed that there are 11 possible ways in which the sectors can overlap. By defining a rule to approximately guess the value for n for each of the 11 possible ways of overlap, they show how to estimate the result size of join from two cells.
- Estimating the result sizes of selection operations using the equi-width histogram is very simple.
- the histogram bucket where the attribute value corresponding to the search key lies is selected.
- the result size of the selection operation is simply the average number of tuples in that bucket.
- the main problem with this simple strategy is that the maximum estimation error is related to the height of the tallest bucket. Consequently a data distribution with widely varying frequency values will result in very high estimation error rate.
- Another problem associated with the equi-width histogram is that there are no proven statistical method to choose the boundaries of a bucket as this would require some prior knowledge about the underlying data distribution. This invariably has an effect on the estimation accuracy of the selection operations.
- the modern statistical literature also provides a number of parameters such as the mean error rate and mean-squared error rate, which are very useful in computing the size of the error within a multiple of a power of the given attribute value domain without any further knowledge of the data distribution.
- the equi-width approach is very simple to implement, its asymptotic accuracy is always lower than the estimation accuracy of the most modern techniques, including the kernel and nearest neighbor techniques [Tapia and Thompson, 1978]. It has been shown in [Tapia and Thompson, 1978] that the asymptotic mean-squared error obtained using the equi-width approach is O(n ⁇ 2 ⁇ 3 ), while that of the more recent methods are O(n ⁇ 4 ⁇ 5 ) or even better.
- variable kernel technique in the density estimation field, uses a partitioning strategy based on criteria other than the equal frequency. Mathematical analysis of the variable kernel technique has been found to be difficult.
- Lecoutre showed how to obtain a value of the cell width for minimizing the integrated mean squared error of the histogram estimate of a multivariate density distribution [Lecoutre, Jean-Pierre, 1985].
- a density estimator based on k statistically equivalent blocks, he further proved the L 2 consistency of this estimator, and described the asymptotic limiting behavior of the integrated mean square error. He also gave a functional form for the optimum k expressed in terms of the sample size and the underlying data distribution.
- Kamel and King is based on pattern recognition to partition the buckets of variable-width distribution tables.
- pattern recognition a frequently encountered problem is to compress the storage space of a given image without distorting its actual appearance. This problem is easily restated in the context of the selectivity estimation problem to partition the data space into nonuniform buckets that reduce the estimation error using an upper bound on storage space.
- the idea is to partition the attribute domain into equal-width buckets and compute a homogeneity measure for each bucket.
- the homogeneity is defined as the measure of the non-uniformity or dispersion around the average number of occurrences per value in the cell.
- the value of homogeneity for a given bucket is computed by a given function or by using sampling techniques.
- a number of multivariate analogs of the equal-width and equal-height methods is found in the density estimation literature.
- a two or three dimensional cells of equal area or volume can be partitioned, in the joint attribute value domain.
- the number of tuples with combined values in each cell is obtainable.
- variable width buckets each with approximately, say x, nearest neighbors, can be derived,
- the difficulty in this multiattribute situation is that the shape of the cell must also be selected.
- a square or a cube is a natural choice, when dealing with the equi-width analog. When the range or variation of one attribute's values is smaller than another's, a rectangular shaped cell is an obvious choice.
- Another approach to query optimisation relates to limiting duplicate operations in order to determine a best approach to execute a search query.
- U.S. Pat. No. 5,659,728 to Bhargava et al. a method of query optimisation based on uniqueness is proposed.
- a method of generating a histogram from data elements and their associated values First a data set is provided representing a plurality of elements and a value associated with each element, the data set having a property defining an order of the elements therein.
- At least one range is determined, each of the at least one range having at least an element, a mean of each range equal to the mean of the values associated with the at least an element within said range, and an area of each range equal to the product of the mean of said range and the number of elements within said range, a specific range from the at least a range comprising a plurality of elements from the data set adjacent each other within the defined order, wherein the mean of the specific range is within a predetermined maximum distance from a value associated with an element within the specific range, the predetermined maximum distance independent of the number of elements within the specific range and their associated values.
- at least a value is stored relating to the mean and at least data relating to the size and location of the range.
- Prior art histograms provide little or no data as to the content of an element within a range. For example, all tuples within the range may be associated with a same single element, resulting in a data set wherein each common element has an associated value of zero excepting the single element with a value equal to the number of tuples within the range, bin. It is evident, then, that for each estimated value, substantial error exists. This error is equal to the mean for each common element and to the number of tuples minus the mean for the single element.
- the error is the mean for common elements, at most the predetermined distance for the one element, and at most the number of tuples minus the mean minus (the mean minus the predetermined amount) for the single element.
- This amount of maximum error is less than that resulting from using prior art histograms.
- the maximum error is further restricted in a known fashion.
- determining at least a range includes the following steps:
- Such a method results in a last element added to a bin being within a predetermined distance of the mean of the values associated with elements in said bin or range.
- each element is close to the mean, though a possibility of increasing or decreasing values within a single bin results in a greater possible maximum error than is typical.
- the maximum error is determinable for each element and is different for some elements. This results in a histogram with increased accuracy and a method of analysing limits on accuracy of data derived from the histogram.
- determining at least a range includes the following steps:
- determining at least a range includes the following steps:
- All of the above embodiments have the property that they reduce the variation of the values associated with the elements within a range. In its most simple mathematical form this is achieved by determining the at least a range in terms of the mean of the elements within the current range, which is a function of well known L 1 norm of the elements in the current range. In other embodiments of the invention the at least a range can be computed using other L k norms. If a function of L ⁇ norm of the values within a range is used, the at least a range can be trivially computed using the maximum and minimum values of the current ranges, thus providing an alternate method to limit the variation of the values of the elements in the range. Various other embodiments of the invention are obtained when functions or other L k norms are used to determine the at least a range. Implementation of these embodiments is achieved using the Generalized positive-k mean and the Generalized negative-k mean as explained presently.
- determining at least a range includes the following steps:
- determining at least a range includes the following steps:
- determining at least a range includes the following steps:
- determining at least a range includes the following steps:
- the maximum error is bounded by twice the predetermined distance since the difference is on either side. Again, for each element within a range, a same maximum error exists.
- a histogram formed according to the invention maximum possible estimation errors are reduced and a quality of estimates derived from the histogram is predictable. Therefore, when a histogram according to the invention is used as a tool for aiding estimation, advantages result. For example, in database query optimisers, it is useful to have estimates of sizes of data sets resulting from a particular operation. Using a histogram according to the invention allows for more accurate estimation and thus is believed to result in better query optimisation.
- a histogram according to the invention is also useful in network routing, actuarial determinations, pattern matching, and open-ended searching of multiple data bases with limited time.
- the histogram is generated using the following steps:
- the plurality of values is indicative of a range beginning, a range ending, a value at the range beginning and a value at the range ending.
- a range is determined so as to limit variance between values associated with elements in the range and the straight line in a known fashion, the limitation forming further statistical data of the histogram.
- a best fit straight line is determined so as to limit average error between some values associated with elements in the range and the best fit straight line in a known fashion.
- a best fit straight line is determined so as to limit least squared error between some values associated with elements in the range and the best fit straight line in a known fashion.
- the histogram is generated using the following steps:
- resulting histograms provide data relating to ranges in which values are somewhat correlated, even if by chance.
- actuaries rely on data relating to individuals based on a plurality of different elements—sex, age, weight, habits, etc.
- age is divided based on certain statistical principles in increments of complete years or five-year periods, and so forth.
- age ranges are based on similarities of values associated with elements within the ranges. This is advantageous in determining ranges for which values associated with elements are similar.
- CENSUS Database 256 36 Construction of a T-ACM 257 37 Generation of a (near) Optimal T-ACM 258 38 Minimizing the Average Estimation Error. 259 39 Finding Optimal T-ACM Sectors. 260 40 Optimizing the T-ACM sectors 261 41 Percentage Estimation Error Vs Boundary Frequencies 262 42 Least Squares Estimation Error. 263 43 Optimal Boundary Frequencies: Least Square Error Method. 264 44 Primary Partitioning of an Attribute Value Domain 265 45 Secondary Partitioning of the Value Domain in Sector 3 266 46 Secondary Partitioning of the Value Domain in Sector 3. 267
- a data set having a property defining an order of the elements therein is provided.
- Each element has an associated value.
- a histogram of the data set comprises a plurality of ranges of elements within the data set and a mean value for each range.
- elements within the data set have ordering of some sort. That does not mean the elements are sorted or stored in an order, but merely that given three or more elements, a same ordering of those elements is predictably repeatable.
- each range are a number of elements each having an associated value. Some of the associated values may be zero indicating no tuples associated with a specific element. That said, even when an associated value is zero, the element exists within its range as predictable from an ordering of the elements.
- the present invention provides a method of determining ranges within an improved histogram, an Attribute Cardinality Map.
- elements within the range are grouped together. Such a grouping is referred to herein and in the claims that follow as a bin.
- elements within a single bin form the elements within a single range. As such, bins act as receptacles for elements during a process of range determination.
- the traditional histograms namely equi-width and equi-depth histograms have two major drawbacks.
- their fundamental design objective does not address the problem of extreme frequency values within a given bucket.
- all the bucket widths are the same regardless of the frequency distribution of the values. This means large variations between one frequency value to the other is allowed in the same bucket, resulting in higher estimation errors.
- This problem is somewhat reduced in the equi-depth case.
- a single attribute value may need to be allocated to several consecutive locations in the same bucket. This not only increases the storage requirement but also reduces the efficiency of estimation.
- the second drawback is that the traditional histograms are usually built at run-time during the query optimization phase using sampling methods. This obviously requires an I/O overhead during the optimization phase and tends to increase the overall optimization time. Moreover, unless sufficiently many samples are taken, the histograms built from the sampled data may not closely reflect the underlying data distribution.
- the present invention uses ACM as a new tool for query result-size estimation to address the above drawbacks in the traditional histograms.
- the R-ACM reduces the estimation errors by disallowing large frequency variations within a single bucket.
- the T-ACM reduces the estimation errors by using the more accurate trapezoidal-rule of numerical integration.
- both types of ACMs are catalogue based, they are precomputed, and thus will not incur I/O overhead during run-time.
- the Rectangular ACM (R-ACM) of a given attribute in its simplest form, is a one-dimensional integer array that stores the count of the tuples of a relation corresponding to that attribute, and for some subdivisions for the range of values assumed by that attribute.
- the R-ACM is, in fact, a modified form of histogram. But unlike the two major forms of histograms, namely, the equi-width histogram, where all the sector widths are equal, and the equi-depth histogram, where the number of tuples in each histogram bucket is equal, the R-ACM has a variable sector width, and varying number of tuples in each sector.
- the sector widths or subdivisions of the R-ACM are generated according to a rule that aims at minimizing the estimation error within each subdivision.
- the R-ACM is either one-dimensional or multi-dimensional depending on the number of attributes being mapped. To introduce the concepts formally, the one-dimensional case is first described.
- the attribute value range is partitioned into the three sectors, ⁇ 8, 6, 9, 7 ⁇ , ⁇ 19, 21 ⁇ , ⁇ 40 ⁇ with sector widths of 4, 2, and 1 respectively.
- method Generate_R-ACM partitions the value range of the attribute X into s variable width sectors of the R-ACM.
- the input to the method are the tolerance value ⁇ for the ACM and the actual frequency distribution of the attribute X.
- the frequency distribution is assumed to be available in an integer array A, which has a total of L entries for each of the L distinct values of X. For simplicity reasons, it is assumed that the attribute values are ordered integers from 0 to L ⁇ 1.
- the output of the method is the R-ACM for the given attribute value set.
- Generate_R-ACM generates the R-ACM corresponding to the given frequency value set. Assuming that the frequency distribution of X is already available in array A, the running time of the method Generate_R-ACM is O(L) where L is the number of distinct attribute values.
- the tolerance value, ⁇ is an input to the above method.
- the question of how to determine an “optimal” tolerance value for an R-ACM is addressed using adaptive techniques set out below.
- ACM Since the ACM only stores the count of the tuples and not the actual data, it does not incur the usually high I/O cost of having to access the base relations from secondary storages. Secondly, unlike the histogram-based or other parametric and probablistic counting estimation methods, ACM does not use sampling techniques to approximate the data distribution. Each cell of the ACM maintains the actual number of tuples that fall between the boundary values of that cell, and thus, although this leads to an approximation of the density function, there is no approximation of the number of tuples in the data distribution.
- the one-dimensional R-ACM as defined above is easily extended to a multi-dimensional one to map an entire multi-attribute relation.
- a multi-dimensional ACM is, for example, used to store the multi-dimensional attributes that commonly occur in geographical, image, and design databases.
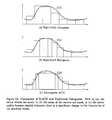
- FIG. 12 shows the histogram partitioning of f(x) under the traditional equi-width, equi-depth methods and the R-ACM method.
- the sector widths remain the same across the attribute value range. This means the widely different frequency values of all the different attribute values are assumed to be equal to that of the average sector frequency. Thus there is an obvious loss of accuracy with this method.
- the area of each histogram sector is the same. This method still has a number of sectors with widely different frequency values and thus suffers from the same problem as the equi-width case.
- FIG. 13 shows a comparison of probability estimation errors obtained on all three estimation methods for synthetic data.
- the probability mass distribution for the R-ACM is derived.
- Lemma 1 The probability mass distribution for the frequencies of the attribute values in an R-ACM is a Binomial distribution with parameters (n, l/1).
- Frequency distribution for a given attribute value in the R-ACM obeys a Binomial distribution.
- a maximum likelihood estimate for the frequency of an arbitrary attribute value in an R-ACM sector is determined.
- estimating the parameters such as the mean or other unknown characterizing parameters of the distribution of one or more random variables is usually conducted.
- the frequency x i which is “inaccessible” is desired.
- the maximum likelihood estimate is derived, which maximizes the corresponding likelihood function. Indeed the result is both intuitively appealing and quite easy to comprehend.
- ⁇ ⁇ ( x + 1 ) ⁇ ⁇ ( n + 1 ) ( x + 1 ) ⁇ ( x + 2 ) ⁇ ⁇ ... ⁇ ⁇ n .
- Theorem 2 For a one-dimensional rectangular ACM, the maximum likelihood estimate of the number of tuples for a given value X i of attribute X falls within the range of, ( n + 1 ) l - 1 ⁇ x ⁇ ML ⁇ ( n + 1 ) l , where n is the number of tuples in the sector containing the value X i and l is the width of that sector.
- the maximum likelihood estimate of the frequency of a given attribute value indicates that the attribute value would have a frequency of ⁇ circumflex over (x) ⁇ ML with maximum degree of certainty when compared to the other possible frequency values. But even though the attribute value occurs with the maximum likelihood frequency with high probability, it can also occur with other frequencies with smaller probabilities. Hence in order to find the worst-case and average-case errors for result size estimations, another estimate is obtained which includes all these possible frequency values.
- One such estimate is the expected value of the frequency of a given attribute value.
- the Binomial model is used to find the expected value of the frequency of an attribute value as given in the following lemma and to develop a sequence of results regarding the corresponding estimates.
- Var ⁇ ( X k ) E ⁇ [ ( x k - n j l j ) 2 ]
- Var ⁇ ( X ) n j ⁇ ( l j - 1 ) l j 2 ( 7 )
- a sector of the former type is called a monotonically decreasing R-ACM sector.
- a sector of the latter type is called a monotonically increasing R-ACM sector.
- Theorem 4 If the value X, falls in the j th sector of an R-ACM, then the number of occurrences of X i is, n j l j - ⁇ ⁇ ⁇ [ ln ⁇ ( l j i - 1 ) - 1 ] ⁇ ⁇ x i ⁇ n j l j + ⁇ ⁇ ⁇ ⁇ [ ln ⁇ ( l j i - 1 ) - 1 ] ⁇ where n j and l j are the number of tuples and the sector width of the j th sector. Proof: Consider a sector from an R-ACM. Let the frequency of the first value x 1 be a.
- FIG. 16 ( c ) represents the range of likely frequencies when the frequencies in the sector are generated from the frequency of the first attribute value. Note that when the frequencies are generated based on the running mean, the worst case error will be at its maximum at the beginning of the sector and then gradually decrease towards the end of the sector. This is the result of the fact that the sample mean converges to the true mean and the variance tends to zero by the law of large numbers. What is interesting, however, is that by virtue of the fact the next sample deviates from the current mean by at most ⁇ , the error in the deviation is bounded from the mean in a logarithmic manner. If this is not taken into consideration, the above figure can be interpreted erroneously. The following example illustrates the implications of the above theorem.
- the frequency range of X 3 is, 12.4 - ⁇ 3 ⁇ ( ln ⁇ ⁇ 5 - 1 ) ⁇ ⁇ x 3 ⁇ 12.4 + ⁇ 3 ⁇ ( ln ⁇ ⁇ 5 - 1 ) ⁇ 10.57 ⁇ x 3 ⁇ 14.23
- the previous theorem gives an estimate of the number of occurrences of an arbitrary attribute value by considering the worst-case R-ACM sector. So the worst-case error in the above estimate is given by the frequency range that the attribute value can assume. The following theorem provides a worst-case error for this frequency estimation.
- estimation using the R-ACM gives the accurate result (n j ) and there is no estimation error.
- the estimation error in the second case is shown in the example FIG. 17 ( a ) and is given by the theorem below.
- the estimation error in the third case can be obtained by noting that it is in fact the combination of the first and second cases.
- Average case error occurs in a truly random sector.
- frequency values do not monotonically increase or decrease as in the least uniform case. Instead, they take on a random value around the mean bounded by the tolerance value.
- the current mean is ⁇
- the next frequency value is a random variable between ⁇ and ⁇ + ⁇ . Whenever the next frequency value falls outside the range of [ ⁇ , ⁇ + ⁇ ], then a new sector is generated.
- Theorem 7 The average case error with a rectangular ACM is bounded by 2 ⁇ .
- the current frequency mean is also given by the following recurrence expression.
- ⁇ k ⁇ k - 1 + ( - 1 ) k + 1 ⁇ ⁇ k .
- FIG. 18 A random sector with frequency values which alternatively increase and decrease about the current mean is depicted in FIG. 18 and the corresponding frequency and mean values are given in Table 5. Considering the case of such a random sector leads to the following lemma.
- the selection operation is one of the most frequently encountered operations in relational queries.
- the select operation is denoted by ⁇ p (R), where p is a Boolean expression or the selection predicate and R is a relation containing the attributes specified in p.
- the selection predicate p is specified on the relation attributes and is made up of one or more clauses of the form, ⁇ Attribute ⁇ ⁇ ⁇ ⁇ comparison ⁇ ⁇ operator ⁇ ⁇ ⁇ Constant ⁇ , ⁇ or ⁇ Attribute1 ⁇ ⁇ ⁇ ⁇ comparison ⁇ ⁇ operator ⁇ ⁇ ⁇ Attribute2 ⁇ .
- the selection predicates can be either range predicates or equality predicates depending upon the comparison operators.
- the selection clauses can be arbitrarily connected by the Boolean operators, AND, OR, and NOT to form a general selection condition.
- the result of a select operation is determined as follows.
- the selection predicate, p is applied independently to each tuple t in the relation R. This is done by substituting each occurrence of an attribute A i in the selection predicate with its value in the tuple t[A i ]. If the condition evaluates to be true, then the tuple t is selected. All the selected tuples appear in the result of the select operation.
- the relation resulting from the select operation has the same attributes as the relation specified in the selection operation.
- Lemma 12 For every X ⁇ and X ⁇ such that X ⁇ ⁇ X ⁇ , E ( ⁇ X ⁇ X ⁇ ( R )) ⁇ E ( ⁇ X ⁇ X ⁇ ( R )).
- the estimate using the expected value and the maximum likelihood estimate are essentially identical, the estimate is referred to as the maximum likelihood estimate.
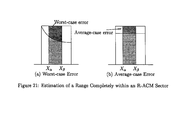
- the worst-case and average-case errors are of concern. These errors are shown in FIG. 19 ( b ) and ( c ).
- the query result size is found by summing up the number of tuples in the first k ⁇ 1 sectors of the R-ACM and the maximum likelihood estimate of the tuples for the first z ⁇ attribute values in the k th sector of the R-ACM. First of all, there is no estimation error in the first k ⁇ 1 sectors. The maximum likelihood estimate of the tuples for the first z ⁇ attribute values in the k th sector is found.
- join operation is used to combine related tuples from two relations into single tuples. This operation is very important for any relational database system with more than a single relation, because it allows us to process relationships among relations. Also joins are among the most expensive operators in relational DBMSs. In fact, a large part of query optimization consists of determining the optimal ordering of join operators. Estimating the result size of a join is very essential to finding a good QEP.
- R predicate S where predicate is the join condition.
- a join condition is of the form, ⁇ condition>AND ⁇ condition>AND . . . AND ⁇ condition> where each condition is of the form A i ⁇ B j .
- a join operation with such a general join condition is called a theta join.
- the approximate data distribution corresponding to an ACM is used in the place of any actual distribution to estimate a required quantity.
- the approximate data distributions are derived using the techniques developed earlier for all joining relations.
- the result size is estimated by joining these data distributions using, say, a merge-join algorithm.
- the frequencies in all the ACMs are multiplied and the products are added to give the join result size.
- an accurate ACM for this case should also approximate the value domain with high accuracy in order to correctly identify the joining values.
- the case when the join operation involves multiple attribute predicates requires the multi-dimensional version of the R-ACM, which is a promising area for future research.
- the attribute values in the R-ACMs are in an ascending order.
- the i th sector from the R-ACM for the attribute X Suppose it has meaning values in the R-ACM for attribute Y with all the sectors in the range from sector j to sector k. Assume that there are ⁇ matching values from the j th sector and ⁇ matching values from the k th sector. Also assume that all the values in sectors j+1 to k ⁇ 1 of Y have matching values from sector i of X. (See FIG. 22 ).
- Lemma 19 is used for every intersecting sector of the R-ACM of attribute X and the R-ACM of attribute Y. This is given by the following theorem.
- Theorem 11 Considering an equijoin R
- ⁇ i 1
- the estimation of join sizes using an ACM is similar to the merge phase of the sort-merge join algorithm. Since the attribute values in the ACM are already in a sequentially ascending order, unlike the sort-merge join algorithm, the sorting step is not required for an ACM.
- the join estimation only uses L number of integer multiplications and an equal number of additions.
- the estimation error resulting from an equality join of two attributes is usually much higher than the estimation errors resulting from the equality select and range select operations.
- the possible values for x i can be either ( ⁇ circumflex over (x) ⁇ i ⁇ x ) or ( ⁇ circumflex over (x) ⁇ i + ⁇ x ).
- the possible values for y j can be either ( ⁇ i ⁇ y ) or ( ⁇ j + ⁇ y ). Note that out of the 4 possible value combinations of these expected values, only ( ⁇ circumflex over (x) ⁇ i + ⁇ z )( ⁇ j + ⁇ y ) gives the largest error.
- FIG. 23 shows the relationship of the worst-case join estimation error and the positions i,j of the attribute values X i and Y j within the R-ACM sectors. Note that the join estimation has the lowest worst-case error when both X i and Y j are the last attribute values in their corresponding sectors.
- the synthetic data from a random number generator invariably produces a uniform distribution. Since real-world data is hardly uniformly distributed, any simulation results from using such synthetic data are of limited use. So two powerful mathematical distributions, namely the Zipf distribution and the multi-fractal distribution were used. Since these distributions generate frequencies with wide range of skews, they provide more realistic simulation results.
- Zipf's law is essentially an algebraically decaying function describing the probability distribution of the empirical regularity. Zipf's law can be mathematically described in the context of our problem as follows.
- the attribute value domain is recursively decomposed at k levels; each decompositions halves the input interval into two. Thus, eventually 2 k sub-intervals of length 2 ⁇ k result.
- the left half is chosen with probability (1 ⁇ p), while the right half is with p; the process continues recursively for k levels.
- the left half of the sectors will host (1 ⁇ p) of the probability mass, the left-most quarter will host (1 ⁇ p) 2 etc.
- the select and join operations are the two most frequently used relational operations in database systems. Thus for the experiments queries that use these two operations are implemented.
- the exact-match select operation retrieves all the tuples from the relation R, for which the attribute X has the value X i .
- the range select operation retrieves all the tuples falling within an attribute value range.
- the query ⁇ X ⁇ X i (R) retrieves all the tuples from the relation R, for which the attribute value X has values less than X i .
- the join operation the most frequently encountered equi-join operation is used.
- the equi-join operation denoted R
- X Y S, combines all the tuples in the relations R and S whenever the value of attribute X from relation R is equal to the value of attribute Y from relation S.
- the result size estimates from the R-ACM are compared for three different tolerance values. Again the experiments were conducted with the uniform, Zipf and multifractal frequency distributions. As in the first group of experiments, the comparisons were done for simple (a) equality-select queries (b) range-select queries and (c) equi-join queries. The percentage estimation error corresponding to each tolerance value was computed as an average over a number of experiments and are shown in Tables 9, 10 and 11.
- the build parameter for the R-ACM is the tolerance value, ⁇ .
- ⁇ the tolerance value
- (b) range-select and (c) equi-join were computed.
- the experiments were again conducted for the uniform, Zipf and multifractal frequency distributions. An analysis of the results follows. 5.1.28 Analysis of the Results
- the third group of experiments demonstrate the superiority of the R-ACM over the traditional equi-width and the equi-depth histograms for query result size estimation.
- the result from this set of experiments show that the estimation error resulting from the R-ACM is a fraction of the estimation error from the equi-width and the equi-depth histograms.
- Table 13 the percentage estimation error with the R-ACM for equi-select operation on uniform frequency distribution is only 3.21%, whereas for the same operation, the equi-width and equi-depth histograms result in 26.7% and 23.9% estimation errors respectively—which is an order of magnitude larger. This disparity is more evident and striking for the highly skewed Zipf distribution.
- a method of generating an attribute cardinality map is presented wherein elements are selected from a first end of a sorted data set progressing sequentially toward an opposing end. Each element is compared to a running mean of a current bin to determine where to commence a new bin, a new range.
- the resulting bins each have at least one element having an associated value within a predetermined maximum distance of the mean. That is, at least one value is within the range of plus or minus the predetermined maximum distance, ⁇ , though all elements may be much closer and some may even be further.
- the predetermined maximum distance, ⁇ for a bin is such, even when a value of ⁇ less than the actual predetermined maximum distance is used. For example, when a range is very large, it is optionally divided by reducing ⁇ for that range. There still remains a value within the predetermined distance and in fact, there now is a value within the distance of the reduced ⁇ .
- the ranges are determined, data relating to the determined ranges and their associated means or approximations therefore are stored.
- the means and the ranges are determined using sampling of the elements within the data set instead of an exhaustive analysis.
- the resulting histogram is not as good as one generated using all of the data. That said, there are situations where computational efficiency is more significant than estimation accuracy where sampling of some data within the data set is a preferred method of determining ranges.
- the data set is traversed in an alternating fashion toward a beginning of the data set and toward an end of the data set.
- the data set is traversed in a random order or, equivalently, the data set is unsorted. Accordingly, an element is selected and an appropriate bin is determined or created for that element. When desired, bins having adjacent contiguous ranges are merged when their means have a predetermined statistical correlation or their elements have associated values with a predetermined statistical correlation.
- a plurality of elements is selected at a same time. Values associated with the elements are compared to each other to determine if they are within a predetermined distance of each other and therefore belong in a same bin or a same portion of a bin. When they do, a bin is formed or optionally the elements are merged into an adjacent bin. Once again, a step of merging bins so determined is optionally performed.
- one or more elements are added to each end of the bin according to this or another method.
- the elements are within ⁇ of the mean of the elements within the bin.
- a range comprises elements within a known predetermined maximum distance one from ever other, as the value of k is increased. For example, a maximum value associated with the elements within the range and a minimum value associated with the elements within the range are stored. The difference between the maximum and minimum value is maintained below a predetermined threshold value. This is formally seen to be a result of the following.
- ⁇ (k) is the maximum of the elements in the set ⁇ 1 , . . . , ⁇ n ⁇
- ⁇ ( ⁇ k) is the minimum of the elements in the set ⁇ 1 , . . . , ⁇ n ⁇ . This is the rationale for the embodiment which computes the width of the range in terms of the maximum and minimum values associated with the elements in the current range.
- an estimate of a value associated with an element is determinable. Further, statistical data relating to a reliability of an estimate is also determinable. Such information is useful for query optimisation, actuarial calculations, network routing, and some forms of searching.
- a table of time ranges and network traffic is used to determine a best route for communicating via the network. Improving the quality of estimated network traffic improves routing within the network.
- Typical routing tables divide time into equi-width segments of an hour, a half hour, a quarter hour or the like. For example, at 10:18 network traffic might decrease as opposed to at 10:00 sharp.
- the ranges determined according to the above embodiments will define a range ending at 10:18 and as such network traffic is estimated approximately correctly even at 10:03.
- a trapezoidal ACM is a modified form of the equi-width histogram where each histogram partition is a trapezoid instead of a rectangle.
- the trapezoidal ACM is obtained by replacing each of the rectangular sectors of the equi-width histogram by a trapezoid.
- the beginning and ending frequency values of each trapezoid sector is chosen so that the area of the resulting trapezoid is equal to the area of the “rectangle” of the histogram it is replacing.
- V ⁇ i :1 ⁇ i ⁇
- the value set V be subdivided into s equi-width sectors, each having sector width, l. Approximate each equi-width sector by a trapezoid in which the j th trapezoid is obtained by connecting the starting value, a j , to the terminal value, b j , where the quantities a j and b j satisfy:
- the Trapezoidal Attribute Cardinality Map of attribute X with initial attribute value X l and width l is the set ⁇ (a i ,b i )
- Finding the result size of a selection query on a range-predicate is a discrete case of finding the area under a curve.
- any numerical integration technique used to find the area under a curve will fit our purpose well.
- More accurate and sophisticated methods such as Simpson's Rule exist which may also be used.
- the trapezoidal method is relatively easy to use in a DBMS setting and is much superior to the traditional equi-width and equi-depth histograms currently in use.
- it also gives better results on equality-match predicates.
- the sector widths of a T-ACM are all equal.
- Each sector or cell of a T-ACM stores the modeled frequency values of the first and last attribute values in that sector, which naturally leads to the number of tuples in the sector.
- Method Generate_T-ACM partitions the value range of attribute X into s equal width sectors of the T-ACM.
- the input to the method is the number of partitions, s.
- the frequency distribution is assumed to be available in an integer array A, which has a total of L entries for each of the L distinct values of X. Note that the input can also be an equi-width histogram.
- the attribute values are ordered integers from 0 to L ⁇ 1.
- the output of the method is the T-ACM for the given attribute value set. Since choosing the starting frequency value of the first trapezoidal sector is important for obtaining the subsequent a j 's and b j 's, it is discussed it below.
- n j ( a + b 2 ) ⁇ l , where a, b are the frequencies of the first and last attribute value in the sector and l is the number of distinct values in the sector. Proof: This can be easily shown using the geometry of the trapezoidal sector.
- a j be the frequency of the first attribute value in the j th sector.
- the subsequent values for a j ,2 ⁇ j ⁇ s, do not need to be stored explicitly and can be obtained using Lemma 23.
- input ⁇ ⁇ can ⁇ ⁇ also ⁇ ⁇ be ⁇ ⁇ an ⁇ ⁇ equi ⁇ - ⁇ width ⁇ ⁇ histogram .
- a j is easily obtained from a j-1 as shown in the Method 3.
- ⁇ 1 is obtained by averaging the frequency values of the entire attribute range.
- each entry of the ACM array is a record with three fields, namely n, a, b, which store the number of tuples, the frequency of the first value and the frequency of the last value in the sector respectively. Alternatively, other values providing same or similar information are used.
- Generate_T-ACM generates the T-ACM corresponding to the given frequency value set. Assuming the frequency distribution of X is already available in array A, the running time of the method Generate_A-ACM is O(L) where L is the number of distinct attribute values.
- ⁇ p X i ⁇ ( x i ) ⁇ a j n j + 2 ⁇ ( n j - a j ⁇ l ) n j ⁇ l ⁇ ( l - 1 ) ⁇ i ⁇ ⁇ 1 ⁇ i ⁇ l - 1.
- the probability mass distribution for the frequencies of the attribute values in a T-ACM is a Binomial distribution with parameters (n,px i (x i )).
- each of the attribute values X 1 ,X 2 , . . . , X l forms a binomial distribution Binomial (n,p i ) with a parameter determined by its location in the trapezoidal sector.
- n k is the number of tuples in the k th T-ACM sector
- a k is the frequency of the first attribute value in the k th sector
- l is the number of distinct attribute values (or width) of the T-ACM sectors
- X a is the z a th value in the T-ACM sector.
- the maximum likelihood estimate reaches its upper limit of np at integer values only in very special cases.
- the integer maximum likelihood value which is related to the above maximum likelihood estimate is determined by discretizing the space. For the analogous discrete case, the following therorem is given.
- Theorem 13 For a one-dimensional trapezoidal ACM, the maximum likelihood estimate of the number of the tuples for a given value X i of attribute X falls within the range of, a k n k + 2 ⁇ ( n k - a k ⁇ l ) n k ⁇ l ⁇ ( l - 1 ) ⁇ z ⁇ ⁇ ( n k + 1 ) - 1 ⁇ x ⁇ ML ⁇ a k n k + 2 ⁇ ( n k - a k ⁇ l ) n k ⁇ l ⁇ ( l - 1 ) ⁇ z ⁇ ⁇ ( n k + 1 ) , where a k is the frequency of the first attribute value in the k th sector, n k is the number of tuples in the k th sector containing the value X i and l is the width of that sector.
- the maximum likelihood estimation of the frequency of an attribute value shows that the attribute value would have a frequency of ⁇ circumflex over (x) ⁇ ML with high degree of certainty when compared to the other possible frequency values. But even though the attribute value occurs with the maximum likelihood frequency with high probility, it can also occur with other frequencies with smaller probabilities. Hence, the worst-case and average-case errors for the result size estimations is considered.
- First the expected value of the frequency of a given attribute value is obtained. Using the Binomial model for the T-ACM sector, the expected value of the frequency of an attribute value is found as given in the following lemma and a series of results is developed regarding the correponding query result-size estimates.
- the quantity a j is the number of occurences of the first attribute value in the j th sector.
- Var j n j - a j ⁇ ( l + 1 ) ⁇ ( a j ⁇ l - 2 ⁇ n j ) 3 ⁇ n j ⁇ ( l - 1 ) - 2 ⁇ n j ⁇ ( 2 ⁇ l - 1 ) 3 ⁇ l ⁇ ( l - 1 ) and the lemma follows Lemma 29
- the frequency of an arbitrary attribute value is computed from the T-ACM as the expected value E(x i ), which is the average frequency of the T-ACM sector. Hence the result of self-joining this attribute value would be [E(x i )] 2 .
- the actual frequency ⁇ of attribute value X i can be anywhere in the range of, ⁇ n j .
- ⁇ ⁇ ⁇ n j 2 the maximum worst case error occurs when the actual frequency ⁇ is equal to n j .
- the maximum worst case error in this case is n j ⁇ circumflex over ( ⁇ ) ⁇ .
- the maximum worst case error in this case is ⁇ circumflex over ( ⁇ ) ⁇ .
- n j 2 Whether the expected frequency value ⁇ circumflex over ( ⁇ ) ⁇ is smaller or larger than n j 2 depends on the location of the attribute value X i within the T-ACM sector.
- the average case error is much smaller than the worst-case error.
- the average-case is synonymous with a truly random sector in which all attribute values have the same or approximately same frequency value equal to the mean sector frequency, n j l .
- the average case error in estimating the freqeuncy of an arbitrary value X i is obtained by either of two different methods, depending on how the frequencies of the attribute values are averaged. In the first case, the expected frequency of all attribute values in the sector is obtained by averaging over the entire sector. In the second case, the average frequency of an attribute value is obtained by averaging all the possible frequencies that this particular attribute value can assume. The average case errors in these two situations are given below.
- Theorem 16 Assuming that the T-ACM sector has been obtained by processing a histogram bucket of size l eith n j tuples, the average error in estimating the frequency of an arbitrary attribute value X i , obtained by averaging over all attribute values in this sector of the trapezoidal ACM is exactly zero.
- ( a j n j + 2 ⁇ ⁇ ( n j - a j ⁇ ⁇ l ) n j ⁇ l ⁇ ⁇ ( l - 1 ) ⁇ ⁇ i ) is the probability that attribute value X i occurs in the T-ACM sector.
- trapezoidal ACM The rationale for the trapezoidal ACM is that the trapezoidal rule for numerical integration provides a more accurate estimation of the area under a curve than the left-end or right-end histogram or rectangular rule based methods. This is formally given by the following lemma.
- the histogram method also known as the rectangular rule
- the tapezoidal ACM also known as the trapezoidal rule are two well known numerical integratoin techniques to approximate the area under a curve. It can be shown that using the trapezoidal rule, the estimation error, ⁇ 1 , has the following bounds. ( b - a ) 3 12 ⁇ n 2 ⁇ ⁇ M 2 * ⁇ ⁇ 1 ⁇ ( b - a ) 3 12 ⁇ n 2 ⁇ ⁇ M 2 . Similarly it can be shown that using the rectangular rule, the estimation error, ⁇ 2 , hs the following bounds.
- Claim 1 if the frequency estimation error for an arbitrary attribute value using the trapezoidal ACM is Error T and that of using the equi-width histogram with the same number of sectors is Error H , then Error T ⁇ Error H .
- p H is the probability of selecting one of the l attribute values in the histogram sector and is equal to 1/l.
- the estimate is referred to as the maximum likelihood estimate.
- the worst-case and average case errors in the above equality select estimation are analyzed.
- the following lemma gives the worst-case error in an equality select operation.
- the expected frequency of all attribute values in the sector is obtained by averaging over the entire sector.
- the average frequency of an attribute value is obtained by averaging all the possible frequencies that this particular attribute value can assume.
- a k is the frequncy of the first attribute value in the k th sector and X ⁇ is in the z th ⁇ position of the T-ACM sector.
- a k is the frequency of the first atribute value in the k th sector.
- the attribute vales which satisfy the query ⁇ x ⁇ x ⁇ (R) occupy the first k ⁇ 1 T-ACM sectors and up to and including the ⁇ th T-ACM sector.
- the query result size is found by summing up the number of tuples in the first k ⁇ 1 sectors of the T-ACM and the estimate of the number of tuples for the first ⁇ attribute values in the k th sector of the T-ACM.
- the maximum likelihood estimate of the tuples for the first z ⁇ attribute values in the k th sector are found.
- a k is the frequency of the first attribute value in the k th sector.
- ⁇ ( ⁇ - 1 ) ⁇ ⁇ ( ⁇ - 2 ) ⁇ ⁇ ( n k - a k ⁇ ⁇ l ) l - 1 where a k is the frequency of the first attribute value in the k th sector.
- Theorem 21 The maximum likelihood estimate of the result size for the range selection query ⁇ x ⁇ ⁇ x ⁇ x ⁇ (R), where the attribute values X ⁇ and X ⁇ fall completely within the k th T-ACM sector is given by, ??
- Locate_Matching_Tuple (X i ), given below, returns the location of the matching attribute value in the joining T-ACM.
- the array V[0 . . . L y ] maintains the value domain of the joining attribute Y. Note that the search for the matching tuple does not have to start from the first location of the T-ACM. Since the current attribute value X i , i>0, is always larger than the previous attribute value X i ⁇ 1 , it is sufficient to begin the search for the matching tuple from where the previous search ended. Indeed, the philosphy of the traversal is analogous to merge-sort, where the “sortedness” of the individual values is taken advantage of.
- the estimation error resulting from the size estimation using a T-ACM of an equality join of two attributes are usually much higher than the estimation errors resulting from the equality select and range select operations.
- the current state of the art estimation techniques use either parametric techniques or sampling based techniques, including probabilistic and non-parametric techniques.
- Parametric vs ACM Estimations based on ACM is advantageous over parametric techniques, because ACM does not make any assumptions about the underlying data distribution.
- Parametric techniques approximate the actual data distribution by a parameterized mathematical distribution, such as the uniform distribution, multivariate distribution or Zipf distribution. Obviously the accuracy of the approximation depends heavily on the similarity between the actual and parameterized distribution. Since real data often does not resemble any simple mathematical distribution, such approximations are prone to cause higher inaccuracies.
- System R query optimizer assumes that the data distribution is uniform over the entire value domain D.
- Example 4 compares the selection results based on the System R's uniform parametric model and that of rectangular ACM for a small relation. Note that the estimation using the rectangular ACM is closer to the actual result, 3, since the uniformity assumption is made only within a sector.
- ACM both rectangular and trapezoidal, on the other hand, maps the entire tuples over the value range of the attribute(s) hence is much more accurate than any sampling method. Since the ACMs of the base relations are not built during run-time, they do not incur the disk I/Os and CPU overhead at the time of query optimization. Histogram vs ACM: Estimation based on ACM is superior to histogram based techniques. Both R-ACM and T-ACM are improved histogram-like strategies.
- the frequency values in each R-ACM sector are guaranteed to be close to the running mean frequency.
- the trapezoidal sectors very closely follow the actual data distribution, so the estimation errors are minimized.
- histograms are usually constructed based on sampling the data distribution, and their accuracy heavily depends on the type of sampling methods and the size of sampling population used. But ACMs are constructed to map the entire data distribution, providing further accuracy. The following example illustrates why the R-ACM is better than the equi-width histogram.
- the actual fraction of tuples with age ⁇ 37 can be anywhere between 0.42 to 0.80. If the estimate of ⁇ age ⁇ 37 is assumed to be the mid-point of this range (i.e: 0.61), then it is obvious that the estimate can be wrong by nearly 0.19.
- the way to control the maximum estimation error is to control the number of tuples or height in each sector so as to maintain the frequencies of every value close to a certain height. This is easily achieved by choosing a suitable tolerance value and forcing the values in every sector to not exceed it, as is done in the rectangular ACM.
- a major drawback of traditional histograms is that they are mostly generated at run-time during query optimization incurring a high I/O cost.
- One of the practical advantages of ACMs is that both the types of ACMs defined are easily created and maintained in the DBMS catalogue with only a minimal storage requirement. Looking from an implementation point of view, storing an integer array with a few hundred or thousand entries require only a few kilobytes of disk storage. Unlike the late 1970s and early 80s when the disk storage was considered to be a premium, the 1990s have seen technology yielding unprecedentedly huge storage capacities along with a dramatic drop in the cost of disk storage.
- ACMs for an entire DBMS can be easily materialized in the catalogue. Even for a complex database, with 100 relations and say 500-1000 distinct attributes, the cost of storing the ACMs would be less than one megabyte, which is less than 0.01% of the size of a typically large database with ten gigabytes of data.
- the DBMS catalogue is designed as part of the query optimizer module.
- storing ACMs in the DBMS catalogue is a natural choice as it would reduce the communication costs.
- the query optimizer constructs the ACMs in the main memory for further optimization.
- the scope of the third set of experiments included a performance comparison study of the T-ACM and the traditional equi-width and equi-depth histograms. As in the case of the experiments with the R-ACM, this set of experiments was performed with various synthetic data distributions for both select and join operations.
- the variance of the T-ACM under the uniform frequency distribution for equality-select, range-select and equi-join operations and the corresponding percentage estimation errors in this set of experiments were completed.
- the percentage estimation errors and the corresponding variance of the T-ACM are given in Table 20. Note that the row numbers I, II, and III correspond to equality-select, range-select and equi-join operations respectively.
- the results from the first group of experiments show that the estimation errors with the uniform data distribution are smaller than the corresponding errors with the Zipf and multi-fractal distributions.
- the percentage estimation error for the equi-select operation using a uniform distribution is 4.81% (Table 17), whereas the percentage estimation errors for the same operation under the Zipf and multi-facial distributions are 9.20% (Table 18) and 6.37% (Table 19) respectively.
- Table 17 the percentage estimation errors for the same operation under the Zipf and multi-facial distributions are 9.20% (Table 18) and 6.37% (Table 19) respectively.
- the frequency variations are the largest with the Zipf distribution, and consequently the estimation errors from the T-ACM are proportionately larger than that with other distributions.
- the estimation error resulting from the T-ACM is consistently much smaller than the estimation errors from the equi-width and the equi-depth histograms.
- the percentage estimation error with the T-ACM for equi-select operation on uniform frequency distribution is only 4.33%, whereas for the same operation, the equi-width and equi-depth histograms result in 23.83% and 22.18% estimation errors.
- This demonstrates that the estimation errors from the T-ACM are indeed a fraction of the estimation errors from the equi-width and equi-depth histograms and proves the superiority of the T-ACM over the traditional histograms.
- the CENSUS database contains information about households and persons in the United States for the years 1993 to 1995 [U.S. Census Bureau, 1997]. Most of the relations in this database contains hundreds of attributes, both scalar-typed (such as a person's sex and type of job) and numerical (such as salary and age).
- the Data Extraction System (DES) at the U.S. Census Bureau allows extracting records and fields from very large public information archives such as governmental surveys and census records.
- Tables 24 and 25 describe the set of relations and attributes chosen from this database for the experiments.
- the data distributions of some of the selected attributes from CENSUS are plotted in FIG. 33 .
- the queries for the experiments consisted of either (a) equality join (b) equality selection or (c) range selection operators.
- This database contains a relation with 50 attributes and 458 tuples. The distributions of few attributes from this relation are presented in FIG. 34 .
- the exact-match select operation retrieves all the tuples from the relation R, for which the attribute X has the value X i .
- the range select operation retrieves all the tuples falling within an attribute value range.
- the query ⁇ x ⁇ x i (R) retrieves all the tuples from the relation R, for which the attribute value X has values less than X i .
- the join operation the most frequently encountered equi-join operation was used.
- the first group of experiments were conducted on equi-width, equi-depth histograms and the R-ACM.
- different build-parameters for the histograms and the R-ACM were chosen.
- the build-parameters for the equip-width and equi-depth histograms are the sector width and the number of tuples within a sector respectively.
- the build-parameter for the R-ACM is the tolerance value, ⁇ .
- the relative estimation error was obtained as a ratio by subtracting the estimated
- N is the total number of tuples mapped by the R-ACM
- n j is the number of tuples within the j th R-ACM sector
- l j is the sector width of the j th R-ACM sector.
- the prototype validation on the NBA Performance Statistics database involved two different sets of experiments.
- the first set of experiments were conducted to compare the performance of the R-ACM to that of the traditional histograms.
- the second set of experiments were conducted to study the behavior of the
- the results from the first set of experiments show that the estimation error resulting from the R-ACM is a fraction of the estimation error from the equi-width and equi-depth histograms, again demonstrating the superiority of the R-ACM over the traditional histograms for query result size estimation.
- the percentage estimation error with the R-ACM for equi-select operation is only 4.7%, whereas for the same operation, the equi-width and equi-depth histograms results in 38.68% and 30.26% estimation errors.
- the second set of experiments show that the accuracy of the R-ACM is inversely proportional to the tolerance value.
- the choice of the tolerance value is usually left to the database administrator who would have the knowledge of how much trade-off the database system can afford in terms of the disk storage to achieve the desired response time for queries.
- T A is the T-ACM derived from the equi-width histogram, H A . Also assume that the frequencies of the starting attribute value of every second histogram sector are available. Observe that this can be computed in O(s) time, as opposed to O(L), where s is the number of sectors. Then it is possible to generate a T-ACM which has a sector width that is half of the sector width of H A and is much more superior than the initial T-ACM, T A . The strategy to achieve this is given in the method, Implement_T-ACM.
- T A is more accurate than the equi-width histogram H B .
- the area of a sector in T A may not be exactly equal to the actual number of tuples falling in that sector.
- T B the sector areas represent the actual number of tuples more accurately.
- the T-ACM, T C is obtained from T B .
- the T-ACM, T C can be expected to be more accurate than the T-ACM, T B , as its boundary frequencies are more accurate estimates based on the actual number of tuples falling within the sectors.
- the input to the method is an equi-width histogram with two sectors as shown in FIG. 36 ( a ).
- the starting frequency value of the first sector is 9 and the terminal frequency of the second sector is 15.
- the first step of the method merges these two sectors to create a single histogram sector shown in FIG. 36 ( b ).
- the experiments on the T-ACM using the U.S. CENSUS database consisted of three different groups.
- the first group of experiments were conducted as a performance comparison study of the traditional histograms and the T-ACM, using the row attribute values from the U.S. CENSUS database.
- the second group of experiments involved in the use of Zipf and multifractal distribution with the U.S. CENSUS database and were collected to study the behavior of the histograms and the T-ACM under various data distribution.
- the third group of experiments were conducted to verify the variance of the T-ACM and the estimation accuracy.
- the first group of experiments were conducted on equi-width, equi-depth histograms and the T-ACM. Different build-parameters are chosen for the histograms and the T-ACM in each of our experimental runs.
- the build-parameter for the equi-width histogram and the T-ACM is the sector width.
- the build-parameter for the equi-depth histogram is the number of tuples with a sector.
- the relative estimation error was obtained as a ratio by subtracting the estimated size from the actual results size and dividing it by the actual result size. Obviously, the cases where the actual result sizes were zero were not considered for error estimation.
- a simple query processor was implemented to compute the actual result size. The results were obtained by averaging the estimation errors over a number of experiments and are summarized in Table 32.
- the variance of the T-ACM under different build-parameters for equality-select, range-select and equi-join operations and the corresponding percentage estimation errors in this set of experiments were computed.
- the average percentage estimation errors and the corresponding variance of the T-ACM are given in Table 34. Note that the row numbers I, II, and III correspond to equality-select, range-select and equi-join operations respectively.
- the ability of a query optimizer to correctly identify a near optimal QEP heavily depends on how accurately the query result sizes are computed. Obviously, this, in turn, depends on how accurately the attribute cardinally maps, which are used to map the attribute values, reflect the underlying data distributions. Approximation to the underlying data distribution can be improved by changing the various build-parameters of the ACMs. These include, the tolerance value, ⁇ in the case of an R-ACM and, the sector width and slope of the trapezoids in the case of a T-ACM.
- Estimation accuracy of a query result size using an ACM depends on many inter-related factors such as,
- the first two factors namely the estimation error and the storage requirements are inversely related to each other. For example, an ACM with larger number of sectors would obviously result in higher estimation accuracy than an ACM with fewer sectors.
- the third factor, the type of data distribution is an important one in the result estimation accuracy. For example, a uniform data distribution is invariably associated with small estimation errors, whereas a Zipf or a multi-fractal data distribution tends to produce large estimation errors. Since the information about the underlying data distribution is not known a priori, the ACM design process should not make use of this knowledge.
- the last factor listed above is actually the interaction of the environment and the DBMS itself, and is obviously difficult to model a human behavior is difficult to predict.
- the function, ⁇ ( ⁇ ), of the estimation error is either the cumulative worst-case error of the ACM, E worst , or the variance of the ACM.
- the cumulative worst-case error of an R-ACM, E worst is the theoretical maximum worst-case error that is possible for a given R-ACM.
- the worst-case error in estimating an equality-select operation lies in the range of 0 ⁇ n j , where n j is the number of tuples in the j th T-ACM sector. Since this is not a narrow range as in the case of an R-ACM, the cumulative worst-case error for a T-ACM will not help us to derive a meaningful cost function. Hence the cost function is defined in this case as a function of the variance of the T-ACM itself.
- T-ACM variance of a T-ACM is dependent on the slopes of the individual trapezoids of the T-ACM. Consequently the variance can be expressed as a function ⁇ (tan ⁇ ) of tan ⁇ .
- the frequencies of the first attribute value of the first sector and the terminal attribute value of the second sector are fixed or rather known a priori.
- the aim now is to find the optimal slopes for these two sectors such that the estimation errors for the equality-select operation on each attribute value, within the sectors, are collectively or rather simultaneously minimal.
- an optimal frequency needs to be estimated for the attribute value that lies at the boundary of these two T-ACM sectors.
- the criterion function that required to be minimized is the average error for the frequencies of the entire attribute values within the sector. In other words, the objective is to find the straight line that minimizes the overall average estimation errors.
- This vertical distance ⁇ i represents the estimation error for the frequency of the attribute value ⁇ i .
- a common (near) optimal boundary value x b should be obtained from the above optimal boundary values x′ b and x′′ b of the individual sectors T 1 and T 2 respectively. It can now be shown that the average of x′ b and x′′ b is a suitable boundary value that minimizes the frequency estimation errors in both sectors simultaneously.
- Lemma 38 The average of the boundary values x′ b and x′′ b , which are optimal for the respective individual sectors, minimizes the estimation errors for both T-ACM sectors simultaneously.
- the lines AB and CD in FIG. 39 denote the optimal straight lines obtained from Lemma 37.
- the lines BQ and DQ thus denote the optimal boundary frequencies for the sectors T 1 and T 2 respectively.
- x′ b and
- x′′ b .
- the objective here is to find an optimal point P on BD so that it is possible to generate a pair of continuous trapezoidal sectors with straight line segments AP, and PC while minimizing the frequency estimation errors for the two sectors simultaneously. Assume that such an optimal point P lies on the line BD at distance ⁇ from point D as shown in FIG. 39 .
- the shaded triangular areas ABP and CDP represent the estimation errors resulting from choosing the lines AP and CP as the trapezoidal roofs instead of the initial lines AB and CD which were optimal for their respective individual sectors.
- Age_Error_Optimal_Boundaries computes a (near) optimal T-ACM directly from an equi-width histogram.
- the only additional information required is the frequency of the staring value of every second histogram sector. Since any additional information about other frequencies is not needed, an initial T-ACM is not required and thus it is possible to by-pass the process of generating a T-ACM using the Implement_T-ACM.
- ⁇ ⁇ Output ⁇ ⁇ A ⁇ ⁇ ( near ) ⁇ ⁇ optimal ⁇ ⁇ T ⁇ - ⁇ ACM .
- Lemma 37 uses actual frequency of every attribute value within the sector to compute the optimal slope, in practice this information is necessary.
- the slope of the trapezoid is completed only with the knowledge of the total number of tuples within the sector, and the frequency of the first attribute value of the sector.
- the T-ACM will return the actual frequency value as the estimate for X 1 . Thus there is no estimation error in this case.
- ⁇ be the slope (tangent of the angle) which the trapezoidal roof sector T 1 makes with the positive X ⁇ axis in order to provide minimal estimation error for the attribute values within the sector T 1 .
- ⁇ the slope (tangent of the angle) which the trapezoidal roof sector T 2 makes with the negative X-axis in order to provide minimal estimation error for the attribute values within the sector.
- FIG. 41 A plot of percentage estimation errors for equality-select operations against the frequency of the boundary attribute value, X 4 , in the above example is shown in FIG. 41 . Observe that the percentage estimation error is near 5% when the frequency of the boundary attribute value is near zero. As the frequency increases, the percentage estimation error gradually decreases and reaches its minimum at the frequency value of 17 ⁇ fraction (3/10) ⁇ . The percentage estimation error increases as the frequency increases beyond this optimal value.
- Equation (16) involves two variables, X and Y, it is sometimes referred to as the bivariate model.
- the intercept coefficient represents the value of Y when X equals zero.
- the slope coefficient represents the rate of the change in Y with respect to change in X. Whereas c has the same dimensions as Y, the dimensions of m equal the ratio of the dimensions of Y to X.
- the values of the slope and intercept coefficients of Equations (16) and (17) are computed using the principle of least squares.
- the principle of least squares is a process of obtaining best estimates of the coefficients and is referred to as a regression method. Regression is the tendency for the expected value of one or two jointly correlated random variables to approach more closely the mean value of its set than any other.
- the principle of least squares is used to regress Y on either X or X i values of Equations (16) and (17), respectively.
- Equation (19) After inserting the method of ⁇ , the objective function of Equation (19) is minimized by taking the derivatives with respect to each unknown, setting the derivatives equal to zero, and then solving for the unknowns.
- the solution requires the model for predicting Y i to be substituted into the objective function.
- an optimal boundary frequency for the attribute value in the boundary of two adjacent sectors is computed.
- the process involves computing the optimal slopes ⁇ and ⁇ for a pair of adjacent trapezoidal sectors and obtaining the optimal boundary values, x′ b and x′′ b for the respective individual sectors from them.
- the question of whether the mean of x′ b and x′′ b yields the overall (near) optimal solution for both the sectors remains open.
- the method LSE_Optimal_Boundaries computers a (near) optimal T-ACM directly from a T-ACM generated using the Implement_T-ACM. It is important to note that, unlike the previous method described in Section 7.3.1, the method requires the frequency value of every single attribute value in order to perform the optimization using the least squares method. The frequencies of the attribute values are obtained in a single scan of the attribute value domain from the DBMS catalogue periodically whenever such optimization is deemed necessary. In Method 7.8, a frequency value is denoted by x ji , where the first subscript j denotes the sector where the attribute values lies, and the second subscript i denotes the actual frequency value.
- Example 7 an optimal boundary value for the two sectors is obtained using the method of least squares as follows.
- an optimal frequency of the boundary attribute value X 4 can be estimated so as to minimize the estimation errors simultaneously for all the 7 attribute values in the sectors T 1 and T 2 .
- FIG. 43 is a plot of the percentage estimation errors for the above example, using equality-select operations against the frequency of the boundary attribute value, X 4 . Comparing this with the plot given in 41, we see that the boundary value estimation using the method of least squares errors is marginally more accurate than using the method of average errors.
- the R-ACM and the T-ACM were treated as two fundamental and distinct schemes for query result size estimation. There is no reason these two schemes cannot be incorporated into a single scheme which has the advantages of the superior properties of both of them.
- the automaton decides to partition one or more sectors of an R-ACM with smaller tolerance values generating a new structure with multiple tolerance values.
- This approach is useful whenever there is a need for a higher degree of estimation accuracy for a particular attribute value range. This idea is easily explained with an example.
- the automaton or learning mechanism simultaneously decides to partition some of the sectors using a trapezoidal partitioning method resulting in a new structure that combines the properties of the R-ACM and the T-ACM in a hierarchical manner.
- FIG. 46 shows an example where one of the heavily used sectors (sector 3) is partitioned using the trapezoidal method. The number of sectors for the secondary partitioning should be based on the available storage.
- the ranges are multi-dimensional ranges and the resulting histogram is a multi-dimensional histogram.
- Multi-dimensional histograms are known and application of the present invention to generating a multi-dimensional histogram is straightforward for one of skill in the art.
- a histogram according to the present invention is useful in any application wherein a histogram according to the prior art is used.
- an arithmetic mean is compared to selected elements to determine whether or not to include them in a current bin, it is known that no element diverged from the arithmetic mean by more than a predetermined amount when added.
- some values fall above the mean and some below.
- every two successively added elements are within twice the predetermined value from each other. This follows from careful analysis of the present invention.
- the present invention relates to providing a histogram with additional data determinable therefrom, the additional data relating to accuracy of data estimated using the histogram. As such, it is extremely beneficial to use a histogram according to the present invention over one according to the prior art.
- a T-ACM is determinable from an R-ACM.
- create an R-ACM with the predetermined spacing of 2 and the statistical value being the minimium value associated with an element in a bin.
- a typical bin is skewed in a downward direction.
- an R-ACM can be formed using the statistical value of the maximum value associated with an element in a bin.
- the resulting histograms will have longer bins where f(x) is substantially flat or is somewhat monotonically increasing or decreasing. Merging the two histograms results in a plurality of ranges that is extremely useful in generating a T-ACM.
- the resulting T-ACM has bin sizes that are well suited to approximating the values therein with straight lines while minimizing the error in estimating those values.
- R-ACM and T-ACM generation techniques are also within the scope of the present invention.
- Any R-ACM and T-ACM generation technique which compares the Generalized means to the elements to be included in the bins, and which uses multiplications insetead of divisions, is also within the scope of the present invention.
Landscapes
- Engineering & Computer Science (AREA)
- Theoretical Computer Science (AREA)
- Physics & Mathematics (AREA)
- Databases & Information Systems (AREA)
- Data Mining & Analysis (AREA)
- Computational Linguistics (AREA)
- General Engineering & Computer Science (AREA)
- General Physics & Mathematics (AREA)
- Operations Research (AREA)
- Probability & Statistics with Applications (AREA)
- Fuzzy Systems (AREA)
- Mathematical Physics (AREA)
- Software Systems (AREA)
- Complex Calculations (AREA)
- Information Retrieval, Db Structures And Fs Structures Therefor (AREA)
- Image Analysis (AREA)
Applications Claiming Priority (1)
| Application Number | Priority Date | Filing Date | Title |
|---|---|---|---|
| CA2279359A CA2279359C (fr) | 1999-07-30 | 1999-07-30 | Methode de generation de cartes de cardinalite d'attributs |
Publications (1)
| Publication Number | Publication Date |
|---|---|
| US6865567B1 true US6865567B1 (en) | 2005-03-08 |
Family
ID=4163900
Family Applications (1)
| Application Number | Title | Priority Date | Filing Date |
|---|---|---|---|
| US09/487,328 Expired - Lifetime US6865567B1 (en) | 1999-07-30 | 2000-01-19 | Method of generating attribute cardinality maps |
Country Status (2)
| Country | Link |
|---|---|
| US (1) | US6865567B1 (fr) |
| CA (2) | CA2279359C (fr) |
Cited By (146)
| Publication number | Priority date | Publication date | Assignee | Title |
|---|---|---|---|---|
| US20030018615A1 (en) * | 1999-03-15 | 2003-01-23 | Microsoft Corporation | Sampling for database systems |
| US20030033582A1 (en) * | 2001-05-09 | 2003-02-13 | Wavemarket, Inc. | Representations for estimating distance |
| US20030212702A1 (en) * | 2002-05-10 | 2003-11-13 | Campos Marcos M. | Orthogonal partitioning clustering |
| US20040044683A1 (en) * | 2000-07-31 | 2004-03-04 | Furusho Shinji | Data compiling method |
| US20040049492A1 (en) * | 2002-09-09 | 2004-03-11 | Lucent Technologies Inc. | Distinct sampling system and a method of distinct sampling for a database |
| US20040093413A1 (en) * | 2002-11-06 | 2004-05-13 | Bean Timothy E. | Selecting and managing time specified segments from a large continuous capture of network data |
| US20040158551A1 (en) * | 2003-02-06 | 2004-08-12 | International Business Machines Corporation | Patterned based query optimization |
| US20040193629A1 (en) * | 2001-05-31 | 2004-09-30 | Oracle International Corporation | Method and system for sample size determination for database optimizers |
| US20040220896A1 (en) * | 2003-04-30 | 2004-11-04 | International Business Machines Corporation | System and method for optimizing queries on views defined by conditional expressions having mutually exclusive conditions |
| US20040260675A1 (en) * | 2003-06-19 | 2004-12-23 | Microsoft Corporation | Cardinality estimation of joins |
| US20040267713A1 (en) * | 2003-06-24 | 2004-12-30 | Microsoft Corporation | String predicate selectivity estimation |
| US20050027955A1 (en) * | 2003-08-01 | 2005-02-03 | Wai Lam | Method and system for synchronizing storage system data |
| US20050060302A1 (en) * | 2003-08-27 | 2005-03-17 | Sap Aktiengesellschaft | Computer implemented method and according computer program product for storing data sets in and retrieving data sets from a data storage system |
| US20050097091A1 (en) * | 2003-09-06 | 2005-05-05 | Oracle International Corporation | SQL tuning base |
| US20050102613A1 (en) * | 2003-11-07 | 2005-05-12 | Microsoft Corporation | Generating a hierarchical plain-text execution plan from a database query |
| US20050146951A1 (en) * | 2001-12-28 | 2005-07-07 | Celestar Lexico-Sciences, Inc | Knowledge search apparatus knowledge search method program and recording medium |
| US20050147297A1 (en) * | 2002-03-04 | 2005-07-07 | Mclaughlin Robert A. | Unsupervised data segmentation |
| US20050192947A1 (en) * | 2002-07-09 | 2005-09-01 | Gerald Mischke | Method for control, analysis and simulation of research, development, manufacturing and distribution processes |
| US20050223019A1 (en) * | 2004-03-31 | 2005-10-06 | Microsoft Corporation | Block-level sampling in statistics estimation |
| US20060005121A1 (en) * | 2004-06-30 | 2006-01-05 | Microsoft Corporation | Discretization of dimension attributes using data mining techniques |
| US20060026008A1 (en) * | 2004-07-27 | 2006-02-02 | Xerox Corporation | Method and system for managing resources for multi-service jobs based on location |
| US20060074874A1 (en) * | 2004-09-30 | 2006-04-06 | International Business Machines Corporation | Method and apparatus for re-evaluating execution strategy for a database query |
| US20060074875A1 (en) * | 2004-09-30 | 2006-04-06 | International Business Machines Corporation | Method and apparatus for predicting relative selectivity of database query conditions using respective cardinalities associated with different subsets of database records |
| US20060136368A1 (en) * | 2004-12-22 | 2006-06-22 | Ianywhere Solutions, Inc. | Database System and Methodology for Generalized Order Optimization |
| US20060149742A1 (en) * | 2004-12-30 | 2006-07-06 | Daniel Egnor | Classification of ambiguous geographic references |
| US7085769B1 (en) * | 2001-04-26 | 2006-08-01 | Ncr Corporation | Method and apparatus for performing hash join |
| US20060179171A1 (en) * | 2003-03-19 | 2006-08-10 | Stefaniak Joseph P | Server consolidation analysis |
| US20060294087A1 (en) * | 2005-06-23 | 2006-12-28 | Vladimir Mordvinov | System and method for processing and decomposition of a multidimensional query against a relational data source |
| US20070005639A1 (en) * | 2005-06-29 | 2007-01-04 | Xerox Corporation | Categorization including dependencies between different category systems |
| US7185004B1 (en) | 2005-12-09 | 2007-02-27 | International Business Machines Corporation | System and method for reverse routing materialized query tables in a database |
| US20070061305A1 (en) * | 2005-09-13 | 2007-03-15 | Soufiane Azizi | System and method of providing date, arithmetic and other relational functions for OLAP sources |
| US20070061318A1 (en) * | 2005-09-13 | 2007-03-15 | Soufiane Azizi | System and method of data source agnostic querying |
| US20070098271A1 (en) * | 2005-11-02 | 2007-05-03 | Kitakyushu Foundation For The Advancement Of Industry, Science And Technology | Apparatus and method for image coding |
| US20070136317A1 (en) * | 2005-12-08 | 2007-06-14 | International Business Machines Corporation | Estimating the size of a join by generating and combining partial join estimates |
| US20070143314A1 (en) * | 2005-12-21 | 2007-06-21 | Dirk Thomsen | Determination of database statistics using application logic |
| US20070192060A1 (en) * | 2006-02-14 | 2007-08-16 | Hongsee Yam | Web-based system of product performance assessment and quality control using adaptive PDF fitting |
| US7260563B1 (en) * | 2003-10-08 | 2007-08-21 | Ncr Corp. | Efficient costing for inclusion merge join |
| US20070208696A1 (en) * | 2006-03-03 | 2007-09-06 | Louis Burger | Evaluating materialized views in a database system |
| US20070226237A1 (en) * | 2006-03-23 | 2007-09-27 | Oracle International Corporation | Discovering functional dependencies by sampling relations |
| US20070233634A1 (en) * | 2006-04-03 | 2007-10-04 | Vincent Corvinelli | Method and system for estimating cardinality in a database system |
| US20070244849A1 (en) * | 2001-12-18 | 2007-10-18 | Predovic Daniel T | Method and system for access and display of data from large data sets |
| US20070282888A1 (en) * | 2006-05-31 | 2007-12-06 | Sun Microsystems, Inc. | Dynamic data stream histograms for large ranges |
| US20080010267A1 (en) * | 2006-06-26 | 2008-01-10 | Lipyeow Lim | Classification-based method and apparatus for string selectivity estimation |
| US20080065616A1 (en) * | 2006-09-13 | 2008-03-13 | Brown Abby H | Metadata integration tool, systems and methods for managing enterprise metadata for the runtime environment |
| US20080077586A1 (en) * | 2006-08-18 | 2008-03-27 | Wai Lam | System and method for identifying and mitigating redundancies in stored data |
| US20080154901A1 (en) * | 2004-11-30 | 2008-06-26 | International Business Machines Corporation | Methods and systems for ordering query results based on annotations |
| US20080222092A1 (en) * | 2007-02-09 | 2008-09-11 | Fabian Hueske | Automatically determining optimization frequencies of queries with parameter markers |
| US20080235192A1 (en) * | 2007-03-19 | 2008-09-25 | Mitsuhisa Kanaya | Information retrieval system and information retrieval method |
| US20080288527A1 (en) * | 2007-05-16 | 2008-11-20 | Yahoo! Inc. | User interface for graphically representing groups of data |
| US20080294595A1 (en) * | 2007-05-22 | 2008-11-27 | Yahoo! Inc. | Visual interface to indicate custom binning of items |
| US20090063616A1 (en) * | 2007-08-27 | 2009-03-05 | International Business Machines Corporation | Apparatus, system, and method for controlling a processing system |
| US20090070313A1 (en) * | 2007-09-10 | 2009-03-12 | Kevin Scott Beyer | Adaptively reordering joins during query execution |
| US20090182695A1 (en) * | 2008-01-14 | 2009-07-16 | Fujitsu Limited | Multi-objective optimal design support device and method taking manufacturing variations into consideration |
| US20090182539A1 (en) * | 2008-01-14 | 2009-07-16 | Fujitsu Limited | Multi-objective optimal design support device, method and program storage medium |
| US20090182538A1 (en) * | 2008-01-14 | 2009-07-16 | Fujitsu Limited | Multi-objective optimum design support device using mathematical process technique, its method and program |
| US20090192980A1 (en) * | 2008-01-30 | 2009-07-30 | International Business Machines Corporation | Method for Estimating the Number of Distinct Values in a Partitioned Dataset |
| US20090307187A1 (en) * | 2008-02-28 | 2009-12-10 | Amir Averbuch | Tree automata based methods for obtaining answers to queries of semi-structured data stored in a database environment |
| US20100010989A1 (en) * | 2008-07-03 | 2010-01-14 | The Regents Of The University Of California | Method for Efficiently Supporting Interactive, Fuzzy Search on Structured Data |
| US20100082602A1 (en) * | 2008-07-05 | 2010-04-01 | Archana Sulochana Ganapathi | Predicting Performance Of Multiple Queries Executing In A Database |
| US20100100420A1 (en) * | 2008-10-21 | 2010-04-22 | Anderson James R | Target marketing method and system |
| US20100131490A1 (en) * | 2008-11-26 | 2010-05-27 | Vertica Systems, Inc. | Modular query optimizer |
| US20100131444A1 (en) * | 2008-11-26 | 2010-05-27 | Sap Ag | Combining multiple objective functions in algorithmic problem solving |
| US7739229B2 (en) | 2007-05-22 | 2010-06-15 | Yahoo! Inc. | Exporting aggregated and un-aggregated data |
| US20100153074A1 (en) * | 2008-12-17 | 2010-06-17 | Fujitsu Limited | Design support apparatus |
| US20100287015A1 (en) * | 2009-05-11 | 2010-11-11 | Grace Au | Method for determining the cost of evaluating conditions |
| US20100325134A1 (en) * | 2009-06-23 | 2010-12-23 | International Business Machines Corporation | Accuracy measurement of database search algorithms |
| US7987195B1 (en) | 2008-04-08 | 2011-07-26 | Google Inc. | Dynamic determination of location-identifying search phrases |
| US20110184934A1 (en) * | 2010-01-28 | 2011-07-28 | Choudur Lakshminarayan | Wavelet compression with bootstrap sampling |
| US20110289071A1 (en) * | 2010-05-20 | 2011-11-24 | International Business Machines Corporation | Dynamic self configuring overlays |
| US20110295652A1 (en) * | 2010-05-25 | 2011-12-01 | Feder Patrick C | Methods and systems for demonstrating and applying productivity gains |
| US8122056B2 (en) | 2007-05-17 | 2012-02-21 | Yahoo! Inc. | Interactive aggregation of data on a scatter plot |
| US20120136879A1 (en) * | 2010-11-29 | 2012-05-31 | Eric Williamson | Systems and methods for filtering interpolated input data based on user-supplied or other approximation constraints |
| US8229917B1 (en) * | 2011-02-24 | 2012-07-24 | International Business Machines Corporation | Database query optimization using clustering data mining |
| US20130166351A1 (en) * | 2011-12-21 | 2013-06-27 | Ramprasad Arunachalam | System and Method for Generating a Marketing-Mix Solution |
| US20130212085A1 (en) * | 2012-02-09 | 2013-08-15 | Ianywhere Solutions, Inc. | Parallelizing Query Optimization |
| US8694524B1 (en) * | 2006-08-28 | 2014-04-08 | Teradata Us, Inc. | Parsing a query |
| US20140114950A1 (en) * | 2012-10-22 | 2014-04-24 | Microsoft Corporation | Formulating global statistics for distributed databases |
| US20140149388A1 (en) * | 2012-11-26 | 2014-05-29 | International Business Machines Corporation | Method and system for estimating the size of a joined table |
| US20140149433A1 (en) * | 2012-11-27 | 2014-05-29 | Hewlett-Packard Development Company, L.P. | Estimating Unique Entry Counts Using a Counting Bloom Filter |
| US8812484B2 (en) | 2010-03-30 | 2014-08-19 | Hewlett-Packard Development Company, L.P. | System and method for outer joins on a parallel database management system |
| US20140280317A1 (en) * | 2013-03-15 | 2014-09-18 | University Of Florida Research Foundation, Incorporated | Efficient publish/subscribe systems |
| US20150081658A1 (en) * | 2013-09-18 | 2015-03-19 | Ims Health Incorporated | System and method for fast query response |
| US9015073B2 (en) * | 2012-06-06 | 2015-04-21 | Addepar, Inc. | Controlled creation of reports from table views |
| US20150193497A1 (en) * | 2014-01-06 | 2015-07-09 | Cisco Technology, Inc. | Method and system for acquisition, normalization, matching, and enrichment of data |
| US9087361B2 (en) | 2012-06-06 | 2015-07-21 | Addepar, Inc. | Graph traversal for generating table views |
| US9105064B2 (en) | 2012-12-13 | 2015-08-11 | Addepar, Inc. | Transaction effects |
| US9135300B1 (en) * | 2012-12-20 | 2015-09-15 | Emc Corporation | Efficient sampling with replacement |
| US20150261820A1 (en) * | 2014-03-13 | 2015-09-17 | Xun Cheng | Splitting of a join operation to allow parallelization |
| US20150339360A1 (en) * | 2014-05-23 | 2015-11-26 | International Business Machines Corporation | Processing a data set |
| US9208198B2 (en) | 2012-10-17 | 2015-12-08 | International Business Machines Corporation | Technique for factoring uncertainty into cost-based query optimization |
| US20150363519A1 (en) * | 2014-06-17 | 2015-12-17 | Paul Pallath | Consistency of visual discoveries |
| US9218502B1 (en) | 2014-10-17 | 2015-12-22 | Addepar, Inc. | System and architecture for electronic permissions and security policies for resources in a data system |
| US9244899B1 (en) | 2014-10-03 | 2016-01-26 | Addepar, Inc. | Systems and user interfaces for dynamic and interactive table generation and editing based on automatic traversal of complex data structures including time varying attributes |
| US9361339B2 (en) | 2013-11-26 | 2016-06-07 | Sap Se | Methods and systems for constructing q, θ-optimal histogram buckets |
| US9411853B1 (en) * | 2012-08-03 | 2016-08-09 | Healthstudio, LLC | In-memory aggregation system and method of multidimensional data processing for enhancing speed and scalability |
| US9424333B1 (en) | 2014-09-05 | 2016-08-23 | Addepar, Inc. | Systems and user interfaces for dynamic and interactive report generation and editing based on automatic traversal of complex data structures |
| US20160260011A1 (en) * | 2015-03-05 | 2016-09-08 | International Business Machines Corporation | Cardinality estimation using artificial neural networks |
| US9495419B1 (en) * | 2015-12-16 | 2016-11-15 | International Business Machines Corporation | Runtime optimization for multi-index access |
| WO2017014826A1 (fr) * | 2015-07-23 | 2017-01-26 | Hrl Laboratories, Llc | Algorithme de sélection de caractéristiques de fenêtre de parzen d'analyse formelle de concepts (fca) |
| US20170031976A1 (en) * | 2015-07-29 | 2017-02-02 | Oracle International Corporation | Materializing internal computations in-memory to improve query performance |
| US20170286487A1 (en) * | 2015-01-16 | 2017-10-05 | International Business Machines Corporation | Database statistical histogram forecasting |
| US9785645B1 (en) * | 2013-09-24 | 2017-10-10 | EMC IP Holding Company LLC | Database migration management |
| US9836505B2 (en) | 2014-03-13 | 2017-12-05 | Sybase, Inc. | Star and snowflake join query performance |
| US9852181B2 (en) * | 2012-12-04 | 2017-12-26 | International Business Machines Corporation | Optimizing an order of execution of multiple join operations |
| US9875087B2 (en) * | 2015-04-10 | 2018-01-23 | Oracle International Corporation | Declarative program engine for large-scale program analysis |
| US9910892B2 (en) | 2008-07-05 | 2018-03-06 | Hewlett Packard Enterprise Development Lp | Managing execution of database queries |
| US20180181542A1 (en) * | 2016-12-28 | 2018-06-28 | Sap Se | Constructing join histograms from histograms with q-error guarantees |
| US20180210938A1 (en) * | 2014-01-31 | 2018-07-26 | Sybase, Inc. | Safe synchronization of parallel data operator trees |
| US20180349457A1 (en) * | 2014-02-19 | 2018-12-06 | Snowflake Computing, Inc. | Adaptive Distribution Method For Hash Operation |
| US10162859B2 (en) * | 2016-10-31 | 2018-12-25 | International Business Machines Corporation | Delayable query |
| US10204135B2 (en) | 2015-07-29 | 2019-02-12 | Oracle International Corporation | Materializing expressions within in-memory virtual column units to accelerate analytic queries |
| US10210209B2 (en) * | 2010-10-07 | 2019-02-19 | Sap Se | Hybrid query execution plan |
| WO2019118647A1 (fr) * | 2017-12-13 | 2019-06-20 | Paypal, Inc | Fusion de données sur la base d'une proximité et d'une validation |
| US10346398B2 (en) * | 2017-03-07 | 2019-07-09 | International Business Machines Corporation | Grouping in analytical databases |
| US10360506B2 (en) | 2014-07-23 | 2019-07-23 | Hrl Laboratories, Llc | General formal concept analysis (FCA) framework for classification |
| US10372807B1 (en) | 2015-11-11 | 2019-08-06 | Addepar, Inc. | Systems and user interfaces for dynamic and interactive table generation and editing based on automatic traversal of complex data structures in a distributed system architecture |
| US10409835B2 (en) * | 2014-11-28 | 2019-09-10 | Microsoft Technology Licensing, Llc | Efficient data manipulation support |
| WO2019147201A3 (fr) * | 2017-07-26 | 2019-09-19 | Istanbul Sehir Universitesi | Procédé d'estimation pour la grappe de résultats de l'interrogation réalisée pour rechercher une chaîne dans une base de données |
| US10452656B2 (en) * | 2016-03-31 | 2019-10-22 | Sap Se | Deep filter propagation using explicit dependency and equivalency declarations in a data model |
| US10671917B1 (en) | 2014-07-23 | 2020-06-02 | Hrl Laboratories, Llc | System for mapping extracted Neural activity into Neuroceptual graphs |
| US10706354B2 (en) | 2016-05-06 | 2020-07-07 | International Business Machines Corporation | Estimating cardinality selectivity utilizing artificial neural networks |
| US10732810B1 (en) | 2015-11-06 | 2020-08-04 | Addepar, Inc. | Systems and user interfaces for dynamic and interactive table generation and editing based on automatic traversal of complex data structures including summary data such as time series data |
| CN111784246A (zh) * | 2020-07-01 | 2020-10-16 | 深圳市检验检疫科学研究院 | 物流路径的估测方法 |
| CN112082910A (zh) * | 2020-09-08 | 2020-12-15 | 长沙理工大学 | 一种基于多重分形的负载型金属催化剂表面金属分散度的表征方法 |
| US10949438B2 (en) | 2017-03-08 | 2021-03-16 | Microsoft Technology Licensing, Llc | Database query for histograms |
| US10977240B1 (en) * | 2017-10-21 | 2021-04-13 | Palantir Technologies Inc. | Approaches for validating data |
| US11068520B1 (en) * | 2016-11-06 | 2021-07-20 | Tableau Software, Inc. | Optimizing database query execution by extending the relational algebra to include non-standard join operators |
| US11080276B2 (en) * | 2018-02-23 | 2021-08-03 | Sap Se | Optimal ranges for relational query execution plans |
| CN113220806A (zh) * | 2021-03-15 | 2021-08-06 | 中山大学 | 一种基于衍生平行线段的大规模路网方向判定方法及系统 |
| US11153400B1 (en) | 2019-06-04 | 2021-10-19 | Thomas Layne Bascom | Federation broker system and method for coordinating discovery, interoperability, connections and correspondence among networked resources |
| US11211943B2 (en) | 2016-11-06 | 2021-12-28 | Tableau Software, Inc. | Hybrid comparison for unicode text strings consisting primarily of ASCII characters |
| US11226955B2 (en) | 2018-06-28 | 2022-01-18 | Oracle International Corporation | Techniques for enabling and integrating in-memory semi-structured data and text document searches with in-memory columnar query processing |
| US20220188308A1 (en) * | 2020-12-11 | 2022-06-16 | International Business Machines Corporation | Selecting access flow path in complex queries |
| US11392572B2 (en) * | 2020-03-02 | 2022-07-19 | Sap Se | Selectivity estimation using non-qualifying tuples |
| CN114969029A (zh) * | 2022-04-22 | 2022-08-30 | 南京航空航天大学 | 一种基于泰勒展开的多维插值方案及其维间点取值方法 |
| US11443390B1 (en) | 2015-11-06 | 2022-09-13 | Addepar, Inc. | Systems and user interfaces for dynamic and interactive table generation and editing based on automatic traversal of complex data structures and incorporation of metadata mapped to the complex data structures |
| US11455302B2 (en) * | 2020-05-15 | 2022-09-27 | Microsoft Technology Licensing, Llc | Distributed histogram computation framework using data stream sketches and samples |
| US11599540B2 (en) * | 2014-08-07 | 2023-03-07 | Coupang Corp. | Query execution apparatus, method, and system for processing data, query containing a composite primitive |
| US20230259106A1 (en) * | 2020-07-08 | 2023-08-17 | Sanofi | Method for Monitoring a Production Process and Corresponding Technical Issues |
| US20230367787A1 (en) * | 2022-05-12 | 2023-11-16 | Truist Bank | Construction of a meta-database from autonomously scanned disparate and heterogeneous sources |
| US12164517B2 (en) * | 2023-01-03 | 2024-12-10 | Adobe Inc. | Approximate query processing for join queries |
| US20250036624A1 (en) * | 2023-07-25 | 2025-01-30 | Beijing Volcano Engine Technology Co., Ltd. | Data query method based on online analytical processing, medium, and device |
| US12282478B2 (en) * | 2019-04-03 | 2025-04-22 | Hasso-Plattner-Institut für Digital Engineering gGmbH | Iterative multi-attribute index selection for large database systems |
| US12386834B1 (en) * | 2024-06-17 | 2025-08-12 | Sap Se | Using worst-case predicate selectivity for database query plans |
| US12406183B2 (en) | 2022-05-12 | 2025-09-02 | Truist Bank | Accelerated model training from disparate and heterogeneous sources using a meta-database |
| US12455900B1 (en) | 2023-03-07 | 2025-10-28 | QEngine LLC | Method for executing a query in a multi-dimensional data space using vectorization and a related system |
Families Citing this family (3)
| Publication number | Priority date | Publication date | Assignee | Title |
|---|---|---|---|---|
| US11002552B2 (en) * | 2016-04-06 | 2021-05-11 | Mitsubishi Electric Corporation | Map data generation system and method for generating map data |
| CN111159316B (zh) * | 2020-02-14 | 2023-03-14 | 北京百度网讯科技有限公司 | 关系型数据库查询方法、装置、电子设备及存储介质 |
| CN112837250B (zh) * | 2021-01-27 | 2023-03-10 | 武汉华中数控股份有限公司 | 一种基于广义直方图均衡的红外图像自适应增强方法 |
Citations (10)
| Publication number | Priority date | Publication date | Assignee | Title |
|---|---|---|---|---|
| US588968A (en) * | 1897-08-31 | Vehicle-brake | ||
| US4950894A (en) * | 1985-01-25 | 1990-08-21 | Fuji Photo Film Co., Ltd. | Radiation image read-out method |
| US4956774A (en) * | 1988-09-02 | 1990-09-11 | International Business Machines Corporation | Data base optimizer using most frequency values statistics |
| US5167228A (en) * | 1987-06-26 | 1992-12-01 | Brigham And Women's Hospital | Assessment and modification of endogenous circadian phase and amplitude |
| US5883968A (en) * | 1994-07-05 | 1999-03-16 | Aw Computer Systems, Inc. | System and methods for preventing fraud in retail environments, including the detection of empty and non-empty shopping carts |
| US5950185A (en) * | 1996-05-20 | 1999-09-07 | Lucent Technologies Inc. | Apparatus and method for approximating frequency moments |
| US5987468A (en) * | 1997-12-12 | 1999-11-16 | Hitachi America Ltd. | Structure and method for efficient parallel high-dimensional similarity join |
| US6146830A (en) * | 1998-09-23 | 2000-11-14 | Rosetta Inpharmatics, Inc. | Method for determining the presence of a number of primary targets of a drug |
| US6278989B1 (en) * | 1998-08-25 | 2001-08-21 | Microsoft Corporation | Histogram construction using adaptive random sampling with cross-validation for database systems |
| US6401088B1 (en) * | 1999-02-09 | 2002-06-04 | At&T Corp. | Method and apparatus for substring selectivity estimation |
-
1999
- 1999-07-30 CA CA2279359A patent/CA2279359C/fr not_active Expired - Fee Related
- 1999-07-30 CA CA2743462A patent/CA2743462C/fr not_active Expired - Fee Related
-
2000
- 2000-01-19 US US09/487,328 patent/US6865567B1/en not_active Expired - Lifetime
Patent Citations (10)
| Publication number | Priority date | Publication date | Assignee | Title |
|---|---|---|---|---|
| US588968A (en) * | 1897-08-31 | Vehicle-brake | ||
| US4950894A (en) * | 1985-01-25 | 1990-08-21 | Fuji Photo Film Co., Ltd. | Radiation image read-out method |
| US5167228A (en) * | 1987-06-26 | 1992-12-01 | Brigham And Women's Hospital | Assessment and modification of endogenous circadian phase and amplitude |
| US4956774A (en) * | 1988-09-02 | 1990-09-11 | International Business Machines Corporation | Data base optimizer using most frequency values statistics |
| US5883968A (en) * | 1994-07-05 | 1999-03-16 | Aw Computer Systems, Inc. | System and methods for preventing fraud in retail environments, including the detection of empty and non-empty shopping carts |
| US5950185A (en) * | 1996-05-20 | 1999-09-07 | Lucent Technologies Inc. | Apparatus and method for approximating frequency moments |
| US5987468A (en) * | 1997-12-12 | 1999-11-16 | Hitachi America Ltd. | Structure and method for efficient parallel high-dimensional similarity join |
| US6278989B1 (en) * | 1998-08-25 | 2001-08-21 | Microsoft Corporation | Histogram construction using adaptive random sampling with cross-validation for database systems |
| US6146830A (en) * | 1998-09-23 | 2000-11-14 | Rosetta Inpharmatics, Inc. | Method for determining the presence of a number of primary targets of a drug |
| US6401088B1 (en) * | 1999-02-09 | 2002-06-04 | At&T Corp. | Method and apparatus for substring selectivity estimation |
Cited By (312)
| Publication number | Priority date | Publication date | Assignee | Title |
|---|---|---|---|---|
| US7567949B2 (en) * | 1999-03-15 | 2009-07-28 | Microsoft Corporation | Sampling for database systems |
| US20030018615A1 (en) * | 1999-03-15 | 2003-01-23 | Microsoft Corporation | Sampling for database systems |
| US7225198B2 (en) * | 2000-07-31 | 2007-05-29 | Turbo Data Laboratories, Inc. | Data compiling method |
| US20040044683A1 (en) * | 2000-07-31 | 2004-03-04 | Furusho Shinji | Data compiling method |
| US7085769B1 (en) * | 2001-04-26 | 2006-08-01 | Ncr Corporation | Method and apparatus for performing hash join |
| US20030033582A1 (en) * | 2001-05-09 | 2003-02-13 | Wavemarket, Inc. | Representations for estimating distance |
| US20040193629A1 (en) * | 2001-05-31 | 2004-09-30 | Oracle International Corporation | Method and system for sample size determination for database optimizers |
| US20070244849A1 (en) * | 2001-12-18 | 2007-10-18 | Predovic Daniel T | Method and system for access and display of data from large data sets |
| US7899844B2 (en) * | 2001-12-18 | 2011-03-01 | Siebel Systems, Inc. | Method and system for access and display of data from large data sets |
| US20050146951A1 (en) * | 2001-12-28 | 2005-07-07 | Celestar Lexico-Sciences, Inc | Knowledge search apparatus knowledge search method program and recording medium |
| US20050147297A1 (en) * | 2002-03-04 | 2005-07-07 | Mclaughlin Robert A. | Unsupervised data segmentation |
| US20030212702A1 (en) * | 2002-05-10 | 2003-11-13 | Campos Marcos M. | Orthogonal partitioning clustering |
| US7174344B2 (en) * | 2002-05-10 | 2007-02-06 | Oracle International Corporation | Orthogonal partitioning clustering |
| US20050192947A1 (en) * | 2002-07-09 | 2005-09-01 | Gerald Mischke | Method for control, analysis and simulation of research, development, manufacturing and distribution processes |
| US7707145B2 (en) * | 2002-07-09 | 2010-04-27 | Gerald Mischke | Method for control, analysis and simulation of research, development, manufacturing and distribution processes |
| US7047230B2 (en) * | 2002-09-09 | 2006-05-16 | Lucent Technologies Inc. | Distinct sampling system and a method of distinct sampling for optimizing distinct value query estimates |
| US20040049492A1 (en) * | 2002-09-09 | 2004-03-11 | Lucent Technologies Inc. | Distinct sampling system and a method of distinct sampling for a database |
| US20040093413A1 (en) * | 2002-11-06 | 2004-05-13 | Bean Timothy E. | Selecting and managing time specified segments from a large continuous capture of network data |
| US20040158551A1 (en) * | 2003-02-06 | 2004-08-12 | International Business Machines Corporation | Patterned based query optimization |
| US7031958B2 (en) * | 2003-02-06 | 2006-04-18 | International Business Machines Corporation | Patterned based query optimization |
| US20060179171A1 (en) * | 2003-03-19 | 2006-08-10 | Stefaniak Joseph P | Server consolidation analysis |
| US20040220896A1 (en) * | 2003-04-30 | 2004-11-04 | International Business Machines Corporation | System and method for optimizing queries on views defined by conditional expressions having mutually exclusive conditions |
| US7299226B2 (en) * | 2003-06-19 | 2007-11-20 | Microsoft Corporation | Cardinality estimation of joins |
| US20040260675A1 (en) * | 2003-06-19 | 2004-12-23 | Microsoft Corporation | Cardinality estimation of joins |
| US7149735B2 (en) * | 2003-06-24 | 2006-12-12 | Microsoft Corporation | String predicate selectivity estimation |
| US20040267713A1 (en) * | 2003-06-24 | 2004-12-30 | Microsoft Corporation | String predicate selectivity estimation |
| US9575676B2 (en) | 2003-08-01 | 2017-02-21 | Falconstor, Inc. | Methods for synchronizing storage system data |
| US7155585B2 (en) * | 2003-08-01 | 2006-12-26 | Falconstor Software, Inc. | Method and system for synchronizing storage system data |
| US9280424B2 (en) | 2003-08-01 | 2016-03-08 | Falconstor, Inc. | Methods for synchronizing storage system data |
| US8671255B2 (en) | 2003-08-01 | 2014-03-11 | Falconstor, Inc. | Methods for synchronizing storage system data |
| US20050027955A1 (en) * | 2003-08-01 | 2005-02-03 | Wai Lam | Method and system for synchronizing storage system data |
| US20100011181A1 (en) * | 2003-08-01 | 2010-01-14 | Wai Lam | Methods for synchronizing storage system data |
| US20070106852A1 (en) * | 2003-08-01 | 2007-05-10 | Wai Lam | Method and system for synchronizing storage system data |
| US8145860B2 (en) | 2003-08-01 | 2012-03-27 | Falconstor, Inc. | Methods for synchronizing storage system data |
| US7590808B2 (en) * | 2003-08-01 | 2009-09-15 | Falconstor, Inc. | Method and system for synchronizing storage system data |
| US20050060302A1 (en) * | 2003-08-27 | 2005-03-17 | Sap Aktiengesellschaft | Computer implemented method and according computer program product for storing data sets in and retrieving data sets from a data storage system |
| US7373340B2 (en) * | 2003-08-27 | 2008-05-13 | Sap Aktiengesellschaft | Computer implemented method and according computer program product for storing data sets in and retrieving data sets from a data storage system |
| US7664730B2 (en) | 2003-09-06 | 2010-02-16 | Oracle International Corporation | Method and system for implementing a SQL profile |
| US7739263B2 (en) | 2003-09-06 | 2010-06-15 | Oracle International Corporation | Global hints |
| US20050125398A1 (en) * | 2003-09-06 | 2005-06-09 | Oracle International Corporation | Global hints |
| US8983934B2 (en) | 2003-09-06 | 2015-03-17 | Oracle International Corporation | SQL tuning base |
| US20050120001A1 (en) * | 2003-09-06 | 2005-06-02 | Oracle International Corporation | SQL structure analyzer |
| US20050125393A1 (en) * | 2003-09-06 | 2005-06-09 | Oracle International Corporation | SQL tuning sets |
| US20050119999A1 (en) * | 2003-09-06 | 2005-06-02 | Oracle International Corporation | Automatic learning optimizer |
| US7664778B2 (en) | 2003-09-06 | 2010-02-16 | Oracle International Corporation | SQL tuning sets |
| US7805411B2 (en) | 2003-09-06 | 2010-09-28 | Oracle International Corporation | Auto-tuning SQL statements |
| US20050125452A1 (en) * | 2003-09-06 | 2005-06-09 | Oracle International Corporation | SQL profile |
| US8825629B2 (en) | 2003-09-06 | 2014-09-02 | Oracle International Corporation | Method for index tuning of a SQL statement, and index merging for a multi-statement SQL workload, using a cost-based relational query optimizer |
| US20050138015A1 (en) * | 2003-09-06 | 2005-06-23 | Oracle International Corporation | High load SQL driven statistics collection |
| US20050120000A1 (en) * | 2003-09-06 | 2005-06-02 | Oracle International Corporation | Auto-tuning SQL statements |
| US7747606B2 (en) | 2003-09-06 | 2010-06-29 | Oracle International Corporation | Automatic SQL tuning advisor |
| US20050097091A1 (en) * | 2003-09-06 | 2005-05-05 | Oracle International Corporation | SQL tuning base |
| US20050177557A1 (en) * | 2003-09-06 | 2005-08-11 | Oracle International Corporation | Automatic prevention of run-away query execution |
| US20050187917A1 (en) * | 2003-09-06 | 2005-08-25 | Oracle International Corporation | Method for index tuning of a SQL statement, and index merging for a multi-statement SQL workload, using a cost-based relational query optimizer |
| US7634456B2 (en) * | 2003-09-06 | 2009-12-15 | Oracle International Corporation | SQL structure analyzer |
| US7260563B1 (en) * | 2003-10-08 | 2007-08-21 | Ncr Corp. | Efficient costing for inclusion merge join |
| US7167848B2 (en) * | 2003-11-07 | 2007-01-23 | Microsoft Corporation | Generating a hierarchical plain-text execution plan from a database query |
| US20050102613A1 (en) * | 2003-11-07 | 2005-05-12 | Microsoft Corporation | Generating a hierarchical plain-text execution plan from a database query |
| US20050223019A1 (en) * | 2004-03-31 | 2005-10-06 | Microsoft Corporation | Block-level sampling in statistics estimation |
| US20060005121A1 (en) * | 2004-06-30 | 2006-01-05 | Microsoft Corporation | Discretization of dimension attributes using data mining techniques |
| US7283990B2 (en) * | 2004-07-27 | 2007-10-16 | Xerox Corporation | Method and system for managing resources for multi-service jobs based on location |
| US20060026008A1 (en) * | 2004-07-27 | 2006-02-02 | Xerox Corporation | Method and system for managing resources for multi-service jobs based on location |
| US20060074875A1 (en) * | 2004-09-30 | 2006-04-06 | International Business Machines Corporation | Method and apparatus for predicting relative selectivity of database query conditions using respective cardinalities associated with different subsets of database records |
| US8046354B2 (en) * | 2004-09-30 | 2011-10-25 | International Business Machines Corporation | Method and apparatus for re-evaluating execution strategy for a database query |
| US20060074874A1 (en) * | 2004-09-30 | 2006-04-06 | International Business Machines Corporation | Method and apparatus for re-evaluating execution strategy for a database query |
| US8380708B2 (en) | 2004-11-30 | 2013-02-19 | International Business Machines Corporation | Methods and systems for ordering query results based on annotations |
| US8185525B2 (en) * | 2004-11-30 | 2012-05-22 | International Business Machines Corporation | Ordering query results based on value range filtering |
| US20080154901A1 (en) * | 2004-11-30 | 2008-06-26 | International Business Machines Corporation | Methods and systems for ordering query results based on annotations |
| US20080154902A1 (en) * | 2004-11-30 | 2008-06-26 | International Business Machines Corporation | Methods and systems for ordering query results based on annotations |
| US7359922B2 (en) | 2004-12-22 | 2008-04-15 | Ianywhere Solutions, Inc. | Database system and methodology for generalized order optimization |
| US20060136368A1 (en) * | 2004-12-22 | 2006-06-22 | Ianywhere Solutions, Inc. | Database System and Methodology for Generalized Order Optimization |
| US8856143B2 (en) | 2004-12-30 | 2014-10-07 | Google Inc. | Classification of ambiguous geographic references |
| US20100076985A1 (en) * | 2004-12-30 | 2010-03-25 | Google Inc. | Classification of ambiguous geographic references |
| US20060149742A1 (en) * | 2004-12-30 | 2006-07-06 | Daniel Egnor | Classification of ambiguous geographic references |
| US9323738B2 (en) | 2004-12-30 | 2016-04-26 | Google Inc. | Classification of ambiguous geographic references |
| US7716162B2 (en) * | 2004-12-30 | 2010-05-11 | Google Inc. | Classification of ambiguous geographic references |
| US20060294087A1 (en) * | 2005-06-23 | 2006-12-28 | Vladimir Mordvinov | System and method for processing and decomposition of a multidimensional query against a relational data source |
| US8935273B2 (en) * | 2005-06-23 | 2015-01-13 | International Business Machines Corporation | Method of processing and decomposing a multidimensional query against a relational data source |
| US7630977B2 (en) * | 2005-06-29 | 2009-12-08 | Xerox Corporation | Categorization including dependencies between different category systems |
| US20070005639A1 (en) * | 2005-06-29 | 2007-01-04 | Xerox Corporation | Categorization including dependencies between different category systems |
| US20070061318A1 (en) * | 2005-09-13 | 2007-03-15 | Soufiane Azizi | System and method of data source agnostic querying |
| US20070061305A1 (en) * | 2005-09-13 | 2007-03-15 | Soufiane Azizi | System and method of providing date, arithmetic and other relational functions for OLAP sources |
| US7711704B2 (en) * | 2005-09-13 | 2010-05-04 | International Business Machines Corporation | System and method of providing date, arithmetic and other relational functions for OLAP sources |
| US20070098271A1 (en) * | 2005-11-02 | 2007-05-03 | Kitakyushu Foundation For The Advancement Of Industry, Science And Technology | Apparatus and method for image coding |
| US7570821B2 (en) * | 2005-11-02 | 2009-08-04 | Kitakyushu Foundation For The Advancement Of Industry, Science And Technology | Apparatus and method for image coding |
| US7685098B2 (en) * | 2005-12-08 | 2010-03-23 | International Business Machines Corporation | Estimating the size of a join by generating and combining partial join estimates |
| US20070136317A1 (en) * | 2005-12-08 | 2007-06-14 | International Business Machines Corporation | Estimating the size of a join by generating and combining partial join estimates |
| US7185004B1 (en) | 2005-12-09 | 2007-02-27 | International Business Machines Corporation | System and method for reverse routing materialized query tables in a database |
| US9208180B2 (en) * | 2005-12-21 | 2015-12-08 | Sap Se | Determination of database statistics using application logic |
| US8732138B2 (en) * | 2005-12-21 | 2014-05-20 | Sap Ag | Determination of database statistics using application logic |
| US20070143314A1 (en) * | 2005-12-21 | 2007-06-21 | Dirk Thomsen | Determination of database statistics using application logic |
| US20140258337A1 (en) * | 2005-12-21 | 2014-09-11 | Dirk Thomsen | Determination of database statistics using application logic |
| US20070192060A1 (en) * | 2006-02-14 | 2007-08-16 | Hongsee Yam | Web-based system of product performance assessment and quality control using adaptive PDF fitting |
| US7565266B2 (en) * | 2006-02-14 | 2009-07-21 | Seagate Technology, Llc | Web-based system of product performance assessment and quality control using adaptive PDF fitting |
| US20070208696A1 (en) * | 2006-03-03 | 2007-09-06 | Louis Burger | Evaluating materialized views in a database system |
| US7873628B2 (en) * | 2006-03-23 | 2011-01-18 | Oracle International Corporation | Discovering functional dependencies by sampling relations |
| US20070226237A1 (en) * | 2006-03-23 | 2007-09-27 | Oracle International Corporation | Discovering functional dependencies by sampling relations |
| US7478083B2 (en) * | 2006-04-03 | 2009-01-13 | International Business Machines Corporation | Method and system for estimating cardinality in a database system |
| US20070233634A1 (en) * | 2006-04-03 | 2007-10-04 | Vincent Corvinelli | Method and system for estimating cardinality in a database system |
| US20090012977A1 (en) * | 2006-04-03 | 2009-01-08 | International Business Machines Corporation | System for estimating cardinality in a database system |
| US8051058B2 (en) | 2006-04-03 | 2011-11-01 | International Business Machines Corporation | System for estimating cardinality in a database system |
| US7702699B2 (en) * | 2006-05-31 | 2010-04-20 | Oracle America, Inc. | Dynamic data stream histograms for large ranges |
| US20070282888A1 (en) * | 2006-05-31 | 2007-12-06 | Sun Microsystems, Inc. | Dynamic data stream histograms for large ranges |
| US20080208856A1 (en) * | 2006-06-26 | 2008-08-28 | Lipyeow Lim | Classification-Based Method and Apparatus for String Selectivity Estimation |
| US7395270B2 (en) * | 2006-06-26 | 2008-07-01 | International Business Machines Corporation | Classification-based method and apparatus for string selectivity estimation |
| US7987180B2 (en) | 2006-06-26 | 2011-07-26 | International Business Machines Corporation | Classification-based method and apparatus for string selectivity estimation |
| US20080010267A1 (en) * | 2006-06-26 | 2008-01-10 | Lipyeow Lim | Classification-based method and apparatus for string selectivity estimation |
| US20080077586A1 (en) * | 2006-08-18 | 2008-03-27 | Wai Lam | System and method for identifying and mitigating redundancies in stored data |
| US10769106B2 (en) | 2006-08-18 | 2020-09-08 | Falconstor, Inc. | System and method for identifying and mitigating redundancies in stored data |
| US7962499B2 (en) * | 2006-08-18 | 2011-06-14 | Falconstor, Inc. | System and method for identifying and mitigating redundancies in stored data |
| US8392371B2 (en) | 2006-08-18 | 2013-03-05 | Falconstor, Inc. | System and method for identifying and mitigating redundancies in stored data |
| US8694524B1 (en) * | 2006-08-28 | 2014-04-08 | Teradata Us, Inc. | Parsing a query |
| US20080065616A1 (en) * | 2006-09-13 | 2008-03-13 | Brown Abby H | Metadata integration tool, systems and methods for managing enterprise metadata for the runtime environment |
| US7987178B2 (en) * | 2007-02-09 | 2011-07-26 | International Business Machines Corporation | Automatically determining optimization frequencies of queries with parameter markers |
| US20080222092A1 (en) * | 2007-02-09 | 2008-09-11 | Fabian Hueske | Automatically determining optimization frequencies of queries with parameter markers |
| US20080235192A1 (en) * | 2007-03-19 | 2008-09-25 | Mitsuhisa Kanaya | Information retrieval system and information retrieval method |
| US20080288527A1 (en) * | 2007-05-16 | 2008-11-20 | Yahoo! Inc. | User interface for graphically representing groups of data |
| US8122056B2 (en) | 2007-05-17 | 2012-02-21 | Yahoo! Inc. | Interactive aggregation of data on a scatter plot |
| US20080294595A1 (en) * | 2007-05-22 | 2008-11-27 | Yahoo! Inc. | Visual interface to indicate custom binning of items |
| US7756900B2 (en) * | 2007-05-22 | 2010-07-13 | Yahoo!, Inc. | Visual interface to indicate custom binning of items |
| US7739229B2 (en) | 2007-05-22 | 2010-06-15 | Yahoo! Inc. | Exporting aggregated and un-aggregated data |
| US7668952B2 (en) * | 2007-08-27 | 2010-02-23 | Internationla Business Machines Corporation | Apparatus, system, and method for controlling a processing system |
| US20090063616A1 (en) * | 2007-08-27 | 2009-03-05 | International Business Machines Corporation | Apparatus, system, and method for controlling a processing system |
| US7774336B2 (en) | 2007-09-10 | 2010-08-10 | International Business Machines Corporation | Adaptively reordering joins during query execution |
| US20090070313A1 (en) * | 2007-09-10 | 2009-03-12 | Kevin Scott Beyer | Adaptively reordering joins during query execution |
| US20090182695A1 (en) * | 2008-01-14 | 2009-07-16 | Fujitsu Limited | Multi-objective optimal design support device and method taking manufacturing variations into consideration |
| US8315843B2 (en) | 2008-01-14 | 2012-11-20 | Fujitsu Limited | Multi-objective optimal design support device, method and program storage medium |
| US20090182539A1 (en) * | 2008-01-14 | 2009-07-16 | Fujitsu Limited | Multi-objective optimal design support device, method and program storage medium |
| US20090182538A1 (en) * | 2008-01-14 | 2009-07-16 | Fujitsu Limited | Multi-objective optimum design support device using mathematical process technique, its method and program |
| US7987177B2 (en) * | 2008-01-30 | 2011-07-26 | International Business Machines Corporation | Method for estimating the number of distinct values in a partitioned dataset |
| US20090192980A1 (en) * | 2008-01-30 | 2009-07-30 | International Business Machines Corporation | Method for Estimating the Number of Distinct Values in a Partitioned Dataset |
| US20090307187A1 (en) * | 2008-02-28 | 2009-12-10 | Amir Averbuch | Tree automata based methods for obtaining answers to queries of semi-structured data stored in a database environment |
| US8694528B2 (en) | 2008-04-08 | 2014-04-08 | Google Inc. | Dynamic determination of location-identifying search phrases |
| US7987195B1 (en) | 2008-04-08 | 2011-07-26 | Google Inc. | Dynamic determination of location-identifying search phrases |
| US20100010989A1 (en) * | 2008-07-03 | 2010-01-14 | The Regents Of The University Of California | Method for Efficiently Supporting Interactive, Fuzzy Search on Structured Data |
| US8073869B2 (en) * | 2008-07-03 | 2011-12-06 | The Regents Of The University Of California | Method for efficiently supporting interactive, fuzzy search on structured data |
| US20100082602A1 (en) * | 2008-07-05 | 2010-04-01 | Archana Sulochana Ganapathi | Predicting Performance Of Multiple Queries Executing In A Database |
| US9189523B2 (en) * | 2008-07-05 | 2015-11-17 | Hewlett-Packard Development Company, L.P. | Predicting performance of multiple queries executing in a database |
| US9910892B2 (en) | 2008-07-05 | 2018-03-06 | Hewlett Packard Enterprise Development Lp | Managing execution of database queries |
| US8473327B2 (en) * | 2008-10-21 | 2013-06-25 | International Business Machines Corporation | Target marketing method and system |
| US20100100420A1 (en) * | 2008-10-21 | 2010-04-22 | Anderson James R | Target marketing method and system |
| US8768746B2 (en) * | 2008-10-21 | 2014-07-01 | International Business Machines Corporation | Target marketing |
| US8312027B2 (en) | 2008-11-26 | 2012-11-13 | Hewlett-Packard Development Company, L.P. | Modular query optimizer |
| US8214352B2 (en) | 2008-11-26 | 2012-07-03 | Hewlett-Packard Development Company | Modular query optimizer |
| US20100131490A1 (en) * | 2008-11-26 | 2010-05-27 | Vertica Systems, Inc. | Modular query optimizer |
| US20100131444A1 (en) * | 2008-11-26 | 2010-05-27 | Sap Ag | Combining multiple objective functions in algorithmic problem solving |
| US8195496B2 (en) * | 2008-11-26 | 2012-06-05 | Sap Aktiengesellschaft | Combining multiple objective functions in algorithmic problem solving |
| WO2010062994A3 (fr) * | 2008-11-26 | 2010-07-08 | Vertica Systems, Inc. | Optimiseur de requête modulaire |
| US8676548B2 (en) * | 2008-12-17 | 2014-03-18 | Fujitsu Limited | Support apparatus using objective function |
| US20100153074A1 (en) * | 2008-12-17 | 2010-06-17 | Fujitsu Limited | Design support apparatus |
| US20100287015A1 (en) * | 2009-05-11 | 2010-11-11 | Grace Au | Method for determining the cost of evaluating conditions |
| US20100325134A1 (en) * | 2009-06-23 | 2010-12-23 | International Business Machines Corporation | Accuracy measurement of database search algorithms |
| US8117224B2 (en) | 2009-06-23 | 2012-02-14 | International Business Machines Corporation | Accuracy measurement of database search algorithms |
| US20110184934A1 (en) * | 2010-01-28 | 2011-07-28 | Choudur Lakshminarayan | Wavelet compression with bootstrap sampling |
| US8812484B2 (en) | 2010-03-30 | 2014-08-19 | Hewlett-Packard Development Company, L.P. | System and method for outer joins on a parallel database management system |
| US20110289071A1 (en) * | 2010-05-20 | 2011-11-24 | International Business Machines Corporation | Dynamic self configuring overlays |
| US8650218B2 (en) * | 2010-05-20 | 2014-02-11 | International Business Machines Corporation | Dynamic self configuring overlays |
| US9785904B2 (en) * | 2010-05-25 | 2017-10-10 | Accenture Global Services Limited | Methods and systems for demonstrating and applying productivity gains |
| US20110295652A1 (en) * | 2010-05-25 | 2011-12-01 | Feder Patrick C | Methods and systems for demonstrating and applying productivity gains |
| US10210209B2 (en) * | 2010-10-07 | 2019-02-19 | Sap Se | Hybrid query execution plan |
| US20120136879A1 (en) * | 2010-11-29 | 2012-05-31 | Eric Williamson | Systems and methods for filtering interpolated input data based on user-supplied or other approximation constraints |
| US8229917B1 (en) * | 2011-02-24 | 2012-07-24 | International Business Machines Corporation | Database query optimization using clustering data mining |
| US20130166351A1 (en) * | 2011-12-21 | 2013-06-27 | Ramprasad Arunachalam | System and Method for Generating a Marketing-Mix Solution |
| US9208462B2 (en) * | 2011-12-21 | 2015-12-08 | Mu Sigma Business Solutions Pvt. Ltd. | System and method for generating a marketing-mix solution |
| US20130212085A1 (en) * | 2012-02-09 | 2013-08-15 | Ianywhere Solutions, Inc. | Parallelizing Query Optimization |
| US9015073B2 (en) * | 2012-06-06 | 2015-04-21 | Addepar, Inc. | Controlled creation of reports from table views |
| US20150186338A1 (en) * | 2012-06-06 | 2015-07-02 | Addepar, Inc. | Controlled creation of reports from table views |
| US9760544B2 (en) * | 2012-06-06 | 2017-09-12 | Addepar, Inc. | Controlled creation of reports from table views |
| US9087361B2 (en) | 2012-06-06 | 2015-07-21 | Addepar, Inc. | Graph traversal for generating table views |
| US10430498B2 (en) | 2012-06-06 | 2019-10-01 | Addepar, Inc. | Controlled creation of reports from table views |
| US9411853B1 (en) * | 2012-08-03 | 2016-08-09 | Healthstudio, LLC | In-memory aggregation system and method of multidimensional data processing for enhancing speed and scalability |
| US9256643B2 (en) | 2012-10-17 | 2016-02-09 | International Business Machines Corporation | Technique for factoring uncertainty into cost-based query optimization |
| US9208198B2 (en) | 2012-10-17 | 2015-12-08 | International Business Machines Corporation | Technique for factoring uncertainty into cost-based query optimization |
| US8972378B2 (en) * | 2012-10-22 | 2015-03-03 | Microsoft Corporation | Formulating global statistics for distributed databases |
| US20150169688A1 (en) * | 2012-10-22 | 2015-06-18 | Microsoft Technology Licensing, Llc | Formulating global statistics for distributed databases |
| US20140114950A1 (en) * | 2012-10-22 | 2014-04-24 | Microsoft Corporation | Formulating global statistics for distributed databases |
| US9940357B2 (en) * | 2012-10-22 | 2018-04-10 | Microsoft Technology Licensing, Llc | Optimizing queries using global statistics for distributed databases |
| US20140149388A1 (en) * | 2012-11-26 | 2014-05-29 | International Business Machines Corporation | Method and system for estimating the size of a joined table |
| US9460153B2 (en) * | 2012-11-26 | 2016-10-04 | International Business Machines Corporation | Method and system for estimating the size of a joined table |
| US20140149433A1 (en) * | 2012-11-27 | 2014-05-29 | Hewlett-Packard Development Company, L.P. | Estimating Unique Entry Counts Using a Counting Bloom Filter |
| US9465826B2 (en) * | 2012-11-27 | 2016-10-11 | Hewlett Packard Enterprise Development Lp | Estimating unique entry counts using a counting bloom filter |
| US10061804B2 (en) | 2012-12-04 | 2018-08-28 | International Business Machines Corporation | Optimizing an order of execution of multiple join operations |
| US9852181B2 (en) * | 2012-12-04 | 2017-12-26 | International Business Machines Corporation | Optimizing an order of execution of multiple join operations |
| US11776058B2 (en) | 2012-12-13 | 2023-10-03 | Addepar, Inc. | Transaction effects |
| US9105064B2 (en) | 2012-12-13 | 2015-08-11 | Addepar, Inc. | Transaction effects |
| US10013717B2 (en) | 2012-12-13 | 2018-07-03 | Addepar, Inc. | Transaction effects |
| US11120502B2 (en) | 2012-12-13 | 2021-09-14 | Addepar, Inc. | Transaction effects |
| US9105062B2 (en) | 2012-12-13 | 2015-08-11 | Addepar, Inc. | Transaction effects |
| US9135300B1 (en) * | 2012-12-20 | 2015-09-15 | Emc Corporation | Efficient sampling with replacement |
| US20140280317A1 (en) * | 2013-03-15 | 2014-09-18 | University Of Florida Research Foundation, Incorporated | Efficient publish/subscribe systems |
| US10642918B2 (en) * | 2013-03-15 | 2020-05-05 | University Of Florida Research Foundation, Incorporated | Efficient publish/subscribe systems |
| US20150081658A1 (en) * | 2013-09-18 | 2015-03-19 | Ims Health Incorporated | System and method for fast query response |
| US9870415B2 (en) * | 2013-09-18 | 2018-01-16 | Quintiles Ims Incorporated | System and method for fast query response |
| US9785645B1 (en) * | 2013-09-24 | 2017-10-10 | EMC IP Holding Company LLC | Database migration management |
| US9361339B2 (en) | 2013-11-26 | 2016-06-07 | Sap Se | Methods and systems for constructing q, θ-optimal histogram buckets |
| US10223410B2 (en) * | 2014-01-06 | 2019-03-05 | Cisco Technology, Inc. | Method and system for acquisition, normalization, matching, and enrichment of data |
| US20150193497A1 (en) * | 2014-01-06 | 2015-07-09 | Cisco Technology, Inc. | Method and system for acquisition, normalization, matching, and enrichment of data |
| US10540372B2 (en) * | 2014-01-31 | 2020-01-21 | Sybase, Inc. | Safe synchronization of parallel data operator trees |
| US20180210938A1 (en) * | 2014-01-31 | 2018-07-26 | Sybase, Inc. | Safe synchronization of parallel data operator trees |
| US11620308B2 (en) | 2014-02-19 | 2023-04-04 | Snowflake Inc. | Adaptive distribution method for hash operations |
| US10776389B2 (en) * | 2014-02-19 | 2020-09-15 | Snowflake Inc. | Adaptive distribution method for hash operation |
| US11341162B2 (en) | 2014-02-19 | 2022-05-24 | Snowflake Inc. | Adaptive distribution method for hash operations |
| US11294933B2 (en) | 2014-02-19 | 2022-04-05 | Snowflake Inc. | Adaptive distribution method for hash operations |
| US11238061B2 (en) | 2014-02-19 | 2022-02-01 | Snowflake Inc. | Adaptive distribution method for hash operations |
| US20200218733A1 (en) * | 2014-02-19 | 2020-07-09 | Snowflake Inc. | Adaptive Distribution Method For Hash Operation |
| US11188562B2 (en) * | 2014-02-19 | 2021-11-30 | Snowflake Inc. | Adaptive distribution for hash operations |
| US11126640B2 (en) | 2014-02-19 | 2021-09-21 | Snowflake Inc. | Adaptive distribution method for hash operations |
| US20200226147A1 (en) * | 2014-02-19 | 2020-07-16 | Snowflake Inc. | Adaptive Distribution Method For Hash Operation |
| US11507598B2 (en) | 2014-02-19 | 2022-11-22 | Snowflake Inc. | Adaptive distribution method for hash operations |
| US11048721B2 (en) | 2014-02-19 | 2021-06-29 | Snowflake Inc. | Adaptive distribution method for hash operations |
| US11042566B2 (en) | 2014-02-19 | 2021-06-22 | Snowflake Inc. | Cloning catalog objects |
| US11036758B2 (en) | 2014-02-19 | 2021-06-15 | Snowflake Inc. | Adaptive distribution method for hash operations |
| US11372888B2 (en) * | 2014-02-19 | 2022-06-28 | Snowflake Inc. | Adaptive distribution for hash operations |
| US20200257702A1 (en) * | 2014-02-19 | 2020-08-13 | Snowflake Inc. | Adaptive Distribution Method For Hash Operation |
| US10838979B2 (en) * | 2014-02-19 | 2020-11-17 | Snowflake Inc. | Adaptive distribution method for hash operation |
| US10997201B2 (en) * | 2014-02-19 | 2021-05-04 | Snowflake Inc. | Adaptive distribution for hash operation |
| US20240111787A1 (en) * | 2014-02-19 | 2024-04-04 | Snowflake Inc. | Adaptive distribution method for hash operations |
| US10776390B2 (en) * | 2014-02-19 | 2020-09-15 | Snowflake Inc. | Adaptive distribution method for hash operation |
| US20180349457A1 (en) * | 2014-02-19 | 2018-12-06 | Snowflake Computing, Inc. | Adaptive Distribution Method For Hash Operation |
| US11853323B2 (en) | 2014-02-19 | 2023-12-26 | Snowflake Inc. | Adaptive distribution method for hash operations |
| US12189655B2 (en) * | 2014-02-19 | 2025-01-07 | Snowflake Inc. | Adaptive distribution method for hash operations |
| US10817514B2 (en) | 2014-03-13 | 2020-10-27 | Sybase, Inc. | Splitting of a join operation to allow parallelization |
| US9836505B2 (en) | 2014-03-13 | 2017-12-05 | Sybase, Inc. | Star and snowflake join query performance |
| US20150261820A1 (en) * | 2014-03-13 | 2015-09-17 | Xun Cheng | Splitting of a join operation to allow parallelization |
| US9792328B2 (en) * | 2014-03-13 | 2017-10-17 | Sybase, Inc. | Splitting of a join operation to allow parallelization |
| US10210227B2 (en) * | 2014-05-23 | 2019-02-19 | International Business Machines Corporation | Processing a data set |
| US20150339360A1 (en) * | 2014-05-23 | 2015-11-26 | International Business Machines Corporation | Processing a data set |
| US10671627B2 (en) * | 2014-05-23 | 2020-06-02 | International Business Machines Corporation | Processing a data set |
| US20150363519A1 (en) * | 2014-06-17 | 2015-12-17 | Paul Pallath | Consistency of visual discoveries |
| US10007644B2 (en) * | 2014-06-17 | 2018-06-26 | Sap Se | Data analytic consistency of visual discoveries in sample datasets |
| US10360506B2 (en) | 2014-07-23 | 2019-07-23 | Hrl Laboratories, Llc | General formal concept analysis (FCA) framework for classification |
| US10671917B1 (en) | 2014-07-23 | 2020-06-02 | Hrl Laboratories, Llc | System for mapping extracted Neural activity into Neuroceptual graphs |
| US11599540B2 (en) * | 2014-08-07 | 2023-03-07 | Coupang Corp. | Query execution apparatus, method, and system for processing data, query containing a composite primitive |
| US10565298B1 (en) | 2014-09-05 | 2020-02-18 | Addepar, Inc. | Systems and user interfaces for dynamic and interactive report generation and editing based on automatic traversal of complex data structures |
| US11055478B1 (en) | 2014-09-05 | 2021-07-06 | Addepar, Inc. | Systems and user interfaces for dynamic and interactive report generation and editing based on automatic traversal of complex data structures |
| US9424333B1 (en) | 2014-09-05 | 2016-08-23 | Addepar, Inc. | Systems and user interfaces for dynamic and interactive report generation and editing based on automatic traversal of complex data structures |
| US11163945B1 (en) | 2014-10-03 | 2021-11-02 | Addepar, Inc. | Systems and user interfaces for dynamic and interactive table generation and editing based on automatic traversal of complex data structures including time varying attributes |
| US9916297B1 (en) | 2014-10-03 | 2018-03-13 | Addepar, Inc. | Systems and user interfaces for dynamic and interactive table generation and editing based on automatic traversal of complex data structures including time varying attributes |
| US9244899B1 (en) | 2014-10-03 | 2016-01-26 | Addepar, Inc. | Systems and user interfaces for dynamic and interactive table generation and editing based on automatic traversal of complex data structures including time varying attributes |
| US10331778B1 (en) | 2014-10-03 | 2019-06-25 | Addepar, Inc. | Systems and user interfaces for dynamic and interactive table generation and editing based on automatic traversal of complex data structures including time varying attributes |
| US9485259B1 (en) | 2014-10-17 | 2016-11-01 | Addepar, Inc. | System and architecture for electronic permissions and security policies for resources in a data system |
| US9935983B1 (en) | 2014-10-17 | 2018-04-03 | Addepar, Inc. | System and architecture for electronic permissions and security policies for resources in a data system |
| US10686840B1 (en) | 2014-10-17 | 2020-06-16 | Addepar, Inc. | System and architecture for electronic permissions and security policies for resources in a data system |
| US9218502B1 (en) | 2014-10-17 | 2015-12-22 | Addepar, Inc. | System and architecture for electronic permissions and security policies for resources in a data system |
| US10409835B2 (en) * | 2014-11-28 | 2019-09-10 | Microsoft Technology Licensing, Llc | Efficient data manipulation support |
| US20170286487A1 (en) * | 2015-01-16 | 2017-10-05 | International Business Machines Corporation | Database statistical histogram forecasting |
| US10572482B2 (en) * | 2015-01-16 | 2020-02-25 | International Business Machines Corporation | Database statistical histogram forecasting |
| US11263213B2 (en) | 2015-01-16 | 2022-03-01 | International Business Machines Corporation | Database statistical histogram forecasting |
| US20160260011A1 (en) * | 2015-03-05 | 2016-09-08 | International Business Machines Corporation | Cardinality estimation using artificial neural networks |
| US10643132B2 (en) | 2015-03-05 | 2020-05-05 | International Business Machines Corporation | Cardinality estimation using artificial neural networks |
| US10318866B2 (en) * | 2015-03-05 | 2019-06-11 | International Business Machines Corporation | Selectivity estimation using artificial neural networks |
| US9875087B2 (en) * | 2015-04-10 | 2018-01-23 | Oracle International Corporation | Declarative program engine for large-scale program analysis |
| WO2017014826A1 (fr) * | 2015-07-23 | 2017-01-26 | Hrl Laboratories, Llc | Algorithme de sélection de caractéristiques de fenêtre de parzen d'analyse formelle de concepts (fca) |
| US10366083B2 (en) * | 2015-07-29 | 2019-07-30 | Oracle International Corporation | Materializing internal computations in-memory to improve query performance |
| US11238039B2 (en) * | 2015-07-29 | 2022-02-01 | Oracle International Corporation | Materializing internal computations in-memory to improve query performance |
| US10372706B2 (en) | 2015-07-29 | 2019-08-06 | Oracle International Corporation | Tracking and maintaining expression statistics across database queries |
| US10204135B2 (en) | 2015-07-29 | 2019-02-12 | Oracle International Corporation | Materializing expressions within in-memory virtual column units to accelerate analytic queries |
| US20170031976A1 (en) * | 2015-07-29 | 2017-02-02 | Oracle International Corporation | Materializing internal computations in-memory to improve query performance |
| US11443390B1 (en) | 2015-11-06 | 2022-09-13 | Addepar, Inc. | Systems and user interfaces for dynamic and interactive table generation and editing based on automatic traversal of complex data structures and incorporation of metadata mapped to the complex data structures |
| US12572596B1 (en) | 2015-11-06 | 2026-03-10 | Addepar, Inc. | Systems and user interfaces for dynamic and interactive table generation and editing based on automatic traversal of complex data structures and incorporation of metadata mapped to the complex data structures |
| US10732810B1 (en) | 2015-11-06 | 2020-08-04 | Addepar, Inc. | Systems and user interfaces for dynamic and interactive table generation and editing based on automatic traversal of complex data structures including summary data such as time series data |
| US11501374B1 (en) | 2015-11-06 | 2022-11-15 | Addepar, Inc. | Systems and user interfaces for dynamic and interactive table generation and editing based on automatic traversal of complex data structures including summary data such as time series data |
| US10372807B1 (en) | 2015-11-11 | 2019-08-06 | Addepar, Inc. | Systems and user interfaces for dynamic and interactive table generation and editing based on automatic traversal of complex data structures in a distributed system architecture |
| US9495419B1 (en) * | 2015-12-16 | 2016-11-15 | International Business Machines Corporation | Runtime optimization for multi-index access |
| US9747338B2 (en) * | 2015-12-16 | 2017-08-29 | International Business Machines Corporation | Runtime optimization for multi-index access |
| US9720968B2 (en) * | 2015-12-16 | 2017-08-01 | International Business Machines Corporation | Runtime optimization for multi-index access |
| US20170177669A1 (en) * | 2015-12-16 | 2017-06-22 | International Business Machines Corporation | Runtime optimization for multi-index access |
| US9898506B2 (en) | 2015-12-16 | 2018-02-20 | International Business Machines Corporation | Runtime optimization for multi-index access |
| US10452656B2 (en) * | 2016-03-31 | 2019-10-22 | Sap Se | Deep filter propagation using explicit dependency and equivalency declarations in a data model |
| US11030521B2 (en) | 2016-05-06 | 2021-06-08 | International Business Machines Corporation | Estimating cardinality selectivity utilizing artificial neural networks |
| US10706354B2 (en) | 2016-05-06 | 2020-07-07 | International Business Machines Corporation | Estimating cardinality selectivity utilizing artificial neural networks |
| US10162859B2 (en) * | 2016-10-31 | 2018-12-25 | International Business Machines Corporation | Delayable query |
| US12339882B2 (en) | 2016-11-06 | 2025-06-24 | Tableau Software, Inc. | Adaptive interpretation and compilation of database queries |
| US11211943B2 (en) | 2016-11-06 | 2021-12-28 | Tableau Software, Inc. | Hybrid comparison for unicode text strings consisting primarily of ASCII characters |
| US11704347B2 (en) | 2016-11-06 | 2023-07-18 | Tableau Software, Inc. | Adaptive interpretation and compilation of database queries |
| US11068520B1 (en) * | 2016-11-06 | 2021-07-20 | Tableau Software, Inc. | Optimizing database query execution by extending the relational algebra to include non-standard join operators |
| US11789988B2 (en) | 2016-11-06 | 2023-10-17 | Tableau Software, Inc. | Optimizing database query execution by extending the relational algebra to include non-standard join operators |
| US10565286B2 (en) * | 2016-12-28 | 2020-02-18 | Sap Se | Constructing join histograms from histograms with Q-error guarantees |
| US20180181542A1 (en) * | 2016-12-28 | 2018-06-28 | Sap Se | Constructing join histograms from histograms with q-error guarantees |
| US11238040B2 (en) | 2017-03-07 | 2022-02-01 | International Business Machines Corporation | Grouping in analytical databases |
| US10346398B2 (en) * | 2017-03-07 | 2019-07-09 | International Business Machines Corporation | Grouping in analytical databases |
| US10949438B2 (en) | 2017-03-08 | 2021-03-16 | Microsoft Technology Licensing, Llc | Database query for histograms |
| WO2019147201A3 (fr) * | 2017-07-26 | 2019-09-19 | Istanbul Sehir Universitesi | Procédé d'estimation pour la grappe de résultats de l'interrogation réalisée pour rechercher une chaîne dans une base de données |
| US11586611B2 (en) | 2017-10-21 | 2023-02-21 | Palantir Technologies Inc. | Approaches for validating data |
| US10977240B1 (en) * | 2017-10-21 | 2021-04-13 | Palantir Technologies Inc. | Approaches for validating data |
| US11422983B2 (en) | 2017-12-13 | 2022-08-23 | Paypal, Inc. | Merging data based on proximity and validation |
| WO2019118647A1 (fr) * | 2017-12-13 | 2019-06-20 | Paypal, Inc | Fusion de données sur la base d'une proximité et d'une validation |
| US11080276B2 (en) * | 2018-02-23 | 2021-08-03 | Sap Se | Optimal ranges for relational query execution plans |
| US11226955B2 (en) | 2018-06-28 | 2022-01-18 | Oracle International Corporation | Techniques for enabling and integrating in-memory semi-structured data and text document searches with in-memory columnar query processing |
| US12282478B2 (en) * | 2019-04-03 | 2025-04-22 | Hasso-Plattner-Institut für Digital Engineering gGmbH | Iterative multi-attribute index selection for large database systems |
| US11153400B1 (en) | 2019-06-04 | 2021-10-19 | Thomas Layne Bascom | Federation broker system and method for coordinating discovery, interoperability, connections and correspondence among networked resources |
| US11743358B1 (en) | 2019-06-04 | 2023-08-29 | Thomas Layne Bascom | Federation broker system and method for coordinating discovery, interoperability, connections and correspondence among networked resources |
| US11483413B1 (en) | 2019-06-04 | 2022-10-25 | Thomas Layne Bascom | Federation broker system and method for coordinating discovery, interoperability, connections and correspondence among networked resources |
| US11392572B2 (en) * | 2020-03-02 | 2022-07-19 | Sap Se | Selectivity estimation using non-qualifying tuples |
| US11455302B2 (en) * | 2020-05-15 | 2022-09-27 | Microsoft Technology Licensing, Llc | Distributed histogram computation framework using data stream sketches and samples |
| CN111784246A (zh) * | 2020-07-01 | 2020-10-16 | 深圳市检验检疫科学研究院 | 物流路径的估测方法 |
| US12578711B2 (en) * | 2020-07-08 | 2026-03-17 | Sanofi | Method for monitoring a production process and corresponding technical issues |
| US20230259106A1 (en) * | 2020-07-08 | 2023-08-17 | Sanofi | Method for Monitoring a Production Process and Corresponding Technical Issues |
| CN112082910A (zh) * | 2020-09-08 | 2020-12-15 | 长沙理工大学 | 一种基于多重分形的负载型金属催化剂表面金属分散度的表征方法 |
| US20220188308A1 (en) * | 2020-12-11 | 2022-06-16 | International Business Machines Corporation | Selecting access flow path in complex queries |
| US11782918B2 (en) * | 2020-12-11 | 2023-10-10 | International Business Machines Corporation | Selecting access flow path in complex queries |
| CN113220806B (zh) * | 2021-03-15 | 2022-03-18 | 中山大学 | 一种基于衍生平行线段的大规模路网方向判定方法及系统 |
| CN113220806A (zh) * | 2021-03-15 | 2021-08-06 | 中山大学 | 一种基于衍生平行线段的大规模路网方向判定方法及系统 |
| CN114969029A (zh) * | 2022-04-22 | 2022-08-30 | 南京航空航天大学 | 一种基于泰勒展开的多维插值方案及其维间点取值方法 |
| US11928128B2 (en) * | 2022-05-12 | 2024-03-12 | Truist Bank | Construction of a meta-database from autonomously scanned disparate and heterogeneous sources |
| US20230367787A1 (en) * | 2022-05-12 | 2023-11-16 | Truist Bank | Construction of a meta-database from autonomously scanned disparate and heterogeneous sources |
| US12406183B2 (en) | 2022-05-12 | 2025-09-02 | Truist Bank | Accelerated model training from disparate and heterogeneous sources using a meta-database |
| US12164517B2 (en) * | 2023-01-03 | 2024-12-10 | Adobe Inc. | Approximate query processing for join queries |
| US12455900B1 (en) | 2023-03-07 | 2025-10-28 | QEngine LLC | Method for executing a query in a multi-dimensional data space using vectorization and a related system |
| US20250036624A1 (en) * | 2023-07-25 | 2025-01-30 | Beijing Volcano Engine Technology Co., Ltd. | Data query method based on online analytical processing, medium, and device |
| US12386834B1 (en) * | 2024-06-17 | 2025-08-12 | Sap Se | Using worst-case predicate selectivity for database query plans |
| EP4679283A1 (fr) * | 2024-06-17 | 2026-01-14 | Sap Se | Utilisation de la sélectivité de prédicat le plus possible pour des plans d'interrogation de base de données |
Also Published As
| Publication number | Publication date |
|---|---|
| CA2279359A1 (fr) | 2001-01-30 |
| CA2743462C (fr) | 2012-10-16 |
| CA2279359C (fr) | 2012-10-23 |
| CA2743462A1 (fr) | 2001-01-30 |
Similar Documents
| Publication | Publication Date | Title |
|---|---|---|
| US6865567B1 (en) | Method of generating attribute cardinality maps | |
| Li et al. | Approximate query processing: What is new and where to go? | |
| US8140516B2 (en) | Method, system and article of manufacture for improving execution efficiency of a database workload | |
| Ilyas et al. | CORDS: Automatic discovery of correlations and soft functional dependencies | |
| Ng et al. | Exploratory mining and pruning optimizations of constrained associations rules | |
| US7277873B2 (en) | Method for discovering undeclared and fuzzy rules in databases | |
| US6801903B2 (en) | Collecting statistics in a database system | |
| Hellerstein et al. | On a model of indexability and its bounds for range queries | |
| Rao et al. | Spatial hierarchy and OLAP-favored search in spatial data warehouse | |
| US20040249810A1 (en) | Small group sampling of data for use in query processing | |
| Aouiche et al. | Automatic selection of bitmap join indexes in data warehouses | |
| Lakshmanan et al. | Exploratory mining and pruning optimizations of constrained association rules | |
| Haas et al. | Discovering and exploiting statistical properties for query optimization in relational databases: A survey | |
| Levandoski et al. | Flexible and extensible preference evaluation in database systems | |
| Park et al. | An enhanced technique for k-nearest neighbor queries with non-spatial selection predicates | |
| Thiyagarajah | Attribute cardinality maps; new query result size estimation techniques for database systems. | |
| Brodsky et al. | Toward practical query evaluation for constraint databases | |
| Duaimi et al. | Association rules mining for incremental database | |
| Mamoulis et al. | Complex spatial query processing | |
| De Sousa et al. | Mining a large database with a parallel database server | |
| Kim et al. | Optimally leveraging density and locality to support limit queries | |
| US20260087009A1 (en) | System and method for bottom up multidimensional data analysis in complex formulas types | |
| Dai et al. | Approximate Query Processing under Updates | |
| Mukherji et al. | COLARM: Cost-based Optimization for Localized Association Rule Mining. | |
| Liu et al. | A Unified Model for Cardinality Estimation by Learning from Data and Queries via Sum-Product Networks |
Legal Events
| Date | Code | Title | Description |
|---|---|---|---|
| STCF | Information on status: patent grant |
Free format text: PATENTED CASE |
|
| FEPP | Fee payment procedure |
Free format text: PAYOR NUMBER ASSIGNED (ORIGINAL EVENT CODE: ASPN); ENTITY STATUS OF PATENT OWNER: SMALL ENTITY |
|
| FPAY | Fee payment |
Year of fee payment: 4 |
|
| FPAY | Fee payment |
Year of fee payment: 8 |
|
| REMI | Maintenance fee reminder mailed | ||
| FPAY | Fee payment |
Year of fee payment: 12 |
|
| SULP | Surcharge for late payment |
Year of fee payment: 11 |