US9390621B2 - System and method for measuring the real traffic flow of an area - Google Patents
System and method for measuring the real traffic flow of an area Download PDFInfo
- Publication number
- US9390621B2 US9390621B2 US14/729,092 US201514729092A US9390621B2 US 9390621 B2 US9390621 B2 US 9390621B2 US 201514729092 A US201514729092 A US 201514729092A US 9390621 B2 US9390621 B2 US 9390621B2
- Authority
- US
- United States
- Prior art keywords
- images
- database
- time
- continuous
- probe
- Prior art date
- Legal status (The legal status is an assumption and is not a legal conclusion. Google has not performed a legal analysis and makes no representation as to the accuracy of the status listed.)
- Active
Links
Images


Classifications
-
- G—PHYSICS
- G08—SIGNALLING
- G08G—TRAFFIC CONTROL SYSTEMS
- G08G1/00—Traffic control systems for road vehicles
- G08G1/01—Detecting movement of traffic to be counted or controlled
- G08G1/0104—Measuring and analyzing of parameters relative to traffic conditions
-
- G—PHYSICS
- G01—MEASURING; TESTING
- G01C—MEASURING DISTANCES, LEVELS OR BEARINGS; SURVEYING; NAVIGATION; GYROSCOPIC INSTRUMENTS; PHOTOGRAMMETRY OR VIDEOGRAMMETRY
- G01C21/00—Navigation; Navigational instruments not provided for in groups G01C1/00 - G01C19/00
- G01C21/26—Navigation; Navigational instruments not provided for in groups G01C1/00 - G01C19/00 specially adapted for navigation in a road network
- G01C21/34—Route searching; Route guidance
- G01C21/36—Input/output arrangements for on-board computers
-
- G06K9/0063—
-
- G06T7/2093—
-
- G—PHYSICS
- G06—COMPUTING OR CALCULATING; COUNTING
- G06V—IMAGE OR VIDEO RECOGNITION OR UNDERSTANDING
- G06V20/00—Scenes; Scene-specific elements
- G06V20/10—Terrestrial scenes
- G06V20/176—Urban or other man-made structures
-
- G—PHYSICS
- G08—SIGNALLING
- G08G—TRAFFIC CONTROL SYSTEMS
- G08G1/00—Traffic control systems for road vehicles
- G08G1/01—Detecting movement of traffic to be counted or controlled
- G08G1/0104—Measuring and analyzing of parameters relative to traffic conditions
- G08G1/0125—Traffic data processing
-
- G—PHYSICS
- G08—SIGNALLING
- G08G—TRAFFIC CONTROL SYSTEMS
- G08G1/00—Traffic control systems for road vehicles
- G08G1/01—Detecting movement of traffic to be counted or controlled
- G08G1/04—Detecting movement of traffic to be counted or controlled using optical or ultrasonic detectors
Definitions
- the field of the invention is related to information regarding traffic flow, volume, forecasting and population patterns of an area.
- the area can be a city, a town, a country or a continent.
- the information of traffic flow is a key factor for road building, city planning, for infrastructure development, emergency situations, commerce development, traffic jam control, advertising, real estate and, of course, for trip schedule and journey planning.
- the information if available, is used by the government, companies and people.
- the present disclosure is directed to a system and method for measuring the real traffic flow of an area, in accordance with embodiments of the present disclosure.
- the system and method of the present disclosure make use of a combination of sources, but mainly two.
- One is hi-definition images of an area (city, town, country or continent) from the sky, normally obtained with satellite images and another is data collected by devices that are tracked, such as cell phones, smart phones, car navigators, and/or beacons, among others.
- those vehicles and/or pedestrians carrying a tracking device are called “probes”
- those vehicles and/or pedestrians that carry a tracking device plus those vehicles and/or pedestrians that do not carry a tracking device are called “elements”.
- “elements” comprises all the “probes” plus the rest of vehicles and people in the area.
- the method gathers data from satellites (aerial images) and tracking devices (tracking data) and creates a real accurate estimation of the traffic flow, the total amount of traffic at any given time.
- the system and method of the present disclosure also provide the patterns and behaviors of the city population.
- the system and method of the present disclosure provide detailed information of every single street of any area (city, town, country or continent), second by second, aggregated, historical, forecast, distributed by profile, type of vehicle, origin-destination and even with an estimation of journey purpose. All this is accomplished, in a passive way, without the collaboration of the individuals, or making surveys. This is done by indirect measurements and analysis.
- the system is passive and non-intrusive and does not require collaboration of the citizens.
- the system can also be enhanced with other auxiliary sources such as traffic (vehicular and pedestrian) counts, cameras in streets, surveys, questionnaires, geomarketing data, census, carrier data from mobile operators, beacons and/or NFCs (Near Field Communications).
- a first aspect of the invention is to provide a system for measuring the real traffic flow of an area.
- the system for measuring the real traffic flow of an area comprises: i) images taken from the sky (from satellites, planes, drones or any technology that allows a view (almost vertical) of the streets of the area) in time intervals of an area; ii) continuous tracking data of a probe (tracked vehicle, tracked pedestrian) that is collected and provided by navigator manufacturers, map providers, route applications or by phone carriers that record the cell towers, traffic counts (vehicular and pedestrian), router connections and beacons that are able to geolocate the probe.
- the continuous tracking data comprises at least the longitude, latitude for each time unit for which the probe is tracked; iii) a database of universe of elements that comprises the images; iv) a continuous database that comprises the continuous tracking data; and, v) a computer processor.
- the computer processor is configured to: i) apply image pattern recognition software to the images taken from the sky so that each element comprised in the images is recognized, labeled and at least its longitude, latitude, time, speed and type of vehicle or number of pedestrian is calculated; ii) allocate to each probe the continuous tracking data for which the longitude, latitude and time match; iii) calculate a ratio between the number of elements recognized in the images and the number of probes for which the longitude, latitude and time match; and, iv) estimate the flow and the total number of elements within an area by applying the calculated ratio to the continuous tracking data for a particular time for which an image from the sky is not available.
- the computer processor is further configured to: calculate a pattern for each probe based on the continuous tracking data; and, calculate a profile by analyzing the combinations of calculated patterns.
- the images are provided by at least one aerial device.
- the at least one aerial device may be selected from a satellite, a plane, an aircraft, a drone and any combination thereof.
- the probe is selected from a tracked vehicle and a tracked pedestrian or group of tracked pedestrians.
- the area is selected from a street, a suburb, a city, a town, a country and a continent.
- Another embodiment of the system provides that the images are selected between photos and moving frames.
- a second aspect of the invention is to provide a method for measuring the real traffic flow of an area.
- the method comprises: i) generating a database of universes (UDB) which stores images taken from the sky in time intervals of an area; ii) recognizing, by means of a processor, each individual element comprised in each stored image and calculating at least the following data of each individual element: latitude, longitude, time, speed and type of vehicle or number of pedestrian; iii) generating a continuous database (CDB) which stores continuous tracking data of each individual probe, the continuous tracking data comprising at least the estimated position by longitude and latitude, map cell and vector position, for each time unit; the continuous tracking data being obtained from each tracking device carried by each individual probe; iv) allocating to each individual element recognized in step ii) the continuous tracking data of step iii) for which the longitude, latitude and time match; v) calculating a ratio between the number of elements recognized in the images and the number of probes for which the longitude, latitude and
- the method for measuring the real traffic flow of an area further comprises: calculating a pattern for each probe based on the continuous tracking data; and, calculating a profile by analyzing combinations of the calculated patterns.
- the step of “generating a database of universes (UDB)” (step i) above-mentioned) further comprises the following sub-steps: i) defining of a Universe region that it is the composition of several images; (normally this is a Metropolitan area of the whole city, including suburban areas, ring roads, etc.; any zone that is influenced by the city and is desired to be analyzed); ii) selecting different source data of aerial city images such as satellites, airplanes, drones, with latitude and longitude and synchronized timestamp (pictures and movies can be taken during different periods of time and days); iii) normalizing the input image (color contrast, orthophoto, edit, eliminate clouds, etc.—images may have overlapping areas that will be fused and mixed to correct and represent the reality of two different times); iv) generating a chronogram of the different images and regions to sync later with the snapshot of the Continuous database (CDB); and v) counting Vehicle and pedestrian (individual probe) Analysis.
- a further sub-step is provided: vi) correction and enhancement of the data, which comprises: a) matching to a vector navigation map; b) correcting the effect of traffic lights, traffic jams for possible false positives as parked cars; c) deducing the movement and trajectory for each single element before the snapshot and after the snapshot (project to the past and to the future based on the current position); d) forecasting movement for each single element based on type of road and type of element. For example, if a car is in a highway, it will be at least all the time until it finds an exit; and e) identifying regions and locations that will be excluded or will require a different analysis. For example, airports, cars in restricted areas, military, etc.
- the step of “generating a database of universes (UDB)” comprises the sub-step vii) of counting elements consisting of: a) counting by segment of the street, number of vehicles, cars, buses, motorbikes, moving and parked, people and static elements: for each picture; and/or for total pictures in a period of time; and b) counting a total for the city, for each picture; and/or for total pictures in a period of time;
- the vehicle analysis comprises: a) mapping correlation of roads (to simplify and expedite the analysis of the streets, roads and car parks are placed as vectors in the images to highlight where it is possible to find elements, this will narrow the search areas and optimize the process); b) calibrating of the process: defining the objects for the image recognition, such as car, type, model, bus, truck, motorbike, bicycle, bus shelter, billboard, kiosk, urban furniture, pedestrian, etc.; c) processing the images with the image pattern recognition software.
- This process takes into account not only the visible range, but, if it is available, other wave lengths from the spectrum such as infrared or ultraviolet, and the type of analysis provides more information such as if the car (object or individual probe) is moving or parked, the orientation of the movement, speed, etc.
- the process inserts a record for each element found in the image, the fields including: time, image reference, position (i.e. latitude/longitude), element flow type (Static, moving), element class (Car, Bus, Kiosk, pedestrian, etc.), shape, model/color/characteristics, parked (if applicable), speed, orientation vector, path (if applicable) and vehicle dimensions.
- the step of “generating the Continuous Database (CDB)” (step iii) mentioned above) further comprises the following steps: a) input processing of data files from the source.
- files and input form may vary, from text files, xml, db files, etc.
- Each data provider has a specific type of data and this defines the structure of the database.
- the access to the data is in raw mode, this means direct readings from the probes, and in other cases, the data has had some cleaning, laundry, filtering, and aggregation.
- the main files to import are: Raw data; Model statistics (aggregation of raw data) if available; Statistics and data for model validation; b) anonymizing individual data, if required; c) cleaning, validation, and consistency analysis; d) filtering Probes to meet the criteria of the universe; e) geopositioning of the probe to match map coordinates; f) and journey calculation. Once identified, for each probe, a sequence of point by point positions (lat/long) to define a “journey” has to be created.
- probes such as: checking consistency of the journeys per Probe per day, week and month; and continuity across time, repeated places and locations, such as home, work, gas-stations, leisure areas, malls, shopping, schools, etc.; and h) profiling.
- Each probe based on its pattern will have an affinity to different profiles and demographics so a probabilistic approach will match a “profile”, not only of a journey pattern but also with other sources such as census information, surveys, questionnaires, geomarketing data, proximity to points of interest, population density, borough, type of district, etc.
- a method for calculating a traffic re-generation comprises the following steps: i) per image, identifying the elements from the CDB in the UDB, in each segment of the street at the time the picture was taken (snapshot). All probes will be located and match to an element of the UDB because the UDB is a snapshot (or movie) of the same time. These probes are the seed vehicles, they become the sample; ii) analyzing the ratio and weighting among seed elements (probes that came from the CDB) and the total elements in each segment of the street at the very same moment.
- one output is to adjust and weight the probes. Depending on the analysis, this can be done per time frame, day, weekday/weekend, by region, or by type of element (for example, only motorbikes); iv) another output is the generation of the traffic of the city, using each single element of the UDB moved by the pattern criteria obtained from the CDB.
- a method for measuring the real traffic flow of an area for which an individual element cannot be identified is provided.
- the method combines the two databases (Database of Universes “UDB” and Continuous Database “CDB”) when each individual element cannot be identified in the image stored from the UDB applying the following steps:
- a method for measuring the real traffic flow of an area for which an individual element cannot be identified may combine the two databases (Database of Universes “UDB” and Continuous Database “CDB”) when each individual element cannot be identified in the image stored from the UDB applying the following steps: i) making UDB elements move according the movement patterns used more by the CDB movements and assigning probabilities of “looking” to them; ii) generating movement patterns with the information collected from the CDB in the selected period (days, weeks, months); and iii) for each image of the UDB: a) looking for the probes of the CDB that were “active” at the time the photo was taken; and, b) virtually moving each element of the image (UDB) depending on the movement patterns of the CDB.
- a method for measuring the audience of an advertisement item comprising the step of applying the method and/or the system for measuring the real traffic flow of an area of the present invention.
- the method for measuring the audience of an advertisement item for which the longitude and latitude are known comprises combining all or part of the following devices: i) Continuous Database (CDB): a) built-in GPS navigators; b) external GPS navigators; c) GPS devices installed on mobile phones; specific mobility studies, etc.; d) traffic bands for measuring the traffic; e) cameras installed for monitoring the traffic; f) beacons; and g) mobile phone data; ii) aerial images (generating the database of universes (UDB) using: a) satellites; b) aircraft; and c) drones, etc.; iii) demographic surveys, which provide features of the individuals such as: sex; age, role, social class, and media consumptions; iv) points of interest (POIs) which provide the individuals of the CDB which have passed through the
- FIG. 1 is a flow chart of an embodiment of the system according to the present invention.
- FIG. 2 illustrates data provided by a GPS manufacturer.
- FIG. 3 illustrates data provided by a GPS manufacturer and data regarding profiles of individuals.
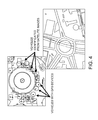
- FIG. 4 illustrates an exemplary traffic density analysis in a section of a city.
- FIGS. 1 to 3 there are several data sources for the creation of the system 1 , but the main one, Database of Universes 2 , used as a foundation for the analysis is the image 4 of the area (city, town, country or continent) from the sky. These pictures can be taken by a satellite 20 , planes, drones or any technology that allows a view (almost vertical) of the streets of the city. In accordance with the preferred embodiment, satellite images 4 are used, but other sources can also be used. The requirement is the high quality of those images that should allow for simage recognition pattern software 7 . It can be still photos or moving frames but quality is essential.
- this kind of information is immediate, at a given time and it is not continuous in time due to the difficulty and cost to keep a camera in the sky at the same position for a long period of time, this only happens using geostatic satellites.
- the system and method of the present invention take into account this standard limitation, but of course, can implement continuous satellite image tracking.
- the current state of the art provides high definition images of any zone of the planet in less than 3 hours.
- Another way to take aerial images is by airplane/drone flight above the area (city, town, country or continent), this normally results in a more expensive procedure, administrative process, and license and it cannot be arranged so quickly as to have hundreds of cities at the same time as using a satellite image.
- the composition of aerial images provides the Universe region (Database of Universes 2 ).
- An aerial image provides the real situation of an area for a particular time.
- the aerial image instant photo
- Another data source of the system is the continuous tracking data 5 for each probe (tracked vehicle, tracked pedestrian).
- This information is collected by navigator manufacturers such as TomTom®, map providers such as Google®, route applications such as Waze® or by phone carriers that record the cell towers, router connections, geofencing and/or beacons that are able to geolocate their clients on regular basis. It is important to stress that the information provided by these databases are not just the volume or counts per street, but the information of each journey and location, this is the sequence of segments of a street, the order and time that the probe is moving from origin 18 to destiny 19 or is located in an area. Also, travel patterns may be obtained by questionnaires, tracking and surveys.
- the computer processor 6 applies the image pattern recognition software 7 to the images 4 for calculating latitude, longitude, time, speed and type of vehicle or number of pedestrians. In order to do so, the computer processor 6 merges 8 the data contained in both databases.
- the vehicle or the pedestrian is identified when its longitude, latitude and time (or timestamp) are the same for the data contained in both databases.
- the pattern is a repetitive action for a vehicle or a pedestrian moving from the origin to the destination. For instance, the same journey at the same time, each working day.
- the computer processor 6 can calculate the pattern 9 based on repetitive moving actions (journey, trips) of the probes. When several probes (vehicles, individuals) repeat (more or less) the same journey, it turns out in a pattern. Thus, the computer processor 6 can calculate the profile of each probe 10 based on combinations of patterns.
- the profile of individual probes is useful for generating the city traffic 11 and/or for measuring the audience of an advertisement item 12 .
- Points of Interest in the city, for example, fast food restaurants, cinemas, malls, gas stations, leisure areas, gyms, business areas, parking lots, airports, hospitals, etc.
- Other data layers enable understanding of the patterns and the reasons for the movements.
- Other sources are traffic counts inside malls (footfall).
- Other data sources are obtained from the “beacon” technology that counts and identifies the Smartphone devices that are within its range.
- Other information like traffic and pedestrian counts, census data, allow for calibration and adjustment of the information.
- the information collected is, for each probe, its position (i.e. longitude and latitude), time and speed. This is because each individual probe (tracked vehicle or tracked pedestrian) is carrying his cell phone or car navigator. Those devices usually send the information to the manufacturer, for technical reasons such as optimization of the antenna tower, cell grid, etc. so it can also send back updates of the traffic ahead, update maps and provide feedback. But the result is that the manufacturer or service provider collects millions of individual journeys, of course, in an anonymous way due to privacy laws that apply in each country.
- a “legal” satellite image can be a 30 centimeter resolution per pixel, this allows the system of the present invention (by means of a computer processor) to use advanced image analysis software (also known as image pattern recognition software) for object recognition, to identify each vehicle, type and orientation and if it is moving or parked, and speed.
- advanced image analysis software also known as image pattern recognition software
- the information can be more detailed and accurate so as to even identify people walking.
- the method and system of the present invention can scrutinize the complete city, count all the cars, type and model, trucks, motorcycles, and even people walking that are in any given moment in the city area and in each segment of the street. This information has never been available before, only made by estimations and projections to get an approximate idea. But now, with these images and some computing power, the system and method can count the complete universe of vehicles any day, any moment of a street, city, a country or even a continent.
- the system and method of the present invention have as inputs two main sources, one provides the real universe of vehicles and pedestrians, street by street, segment by segment, of an overall city area but it comes from a snapshot or for a short period of time (while the satellite is above the city).
- the other source provides complete detailed information of several thousands of journeys of individuals, second by second, its position and speed during long periods of time, weeks, months, even years. It provides a “longitudinal” dimension of the data. This “longitudinal” dimension of the data is stored in the Continuous Database “CDB”.
- the system and method of the present invention can trace each individual probe journey across time. This provides rich information of the patterns of the individual probe. In the case of aggregated data, it can also be managed in several ways, making virtual probes at a lower dimension of the aggregation, or using the information at that level to feed the model.
- the probe is not only one tracked vehicle or a tracked pedestrian, but a group of tracked vehicles or tracked pedestrians which cannot be individually identified. Though the group of probes cannot be individually identified, it is considered that all tracked vehicles or tracked pedestrians within the group share the same longitude and latitude for a particular time.
- the system and method of the present invention can combine the rich information with Points of Interest, places that an individual probe visits frequently, turning out a profile based on probabilities. So, for example, how often the probe stays by night in one place can be identified as home, where the probe goes during week days during working hours can be identified as business/work location, if the area is a university/school, it can be identified as “High probability to be a student”. Other places such as malls, gyms, cinemas, shops, etc. will add more and more granularity to the profile.
- a deeper analysis will use the combination of those probes including the pattern, for example, a profile of people that go to McDonalds but do not go to Burger King even if it is in proximity of home/work in the last year, during weekends. Or people who drive more than 30 minutes to work even though they have public transportation with the same route.
- the combination of these probes provides an infinite number of possibilities and analysis.
- the system and method of the present invention can have a high definition image of the city of Madrid from a satellite (or a movie) and, at the same time, from the Continuous Database “CDB” the system and method of the present invention have the information of all the probes (each being an individual vehicle or pedestrian, with one or more tracking devices such as GPS, a Mobile Phone, Cameras on the streets, etc.) at the very same time ( FIG. 4 , cars with navigator devices labeled in circles and cars identified by satellite labeled in rectangles).
- CDB Continuous Database
- Each element then can be identified in the aerial image, one by one, in each street segment at the snapshot time, and also the number of other vehicles that are in the same segment of the street, so a skew ratio per segment, zone and day is calculated based on the probes in that segment and the real number of elements in that same street. This process is repeated many times across different time frames, days, weekends, etc. So a weighting factor is obtained for each probe that represents the projection of the total universe of the elements in the city. As probes are identified across time, a more meticulous measurement is possible, making the weighting ratio a combination of several analyses of the probe in different time frames, areas and days.
- the system can be enhanced by projecting the patterns and flows over the census data to have a complete and weighted representation of the city
- the result of matching these two sources (snapshot of reality with a large longitudinal sample of elements) across time is a model that represents the traffic flow of each single element of the city.
- the model can be queried by any dimension, such as time, origin, destiny, duration, and profile. It can answer questions such as: “How many minutes has the duration of the journey to work of the people that go from Postal Code A to Postal Code B increased since there are some roads closed in the last month?; “What are the profile and origin of the people that suffer the traffic jam in the ring road of the city Monday morning?”; What is the influence area of the shopping mall during a regular weekend vs. holidays?; Forecast the people from the south borough that will move during the summer season outside of the city based on the last 3 years.
- the analogy of the system is the US Census Bureau. They conduct the CENSUS Survey one time every several years to get the total universe of the population but they update it with smaller sample survey data annually.
- the Satellite image vehicle counting is the Universe and the other auxiliary sources such as Car Navigators or Beacons help to update the information and patterns.
- the concept of the system matches the idea of a global real complete measurement with the Satellite image, that is done in a periodic time (i.e., each week) and secondary sources that are not complete and may be biased but help to update the information.
- the combination of both sources provides the unprecedented and most accurate estimation of the reality of trips in the city or region.
- the system and method of the present invention With the system and method of the present invention, a representation of all the journeys, trips and movements of all the people of the city is possible, a Trip Atlas of the city.
- the system and method of the present invention is a complete estimation from a single street to the whole city. The present invention can only be surpassed if all the people carried a GPS all the time and all that information was centralized and gathered in one place. That would be very expensive of course.
- the present invention can be applied in combination with the invention of U.S. Pat. No. 8,537,145 of CUENDE INFOMETRICS, that calculates the visibility zone for each billboard or advertising panel in the street.
- audience metrics for these advertising elements can be obtained (Basically, how many people have the opportunity to see the billboard).
- the system and method of the present invention can be enriched by adding other layers, for example, census information, weather conditions by zone, daylight frames per region or data from specific surveys such as media and brand consumption, political and environmental information, and social statuses, and all the new variables will provide a better understanding of the behavior and patterns of the population.
- the system and method of the present invention can work “online” in real time and with historical data.
- the present invention solves the issue of “duplications” of the traffic counts in the street.
- Currently it is hard to know if one point “B” (segment of the street) has been passed by three different cars or the same car three times. More importantly, with the system and method of the present invention, it can be known how many cars that passed point “B” then go to “C or to “D”.
- Origin-Destiny can be calculated using intermediate points: “How many people go from point “A” to “C” passing by “B” (toll highway) and how many go from “A” to “C” but avoid “B”.
- toll highway may have accurate counts of people going through the barrier, but does not have a count of how many are missing because they are out of their sight. Also, unless they do plate recognition and process it, they will not know the kind of duplication that is happening at the toll highway. This is a clear advantage of the present invention for design and planning of streets and roads.
- Satellites could be positioned ad-hoc to take pictures at a certain moment in a specific place. It means that the impact of strikes, manifestations, sport events, etc. would be measurable, not only counting people there but also detecting how traffic is affected in the whole city.
- Nightly pictures will allow analysis of illumination vs. traffic, object visibility, energy consumption optimization, etc.
Landscapes
- Physics & Mathematics (AREA)
- General Physics & Mathematics (AREA)
- Engineering & Computer Science (AREA)
- Chemical & Material Sciences (AREA)
- Analytical Chemistry (AREA)
- Radar, Positioning & Navigation (AREA)
- Remote Sensing (AREA)
- Multimedia (AREA)
- Theoretical Computer Science (AREA)
- Automation & Control Theory (AREA)
- Traffic Control Systems (AREA)
Priority Applications (1)
| Application Number | Priority Date | Filing Date | Title |
|---|---|---|---|
| US14/729,092 US9390621B2 (en) | 2014-06-04 | 2015-06-03 | System and method for measuring the real traffic flow of an area |
Applications Claiming Priority (2)
| Application Number | Priority Date | Filing Date | Title |
|---|---|---|---|
| US201462007558P | 2014-06-04 | 2014-06-04 | |
| US14/729,092 US9390621B2 (en) | 2014-06-04 | 2015-06-03 | System and method for measuring the real traffic flow of an area |
Publications (2)
| Publication Number | Publication Date |
|---|---|
| US20150356868A1 US20150356868A1 (en) | 2015-12-10 |
| US9390621B2 true US9390621B2 (en) | 2016-07-12 |
Family
ID=53284259
Family Applications (1)
| Application Number | Title | Priority Date | Filing Date |
|---|---|---|---|
| US14/729,092 Active US9390621B2 (en) | 2014-06-04 | 2015-06-03 | System and method for measuring the real traffic flow of an area |
Country Status (5)
| Country | Link |
|---|---|
| US (1) | US9390621B2 (es) |
| EP (1) | EP3078014B1 (es) |
| ES (1) | ES2710672T3 (es) |
| TW (1) | TW201602974A (es) |
| WO (1) | WO2015185594A1 (es) |
Cited By (6)
| Publication number | Priority date | Publication date | Assignee | Title |
|---|---|---|---|---|
| US10074271B1 (en) * | 2017-06-02 | 2018-09-11 | Yandex Europe Ag | Methods and systems for generating a traffic prediction |
| US10217236B2 (en) * | 2016-04-08 | 2019-02-26 | Orbital Insight, Inc. | Remote determination of containers in geographical region |
| US10319107B2 (en) | 2016-04-08 | 2019-06-11 | Orbital Insight, Inc. | Remote determination of quantity stored in containers in geographical region |
| US10997537B2 (en) * | 2017-12-28 | 2021-05-04 | Canon Kabushiki Kaisha | Information processing apparatus, system, method, and non-transitory computer-readable storage medium for adjusting a number of workers in a workshop |
| US11790773B2 (en) | 2019-02-25 | 2023-10-17 | Quantifly Llc | Vehicle parking data collection system and method |
| US20260038364A1 (en) * | 2024-07-31 | 2026-02-05 | Fujitsu Limited | Traffic simulator adjustment |
Families Citing this family (36)
| Publication number | Priority date | Publication date | Assignee | Title |
|---|---|---|---|---|
| CN104025166B (zh) * | 2011-12-28 | 2016-10-12 | 三菱电机株式会社 | 中心侧系统及车辆侧系统 |
| WO2015134311A1 (en) | 2014-03-03 | 2015-09-11 | Inrix Inc | Traffic obstruction detection |
| US9959289B2 (en) * | 2014-08-29 | 2018-05-01 | Telenav, Inc. | Navigation system with content delivery mechanism and method of operation thereof |
| US20170017846A1 (en) * | 2015-07-15 | 2017-01-19 | Umm Al-Qura University | Crowd and traffic monitoring apparatus and method |
| US10074272B2 (en) * | 2015-12-28 | 2018-09-11 | Here Global B.V. | Method, apparatus and computer program product for traffic lane and signal control identification and traffic flow management |
| CN113955108B (zh) * | 2016-08-26 | 2025-04-15 | 索尼公司 | 信息处理装置、其控制方法、移动单元及记录介质 |
| US11386068B2 (en) * | 2016-10-27 | 2022-07-12 | Here Global B.V. | Method, apparatus, and computer program product for verifying and/or updating road map geometry based on received probe data |
| US9805595B1 (en) * | 2016-10-27 | 2017-10-31 | International Business Machines Corporation | Vehicle and non-vehicle traffic flow control |
| CN106448168B (zh) * | 2016-11-24 | 2019-02-19 | 中山大学 | 基于趋势性指标及波动性指标的交通事件自动检测方法 |
| CN106781490A (zh) * | 2016-12-29 | 2017-05-31 | 广州交通信息化建设投资营运有限公司 | 城市道路交通运行分析评价系统 |
| CN108337644B (zh) * | 2017-01-18 | 2020-11-27 | 腾讯科技(深圳)有限公司 | 一种数据处理方法及装置 |
| CN108460863A (zh) * | 2017-02-21 | 2018-08-28 | 公安部道路交通安全研究中心 | 一种隧道中人员和车辆的监控方法、装置和系统 |
| CN106998451A (zh) * | 2017-04-21 | 2017-08-01 | 湖北天专科技有限公司 | 基于无人飞行器监测的区域状况全景导览系统及其方法 |
| JP6837921B2 (ja) | 2017-06-02 | 2021-03-03 | 任天堂株式会社 | ゲームプログラム、情報処理装置、情報処理システム、および、情報処理方法 |
| JP6613267B2 (ja) * | 2017-06-02 | 2019-11-27 | 任天堂株式会社 | 情報処理システム、情報処理プログラム、情報処理装置、および、情報処理方法 |
| JP6653293B2 (ja) | 2017-06-05 | 2020-02-26 | 任天堂株式会社 | 情報処理システム、情報処理プログラム、情報処理装置、および、情報処理方法 |
| CN107219157A (zh) * | 2017-07-29 | 2017-09-29 | 山东诺方电子科技有限公司 | 一种利用社会车辆进行大气颗粒物监测系统 |
| CN108346287B (zh) * | 2018-01-30 | 2020-08-04 | 浙江大学 | 基于影响因素分析的交通流量序列模式匹配方法 |
| CN110378502A (zh) * | 2018-09-13 | 2019-10-25 | 北京京东尚科信息技术有限公司 | 辅助无人车确定路径的方法和装置 |
| WO2020142393A1 (en) * | 2018-12-31 | 2020-07-09 | FLIR Belgium BVBA | Image sensor mapping for traffic control systems and methods |
| CN109934127B (zh) * | 2019-02-27 | 2020-12-15 | 电子科技大学 | 基于视频图像与无线信号的行人识别与跟踪方法 |
| US10791417B1 (en) * | 2019-03-28 | 2020-09-29 | Lenovo (Singapore) Pte. Ltd. | Low-fuel indicator enablement based on fuel station locations |
| CN110572810B (zh) * | 2019-10-16 | 2021-11-05 | 福州物联网开放实验室有限公司 | 一种适用于救援的定位卫星快速路由方法 |
| CN111369200B (zh) * | 2020-04-01 | 2023-05-05 | 北京理工新源信息科技有限公司 | 一种基于车辆lbs数据的城市物流通道识别方法及系统 |
| US20220138260A1 (en) * | 2020-10-30 | 2022-05-05 | Here Global B.V. | Method, apparatus, and system for estimating continuous population density change in urban areas |
| US20220207992A1 (en) * | 2020-12-30 | 2022-06-30 | Here Global B.V. | Surprise pedestrian density and flow |
| CN112784901B (zh) * | 2021-01-22 | 2023-04-07 | 北京航空航天大学 | 一种基于位置数据的行人出行分类检测方法和系统 |
| US20220237640A1 (en) * | 2021-01-26 | 2022-07-28 | Arrivalist Co. | System and Method for Using Observational Datasets to Improve Hotel Revenue Estimates and Associated Economic Impact in Real-Time |
| US20220391806A1 (en) * | 2021-06-08 | 2022-12-08 | Here Global B.V. | Method to compute a visibility index for shared vehicles |
| US20240361123A1 (en) * | 2021-08-16 | 2024-10-31 | Trans-Plan Transportation Inc. | Process and system for tracking ground movement |
| CN114299727B (zh) * | 2021-12-28 | 2022-12-09 | 杭州滨电信息技术有限公司 | 一种基于物联网和边缘计算的交通流预测系统及云平台 |
| CN114297532B (zh) * | 2021-12-31 | 2023-04-07 | 哈尔滨工业大学 | 一种基于人群移动轨迹的高清城市功能区识别方法及系统 |
| CN115690630A (zh) * | 2022-11-08 | 2023-02-03 | 山东农业工程学院 | 一种用于路面车辆识别的交通遥感图像处理方法 |
| JP2025008968A (ja) * | 2023-07-06 | 2025-01-20 | トヨタ自動車株式会社 | 情報処理方法 |
| CN116897670B (zh) * | 2023-09-14 | 2024-01-23 | 中化现代农业有限公司 | 作物施肥方法、装置、电子设备和存储介质 |
| WO2025067681A1 (en) * | 2023-09-28 | 2025-04-03 | Mobile4.Pro Społka Z Ograniczona Odpowiedzialnoscia | A method of measuring of a people flow along a city street and a device therefor |
Citations (3)
| Publication number | Priority date | Publication date | Assignee | Title |
|---|---|---|---|---|
| US5999877A (en) * | 1996-05-15 | 1999-12-07 | Hitachi, Ltd. | Traffic flow monitor apparatus |
| US20130287261A1 (en) * | 2012-04-25 | 2013-10-31 | Hon Hai Precision Industry Co., Ltd. | Electronic device and method for managing traffic flow |
| US8576069B2 (en) * | 2009-10-22 | 2013-11-05 | Siemens Corporation | Mobile sensing for road safety, traffic management, and road maintenance |
Family Cites Families (5)
| Publication number | Priority date | Publication date | Assignee | Title |
|---|---|---|---|---|
| US5862244A (en) * | 1995-07-13 | 1999-01-19 | Motorola, Inc. | Satellite traffic reporting system and methods |
| EP2499625A4 (en) * | 2009-11-10 | 2016-05-11 | Bae Systems Australia Ltd | METHOD AND SYSTEM FOR SUPPORTING THE PRECEDENCE OF A VEHICLE MOVEMENT |
| US8531523B2 (en) * | 2009-12-08 | 2013-09-10 | Trueposition, Inc. | Multi-sensor location and identification |
| JP5057183B2 (ja) * | 2010-03-31 | 2012-10-24 | アイシン・エィ・ダブリュ株式会社 | 風景マッチング用参照データ生成システム及び位置測位システム |
| US20130342700A1 (en) * | 2012-06-26 | 2013-12-26 | Aharon Kass | System and method for using pattern matching to determine the presence of designated objects in digital images |
-
2015
- 2015-06-03 ES ES15726956T patent/ES2710672T3/es active Active
- 2015-06-03 EP EP15726956.4A patent/EP3078014B1/en active Active
- 2015-06-03 WO PCT/EP2015/062330 patent/WO2015185594A1/en not_active Ceased
- 2015-06-03 US US14/729,092 patent/US9390621B2/en active Active
- 2015-06-04 TW TW104118173A patent/TW201602974A/zh unknown
Patent Citations (3)
| Publication number | Priority date | Publication date | Assignee | Title |
|---|---|---|---|---|
| US5999877A (en) * | 1996-05-15 | 1999-12-07 | Hitachi, Ltd. | Traffic flow monitor apparatus |
| US8576069B2 (en) * | 2009-10-22 | 2013-11-05 | Siemens Corporation | Mobile sensing for road safety, traffic management, and road maintenance |
| US20130287261A1 (en) * | 2012-04-25 | 2013-10-31 | Hon Hai Precision Industry Co., Ltd. | Electronic device and method for managing traffic flow |
Cited By (8)
| Publication number | Priority date | Publication date | Assignee | Title |
|---|---|---|---|---|
| US10217236B2 (en) * | 2016-04-08 | 2019-02-26 | Orbital Insight, Inc. | Remote determination of containers in geographical region |
| US10319107B2 (en) | 2016-04-08 | 2019-06-11 | Orbital Insight, Inc. | Remote determination of quantity stored in containers in geographical region |
| US10607362B2 (en) | 2016-04-08 | 2020-03-31 | Orbital Insight, Inc. | Remote determination of containers in geographical region |
| US10074271B1 (en) * | 2017-06-02 | 2018-09-11 | Yandex Europe Ag | Methods and systems for generating a traffic prediction |
| US10319223B2 (en) | 2017-06-02 | 2019-06-11 | Yandex Europe Ag | Methods and systems for generating a traffic prediction |
| US10997537B2 (en) * | 2017-12-28 | 2021-05-04 | Canon Kabushiki Kaisha | Information processing apparatus, system, method, and non-transitory computer-readable storage medium for adjusting a number of workers in a workshop |
| US11790773B2 (en) | 2019-02-25 | 2023-10-17 | Quantifly Llc | Vehicle parking data collection system and method |
| US20260038364A1 (en) * | 2024-07-31 | 2026-02-05 | Fujitsu Limited | Traffic simulator adjustment |
Also Published As
| Publication number | Publication date |
|---|---|
| ES2710672T3 (es) | 2019-04-26 |
| TW201602974A (zh) | 2016-01-16 |
| US20150356868A1 (en) | 2015-12-10 |
| EP3078014B1 (en) | 2018-12-12 |
| EP3078014A1 (en) | 2016-10-12 |
| WO2015185594A1 (en) | 2015-12-10 |
Similar Documents
| Publication | Publication Date | Title |
|---|---|---|
| US9390621B2 (en) | System and method for measuring the real traffic flow of an area | |
| US9208682B2 (en) | Lane level congestion splitting | |
| CN112749825B (zh) | 预测车辆的目的地的方法和装置 | |
| EP2966590B1 (en) | Lane level traffic | |
| US10672264B2 (en) | Predictive incident aggregation | |
| Wang et al. | Estimating dynamic origin-destination data and travel demand using cell phone network data | |
| JP7042983B2 (ja) | センサーデータおよび分散デバイスデータを用いたオブジェクト集団推定の結合モデリング | |
| US10755558B2 (en) | Method, apparatus, and system for detecting venue trips and related road traffic | |
| US11781869B2 (en) | Method and apparatus for providing an indoor pedestrian origin-destination matrix and flow analytics | |
| EP3992581A1 (en) | Method, apparatus, and system for estimating continuous population density change in urban areas | |
| US20220207995A1 (en) | Origination destination route analytics of road lanes | |
| US12307886B2 (en) | Method, apparatus, and system for traffic prediction based on road segment travel time reliability | |
| US10904853B2 (en) | Estimation of mobile device count | |
| US10489431B2 (en) | Digital location-based data methods and product | |
| US10062282B2 (en) | Method and system for determining effect of weather conditions on transportation networks | |
| Kumarage | Use of crowdsourced travel time data in traffic engineering applications | |
| Kou et al. | Mapping the spatio-temporal visibility of global navigation satellites in the urban road areas based on panoramic imagery | |
| Cui et al. | Establishing multisource data-integration framework for transportation data analytics | |
| Barker et al. | Investigating the use of machine learning for smart parking applications | |
| Tettamanti et al. | Road traffic measurement and related data fusion methodology for traffic estimation | |
| Huo et al. | Exploring the influencing factors on demand-responsive customized bus ridership using multi-source data | |
| Gudishala et al. | Travel time estimation using Bluetooth | |
| Macfarlane et al. | A synthesis of passive third-party data sets used for transportation planning | |
| Ling et al. | A preliminary study: Mobile application for shuttle bus service | |
| US12591649B2 (en) | System and method for age based processing of user data |
Legal Events
| Date | Code | Title | Description |
|---|---|---|---|
| AS | Assignment |
Owner name: CUENDE INFOMETRICS, S.A., SPAIN Free format text: ASSIGNMENT OF ASSIGNORS INTEREST;ASSIGNOR:CUENDE ALONSO, DANIEL;REEL/FRAME:036075/0033 Effective date: 20150623 |
|
| STCF | Information on status: patent grant |
Free format text: PATENTED CASE |
|
| MAFP | Maintenance fee payment |
Free format text: PAYMENT OF MAINTENANCE FEE, 4TH YR, SMALL ENTITY (ORIGINAL EVENT CODE: M2551); ENTITY STATUS OF PATENT OWNER: SMALL ENTITY Year of fee payment: 4 |
|
| MAFP | Maintenance fee payment |
Free format text: PAYMENT OF MAINTENANCE FEE, 8TH YR, SMALL ENTITY (ORIGINAL EVENT CODE: M2552); ENTITY STATUS OF PATENT OWNER: SMALL ENTITY Year of fee payment: 8 |