WO2005106920A2 - Mass spectrometer - Google Patents
Mass spectrometer Download PDFInfo
- Publication number
- WO2005106920A2 WO2005106920A2 PCT/GB2005/001674 GB2005001674W WO2005106920A2 WO 2005106920 A2 WO2005106920 A2 WO 2005106920A2 GB 2005001674 W GB2005001674 W GB 2005001674W WO 2005106920 A2 WO2005106920 A2 WO 2005106920A2
- Authority
- WO
- WIPO (PCT)
- Prior art keywords
- sample
- analytes
- molecules
- components
- mass
- Prior art date
- Legal status (The legal status is an assumption and is not a legal conclusion. Google has not performed a legal analysis and makes no representation as to the accuracy of the status listed.)
- Ceased
Links
Classifications
-
- G—PHYSICS
- G01—MEASURING; TESTING
- G01N—INVESTIGATING OR ANALYSING MATERIALS BY DETERMINING THEIR CHEMICAL OR PHYSICAL PROPERTIES
- G01N30/00—Investigating or analysing materials by separation into components using adsorption, absorption or similar phenomena or using ion-exchange, e.g. chromatography or field flow fractionation
- G01N30/02—Column chromatography
- G01N30/86—Signal analysis
- G01N30/8675—Evaluation, i.e. decoding of the signal into analytical information
- G01N30/8682—Group type analysis, e.g. of components having structural properties in common
-
- G—PHYSICS
- G01—MEASURING; TESTING
- G01N—INVESTIGATING OR ANALYSING MATERIALS BY DETERMINING THEIR CHEMICAL OR PHYSICAL PROPERTIES
- G01N30/00—Investigating or analysing materials by separation into components using adsorption, absorption or similar phenomena or using ion-exchange, e.g. chromatography or field flow fractionation
- G01N30/02—Column chromatography
- G01N30/86—Signal analysis
-
- G—PHYSICS
- G01—MEASURING; TESTING
- G01N—INVESTIGATING OR ANALYSING MATERIALS BY DETERMINING THEIR CHEMICAL OR PHYSICAL PROPERTIES
- G01N30/00—Investigating or analysing materials by separation into components using adsorption, absorption or similar phenomena or using ion-exchange, e.g. chromatography or field flow fractionation
- G01N30/02—Column chromatography
- G01N30/62—Detectors specially adapted therefor
- G01N30/72—Mass spectrometers
- G01N30/7233—Mass spectrometers interfaced to liquid or supercritical fluid chromatograph
-
- G—PHYSICS
- G06—COMPUTING OR CALCULATING; COUNTING
- G06F—ELECTRIC DIGITAL DATA PROCESSING
- G06F17/00—Digital computing or data processing equipment or methods, specially adapted for specific functions
- G06F17/10—Complex mathematical operations
- G06F17/18—Complex mathematical operations for evaluating statistical data, e.g. average values, frequency distributions, probability functions, regression analysis
-
- H—ELECTRICITY
- H01—ELECTRIC ELEMENTS
- H01J—ELECTRIC DISCHARGE TUBES OR DISCHARGE LAMPS
- H01J49/00—Particle spectrometers or separator tubes
- H01J49/0027—Methods for using particle spectrometers
- H01J49/0036—Step by step routines describing the handling of the data generated during a measurement
-
- H—ELECTRICITY
- H01—ELECTRIC ELEMENTS
- H01J—ELECTRIC DISCHARGE TUBES OR DISCHARGE LAMPS
- H01J49/00—Particle spectrometers or separator tubes
- H01J49/02—Details
Definitions
- the present invention relates to a method of mass spectrometry and a mass spectrometer.
- the preferred embodiment relates to the clustering, associating or grouping of data relating to peptide digest products obtained by liquid chromatography mass spectrometry ("LC-MS").
- the data is preferably clustered by virtue of mass or mass to charge ratio and chromatographic retention time.
- mass spectral data relating to separate acquisitions or experimental runs is preferably associated and analysed.
- changes or differences in the relative concentrations, intensities or expression levels of analytes such as peptides or proteins in two or more different samples may be detected or recognised. Analytes which are expressed differently in two different samples may then be subsequently identified.
- a non-hierarchical clustering method known as k-means clustering is known. This clustering method could in theory be applied to the problem of how to associate or cluster data relating to liquid chromatography mass spectrometry experiments which has been acquired in separate acquisitions or experiments .
- the known k-means clustering approach involves classifying n data points into k clusters. Each point or datum is assigned to a cluster whose average value on a set of d variables is nearest to its centroid by some distance measure (usually Euclidean) on that set. Such assignments can be computed iteratively until reassigning points and recomputing centroids (over all points in a cluster) produces no further changes .
- k-means clustering suffers from the problem that the number of clusters k needs first to be specified before clustering can be performed. Also, k-means clustering only finds specific locations for the cluster centres rather than integrating over all the possible locations of the cluster centres. The ad hoc distance criterion also cannot properly be normalised to give a probability of association between two data points .
- the preferred embodiment relates to a completely different approach to clustering LC-MS data which involves a probabilistic or Bayesian approach to clustering LC-MS data.
- Bayesian probability theory handles probabilities of statements. Probabilities tell how certain those statements are true.
- Bayesian reasoning So called Bayes rule defines how a rational agent changes its beliefs when it gets new information (evidence) . Bayesian probabilities or certainties are always conditional. This means that probabilities are estimated in the context of some background assumptions. Conditional probabilities may be written using the notation P (Thing I Assumption) . The probabilities are numbers between zero and one, that tell how certain it is that Thing is true when it is believed that the Assumption is true.
- Conditional probabilities are often written in the form P(D
- P (M) or P(D) are imprecise Bayesian notations, since all the probabilities are actually conditional. However, sometimes, when all the terms have the same background assumptions then it may not be necessary to repeat them.
- probabilities should be written in the form P(D
- Expert systems often calculate the probabilities of inter-dependent events by giving each parent event a weighting.
- Bayesian Belief Networks are considered to provide a mathematically correct and therefore more accurate method of measuring the effects of events on each other.
- the mathematics involved enable calculations to be made in both directions. So it is possible, for example, to find out which event was the most likely cause of another.
- p(AB) means the probability of A and B happening. This is a special case of the following Product Rule for dependent events, where p(A
- B) means the probability of A given that B has already occurred: p (AB ) P (A) * P ( B
- A) p (AB ) P ( B ) * p (A
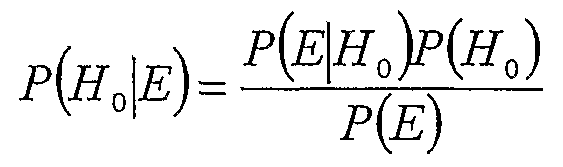
- Bayes' theorem can be summarised as:
- Ho can be taken to be a hypothesis which may have been developed ab initio or induced from some preceding set of observations, but before the new observation or evidence E.
- the term P(H 0 ) is called the prior probability of H 0 .
- H 0 ) is the conditional probability of seeing the observation E given that the hypothesis H 0 is true - as a function of H 0 given E, it is called the likelihood function.
- P(E) is called the marginal probability of E and it is a normalizing constant and can be calculated as the sum of all mutually exclusive hypotheses:
- E) is called the posterior probability of Ho given E.
- H 0 )/P(E) gives a measure of the impact that the observation has on belief in the hypothesis. If it is unlikely that the observation will be made unless the particular hypothesis being considered is true, then this scaling factor will be large. Multiplying this scaling factor by the prior probability of the hypothesis being correct gives a measure of the posterior probability of the hypothesis being correct given the observation.
- the keys to making the inference work is the assigning of the prior probabilities given to the hypothesis and possible alternatives, and the calculation of the conditional probabilities of the observation under different hypotheses.
- a method of mass spectrometry comprising: determining a first physico-chemical property and a second physico-chemical property of components, molecules or analytes in a first sample, wherein the first physico-chemical property comprises the mass or mass to charge ratio and the second physico-chemical property comprises the elution time, hydrophobicity, hydrophilicity, migration time, or chromatographic retention time; determining a first physico-chemical property and a second physico-chemical property of components, molecules or analytes in a second sample, wherein the first physico- chemical property comprises the mass or mass to charge ratio and the second physico-chemical property comprises the elution time, hydrophobicity
- the method further comprises determining a first physico-chemical property and a second physico-chemical property of components, molecules or analytes in one or more further samples, wherein the first physico-chemical property comprises the mass or mass to charge ratio and the second physico-chemical property comprises the elution time, hydrophobicity, hydrophilicity, migration time, or chromatographic retention time.
- a likely error of the first physico-chemical property and/or a likely error of the second physico-chemical property are preferably determined.
- Components, molecules or analytes in the first sample and/or the second sample and/or further samples are preferably separated by liquid chromatography.
- molecules or analytes in the first sample and/or the second sample and/or further samples are separated from other components, molecules or analytes: (i) High Performance Liquid Chromatography ("HPLC") ; (ii) anion exchange; (iii) anion exchange chromatography; (iv) cation exchange; (v) cation exchange chromatography; (vi) ion pair reversed-phase chromatography; (vii) chromatography; (vii) single dimensional electrophoresis; (ix) multi-dimensional electrophoresis ; (x) size exclusion; (xi ) affinity; (xii ) revere phase chromatography; (xiii ) Capillary Electrophoresis Chromatography ( "CEC” ) ; (xiv) electrophoresis ; (xv) ion mobility separation; (xvi ) Field Asymmetric Ion Mobility Separation ( "FAIMS " ) ; or ( xvi) capillary electrophore
- HPLC High
- a single data set is preferably formed from data relating to the first sample and/or data relating to the second sample and/or data relating to further samples .
- a sample number is preferably assigned to data in the single data set .
- the step of probabilistically associating, clustering or grouping data relating to components, molecules or analytes in the first sample with data relating components, molecules or analytes in the second sample preferably further comprises using or adopting a method of trial and error and determining the most probable association, clustering or grouping of data.
- data points related to components, molecules or analytes in the first sample are compared with data points related to components, molecules or analytes in the second sample and/or data points related to components, molecules or analytes in further samples .
- Each data point preferably comprises a value of the first physico-chemical property and/or a value of the second physico-chemical property.
- the data points are preferably divided or separated into mass or mass to charge ratio bins having a width of x Daltons wherein x is preferably selected from the group consisting of: (i) 1.0000-1.0001; (ii) 1.0001- 1.0002; (iii) 1.0002-1.0003; (iv) 1.0003-1.0004; (v) 1.0004- 1.0005; (vi) 1.0005-1.0006; (vii) 1.0006-1.0007; (viii) 1.0007-1.0008; (ix) 1.0008-1.0009; (x) 1.0009-1.0010; (xi) ⁇ 1.0000; (xii) > 1.0010; and (xiii) 1.0005.
- the data is preferably initially clustered, grouped or associated into one or more first clusters of data points.
- the step of clustering the data points into one or more first clusters of data points preferably comprises probabilistically clustering the data points although less preferably other approaches may be used to initially cluster the data.
- the preferred method preferably further comprises assessing the closeness of data points on a pairwise basis.
- the step of assessing the closeness of data points on a pairwise basis preferably comprises assessing the closeness of data points in a mass or mass to charge ratio bin given determined mass errors or mass to charge ratio errors on a pairwise basis.
- the preferred method further comprises calculating probabilistically the likelihood that two data points relate to the same component, molecule or analyte.
- the method further comprises determining pairwise probabilities Pi-, that two data points relate to the same component, molecule or analyte.
- the method further comprises arranging the pairwise probabilities p in a matrix.
- one or more trial truth tables are assigned to the matrix.
- the method preferably further comprises checking whether or not the matrix is self consistent by determining whether or not the matrix obeys a transitivity property.
- the method further comprises assigning further trial truth tables to the matrix.
- a particularly preferred aspect of the preferred embodiment comprises determining the most probable truth table.
- the data may initially be clustered, grouped or associated into one or more first clusters of data points comprises using k-means clustering or other methods known per se.
- the clustering of data is then optionally tested to see whether it can be improved upon. It is possible that at the end of this optional testing the clustering of data may not have substantially changed. Indeed, according to an embodiment it is contemplated that the data may be optimally initially clustered by the disclosed probabilistic clustering method and the further steps do not result in any initial improvement in the clustering of data.
- the method preferably further comprises probabilistically clustering the data points into one or more second clusters of data points. The method may comprise maximising the overall probability or equivalently of the one or more second clusters of data points. This may involve moving or putting data points into new clusters of data points.
- each data point may be moved or put into the same cluster as a data point having the nearest higher or lower value of the first physico- chemical property and/or the second physico-chemical property.
- each data point may be moved or put into its own cluster if it is initially in the same cluster as a neighbouring data point.
- the method further comprises iteratively modifying the cluster to which a or each data point is initially considered to belong until substantially no further improvement is found. The method of iteratively modifying the cluster to which a or each data point is initially considered to belong may continue until a pre-assigned iteration limit is reached.
- the method further comprises interrogating the one or more second (or less preferably first) clusters of data points to determine one or more third clusters of data points which preferably include one and only one data point representing a molecule, analyte or ion from the first sample, the second sample and any further samples.
- this strict requirement may sometimes be dropped especially if there is a large amount of data.
- the method may further comprise interrogating the one or more second (or less preferably first) clusters of data points to determine one or more third clusters of data points which generally (but not necessarily exclusively) include one data point representing a molecule, analyte or ion from the first sample, the second sample and any further samples.
- the data points relating to the third clusters of data points are assumed to have or assigned a high level of certainty or are assumed to have or are assigned a value of true or one. These data points then act as internal reference points.
- the data relating to the second physico- chemical property of molecules, analytes or ions in at least some or each of the one or more third clusters of data points is averaged to form an average value for the second physico- chemical property.
- data of the one or more data points which is clustered to form the third clusters of data points is adjusted such that the average value becomes the value of the second physico-chemical property for the data points .
- the method preferably further comprises determining a calibration function to correlate or correct data relating to the observed second physico-chemical property with the average value for the second physico-chemical property.
- the calibration function may comprise a cubic spline function, a polynomial function or a probabilistic calibration function.
- the method further comprises adjusting data points from each sample or from all samples to align recalibrate, correct or reassign the second physico-chemical property for all data sets.
- the method preferably further comprises determining or assigning an error for the second physico- chemical property (e.g. retention time) .
- the preferred method preferably further comprises comparing adjusted data points related to components, molecules or analytes in the first sample with adjusted data points related to components, molecules or analytes in the second sample and/or adjusted data points related to components, molecules or analytes in further samples.
- Each adjusted data point preferably comprises an unadjusted value of the first physico-chemical property and/or an adjusted value of the second physico-chemical property.
- the adjusted data points are preferably divided or separated into mass or mass to charge ratio bins having a width of x Daltons wherein x is preferably selected from the group consisting of: (i) 1.0000-1.0001; (ii) 1.0001-1.0002; (iii) 1.0002-1.0003; (iv) 1.0003-1.0004; (v) 1.0004-1.0005; (vi) 1.0005-1.0006; (vii) 1.0006-1.0007; (viii) 1.0007-1.0008; (ix) 1.0008-1.0009; (x) 1.0009-1.0010; (xi) ⁇ 1.0000; (xii) > 1.0010; and (xiii) 1.0005.
- x is preferably selected from the group consisting of: (i) 1.0000-1.0001; (ii) 1.0001-1.0002; (iii) 1.0002-1.0003; (iv) 1.0003-1.0004; (v) 1.0004-1.0005; (vi) 1.0005-1.0006; (vii
- the method preferably further comprises clustering the adjusted data points into one or more fourth clusters of data points.
- the step of clustering the adjusted data points into one or more fourth clusters of data points preferably comprises probabilistically clustering the data points in a similar manner to before.
- the method therefore preferably comprises assessing the closeness of adjusted data points on a pairwise basis, wherein the step of assessing the closeness of adjusted data points on a pairwise basis comprises assessing the closeness of adjusted data points in a mass or mass to charge ratio bin given determined mass errors or mass to charge ratio errors on a pairwise basis .
- the method preferably further comprises calculating probabilistically the likelihood that two adjusted data points relate to the same component, molecule or analyte.
- the method preferably further comprises determining pairwise probabilities that two adjusted data points relate to the same component, molecule or analyte.
- the pairwise probabilities pi are preferably arranged in a second matrix.
- One or more second truth tables are preferably assigned to the second matrix.
- a check is preferably made as to whether or not the second matrix is self consistent by determining whether or not the second matrix obeys a transitivity property.
- the method preferably further comprises checking whether or not the second matrix is self consistent by determining whether or not the second matrix obeys a transitivity property.
- the transitivity property comprises b jk — by AND b ik . If the second matrix does not obey the transitivity property then the method preferably further comprises rejecting the further second trial truth table. If the second matrix does obey the transitivity property then the method preferably further comprises assigning a probability to the second further trial truth tables. According to an embodiment the method further comprises determining the most probable second truth table. According to a less preferred embodiment the step of clustering the data into one or more fourth clusters of data points comprises using k-means clustering. The preferred embodiment preferably comprises probabilistically clustering the adjusted data points into one or more fifth clusters of data points. This step is optional but not essential.
- the preferred embodiment preferably comprises maximising the overall probability or equivalently of the one or more fifth clusters of data points. This preferably involves moving or putting data points into new clusters of data points. Preferably, each data point is moved or put into the same cluster as a data point having the nearest higher or lower value of the first physico-chemical property and/or the second physico-chemical property. Preferably, each data point is moved or put into its own cluster if it is initially in the same cluster as a neighbouring data point. The method preferably further comprises iteratively modifying the cluster to which a or each data point is initially considered to belong until substantially no further improvement is found.
- the method further comprises iteratively modifying the cluster to which a or each data point is initially considered to belong until a pre-assigned iteration limit is reached.
- the method comprises determining the intensity of first components, molecules or analytes in the first sample and/or first components, molecules or analytes in the second sample and/or first components, molecules or analytes in further samples.
- the intensity of the first components, molecules or analytes in the first sample is compared with corresponding first components, molecules or analytes in the second sample and/or further samples, wherein the first components, molecules or analytes belong to the same association, clustering or grouping of data.
- the first sample and/or the second sample and/or further samples may comprise a plurality of different biopolymers, proteins, peptides, polypeptides, oligionucleotides, oligionucleosides, amino acids, carbohydrates, sugars, lipids, fatty acids, vitamins, hormones, portions or fragments of DNA, portions or fragments of cDNA, portions or fragments of RNA, portions or fragments of mRNA, portions or fragments of tRNA, polyclonal antibodies, monoclonal antibodies, ribonucleases, enzymes, metabolites, polysaccharides, phosphorolated peptides, phosphorolated proteins, glycopeptides, glycoproteins or steroids.
- the first sample and/or the second sample and/or further samples comprise at least 2, 5, 10, 20, 30, 40, 50, 60, 70, 80, 90, 100, 200, 300, 400, 500, 600, 700, 800, 900, 1000, 1500, 2000, 2500, 3000, 3500, 4000, 4500, or 5000 components, molecules or analytes having different identities.
- the first sample and/or the second sample and/or further samples may comprise a non-equimolar heterogeneous complex mixture.
- the components, molecules or analytes in the first sample are preferably substantially the same as the components, molecules or analytes in the second sample and/or further samples .
- the components, molecules or analytes are preferably endogenous or exogenous to the first sample and/or the second sample and/or further samples.
- the first sample is taken from a diseased organism and the second sample is taken from a non-diseased organism;
- the first sample is taken from a treated organism and the second sample is taken from a non-treated organism; or
- the first sample is taken from a mutant organism and the second sample is taken from a wild type organism.
- the method further comprises identifying one or more of the components, molecules or analytes in the first sample and/or the second sample and/or further samples.
- one or more components, molecules or analytes in the first sample and/or one or more components, molecules or analytes in the second sample and/or one or more components, molecules or analytes in further samples are only identified if the intensity of one or more components, molecules or analytes in the first sample differ from the intensity of one or more components, molecules or analytes in the second sample and/or further samples by more than a predetermined amount.
- one or more components, molecules or analytes in the first sample and/or one or more components, molecules or analytes in the second sample and/or one or more components, molecules or analytes in further samples are only identified if the average intensity of a plurality of different components, molecules or analytes in the first sample differs from the average intensity of a plurality of different components, molecules or analytes in the second sample and/or further samples by more than a predetermined amount.
- the predetermined amount is preferably selected from the group consisting of: (i) 1%; (ii) 2%; (iii) 5%; (iv) 10%; (v) 20%; (vi) 50%; (vii) 100%; (viii) 150%; (ix) 200%; (x) 250%; (xi) 300%; (xii) 350%; (xiii) 400%; (xiv) 450%; (xv) 500%; (xvi) 1000%; (xvii) 5000%; and (xviii) 10000%.
- a mass spectrometer comprising: means arranged to determine a first physico-chemical property and a second physico-chemical property of components, molecules or analytes in a first sample, wherein the first physico-chemical property comprises the mass or mass to charge ratio and the second physico-chemical property comprises the elution time, hydrophobicity, hydrophilicity, migration time, or chromatographic retention time; means arranged to determine a first physico-chemical property and a second physico-chemical property of components, molecules or analytes in a second different sample, wherein the first physico-chemical property comprises the mass or mass to charge ratio and the second physico-chemical property comprises the elution time, hydrophobicity, hydrophilicity, migration time, or chromatographic retention time; and means arranged to probabilistically associate, cluster or group components, molecules or analytes in the first sample with components, molecules or analytes in the second
- the mass spectrometer preferably comprises a liquid chromatograph.
- the mass spectrometer further comprises one or mass filters and/or one or more mass analysers.
- the one or more mass filters and the one or more mass analysers are selected from the group consisting of: (i) an orthogonal acceleration Time of Flight mass analyser; (ii) an axial acceleration Time of Flight mass analyser; (iii) a Paul 3D quadrupole ion trap mass analyser; (iv) a 2D or linear quadrupole ion trap mass analyser; (v) a Fourier Transform Ion Cyclotron Resonance mass analyser; (vi) a magnetic sector mass analyser; (vii) a quadrupole mass analyser; and (viii) a Penning trap mass analyser.
- the mass spectrometer preferably further comprises an ion source.
- the ion source preferably comprises a pulsed ion source or a continuous ion source.
- the ion source is preferably selected from the group consisting of: (i) an Electrospray ionisation (“ESI”) ion source; (ii) an Atmospheric Pressure Photo lonisation (“APPI”) ion source; (iii) an Atmospheric Pressure Chemical Ionisation (“APCI”) ion source; (iv) a Matrix Assisted Laser Desorption Ionisation (“MALDI”) ion source; (v) a Laser Desorption Ionisation (“LDI”) ion source; (vi) an Atmospheric Pressure Ionisation (“API”) ion source; (vii) a Desorption Ionisation on Silicon (“DIOS”) ion source; (viii) an Electron Impact ("El”) ion source; (ix) a Chemical Ionisation (“Cl”) i
- a method of mass spectrometry comprising: determining a first physico-chemical property and a second physico-chemical property of components, molecules or analytes in a first sample; determining a first physico-chemical property and a second physico-chemical property of components, molecules or analytes in a second sample; and probabilistically associating, clustering or grouping components, molecules or analytes in the first sample with components, molecules or analytes in the second sample.
- the first physico-chemical property comprises: (i) mass or mass to charge ratio; (ii) isotopic or decharged mass or mass to charge ratio; or (iii) mono-isotopic or deisotoped mass or mass to charge ratio.
- the second physico-chemical property comprises chromatographic retention time.
- the second physico-chemical property is selected from the group consisting of: (i) solubility; (ii) molecular volume or size; (iii) net charge, charge state, ionic charge or composite observed charge state; (iv) isoelectric point (pi) ; (v) dissociation constant (pKa) ; (vi) antibody affinity; (vii) electrophoretic mobility; (viii) ionisation potential; (ix) dipole moment; (x) hydrogen-bonding capability or hydrogen-bonding capacity; and (xi) ion mobility in gas phase.
- a mass spectrometer comprising: means arranged to determine a first physico-chemical property of components, molecules or analytes in a first sample; means arranged to determine a first physico-chemical property of components, molecules or analytes in a second different sample; and means arranged to probabilistically associate, cluster or group components, molecules or analytes in the first sample with components, molecules or analytes in the second sample.
- a probabilistic method of clustering liquid chromatography mass spectrometry peptide data from different acquisitions comprising: measuring the retention times and masses of a plurality of ions from related samples in different experimental acquisitions; generating a data set comprising the masses and retention times along with estimates of the uncertainties inherent in each measurement; associating data between different acquisitions using mass and retention time; calculating average retention times where the associations give rise to clusters having one and only one representative from each experimental acquisition; using the average retention times as reference points to calibrate the retention times for each acquisition; and associating data using mass and retention time as strongly as is warranted by the precision of the chromatography and the quality of the calibration.
- the association of data is achieved by dividing the data into mass bins of 1.0005 Da.
- the method further comprises for each mass bin determining the pair-wise probability of association of each pair of data in that mass bin.
- the method further comprises determining a probability for any trial clustering of the data in the mass bin by combining the pair-wise probabilities.
- the method further comprises finding a plausible initial clustering of the data in mass and retention time by thresholding the pair-wise probabilities .
- the method further comprises finding the most probable clustering by local search with the plausible initial clustering as a starting point.
- the step of associating data between different acquisitions preferably using mass and retention times preferably comprises using retention time as a weaker constraint than mass.
- a method of mass spectrometry comprising: probabilistically associating, clustering or grouping components, molecules or analytes in a first sample or data relating to components, molecules or analytes in a first sample with components, molecules or analytes in a second sample or data relating to components, molecules or analytes in a second sample.
- a mass spectrometer comprising: means arranged to probabilistically associate, cluster or group components, molecules or analytes in a first sample or data relating to components, molecules or analytes in a first sample with components, molecules or analytes in a second sample or data relating to components, molecules or analytes in a second sample.
- a method of mass spectrometry comprising: associating, clustering or grouping components, molecules or analytes in a first sample or data relating to components, molecules or analytes in a first sample with components, molecules or analytes in a second sample or data relating to components, molecules or analytes in a second sample .
- a mass spectrometer comprising: means arranged to associate, cluster or group components, molecules or analytes in a first sample or data relating to components, molecules or analytes in a first sample with components, molecules or analytes in a second sample or data relating to components, molecules or analytes in a second sample.
- a method of mass spectrometry comprising associating, clustering or grouping data.
- a mass spectrometer comprising means arranged to associate, cluster or group data.
- the preferred embodiment relates to clustering liquid chromatography mass spectrometry (LC-MS) data acquired in separate experimental acquisitions, preferably on the basis of mass or mass to charge ratio and retention time e.g. chromatographic retention time.
- LC-MS liquid chromatography mass spectrometry
- the preferred approach does not require samples to use a separate calibrant which is added to the samples in order to locate or recognise the same species of analyte in different experimental data.
- the use of calibrants which are introduced to samples can interfere with or suppress data.
- a calibrant may however be used periodically for a different purpose in experimental runs namely to ensure that the settings of mass spectrometer do not drift.
- the preferred embodiment relates to processing LC-MS data and clustering such data.
- the disclosed probabilistic or Bayesian approach to clustering data could also be applied to Gas Chromatography Mass
- GC-MS Spectrometry
- a probabilistic measure is used to assess the closeness of data points on a pair-wise basis. This measure compares the hypothesis that the data arose from a single cluster against the hypothesis that the data arose from two distinct clusters considered a priori to be distributed randomly with uniform probability preferably within the mass-retention time plane.
- a mean of a Poisson distribution
- ⁇ N> clusters being expected and the positions of two data points are x ⁇ and x ⁇ r the probability that two data points are associated with the same cluster is given by:
- L ⁇ -,) is a probabalistic calculation of the likelihood that two data points x x and x-, are data points relating to the same component, molecule or analyte (i.e. peptide digest product) present within two separate experimental acquisitions. Assuming Gaussian errors and a uniform prior probability distribution for the location of clusters the likelihood that two data points relate to the same peptide can be given as:
- ⁇ and ⁇ ⁇ are the uncertainties in the positions x x and x ⁇ respectively. This generalizes to two or more dimensions.
- the probability measure p e [ ⁇ ,lJ has the interpretation that two data belong to the same cluster rather than different clusters. Unlike k-means clustering, this probability has been integrated over all possible positions of the cluster centre . Any trial configuration of clusters of the data can be assigned an overall probability by combining the pair-wise probability values p ⁇ ;) defined by the probability measure:
- C is set of data assigned to the cluster to which datum i is assigned and M is the number of data points.
- M is the number of data points.
- some of the analytes relating to peptide digest products are preferably initially clustered using a matrix method.
- the pair-wise probabilities p ⁇ of two data points relating to the same species of peptide digest product are initially arranged in a matrix.
- the matrix preferably comprises the pair-wise probabilities p 13 that every two data points are associated with the same cluster.
- the following matrix represents the probabilities that the data points in each of the combinations of pairs of four data points A-D are related to the same cluster:
- the matrix shows the probability p ⁇ that point A is related to the same cluster as point B as being 0.8. Points A and B may therefore be considered reasonably likely to relate to the same cluster. In contrast, the probability p i ⁇ that point B relates to the same cluster as point D is 0.2. This may therefore be considered reasonably unlikely.
- the matrix may then be analysed at various thresholds, between 0 and 1, so that those probabilities below the threshold are assigned a value of false (e.g. 0) whilst those above the threshold are assigned a value of true (e.g. 1) indicating which data are associated with the same cluster.
- the above condition is therefore preferably checked. If the transitivity property is not met then the trial truth table is preferably rejected.
- the thresholding scheme may be generalized to act on various reconstructions of the matrix of pair-wise probabilities. These are preferably produced iteratively by — -. —
- an initial cluster configuration may then be improved upon by considering orderings of the data points on the basis of mass and chromatographic retention time.
- the clusters to which data points belong can then be modified according to an iterative scheme for each ordering. According to this scheme, each datum may be put into a new cluster. It is also put into the previous datum's cluster, if distinct. It is also put into the next datum's cluster, if distinct. This process may be repeated until no further improvement is found or a pre-assigned iteration limit is reached.
- the data is preferably divided into nominal mass ranges or bins.
- the difference in mass between the centres of two adjacent mass bins is preferably large enough such that data relating to different peptides do not fall into the same mass bin.
- Amino acids have a mass sufficiency which varies from about 1.00009 to about 1.00074, with a mean mass sufficiency of approximately 1.00047.
- biological samples commonly exhibit a periodicity of approximately 1.0005 atomic mass units (Daltons) and hence the bins preferably are arranged to have a mass range of 1.0005 Da which corresponds to the mass of an average peptide baryon. Multiple data for the same peptide tend to concentrate around the centre of a single mass bin. The likelihood of the data falling into an adjacent mass bin due to errors is therefore very low.
- the data in different bins can be considered to relate to different peptides i.e. different clusters .
- a particularly preferred aspect of the preferred embodiment is the alignment of the retention-time axes for the data from each acquisition. This is highly advantageous since reported retention times are usually uncalibrated and systematic differences often occur between data sets from each acquisition. The correct realignment of retention times from • two data sets is therefore advantageous and the ability of the preferred embodiment to perform this step represents an important advance in the art.
- an initial pass of clustering is performed with only a relatively weak contribution from the proximity of data in retention time . This may be achieved by assigning large values to the retention time uncertainties for each datum.
- Resulting clusters that have one and only one representative from each acquisition are used to form a list of potential reference points (with uncertainties) by taking averages (and standard deviations) .
- Outliers are preferably rejected and the remaining references are used to re-align the retention times in each acquisition by a probabilistic calibration system.
- FIG. 2A shows a graph of mass against retention time according to the preferred embodiment wherein the retention times have been realigned and shows the same error bars for the mass measurement as in Fig. 1A
- Fig. 2B shows a related graph of mass against retention time for the same data as shown in Fig. 2A but shows the significantly reduced error bars for the retention time measurements resulting from the preferred embodiment.
- the table below relates to fifteen data points observed from liquid chromatography mass spectrometry experiments relating to four separate species of ions all having the same nominal mass of 2458 Daltons but which have different chromatographic retention times . The masses of each of the peptide ions and their corresponding retention times are shown together with the standard deviation in each mass measurement.
- the data points were acquired from six separate acquisitions and were initially assigned to four separate clusters i.e. four distinct species of ion were believed to be present in the sample being analysed.
- the experimental data was then processed in accordance with the preferred embodiment to obtain re-aligned retention times.
- Figs . 1A and IB show plots of the fifteen experimental data points i.e. before the retention times have been realigned in accordance with the preferred embodiment.
- Fig. 1A shows a plot including mass error bars
- Fig. IB shows the same plot including error bars for retention time.
- the mass or mass to charge ratios of analytes ions may be fairly accurately reproduced from experiment to experiment, there will tend to be larger variations in the measured chromatographic retention time i.e. liquid chromatography is less reliable or reproducible than mass analysis.
- the overall scale of the LC data will tend to drift and this drift can be particularly problematic when seeking to cluster or recognise the same species of component, molecule or analyte present in two or more separate samples.
- the drift in chromatographic retention times may be due to temperature or pressure drifts or due to the LC column clogging up. It will be appreciated that whilst some analytes in separate experiments or samples can be confidently recognised as being the same species without requiring substantial processing of the data, it is often not possible to confidently recognise other species at least initially.
- the preferred embodiment therefore provides an important tool in being able to handle complex mixtures and effectively enables the chromatographic time scales for two sets of data to be realigned so that a much greater number of components in the two data sets can be confidently recognised as comprising the same species.
- the data shown in Figs . 1A and IB has been initially clustered using the matrix method approach discussed above. Although the error bars in the retention time for the experimental data are relatively large (as can be seen from Fig. IB), nonetheless the matrix method approach was able to separate the data into four distinct clusters indicating that to a high level of certainty four different species of peptides or analytes are present. The error bars shown in Figs.
- FIG. 1A and IB are those estimated for the experiments and relate to calibrated, de- isotoped and charge-state reduced masses.
- the error bars on retention times as shown in Fig. IB were derived from a user input estimate of retention time precision.
- the retention time error bars are preferably chosen to represent the worst possible errors, rather than what might be typical, to ensure that the retention times are not treated with greater significance than is justified in the initial clustering procedure.
- the experimental data as presented in the table above and as shown in Figs. 1A and IB was then processed according to the preferred embodiment with the result that the chromatographic retention times were significantly realigned across the data sets .
- Figs. 2A and 2B show experimental data after processing and clustering according to the preferred embodiment. As is apparent from these figures especially Fig.
- the retention times of the data have been significantly realigned such that it is apparent that the four clusters are indeed separate and distinct clusters.
- the data presented in the table above and as shown in Figs. 1A, IB, 2A and 2B represents only a very small amount of data. The reduced amount of data is presented simply for reasons of clarity.
- the data sets may comprise thousands of data points in which case the significant improvement in clustering of data according to the preferred embodiment becomes even more pronounced.
- the data points have been processed according to the preferred embodiment. It is apparent that the preferred method of processing the experimental data has been effective in realigning the retention times of the two data sets thereby enabling like species in the two different samples to be confidently correlated. As can be seen from comparing Fig.
- the mass error bars for each data point remain the same after realigning the retention times according to the preferred embodiment i.e. according to the preferred embodiment the errors in the mass or mass to charge ratio determinations are substantially unaffected by the preferred embodiment .
- the retention time error bars in the Fig. 2B are derived automatically from the probabilistic analysis according to the preferred embodiment.
- the error bars encompass the confidence in the determination for each retention time calculation and the confidence in the re-alignment factor applied to each data point.
- the confidence in the determination for each retention time calculation is largely determined by how many ions there are in the peak, the more ions the higher the confidence. If the retention time of a peak and the nearest reference peak are very similar then the confidence in the calibration at that retention time is high.
- k-means clustering may initially be used to cluster data rather than using the preferred matrix method which was employed to initially cluster the data (as shown in Figs. 1A and IB). If data is initially clustered using k-means clustering then the clustering of data is then preferably further improved upon by applying the preferred probabilistic approach to clustering the data.
Landscapes
- Physics & Mathematics (AREA)
- Engineering & Computer Science (AREA)
- General Physics & Mathematics (AREA)
- Chemical & Material Sciences (AREA)
- Analytical Chemistry (AREA)
- Life Sciences & Earth Sciences (AREA)
- Data Mining & Analysis (AREA)
- Pathology (AREA)
- Immunology (AREA)
- General Health & Medical Sciences (AREA)
- Biochemistry (AREA)
- Health & Medical Sciences (AREA)
- Theoretical Computer Science (AREA)
- Mathematical Optimization (AREA)
- Computational Mathematics (AREA)
- Pure & Applied Mathematics (AREA)
- Mathematical Analysis (AREA)
- Mathematical Physics (AREA)
- Databases & Information Systems (AREA)
- Software Systems (AREA)
- General Engineering & Computer Science (AREA)
- Operations Research (AREA)
- Algebra (AREA)
- Evolutionary Biology (AREA)
- Probability & Statistics with Applications (AREA)
- Bioinformatics & Computational Biology (AREA)
- Bioinformatics & Cheminformatics (AREA)
- Library & Information Science (AREA)
- Other Investigation Or Analysis Of Materials By Electrical Means (AREA)
- Electron Tubes For Measurement (AREA)
Abstract
Description


Claims
Priority Applications (4)
| Application Number | Priority Date | Filing Date | Title |
|---|---|---|---|
| JP2007510123A JP4950029B2 (en) | 2004-04-30 | 2005-05-03 | Mass spectrometer |
| EP05740516.9A EP1745499B1 (en) | 2004-04-30 | 2005-05-03 | Mass spectrometer |
| CA2564330A CA2564330C (en) | 2004-04-30 | 2005-05-03 | A method and mass spectrometer for probabalistically associating data relating to different samples |
| US11/568,437 US8515685B2 (en) | 2004-04-30 | 2005-05-03 | Method of mass spectrometry, a mass spectrometer, and probabilistic method of clustering data |
Applications Claiming Priority (4)
| Application Number | Priority Date | Filing Date | Title |
|---|---|---|---|
| GBGB0409676.4A GB0409676D0 (en) | 2004-04-30 | 2004-04-30 | Mass spectrometer |
| GB0409676.4 | 2004-04-30 | ||
| GBGB0411251.2A GB0411251D0 (en) | 2004-04-30 | 2004-05-20 | Mass spectrometer |
| GB0411251.2 | 2004-05-20 |
Publications (2)
| Publication Number | Publication Date |
|---|---|
| WO2005106920A2 true WO2005106920A2 (en) | 2005-11-10 |
| WO2005106920A3 WO2005106920A3 (en) | 2006-09-21 |
Family
ID=34680446
Family Applications (1)
| Application Number | Title | Priority Date | Filing Date |
|---|---|---|---|
| PCT/GB2005/001674 Ceased WO2005106920A2 (en) | 2004-04-30 | 2005-05-03 | Mass spectrometer |
Country Status (5)
| Country | Link |
|---|---|
| EP (1) | EP1745499B1 (en) |
| JP (1) | JP4950029B2 (en) |
| CA (1) | CA2564330C (en) |
| GB (1) | GB2413696B (en) |
| WO (1) | WO2005106920A2 (en) |
Cited By (1)
| Publication number | Priority date | Publication date | Assignee | Title |
|---|---|---|---|---|
| GB2485187A (en) * | 2010-11-04 | 2012-05-09 | Agilent Technologies Inc | Displaying chromatography data |
Families Citing this family (5)
| Publication number | Priority date | Publication date | Assignee | Title |
|---|---|---|---|---|
| US8165820B2 (en) * | 2005-06-03 | 2012-04-24 | Waters Technologies Corporation | Methods and apparatus for performing retention-time matching |
| GB0514555D0 (en) | 2005-07-15 | 2005-08-24 | Nonlinear Dynamics Ltd | A method of analysing separation patterns |
| GB0514553D0 (en) | 2005-07-15 | 2005-08-24 | Nonlinear Dynamics Ltd | A method of analysing a representation of a separation pattern |
| GB201205009D0 (en) * | 2012-03-22 | 2012-05-09 | Micromass Ltd | Multi-dimensional survey scans for improved data dependent acquisitions (DDA) |
| WO2023120562A1 (en) * | 2021-12-22 | 2023-06-29 | 合同会社H.U.グループ中央研究所 | Device for calculating antibody diversity, method for calculating antibody diversity, and program for calculating antibody diversity |
Family Cites Families (10)
| Publication number | Priority date | Publication date | Assignee | Title |
|---|---|---|---|---|
| JPH07198703A (en) * | 1993-12-28 | 1995-08-01 | Tokai Rubber Ind Ltd | Automatic polymer analyzer based on chromatographic analysis results |
| GB9824444D0 (en) * | 1998-11-06 | 1999-01-06 | Univ Manchester Metropolitan | Micro-Organism identification |
| US6487523B2 (en) * | 1999-04-07 | 2002-11-26 | Battelle Memorial Institute | Model for spectral and chromatographic data |
| US6647341B1 (en) * | 1999-04-09 | 2003-11-11 | Whitehead Institute For Biomedical Research | Methods for classifying samples and ascertaining previously unknown classes |
| US6873915B2 (en) * | 2001-08-24 | 2005-03-29 | Surromed, Inc. | Peak selection in multidimensional data |
| US6989100B2 (en) * | 2002-05-09 | 2006-01-24 | Ppd Biomarker Discovery Sciences, Llc | Methods for time-alignment of liquid chromatography-mass spectrometry data |
| GB2405972B (en) * | 2002-05-31 | 2007-08-15 | Waters Investments Ltd | A method of using data binning in the analysis of chromatograhpy/spectrometry data |
| US7457708B2 (en) * | 2003-03-13 | 2008-11-25 | Agilent Technologies Inc | Methods and devices for identifying related ions from chromatographic mass spectral datasets containing overlapping components |
| US20060194329A1 (en) * | 2003-03-31 | 2006-08-31 | Atsushi Ogiwara | Sample analyzing method and sample analyzing program |
| CA2501003C (en) * | 2004-04-23 | 2009-05-19 | F. Hoffmann-La Roche Ag | Sample analysis to provide characterization data |
-
2005
- 2005-05-03 EP EP05740516.9A patent/EP1745499B1/en not_active Expired - Lifetime
- 2005-05-03 JP JP2007510123A patent/JP4950029B2/en not_active Expired - Fee Related
- 2005-05-03 GB GB0508936A patent/GB2413696B/en not_active Expired - Lifetime
- 2005-05-03 WO PCT/GB2005/001674 patent/WO2005106920A2/en not_active Ceased
- 2005-05-03 CA CA2564330A patent/CA2564330C/en not_active Expired - Fee Related
Non-Patent Citations (1)
| Title |
|---|
| None |
Cited By (2)
| Publication number | Priority date | Publication date | Assignee | Title |
|---|---|---|---|---|
| GB2485187A (en) * | 2010-11-04 | 2012-05-09 | Agilent Technologies Inc | Displaying chromatography data |
| US9792416B2 (en) | 2010-11-04 | 2017-10-17 | Agilent Technologies, Inc. | Peak correlation and clustering in fluidic sample separation |
Also Published As
| Publication number | Publication date |
|---|---|
| CA2564330A1 (en) | 2005-11-10 |
| EP1745499B1 (en) | 2015-10-21 |
| CA2564330C (en) | 2013-08-13 |
| GB0508936D0 (en) | 2005-06-08 |
| GB2413696A (en) | 2005-11-02 |
| JP4950029B2 (en) | 2012-06-13 |
| EP1745499A2 (en) | 2007-01-24 |
| WO2005106920A3 (en) | 2006-09-21 |
| GB2413696B (en) | 2006-11-01 |
| JP2007535672A (en) | 2007-12-06 |
Similar Documents
| Publication | Publication Date | Title |
|---|---|---|
| US7202473B2 (en) | Mass spectrometer | |
| US6983213B2 (en) | Methods for operating mass spectrometry (MS) instrument systems | |
| US9312110B2 (en) | System and method for grouping precursor and fragment ions using selected ion chromatograms | |
| US9395341B2 (en) | Method of improving the resolution of compounds eluted from a chromatography device | |
| US11573213B2 (en) | Method for time-alignment of chromatography-mass spectrometry data sets | |
| EP4078600B1 (en) | Method and system for the identification of compounds in complex biological or environmental samples | |
| JP4497455B2 (en) | Mass spectrometer | |
| US7499807B1 (en) | Methods for recalibration of mass spectrometry data | |
| US8012764B2 (en) | Mass spectrometer | |
| EP1745499B1 (en) | Mass spectrometer | |
| US8515685B2 (en) | Method of mass spectrometry, a mass spectrometer, and probabilistic method of clustering data |
Legal Events
| Date | Code | Title | Description |
|---|---|---|---|
| AK | Designated states |
Kind code of ref document: A2 Designated state(s): AE AG AL AM AT AU AZ BA BB BG BR BW BY BZ CA CH CN CO CR CU CZ DE DK DM DZ EC EE EG ES FI GB GD GE GH GM HR HU ID IL IN IS JP KE KG KM KP KR KZ LC LK LR LS LT LU LV MA MD MG MK MN MW MX MZ NA NI NO NZ OM PG PH PL PT RO RU SC SD SE SG SK SL SM SY TJ TM TN TR TT TZ UA UG US UZ VC VN YU ZA ZM ZW |
|
| AL | Designated countries for regional patents |
Kind code of ref document: A2 Designated state(s): GM KE LS MW MZ NA SD SL SZ TZ UG ZM ZW AM AZ BY KG KZ MD RU TJ TM AT BE BG CH CY CZ DE DK EE ES FI FR GB GR HU IE IS IT LT LU MC NL PL PT RO SE SI SK TR BF BJ CF CG CI CM GA GN GQ GW ML MR NE SN TD TG |
|
| 121 | Ep: the epo has been informed by wipo that ep was designated in this application | ||
| WWE | Wipo information: entry into national phase |
Ref document number: 2564330 Country of ref document: CA |
|
| WWE | Wipo information: entry into national phase |
Ref document number: 2007510123 Country of ref document: JP |
|
| NENP | Non-entry into the national phase |
Ref country code: DE |
|
| WWW | Wipo information: withdrawn in national office |
Country of ref document: DE |
|
| WWE | Wipo information: entry into national phase |
Ref document number: 2005740516 Country of ref document: EP |
|
| WWP | Wipo information: published in national office |
Ref document number: 2005740516 Country of ref document: EP |
|
| WWE | Wipo information: entry into national phase |
Ref document number: 11568437 Country of ref document: US |