WO2009147699A1 - 質量分析データ解析方法及び質量分析データ解析装置 - Google Patents
質量分析データ解析方法及び質量分析データ解析装置 Download PDFInfo
- Publication number
- WO2009147699A1 WO2009147699A1 PCT/JP2008/001411 JP2008001411W WO2009147699A1 WO 2009147699 A1 WO2009147699 A1 WO 2009147699A1 JP 2008001411 W JP2008001411 W JP 2008001411W WO 2009147699 A1 WO2009147699 A1 WO 2009147699A1
- Authority
- WO
- WIPO (PCT)
- Prior art keywords
- isotope
- candidates
- value
- data analysis
- mass spectrometry
- Prior art date
- Legal status (The legal status is an assumption and is not a legal conclusion. Google has not performed a legal analysis and makes no representation as to the accuracy of the status listed.)
- Ceased
Links
Images


Classifications
-
- H—ELECTRICITY
- H01—ELECTRIC ELEMENTS
- H01J—ELECTRIC DISCHARGE TUBES OR DISCHARGE LAMPS
- H01J49/00—Particle spectrometers or separator tubes
- H01J49/0027—Methods for using particle spectrometers
- H01J49/0036—Step by step routines describing the handling of the data generated during a measurement
Definitions
- the present invention relates to a mass spectrometry data analysis method and a mass spectrometry data analysis apparatus for analyzing and processing mass spectrum data collected by mass spectrometry. More specifically, a peak derived from multiply charged ions having two or more charges appears.
- the present invention relates to a mass spectrometric data analysis method and a mass spectrometric data analysis apparatus for analyzing a mass spectrum, obtaining a molecular weight of a target compound, and identifying a target compound.
- An atmospheric pressure ionization interface is used to ionize and analyze a component to be analyzed in a liquid sample or an eluate separated by a liquid chromatograph.
- an electrospray ionization method (ESI) an electrospray ionization method (APCI), and the like are known.
- ESI electrospray ionization method
- APCI atmospheric pressure chemical ionization method
- such an atmospheric pressure ionization interface is often used in combination with a quadrupole mass spectrometer, an ion trap mass spectrometer, or a time-of-flight mass spectrometer.
- the atmospheric pressure ionization interface has a characteristic that multivalent ions having a plurality of charges are easily generated in the process of ionizing the target compound.
- Multivalent ions have an advantage that the m / z value can be limited to a relatively low range because the m / z value is smaller than the molecular weight of the original compound depending on the valence.
- the m / z value of monovalent ions may exceed the measurable range of the mass spectrometer.
- the z value can be kept within the measurable range of the mass spectrometer. For these reasons, mass spectrometry using multiply charged ions is very effective in identifying compounds with large molecular weights.
- ions are added to or desorbed from the target compound to generate multivalent ions.
- ions existing in the mobile phase used in the liquid chromatograph and ions from the metal in the piping For example, ions (adduct ions) in which various components such as sodium (Na), ammonia (NH 4 ), both protons and methanol are added to the target compound can be detected.
- the data analysis processing device is a multivalent observed on the mass spectrum, where n is a natural number, A is the mass of an ion to which A is added (m / z value), and M is the mass of the target compound.
- n is a natural number
- A is the mass of an ion to which A is added (m / z value)
- M is the mass of the target compound.
- the present invention has been made in order to solve the above-mentioned problems, and the object of the present invention is to eliminate the need for the user to estimate the components that are added or desorbed when ionizing the target compound.
- the object is to provide a mass spectrometry data analysis method and a mass spectrometry data analysis apparatus capable of specifying and identifying the mass of a target compound with high accuracy and efficiency even for those who have little chemical knowledge or analysis experience.
- the first invention made to solve the above-mentioned problems is the mass for obtaining the m / z value of the target compound by analyzing the mass spectrum data in which the peak of multivalent ions appears, obtained by mass spectrometry.
- Analytical data analysis method a) a valence estimation step for detecting isotope clusters on the mass spectrum and estimating the valence of each isotope cluster; b) for each detected isotope cluster, a representative point determining step for obtaining an m / z value representing the isotope cluster; c) From the combination of representative points and valences of two or more isotope clusters estimated to be derived from the same target compound, the m / z value of the component added to or desorbed from the target compound upon ionization A candidate extraction step for obtaining candidates; d) For the plurality of candidates obtained by different combinations of a plurality of isotope clusters, the final m / z value of the candidates or the validity of
- the second invention which embodies the mass spectrometry data analysis method according to the first invention, analyzes the mass spectrum data in which the peak of the multiply-charged ion obtained by mass spectrometry appears, thereby obtaining the m /
- a mass spectrometry data analysis device for obtaining a z value, a) valence estimation means for detecting isotope clusters on the mass spectrum and estimating the valence of each isotope cluster; b) representative point determining means for obtaining an m / z value representing the isotope cluster for each of the detected isotope clusters; c) From the combination of representative points and valences of two or more isotope clusters estimated to be derived from the same target compound, the m / z value of the component added to or desorbed from the target compound upon ionization Candidate extraction means for obtaining candidates; d) For the plurality of candidates obtained by different combinations of a plurality of isotope clusters, the final m
- the mass spectrometry data analysis method according to the first invention is described as a program that runs on a computer, and the mass spectrometry data analysis apparatus according to the second invention is realized by running this program on a computer. Can do.
- the mass spectrometer used here needs to have high mass resolution and mass accuracy. Specifically, high resolution and accuracy are required so that a plurality of isotope peaks constituting the isotope cluster can be sufficiently observed. In this respect, it is generally preferable to use a time-of-flight mass separator (TOF-MS) as a mass separator.
- TOF-MS time-of-flight mass separator
- an atmospheric pressure ion source typified by electrospray ionization is used in that it is easy to obtain a mass spectrum in which a multivalent ion peak appears.
- the applicant of the present application has applied international application number PCT.
- the method proposed in / JP2006 / 308909 International Publication No. WO2006 / 12928 can be used. That is, first, centroid data is created in which each peak on the mass spectrum is represented by two values, the m / z value representing the center of gravity of the peak and the peak area.
- the isotope cluster on the mass spectrum is detected, and at the same time, the valence is estimated from the m / z intervals of a plurality of peaks constituting the isotope cluster.
- the peak of multivalent ions derived from this single compound appears in the mass spectrum. Therefore, a plurality of isotopic clusters having different valences derived from a single compound are detected.
- the sample is a mixture of a plurality of compounds, the peak of multivalent ions derived from each compound appears in the mass spectrum. Therefore, since there are isotopic clusters having different valences for a plurality of compounds, the mass spectrum becomes more complicated.
- the representative point determination step determines the m / z value of the representative point for each isotope cluster. It is known that isotope clusters made of the same substance have almost the same distribution shape even when their valences are different. Therefore, usually, the peak that appears at the head of the isotope cluster or the peak that shows the maximum intensity is often used as the representative point. However, when the molecular weight is large, the peak appearing at the head is low in intensity and may be buried in noise. For this reason, there is a case where the peak one behind is picked up instead of the top. In addition, regarding the peak of maximum intensity, it is easily considered that they are interchanged when the maximum intensity and the second highest intensity are close.
- the center-of-gravity m / z values of a plurality of peaks near the maximum intensity peak may be determined as the representative point.
- the m / z value of monoisotopic ions can be used.
- the valence and representative point of each isotope cluster are determined.
- multivalent ions derived from the same compound are ions generated by adding or desorbing the same component to the compound regardless of the valence.
- different components may be added to or removed from different compounds to generate multivalent ions.
- Limiting the range of m / z values that can be taken because the types of components that add to or desorb from compounds to generate adduct ions can be assumed to some extent and their m / z values are not so large. Can do.
- the candidate extraction step for a large number of isotope clusters, considering the range of m / z values that can be taken by the addition / desorption components, it is estimated that they originate from the same compound from their valences and representative points Two or more isotope clusters to be extracted are extracted, and m / z values of the addition / desorption components are calculated by a combination of these isotope clusters, and these are used as candidates for the addition / desorption component m / z values. . Even for combinations of isotope clusters presumed to originate from the same compound, the m / z values of candidates differ depending on the error in mass and the error in the selected peak. Therefore, normally, the more multivalent ions with different valences, the greater the number of candidates obtained.
- one candidate is selected by evaluating the validity of each candidate for a plurality of addition / desorption component candidates.
- a plurality of evaluation criteria can be used. For example, first, candidates that are presumably abnormal under certain evaluation criteria can be excluded, and the most appropriate candidate can be selected from the remaining candidates by applying another evaluation criteria.
- a statistical method can be applied to the m / z values of a plurality of candidates to select candidates with high validity or to exclude candidates with low validity.
- the statistical method for example, the degree of dispersion of m / z values of a plurality of candidates is used, and those having a small degree of dispersion are determined to have high validity.
- the compound estimation step determines the m / z value of the addition / desorption component and the isotope from which the m / z value was calculated. From the valence and representative points in the body cluster, the m / z value of the target compound is estimated to identify the target compound.
- the mass spectrometry data analysis method according to the first invention and the mass spectrometry data analysis apparatus according to the second invention there is no need for the user to input information on components to be added to or desorbed from the target compound during ionization, The most reasonable addition / desorption component is automatically found. Therefore, even those who have little chemical knowledge or analytical experience can perform mass spectrometry work, and can obtain analysis results with high reliability and reproducibility. Further, since there is no trial and error work in analyzing the mass spectrum, the efficiency of the analysis work can be improved and the analysis throughput can be improved.
- the block diagram of the principal part of LC / IT-TOFMS which is one Example of this invention.
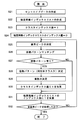
- the flowchart which shows the procedure of the mass spectrum analysis process in LC / IT-TOFMS of a present Example.
- the flowchart which shows the process sequence of isotope cluster detection and valence determination in the mass spectrum analysis process shown in FIG.
- FIG. 1 is a configuration diagram of the main part of the LC / IT-TOFMS of this embodiment.
- This LC / IT-TOFMS is roughly divided into a liquid chromatograph (LC) unit 1 and a mass spectrometry (MS) unit 2, and an atmospheric pressure ionization interface for connecting the LC unit 1 and the MS unit 2 includes:
- An electrospray ionization (ESI) interface is used.
- the liquid feed pump 12 sucks the mobile phase stored in the mobile phase container 11 and feeds it to the column 14 through the injector 13 at a constant flow rate.
- the sample is injected by the injector 13
- the sample is introduced into the column 14 along the flow of the mobile phase.
- Various components in the sample are separated while passing through the column 14, and are eluted from the outlet of the column 14 with a time lag and introduced into the mass spectrometry (MS) unit 2.
- MS mass spectrometry
- the MS unit 2 includes an ionization chamber 21 that is maintained in an atmospheric pressure atmosphere, and an analysis chamber 29 that is evacuated by a turbo molecular pump (not shown) and maintained in a high vacuum atmosphere.
- a first-stage intermediate vacuum chamber 24 and a second-stage intermediate vacuum chamber 27 whose degree of vacuum is increased stepwise are provided.
- the ionization chamber 21 and the first stage intermediate vacuum chamber 24 communicate with each other through a small-diameter desolvating tube 23, and the first stage intermediate vacuum chamber 24 and the second stage intermediate vacuum chamber 27 are conical skimmers. It communicates through a small-diameter orifice drilled in the top of the 26.
- the eluate containing the sample component supplied from the LC unit 1 reaches the ESI nozzle 22 as an ion source, the eluate is given a charge by a DC high voltage applied from a high-voltage power supply (not shown). . Then, it is sprayed into the ionization chamber 21 as charged fine droplets. These charged droplets collide with gas molecules derived from the atmosphere and are pulverized into finer droplets, which are quickly dried (desolvated) to vaporize sample molecules. The sample molecules are ionized by causing an ion evaporation reaction.
- This ESI has a characteristic that multivalent ions having a plurality of charges are easily generated during ionization.
- the microdroplets containing the generated ions are drawn into the desolvation tube 23 by the differential pressure, and further desolvation proceeds while passing through the desolvation tube 23 to generate ions.
- the ions pass through the two intermediate vacuum chambers 24 and 27 while being converged by the ion guides 25 and 28, and are sent to the analysis chamber 29.
- ions are introduced into a three-dimensional quadrupole ion trap 30.
- ions are once trapped and accumulated by a quadrupole electric field formed by a high-frequency voltage applied to each electrode from a power source (not shown).
- the various ions accumulated in the ion trap 30 are given kinetic energy all at a predetermined timing and discharged toward a time-of-flight mass separator (TOF) 31 as a mass separator. That is, the ion trap 30 is the starting point for the flight of ions to the TOF 31.
- the TOF 31 includes a reflectron electrode 32 to which a DC voltage is applied from a DC power source (not shown), and ions are folded back during flight by the action of a DC electric field formed thereby and reach the ion detector 33.
- the ions emitted from the ion trap 30 simultaneously fly faster as the mass (strictly m / z) decreases, and reach the ion detector 33 with a time difference corresponding to m / z.
- the ion detector 33 outputs a current corresponding to the number of reached ions as a detection signal.
- the detection signal is converted into a voltage signal by the signal processing unit 34, converted into a digital value, and then input to the data processing unit 40.
- the data processing unit 40 includes a mass spectrum creation unit 41, a deconvolution processing unit 42, and the like as functions.
- the mass spectrum creation unit 41 measures the signal intensity of ions every time from when the ions are simultaneously emitted from the ion trap 30 until reaching the ion detector 33, and converts the time information into m / z value. Then, a mass spectrum is created with the horizontal axis representing the m / z value and the vertical axis representing the signal intensity.
- Extraction of ions from the ion trap 30 to the TOF 31 and mass separation / detection of ions by the TOF 31 and the ion detector 33 are repeatedly performed at predetermined time intervals, and one mass spectrum is created each time.
- the mass spectrum data constituting the created mass spectrum is stored in the data storage unit 43, and is subjected to data analysis processing by the deconvolution processing unit 42, for example, after the end of mass analysis.
- the analysis control unit 50 controls the operation of each part of the LC unit 1 and the MS unit 2 in order to perform LC / MS analysis based on an instruction from the central control unit 51.
- An operation unit 52 and a display unit 53 as user interfaces are connected to the central control unit 51, and various commands for analysis are received in response to an operator's operation by the operation unit 52, the analysis control unit 50 and the data processing unit 40. And the analysis result such as mass spectrum is output to the display unit 52.
- the central control unit 51, the analysis control unit 50, and the data processing unit 40 can be realized by executing predetermined control / processing software on a personal computer.
- LCMS-IT-TOF liquid chromatograph mass spectrometer
- ESI is a relatively soft ionization method, in which a substance in a mobile phase (solvent) is added to a target compound in a liquid sample or other metals are added. Occurs relatively frequently. For example, with positive ions, ammonia adduct ions, sodium adduct ions and the like are easily generated in addition to proton adduct ions added with protons. On the other hand, in the case of negative ions, chlorine-added ions, acetic acid-added ions, formic acid-added ions and the like are easily generated in addition to proton-desorbed ions from which protons have been released.
- the user has to input and set the types of addition / desorption components that generate adduct ions as described above.
- the deconvolution processing unit 42 in the mass spectrum analysis process performed by the deconvolution processing unit 42, such input setting by the user is unnecessary.
- FIGS. 2 is a flowchart showing a procedure of mass spectrum analysis processing
- FIG. 3 is a conceptual diagram for explaining the mass spectrum analysis processing
- FIG. 4 is a flowchart showing processing procedures of isotope cluster detection and valence determination in the mass spectrum analysis processing
- FIG. 5 is a conceptual diagram for explaining isotope cluster detection.
- the deconvolution processing unit 42 first detects the isotope cluster appearing on the mass spectrum to be analyzed, and obtains the valence n of each isotope cluster (steps S1 and S2).
- An isotope cluster is a peak group composed of a plurality of peaks that are derived from ions having the same elemental configuration and that have different m / z values depending on the difference in the isotope composition in the ions. Actually, one isotope cluster appears on the mass spectrum as shown in FIG.
- centroid data is created by converting mass spectrum profile data (step S21).
- FIG. 3C is a diagram in which the profile data in FIG. 3B is converted into centroid data.
- Centroid data consists of a list of structures containing information such as the m / z value of each peak, intensity, and, in the case of an isotope peak, the ID number and valence of that isotope cluster (but before analysis) In the state, the isotope cluster ID number and valency are unknown and are blank).
- an index list intensity descending index list of each peak arranged so that the intensity of each peak on the centroid data is in descending order is created (step S22).
- the ID number of the isotope cluster to be found and the index value of the intensity descending index list are initialized (steps S23 and S24), and a reference is used to detect the isotope cluster pattern on the centroid data.
- a candidate peak of a peak (reference peak) is determined (step S25).
- a peak that is a reference peak is selected in descending order of intensity.
- the base peak the peak having the maximum intensity among the measured peaks, the peak A in FIG. 5 becomes the reference peak.
- peaks that have already been identified as peaks belonging to the isotope cluster by the previous processing are excluded from the selection targets of the reference peak.
- a valence range, an allowable range of mass resolution, a minimum value of the number of peaks constituting an isotope cluster, and the like are set to appropriate values.
- Valence pattern matching is performed when the peak is located at a position that is separated from the position of the m / z value of the reference peak by the step width d assumed when the reference peak is included in the isotope cluster of each valence. This is done by checking whether it exists. For example, when the reference peak is included in a monovalent isotope cluster, the plurality of peaks belonging to the isotope cluster show peak patterns having different m / z values by 1, and the step width d is 1. When included in a divalent isotope cluster, peaks belonging to the isotope cluster show peak patterns having different m / z values by 0.5, so the step width d is 0.5. Although the valence n is 1 / d, the valence n is an integer. Therefore, when 1 / d does not become an integer, the value is rounded appropriately to be an integer.
- step S26 if no peak pattern matching as an isotope cluster exists around the reference peak (No in step S27), the process proceeds to step S31 through the next steps S28 to S30. If there is a matching peak pattern, the matching resolution (measured value and predicted value when searching for each peak belonging to the isotope cluster among the isotope cluster valence patterns matched with the peak pattern centered on the reference peak) The isotope cluster is identified by selecting the isotope cluster valence pattern having the smallest standard deviation of the difference (step S28). If there is only one matched valence pattern, it can be identified as an isotope cluster.
- the valence of the valence pattern selected in step S28 is determined as the valence of each peak belonging to the identified isotope cluster, and the cluster ID number, valence of each peak belonging to the identified isotope cluster is determined. Information regarding the number, etc. is reflected as additional information in the centroid data described above (step S29). Thereafter, the cluster index value and the index value of the descending strength index list are respectively incremented (S30, S31). Then, it is determined whether or not the processing for all the reference peaks has been completed by determining whether or not the index value of the strength descending index list is equal to or greater than the number of data on the centroid data (step S32). If there is, the process returns to step S25. As a result, the processes in steps S25 to S31 are executed for all peaks in the centroid data.
- isotope clusters are successively matched around the peaks in order of the intensity of the peaks on the mass spectrum, and the valences of the peaks belonging to the identified isotope clusters are determined. Thereby, as shown in FIG. 3A and FIG. 5, isotope clusters of each valence are cut out.
- the m / z value of each isotope cluster is important for calculating the m / z value of the component (ion) added to or desorbed from the target compound.
- the representative point of each isotope cluster is calculated and the m / z value of the representative point is used.
- the peak waveform shape of the isotope cluster is a shape in which the Poisson distribution is slightly broken as shown in FIG. Therefore, there is only one position where the peak is maximum, and it is also possible to use the m / z value that gives this maximum intensity as the representative point.
- the intensity difference between the maximum intensity and the second largest intensity in the isotope cluster is small, the two may be sufficiently switched due to measurement errors and various fluctuation factors. Therefore, in order to increase the reliability, the m / z value of the peak (for example, P1 in FIG.
- step S3 giving the maximum intensity among the plurality of peaks constituting the isotope cluster and the second largest intensity are set.
- the m / z value that is the center of gravity of the given peak m / z value is calculated and determined as a representative point of this isotope cluster (step S3).
- step S4 it is determined whether or not the number of isotope clusters is 2 or more (step S4). If the number of isotope clusters is 1, the process passes through steps S5 to S14 and proceeds to S15.
- the process proceeds to step S5 and subsequent steps.
- the valence of the isotope cluster is n
- the m / z value of the representative point is m
- the m / z value of the component (ion) added to the target compound is Q
- the mass M of the target compound is (1) It can be obtained for each isotope cluster according to the formula (Note that if a certain component is desorbed from the target compound, it can be similarly considered that Q is a negative value).
- M n ⁇ (mQ) (1) Since the component added to or desorbed from the compound during ionization is limited to some extent, the m / z value Q of this component does not become so large. Therefore, the range that Q can take can be determined in advance.
- the greater the number of isotope clusters the greater the number of combinations of isotope clusters that are considered to be derived from the same compound, so that a larger number of candidates are selected.
- step S6 After multiple (usually many) candidates are listed for the m / z value of the addition / desorption component, the candidate that is clearly abnormal is first removed in order to select the most relevant one
- the narrowing-down operation is performed by the following three procedures (step S6).
- a plurality of candidates for the addition / desorption component m / z values are obtained.
- the m / z values often do not match due to factors such as measurement errors and mistakes in the peaks selected as representative points. If the error is large or the selected peak is wrong, the m / z value of the candidate calculated based on it may be significantly different from the m / z value of other candidates. is there. Therefore, the variance of m / z values of a plurality of candidates is examined, and candidates whose m / z values deviate extremely are excluded based on the variance (step S7).
- Step S8 If several peaks belonging to isotope clusters having different valences are derived from the same compound, there is a strong correlation between the relative intensities of the representative points of the isotope clusters. Therefore, using this, a threshold is set for the relative intensity similarity of representative points of different isotope clusters, and candidates obtained based on combinations of isotope clusters having representative points that fall below this threshold are excluded. (Step S8).
- a candidate having high similarity in distribution shape (intensity pattern) of a plurality of peaks constituting an isotope cluster among different isotope clusters is considered to be high.
- candidates obtained based on combinations of isotope clusters having low similarity in peak distribution shape can be excluded (step S9).
- an index value such as a correlation coefficient of peak distribution shapes between different isotope clusters may be obtained, and candidates having low correlation may be excluded using this, but here a simpler method is used. adopt.
- the position (m / z value) of the representative point of each isotope cluster is the center of gravity of the position that gives the maximum intensity and the position that gives the second largest intensity. Therefore, the positional relationship of the second largest intensity point with respect to the maximum intensity and its intensity ratio are reflected in the position of the barycentric point. Therefore, candidates obtained based on isotope clusters whose positional relationship between the representative point, the maximum point, and the point that gives the second highest intensity are greatly reduced are excluded. As a result, candidates obtained based on a combination of isotope clusters having substantially different peak distribution shapes can be removed.
- step S10 it is determined whether or not the number of isotope clusters is 3 or more (step S11). If the number of isotope clusters is 3 or more, a candidate having the best condition in the selection criteria in step S7 is selected. That is, a candidate having the smallest dispersion of m / z values is selected from a plurality of candidates (step S12).
- step S11 If the number of isotope clusters is less than 3 (actually only 2) in step S11, a candidate with the best condition in the selection criteria in step S8 is selected. That is, for each isotope cluster, a combination of isotope clusters having the highest similarity in relative strength of representative points is found, and a candidate obtained by the combination is selected (step S13).
- step S12 or S13 when the target compound is ionized, the m / z value Q of the component added to or desorbed from the compound is determined (step S14).
- NO is determined in step S4
- the m / z value of the addition / desorption component is calculated by the above-described method. I can't ask for it.
- the addition / desorption component is determined by another method such as obtaining the estimated addition / desorption component from the user (step S15).
- the mass of the target compound is calculated based on the above equation (1), and the result is output to the display unit 52 (step S16).
Landscapes
- Chemical & Material Sciences (AREA)
- Analytical Chemistry (AREA)
- Other Investigation Or Analysis Of Materials By Electrical Means (AREA)
Abstract
Description
a)マススペクトル上の同位体クラスタを検出し、各同位体クラスタの価数を推定する価数推定ステップと、
b)検出された前記同位体クラスタ毎に、その同位体クラスタを代表するm/z値を求める代表点決定ステップと、
c)同一の目的化合物に由来すると推定される2個以上の同位体クラスタの代表点及び価数の組み合わせから、イオン化に際して目的化合物に付加した又は目的化合物から脱離した成分のm/z値の候補を求める候補抽出ステップと、
d)複数の同位体クラスタの異なる組み合わせにより得られた複数の前記候補について、その候補のm/z値又はその算出の元となった同位体クラスタの組み合わせの妥当性を評価することにより、最終的に1つの候補を選定する付加/脱離成分選定ステップと、
e)選定した付加/脱離成分のm/z値と価数とから目的化合物のm/z値を推定する化合物推定ステップと、
を有することを特徴としている。
a)マススペクトル上の同位体クラスタを検出し、各同位体クラスタの価数を推定する価数推定手段と、
b)検出された前記同位体クラスタ毎に、その同位体クラスタを代表するm/z値を求める代表点決定手段と、
c)同一の目的化合物に由来すると推定される2個以上の同位体クラスタの代表点及び価数の組み合わせから、イオン化に際して目的化合物に付加した又は目的化合物から脱離した成分のm/z値の候補を求める候補抽出手段と、
d)複数の同位体クラスタの異なる組み合わせにより得られた複数の前記候補について、その候補のm/z値又はその算出の元となった同位体クラスタの組み合わせの妥当性を評価することにより、最終的に1つの候補を選定する付加/脱離成分選定手段と、
e)選定した付加/脱離成分のm/z値と価数とから目的化合物のm/z値を推定する化合物推定手段と、
を備えることを特徴としている。
11…移動相容器
12…送液ポンプ
13…インジェクタ
14…カラム
2…質量分析(MS)部
21…イオン化室
22…ESIノズル
23…脱溶媒管
24、27…中間真空室
25、28…イオンガイド
26…スキマー
29…分析室
30…イオントラップ
31…飛行時間型質量分離器(TOF)
32…リフレクトロン電極
33…イオン検出器
34…信号処理部
40…データ処理部
41…マススペクトル作成部
42…デコンボリューション処理部
43…データ記憶部
50…分析制御部
51…中央制御部
52…操作部
53…表示部
M=n×(m-Q) …(1)
イオン化の際に化合物に付加する又は脱離する成分は或る程度限定されるから、この成分のm/z値Qはそれほど大きな値となることはない。したがって、Qが採り得る範囲は予め決めておくことができる。
Claims (11)
- 質量分析により取得された、多価イオンのピークが出現したマススペクトルデータを解析処理することにより、目的化合物のm/z値を求める質量分析データ解析方法であって、
a)マススペクトル上の同位体クラスタを検出し、各同位体クラスタの価数を推定する価数推定ステップと、
b)検出された前記同位体クラスタ毎に、その同位体クラスタを代表するm/z値を求める代表点決定ステップと、
c)同一の目的化合物に由来すると推定される2個以上の同位体クラスタの代表点及び価数の組み合わせから、イオン化に際して目的化合物に付加した又は目的化合物から脱離した成分のm/z値の候補を求める候補抽出ステップと、
d)複数の同位体クラスタの異なる組み合わせにより得られた複数の前記候補について、その候補のm/z値又はその算出の元となった同位体クラスタの組み合わせの妥当性を評価することにより、最終的に1つの候補を選定する付加/脱離成分選定ステップと、
e)選定した付加/脱離成分のm/z値と価数とから目的化合物のm/z値を推定する化合物推定ステップと、
を有することを特徴とする質量分析データ解析方法。 - 請求項1に記載の質量分析データ解析方法であって、
前記付加/脱離成分選定ステップは、複数の候補のm/z値に統計的手法を適用して、妥当性の高い候補を選定する又は妥当性の低い候補を除外することを特徴とする質量分析データ解析方法。 - 請求項2に記載の質量分析データ解析方法であって、
前記付加/脱離成分選定ステップは、複数の候補のm/z値の分散度合を評価して、妥当性の高い候補を選定する又は妥当性の低い候補を除外することを特徴とする質量分析データ解析方法。 - 請求項1に記載の質量分析データ解析方法であって、
前記付加/脱離成分選定ステップは、価数を跨った、代表点又はそれに直近のピークの強度比の類似性を評価して、妥当性の高い候補を選定する又は妥当性の低い候補を除外することを特徴とする質量分析データ解析方法。 - 請求項1に記載の質量分析データ解析方法であって、
前記付加/脱離成分選定ステップは、異なる同位体クラスタについて、その同位体クラスタを構成する複数のピークの全て又は一部のパターン形状の類似性を評価して、妥当性の高い候補を選定する又は妥当性の低い候補を除外することを特徴とする質量分析データ解析方法。 - 請求項1に記載の質量分析データ解析方法であって、
前記代表点決定ステップは、同位体クラスタ中の最大強度ピーク付近の複数のピークの重心のm/z値を代表点とすることを特徴とする質量分析データ解析方法。 - 質量分析により取得された、多価イオンのピークが出現したマススペクトルデータを解析処理することにより、目的化合物のm/z値を求める質量分析データ解析装置であって、
a)マススペクトル上の同位体クラスタを検出し、各同位体クラスタの価数を推定する価数推定手段と、
b)検出された前記同位体クラスタ毎に、その同位体クラスタを代表するm/z値を求める代表点決定手段と、
c)同一の目的化合物に由来すると推定される2個以上の同位体クラスタの代表点及び価数の組み合わせから、イオン化に際して目的化合物に付加した又は目的化合物から脱離した成分のm/z値の候補を求める候補抽出手段と、
d)複数の同位体クラスタの異なる組み合わせにより得られた複数の前記候補について、その候補のm/z値又はその算出の元となった同位体クラスタの組み合わせの妥当性を評価することにより、最終的に1つの候補を選定する付加/脱離成分選定手段と、
e)選定した付加/脱離成分のm/z値と価数とから目的化合物のm/z値を推定する化合物推定手段と、
を備えることを特徴とする質量分析データ解析装置。 - 請求項7に記載の質量分析データ解析装置であって、
前記付加/脱離成分選定手段は、複数の候補のm/z値に統計的手法を適用して、妥当性の高い候補を選定する又は妥当性の低い候補を除外することを特徴とする質量分析データ解析装置。 - 請求項8に記載の質量分析データ解析装置であって、
前記付加/脱離成分選定手段は、複数の候補のm/z値の分散度合を評価して、妥当性の高い候補を選定する又は妥当性の低い候補を除外することを特徴とする質量分析データ解析装置。 - 請求項7に記載の質量分析データ解析装置であって、
前記付加/脱離成分選定手段は、価数を跨った、代表点又はそれに直近のピークの強度比の類似性を評価して、妥当性の高い候補を選定する又は妥当性の低い候補を除外することを特徴とする質量分析データ解析装置。 - 請求項7に記載の質量分析データ解析装置であって、
前記付加/脱離成分選定手段は、異なる同位体クラスタについて、その同位体クラスタを構成する複数のピークの全て又は一部のパターン形状の類似性を評価して、妥当性の高い候補を選定する又は妥当性の低い候補を除外することを特徴とする質量分析データ解析装置。
Priority Applications (5)
| Application Number | Priority Date | Filing Date | Title |
|---|---|---|---|
| JP2010515670A JP5273144B2 (ja) | 2008-06-04 | 2008-06-04 | 質量分析データ解析方法及び質量分析データ解析装置 |
| EP08764008.2A EP2295958B1 (en) | 2008-06-04 | 2008-06-04 | Mass analysis data analyzing method and mass analysis data analyzing apparatus |
| US12/995,459 US8666681B2 (en) | 2008-06-04 | 2008-06-04 | Mass analysis data analyzing method and mass analysis data analyzing apparatus |
| PCT/JP2008/001411 WO2009147699A1 (ja) | 2008-06-04 | 2008-06-04 | 質量分析データ解析方法及び質量分析データ解析装置 |
| CN200880129663.6A CN102057271B (zh) | 2008-06-04 | 2008-06-04 | 质量分析数据解析方法以及质量分析数据解析装置 |
Applications Claiming Priority (1)
| Application Number | Priority Date | Filing Date | Title |
|---|---|---|---|
| PCT/JP2008/001411 WO2009147699A1 (ja) | 2008-06-04 | 2008-06-04 | 質量分析データ解析方法及び質量分析データ解析装置 |
Publications (1)
| Publication Number | Publication Date |
|---|---|
| WO2009147699A1 true WO2009147699A1 (ja) | 2009-12-10 |
Family
ID=41397792
Family Applications (1)
| Application Number | Title | Priority Date | Filing Date |
|---|---|---|---|
| PCT/JP2008/001411 Ceased WO2009147699A1 (ja) | 2008-06-04 | 2008-06-04 | 質量分析データ解析方法及び質量分析データ解析装置 |
Country Status (5)
| Country | Link |
|---|---|
| US (1) | US8666681B2 (ja) |
| EP (1) | EP2295958B1 (ja) |
| JP (1) | JP5273144B2 (ja) |
| CN (1) | CN102057271B (ja) |
| WO (1) | WO2009147699A1 (ja) |
Cited By (5)
| Publication number | Priority date | Publication date | Assignee | Title |
|---|---|---|---|---|
| JP5527438B2 (ja) * | 2011-02-10 | 2014-06-18 | 株式会社島津製作所 | 質量分析装置 |
| JP2017142173A (ja) * | 2016-02-10 | 2017-08-17 | 日本電子株式会社 | マススペクトル解析装置、マススペクトル解析方法、質量分析装置、およびプログラム |
| JP2019100891A (ja) * | 2017-12-05 | 2019-06-24 | 日本電子株式会社 | 質量分析データ処理装置および質量分析データ処理方法 |
| EP2534669B1 (en) * | 2010-02-12 | 2020-04-01 | Micromass UK Limited | Mass spectrometer incorporating hydrogen-deuterium exchange |
| WO2020194582A1 (ja) * | 2019-03-27 | 2020-10-01 | 株式会社島津製作所 | クロマトグラフ質量分析装置 |
Families Citing this family (12)
| Publication number | Priority date | Publication date | Assignee | Title |
|---|---|---|---|---|
| GB201002447D0 (en) | 2010-02-12 | 2010-03-31 | Micromass Ltd | Mass spectrometer |
| CN105008908B (zh) * | 2013-02-22 | 2017-10-13 | 株式会社岛津制作所 | 数据处理装置以及数据处理方法 |
| JP6269810B2 (ja) * | 2014-03-05 | 2018-01-31 | 株式会社島津製作所 | 質量分析方法及び質量分析装置 |
| WO2016002047A1 (ja) * | 2014-07-03 | 2016-01-07 | 株式会社島津製作所 | 質量分析データ処理装置 |
| WO2017025893A2 (en) * | 2015-08-13 | 2017-02-16 | Dh Technologies Development Pte. Ltd. | Library search tolerant to isotopes |
| JP7057913B2 (ja) * | 2016-06-09 | 2022-04-21 | 株式会社島津製作所 | ビッグデータ解析方法及び該解析方法を利用した質量分析システム |
| US10605842B2 (en) * | 2016-06-21 | 2020-03-31 | International Business Machines Corporation | Noise spectrum analysis for electronic device |
| JP6939912B2 (ja) * | 2018-02-02 | 2021-09-22 | 株式会社島津製作所 | イメージング質量分析用データ処理装置 |
| WO2019244484A1 (ja) * | 2018-06-22 | 2019-12-26 | 三菱電機株式会社 | レーザ加工装置 |
| US12512308B2 (en) * | 2020-05-28 | 2025-12-30 | Shimadzu Corporation | Chromatograph mass spectrometry data processing method, chromatograph mass spectrometer, and chromatograph mass spectrometry data processing program |
| JP7580577B2 (ja) * | 2020-08-14 | 2024-11-11 | メタボロン,インコーポレイテッド | 複雑な混合物の小分子成分を決定するための方法並びに関連する装置及びコンピュータプログラム製品 |
| JP7369736B2 (ja) * | 2021-05-18 | 2023-10-26 | 日本電子株式会社 | 質量分析方法及び情報処理装置 |
Citations (6)
| Publication number | Priority date | Publication date | Assignee | Title |
|---|---|---|---|---|
| JPH06124686A (ja) * | 1992-10-08 | 1994-05-06 | Hitachi Ltd | 質量分析装置 |
| JP2004132946A (ja) * | 2002-04-01 | 2004-04-30 | Jeol Ltd | 質量スペクトルの解析方法および装置 |
| JP2004271185A (ja) * | 2003-03-05 | 2004-09-30 | Shimadzu Corp | 質量分析装置用データ処理装置 |
| WO2006012928A1 (de) | 2004-07-28 | 2006-02-09 | A. Raymond & Cie | Spreizniet |
| JP2006308909A (ja) | 2005-04-28 | 2006-11-09 | Nikon Corp | 波長変換光学系及びレーザ装置 |
| WO2006120928A1 (ja) * | 2005-05-13 | 2006-11-16 | Shimadzu Corporation | 質量分析データ解析装置及びプログラム |
Family Cites Families (12)
| Publication number | Priority date | Publication date | Assignee | Title |
|---|---|---|---|---|
| CA2032490A1 (en) * | 1989-05-19 | 1990-11-20 | Chin Kai Meng | Multiply charged ions and a method for determining the molecular weight of large molecules |
| US5130538A (en) * | 1989-05-19 | 1992-07-14 | John B. Fenn | Method of producing multiply charged ions and for determining molecular weights of molecules by use of the multiply charged ions of molecules |
| JP3504819B2 (ja) * | 1997-03-31 | 2004-03-08 | 株式会社日立製作所 | 質量分析方法及び装置 |
| DE19803309C1 (de) * | 1998-01-29 | 1999-10-07 | Bruker Daltonik Gmbh | Massenspektrometrisches Verfahren zur genauen Massenbestimmung unbekannter Ionen |
| US6104027A (en) * | 1998-06-05 | 2000-08-15 | Hewlett-Packard Company | Deconvolution of multiply charged ions |
| SE0000754D0 (sv) * | 2000-03-07 | 2000-03-07 | Amersham Pharm Biotech Ab | Mass spectral peak identification |
| US7457708B2 (en) * | 2003-03-13 | 2008-11-25 | Agilent Technologies Inc | Methods and devices for identifying related ions from chromatographic mass spectral datasets containing overlapping components |
| US6983213B2 (en) * | 2003-10-20 | 2006-01-03 | Cerno Bioscience Llc | Methods for operating mass spectrometry (MS) instrument systems |
| JP4515819B2 (ja) * | 2003-08-13 | 2010-08-04 | 株式会社日立ハイテクノロジーズ | 質量分析システム |
| DE10358366B4 (de) * | 2003-12-10 | 2008-04-03 | Bruker Daltonik Gmbh | Massenspektrometrische Substanzidentifizierung |
| US6936813B2 (en) * | 2004-02-02 | 2005-08-30 | Agilent Technologies, Inc. | Dynamic library searching |
| US7117103B2 (en) * | 2004-06-03 | 2006-10-03 | Agilent Technologies, Inc. | Rapid automatic target compound confirmation using deconvolution and spectral matching |
-
2008
- 2008-06-04 JP JP2010515670A patent/JP5273144B2/ja active Active
- 2008-06-04 CN CN200880129663.6A patent/CN102057271B/zh active Active
- 2008-06-04 WO PCT/JP2008/001411 patent/WO2009147699A1/ja not_active Ceased
- 2008-06-04 EP EP08764008.2A patent/EP2295958B1/en not_active Not-in-force
- 2008-06-04 US US12/995,459 patent/US8666681B2/en active Active
Patent Citations (6)
| Publication number | Priority date | Publication date | Assignee | Title |
|---|---|---|---|---|
| JPH06124686A (ja) * | 1992-10-08 | 1994-05-06 | Hitachi Ltd | 質量分析装置 |
| JP2004132946A (ja) * | 2002-04-01 | 2004-04-30 | Jeol Ltd | 質量スペクトルの解析方法および装置 |
| JP2004271185A (ja) * | 2003-03-05 | 2004-09-30 | Shimadzu Corp | 質量分析装置用データ処理装置 |
| WO2006012928A1 (de) | 2004-07-28 | 2006-02-09 | A. Raymond & Cie | Spreizniet |
| JP2006308909A (ja) | 2005-04-28 | 2006-11-09 | Nikon Corp | 波長変換光学系及びレーザ装置 |
| WO2006120928A1 (ja) * | 2005-05-13 | 2006-11-16 | Shimadzu Corporation | 質量分析データ解析装置及びプログラム |
Cited By (11)
| Publication number | Priority date | Publication date | Assignee | Title |
|---|---|---|---|---|
| EP2534669B1 (en) * | 2010-02-12 | 2020-04-01 | Micromass UK Limited | Mass spectrometer incorporating hydrogen-deuterium exchange |
| JP5527438B2 (ja) * | 2011-02-10 | 2014-06-18 | 株式会社島津製作所 | 質量分析装置 |
| JP2017142173A (ja) * | 2016-02-10 | 2017-08-17 | 日本電子株式会社 | マススペクトル解析装置、マススペクトル解析方法、質量分析装置、およびプログラム |
| JP2019100891A (ja) * | 2017-12-05 | 2019-06-24 | 日本電子株式会社 | 質量分析データ処理装置および質量分析データ処理方法 |
| JP6994921B2 (ja) | 2017-12-05 | 2022-01-14 | 日本電子株式会社 | 質量分析データ処理装置および質量分析データ処理方法 |
| WO2020194582A1 (ja) * | 2019-03-27 | 2020-10-01 | 株式会社島津製作所 | クロマトグラフ質量分析装置 |
| JPWO2020194582A1 (ja) * | 2019-03-27 | 2021-10-28 | 株式会社島津製作所 | クロマトグラフ質量分析装置 |
| JP7173293B2 (ja) | 2019-03-27 | 2022-11-16 | 株式会社島津製作所 | クロマトグラフ質量分析装置 |
| JP2023012485A (ja) * | 2019-03-27 | 2023-01-25 | 株式会社島津製作所 | クロマトグラム表示装置及びクロマトグラム表示方法 |
| JP7409462B2 (ja) | 2019-03-27 | 2024-01-09 | 株式会社島津製作所 | クロマトグラム表示装置 |
| US11940426B2 (en) | 2019-03-27 | 2024-03-26 | Shimadzu Corporation | Chromatograph mass spectrometer |
Also Published As
| Publication number | Publication date |
|---|---|
| EP2295958B1 (en) | 2018-04-04 |
| JP5273144B2 (ja) | 2013-08-28 |
| CN102057271B (zh) | 2014-06-11 |
| JPWO2009147699A1 (ja) | 2011-10-20 |
| EP2295958A4 (en) | 2012-08-22 |
| US8666681B2 (en) | 2014-03-04 |
| US20110125416A1 (en) | 2011-05-26 |
| EP2295958A1 (en) | 2011-03-16 |
| CN102057271A (zh) | 2011-05-11 |
Similar Documents
| Publication | Publication Date | Title |
|---|---|---|
| JP5273144B2 (ja) | 質量分析データ解析方法及び質量分析データ解析装置 | |
| US9514922B2 (en) | Mass analysis data processing apparatus | |
| US10288589B2 (en) | Mass spectrometry method and mass spectrometer | |
| US9869662B2 (en) | Chromatograph/mass spectrometer data processing device | |
| US11112391B2 (en) | Mass spectrometric data processing device for qualitative analysis | |
| JP2010019655A (ja) | クロマトグラフ質量分析装置 | |
| US10739320B2 (en) | Mass spectrometer | |
| US20160329203A1 (en) | Mass spectrometer and mass spectrometry method | |
| JP5900631B2 (ja) | 質量分析装置 | |
| US20160314949A1 (en) | Mass spectrometer and mass spectrometry method | |
| US10613062B2 (en) | Mass spectrometer | |
| JP6702501B2 (ja) | タンデム型質量分析装置及び該装置用プログラム | |
| US12512308B2 (en) | Chromatograph mass spectrometry data processing method, chromatograph mass spectrometer, and chromatograph mass spectrometry data processing program | |
| JP5056169B2 (ja) | 質量分析データ解析方法及び装置 | |
| JP5786703B2 (ja) | クロマトグラフ質量分析装置用データ処理装置 | |
| US20230236159A1 (en) | Chromatograph Mass Spectrometry Data Processing Method, Chromatograph Mass Spectrometer, and Chromatograph Mass Spectrometry Data Processing Program | |
| US20260011540A1 (en) | Chromatograph Mass Spectrometry Data Processing Method and Chromatograph Mass Spectrometry Data Processing Apparatus | |
| WO2024127358A1 (en) | Systems and methods for reducing data storage requirements in mass analysis systems | |
| WO2024246845A1 (en) | Methods and systems for background processing for covalent binding determination | |
| WO2023031880A1 (en) | Automatic data processing for multiply charged analytes in mass spectrometry |
Legal Events
| Date | Code | Title | Description |
|---|---|---|---|
| WWE | Wipo information: entry into national phase |
Ref document number: 200880129663.6 Country of ref document: CN |
|
| 121 | Ep: the epo has been informed by wipo that ep was designated in this application |
Ref document number: 08764008 Country of ref document: EP Kind code of ref document: A1 |
|
| WWE | Wipo information: entry into national phase |
Ref document number: 2010515670 Country of ref document: JP |
|
| NENP | Non-entry into the national phase |
Ref country code: DE |
|
| WWE | Wipo information: entry into national phase |
Ref document number: 2008764008 Country of ref document: EP |
|
| WWE | Wipo information: entry into national phase |
Ref document number: 12995459 Country of ref document: US |