WO2010143587A1 - Dispositif de diagnostic à ultrasons, dispositif de traitement d'image ultrasonore, programme de traitement d'image ultrasonore et procédé de génération d'image ultrasonore - Google Patents
Dispositif de diagnostic à ultrasons, dispositif de traitement d'image ultrasonore, programme de traitement d'image ultrasonore et procédé de génération d'image ultrasonore Download PDFInfo
- Publication number
- WO2010143587A1 WO2010143587A1 PCT/JP2010/059502 JP2010059502W WO2010143587A1 WO 2010143587 A1 WO2010143587 A1 WO 2010143587A1 JP 2010059502 W JP2010059502 W JP 2010059502W WO 2010143587 A1 WO2010143587 A1 WO 2010143587A1
- Authority
- WO
- WIPO (PCT)
- Prior art keywords
- image
- dimensional
- volume data
- voxel
- tomographic
- Prior art date
- Legal status (The legal status is an assumption and is not a legal conclusion. Google has not performed a legal analysis and makes no representation as to the accuracy of the status listed.)
- Ceased
Links
Images











Classifications
-
- A—HUMAN NECESSITIES
- A61—MEDICAL OR VETERINARY SCIENCE; HYGIENE
- A61B—DIAGNOSIS; SURGERY; IDENTIFICATION
- A61B8/00—Diagnosis using ultrasonic, sonic or infrasonic waves
- A61B8/08—Clinical applications
- A61B8/0808—Clinical applications for diagnosis of the brain
-
- A—HUMAN NECESSITIES
- A61—MEDICAL OR VETERINARY SCIENCE; HYGIENE
- A61B—DIAGNOSIS; SURGERY; IDENTIFICATION
- A61B8/00—Diagnosis using ultrasonic, sonic or infrasonic waves
- A61B8/46—Ultrasonic, sonic or infrasonic diagnostic devices with special arrangements for interfacing with the operator or the patient
- A61B8/461—Displaying means of special interest
- A61B8/466—Displaying means of special interest adapted to display 3D data
-
- A—HUMAN NECESSITIES
- A61—MEDICAL OR VETERINARY SCIENCE; HYGIENE
- A61B—DIAGNOSIS; SURGERY; IDENTIFICATION
- A61B8/00—Diagnosis using ultrasonic, sonic or infrasonic waves
- A61B8/46—Ultrasonic, sonic or infrasonic diagnostic devices with special arrangements for interfacing with the operator or the patient
- A61B8/467—Ultrasonic, sonic or infrasonic diagnostic devices with special arrangements for interfacing with the operator or the patient characterised by special input means
-
- A—HUMAN NECESSITIES
- A61—MEDICAL OR VETERINARY SCIENCE; HYGIENE
- A61B—DIAGNOSIS; SURGERY; IDENTIFICATION
- A61B8/00—Diagnosis using ultrasonic, sonic or infrasonic waves
- A61B8/48—Diagnostic techniques
- A61B8/483—Diagnostic techniques involving the acquisition of a 3D volume of data
-
- A—HUMAN NECESSITIES
- A61—MEDICAL OR VETERINARY SCIENCE; HYGIENE
- A61B—DIAGNOSIS; SURGERY; IDENTIFICATION
- A61B8/00—Diagnosis using ultrasonic, sonic or infrasonic waves
- A61B8/48—Diagnostic techniques
- A61B8/485—Diagnostic techniques involving measuring strain or elastic properties
-
- A—HUMAN NECESSITIES
- A61—MEDICAL OR VETERINARY SCIENCE; HYGIENE
- A61B—DIAGNOSIS; SURGERY; IDENTIFICATION
- A61B8/00—Diagnosis using ultrasonic, sonic or infrasonic waves
- A61B8/52—Devices using data or image processing specially adapted for diagnosis using ultrasonic, sonic or infrasonic waves
- A61B8/5215—Devices using data or image processing specially adapted for diagnosis using ultrasonic, sonic or infrasonic waves involving processing of medical diagnostic data
- A61B8/5223—Devices using data or image processing specially adapted for diagnosis using ultrasonic, sonic or infrasonic waves involving processing of medical diagnostic data for extracting a diagnostic or physiological parameter from medical diagnostic data
-
- G—PHYSICS
- G06—COMPUTING OR CALCULATING; COUNTING
- G06T—IMAGE DATA PROCESSING OR GENERATION, IN GENERAL
- G06T12/00—Tomographic reconstruction from projections
- G06T12/30—Image post-processing, e.g. metal artefact correction
-
- G—PHYSICS
- G06—COMPUTING OR CALCULATING; COUNTING
- G06T—IMAGE DATA PROCESSING OR GENERATION, IN GENERAL
- G06T15/00—Three-dimensional [3D] image rendering
- G06T15/08—Volume rendering
-
- G—PHYSICS
- G09—EDUCATION; CRYPTOGRAPHY; DISPLAY; ADVERTISING; SEALS
- G09G—ARRANGEMENTS OR CIRCUITS FOR CONTROL OF INDICATING DEVICES USING STATIC MEANS TO PRESENT VARIABLE INFORMATION
- G09G5/00—Control arrangements or circuits for visual indicators common to cathode-ray tube indicators and other visual indicators
- G09G5/36—Control arrangements or circuits for visual indicators common to cathode-ray tube indicators and other visual indicators characterised by the display of a graphic pattern, e.g. using an all-points-addressable [APA] memory
- G09G5/39—Control of the bit-mapped memory
- G09G5/395—Arrangements specially adapted for transferring the contents of the bit-mapped memory to the screen
- G09G5/397—Arrangements specially adapted for transferring the contents of two or more bit-mapped memories to the screen simultaneously, e.g. for mixing or overlay
-
- G—PHYSICS
- G16—INFORMATION AND COMMUNICATION TECHNOLOGY [ICT] SPECIALLY ADAPTED FOR SPECIFIC APPLICATION FIELDS
- G16H—HEALTHCARE INFORMATICS, i.e. INFORMATION AND COMMUNICATION TECHNOLOGY [ICT] SPECIALLY ADAPTED FOR THE HANDLING OR PROCESSING OF MEDICAL OR HEALTHCARE DATA
- G16H50/00—ICT specially adapted for medical diagnosis, medical simulation or medical data mining; ICT specially adapted for detecting, monitoring or modelling epidemics or pandemics
- G16H50/30—ICT specially adapted for medical diagnosis, medical simulation or medical data mining; ICT specially adapted for detecting, monitoring or modelling epidemics or pandemics for calculating health indices; for individual health risk assessment
-
- G—PHYSICS
- G01—MEASURING; TESTING
- G01S—RADIO DIRECTION-FINDING; RADIO NAVIGATION; DETERMINING DISTANCE OR VELOCITY BY USE OF RADIO WAVES; LOCATING OR PRESENCE-DETECTING BY USE OF THE REFLECTION OR RERADIATION OF RADIO WAVES; ANALOGOUS ARRANGEMENTS USING OTHER WAVES
- G01S15/00—Systems using the reflection or reradiation of acoustic waves, e.g. sonar systems
- G01S15/88—Sonar systems specially adapted for specific applications
- G01S15/89—Sonar systems specially adapted for specific applications for mapping or imaging
- G01S15/8906—Short-range imaging systems; Acoustic microscope systems using pulse-echo techniques
- G01S15/8993—Three dimensional imaging systems
-
- G—PHYSICS
- G01—MEASURING; TESTING
- G01S—RADIO DIRECTION-FINDING; RADIO NAVIGATION; DETERMINING DISTANCE OR VELOCITY BY USE OF RADIO WAVES; LOCATING OR PRESENCE-DETECTING BY USE OF THE REFLECTION OR RERADIATION OF RADIO WAVES; ANALOGOUS ARRANGEMENTS USING OTHER WAVES
- G01S7/00—Details of systems according to groups G01S13/00, G01S15/00, G01S17/00
- G01S7/52—Details of systems according to groups G01S13/00, G01S15/00, G01S17/00 of systems according to group G01S15/00
- G01S7/52017—Details of systems according to groups G01S13/00, G01S15/00, G01S17/00 of systems according to group G01S15/00 particularly adapted to short-range imaging
- G01S7/52023—Details of receivers
- G01S7/52036—Details of receivers using analysis of echo signal for target characterisation
- G01S7/52042—Details of receivers using analysis of echo signal for target characterisation determining elastic properties of the propagation medium or of the reflective target
-
- G—PHYSICS
- G06—COMPUTING OR CALCULATING; COUNTING
- G06T—IMAGE DATA PROCESSING OR GENERATION, IN GENERAL
- G06T2210/00—Indexing scheme for image generation or computer graphics
- G06T2210/62—Semi-transparency
-
- G—PHYSICS
- G09—EDUCATION; CRYPTOGRAPHY; DISPLAY; ADVERTISING; SEALS
- G09G—ARRANGEMENTS OR CIRCUITS FOR CONTROL OF INDICATING DEVICES USING STATIC MEANS TO PRESENT VARIABLE INFORMATION
- G09G2340/00—Aspects of display data processing
- G09G2340/06—Colour space transformation
-
- G—PHYSICS
- G09—EDUCATION; CRYPTOGRAPHY; DISPLAY; ADVERTISING; SEALS
- G09G—ARRANGEMENTS OR CIRCUITS FOR CONTROL OF INDICATING DEVICES USING STATIC MEANS TO PRESENT VARIABLE INFORMATION
- G09G2380/00—Specific applications
- G09G2380/08—Biomedical applications
-
- G—PHYSICS
- G09—EDUCATION; CRYPTOGRAPHY; DISPLAY; ADVERTISING; SEALS
- G09G—ARRANGEMENTS OR CIRCUITS FOR CONTROL OF INDICATING DEVICES USING STATIC MEANS TO PRESENT VARIABLE INFORMATION
- G09G3/00—Control arrangements or circuits, of interest only in connection with visual indicators other than cathode-ray tubes
- G09G3/001—Control arrangements or circuits, of interest only in connection with visual indicators other than cathode-ray tubes using specific devices not provided for in groups G09G3/02 - G09G3/36, e.g. using an intermediate record carrier such as a film slide; Projection systems; Display of non-alphanumerical information, solely or in combination with alphanumerical information, e.g. digital display on projected diapositive as background
- G09G3/003—Control arrangements or circuits, of interest only in connection with visual indicators other than cathode-ray tubes using specific devices not provided for in groups G09G3/02 - G09G3/36, e.g. using an intermediate record carrier such as a film slide; Projection systems; Display of non-alphanumerical information, solely or in combination with alphanumerical information, e.g. digital display on projected diapositive as background to produce spatial visual effects
-
- G—PHYSICS
- G09—EDUCATION; CRYPTOGRAPHY; DISPLAY; ADVERTISING; SEALS
- G09G—ARRANGEMENTS OR CIRCUITS FOR CONTROL OF INDICATING DEVICES USING STATIC MEANS TO PRESENT VARIABLE INFORMATION
- G09G5/00—Control arrangements or circuits for visual indicators common to cathode-ray tube indicators and other visual indicators
- G09G5/02—Control arrangements or circuits for visual indicators common to cathode-ray tube indicators and other visual indicators characterised by the way in which colour is displayed
Definitions
- the present invention relates to an ultrasonic diagnostic apparatus, an ultrasonic image processing apparatus, an ultrasonic image processing program, and an ultrasonic image generation method, and in particular, a three-dimensional tomographic image obtained from reflected echo signals of a plurality of tomographic planes of a subject.
- the present invention relates to a technique for generating a two-dimensional projection image (three-dimensional tomographic image) based on volume data.
- the ultrasonic diagnostic device transmits ultrasonic waves to the inside of the subject using an ultrasonic probe equipped with a plurality of ultrasonic transducers, and receives ultrasonic reflected echo signals corresponding to the structure of the living tissue from the inside of the subject. Then, a tomographic image such as a B-mode image is generated based on the reflected echo signal and displayed for diagnosis.
- three-dimensional tomographic image volume data is generated from reflected echo signals of a plurality of tomographic planes of a subject measured by scanning ultrasonic waves in the short axis direction of the ultrasonic probe, and the volume It is known to generate an image (3D tomographic image) obtained by projecting 3D tomographic volume data onto a 2D projection plane using a rendering technique.
- Volume rendering technology for example, corrects the luminance values of a plurality of voxels arranged in the line-of-sight direction when viewing 3D tomographic volume data from a point on the 2D projection plane, while correcting the brightness value by the transparency / opacity of each voxel.
- a three-dimensional tomographic image is generated by accumulating and adding pixel values (luminance) on the two-dimensional projection plane along the direction.
- the luminance of each voxel obtained by ultrasonic scanning is determined according to the acoustic impedance of the tissue in the subject and the attenuation of the ultrasonic wave due to propagation in the subject. It is difficult to generate 3D tomographic images that characterize only (for example, with increased brightness).
- a maximum value projection method for displaying only high-intensity tissues of three-dimensional tomographic volume data for example, a maximum value projection method for displaying only high-intensity tissues of three-dimensional tomographic volume data, a minimum value projection method for displaying only low-intensity tissues, and the like are generally used. Further, as described in Patent Document 1, it is known that the three-dimensional structure of the low echo area can be easily recognized by inverting the brightness level of the B-mode image.
- the maximum value projection method, the minimum value projection method, and the method of inverting the brightness level of the B-mode image are limited in their applications, so the visibility of the specific tissue desired by the examiner is improved. It is not always possible to generate 3D tomographic images freely. For example, these methods can generate a three-dimensional tomographic image in which the visibility of a high-luminance tissue or a low-luminance tissue is enhanced, but a three-dimensional tomographic image in which the visibility of a tissue having an intermediate brightness is enhanced. Difficult to generate.
- an object of the present invention is to generate a three-dimensional tomographic image in which the visibility of a specific tissue desired by the examiner is enhanced.
- the ultrasonic diagnostic apparatus of the present invention is based on an ultrasonic probe that transmits and receives ultrasonic waves to and from a subject, and reflected echo signals of a plurality of tomographic planes of the subject measured by the ultrasonic probe.
- a tomographic volume data generation unit that generates 3D tomographic volume data, and a tomographic volume rendering that generates a 3D tomographic image viewed from at least one line of sight on a 2D projection plane based on the 3D tomographic volume data
- a display unit that displays a three-dimensional tomographic image, and in particular, an offset calculation unit that increases or decreases the luminance value of each voxel according to the luminance value of each voxel of the three-dimensional tomographic image volume data.
- the increase / decrease amount of the luminance value of each voxel of the offset calculation unit can be adjusted via the input interface, and the tomogram volume rendering unit is connected to the offset calculation unit.
- Ri luminance value is characterized by generating a 3-dimensional tomographic image based on three-dimensional tomogram volume data offset.
- the examiner can adjust the increase / decrease amount of the luminance value of each voxel of the offset calculation unit via the input interface, a three-dimensional tomographic image in which only a tissue having a specific luminance value is emphasized is generated. can do. Therefore, by adjusting the luminance value of a desired specific tissue in an increased amount, adjusting the luminance value of a tissue other than the desired specific tissue in a reduced amount, or by performing both adjustments, the visual recognition of the desired specific tissue is performed. A three-dimensional tomographic image with improved characteristics can be generated.
- the amount of increase (offset amount) of the luminance value corresponding to the vicinity of the luminance value can be increased in advance.
- the luminance value (offset amount) corresponding to the vicinity of the high luminance value when looking at the generated three-dimensional tomographic image, if it is difficult to see the desired specific tissue behind the high-intensity tissue, decrease the luminance value (offset amount) corresponding to the vicinity of the high luminance value. If the size is increased, the high-intensity tissue that has become a wall is less likely to be reflected in the three-dimensional tomographic image, so that the visibility of the desired specific tissue can be improved.
- the offset calculation unit is configured to change the elasticity of each voxel of the three-dimensional elastic image volume data
- the luminance value of each corresponding voxel of the three-dimensional tomographic image volume data can be increased or decreased according to the value.
- the examiner generates a three-dimensional tomographic image in which the visibility of the tissue having a specific elasticity value is enhanced by paying attention to the elasticity value (hardness or softness of the tissue) desired.
- the elasticity value hardness or softness of the tissue
- the increase (offset amount) of the luminance value corresponding to the vicinity of the elasticity can be increased in advance.
- you want to observe hard (or soft) tissue you can search for hard (or soft) tissue by increasing the increase (offset amount) of the brightness value corresponding to the high (or low) elasticity value. Can be observed.
- the offset calculation unit includes a boundary value that divides a range of luminance values that can be taken by each voxel of the three-dimensional tomographic image volume data or a range of elastic values that can be taken by each voxel of the three-dimensional elastic image volume data into a plurality of regions.
- offset tables that increase the visibility of tissues with low brightness values offset tables that increase the visibility of tissues with intermediate brightness values, offset tables that increase the visibility of tissues with high brightness values, etc. by default If a plurality are prepared, the examiner only has to select one of the offset tables, which is convenient. Further, by making it possible to adjust the boundary value and the increase / decrease amount of the offset table via the input interface, it is possible to make finer fine adjustments, thereby further improving the visibility of the tissue desired by the examiner.
- the tomogram volume rendering unit has an opacity table in which transparency / opacity is set according to the luminance value of each voxel of the three-dimensional tomogram volume data, and at least one line of sight of the three-dimensional tomogram volume data.
- a three-dimensional tomographic image can be generated based on the brightness value of each voxel on the line of sight in the direction and the transparency / opacity based on the opacity table.
- the tomogram volume rendering unit has a brightness-opacity map in which transparency / opacity and a color code are set according to the brightness value of each voxel of the three-dimensional tomogram volume data.
- the two-dimensional tomographic image is generated by converting the color of each voxel of the tomographic image data of at least one cross section of the three-dimensional tomographic volume data in which the luminance value is offset based on the three-dimensional tomographic image. Two-dimensional tomographic images and luminance-opacity maps can be displayed.
- the transparency / opacity of each voxel is an index indicating how much the voxel is reflected in the three-dimensional tomographic image. Therefore, by coloring and displaying according to the transparency / opacity of each voxel of the two-dimensional tomographic image, the examiner can refer to the two-dimensional tomographic image and what part of the two-dimensional tomographic image is three-dimensional. Whether it is reflected in the tomographic image can be recognized. Further, by referring to the two-dimensional tomographic image, it becomes easy to adjust the offset table for improving the visibility of a desired specific tissue.
- Color encoding on 2D tomographic images by transparency / opacity is when the examiner changes (adjusts) the offset amount, the position of the luminance boundary, and the gain adjustment value of the opacity table and tomographic image input value via the control panel
- a certain time for example, about 1 to 5 seconds
- the influence of the operation on the three-dimensional tomographic image is The examiner can be informed via a tomogram.
- the transparency / opacity color encoding is terminated, and a normal diagnosis can be performed without delay by displaying a normal tomographic image.
- FIG. 1 is a block diagram showing the overall configuration of an ultrasonic diagnostic apparatus according to a first embodiment Diagram showing the relationship between voxel value and opacity
- the figure which shows an example of the setting screen of the offset table used in an offset calculating part
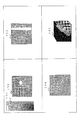
- Data flow diagram of luminance value conversion processing performed in the offset calculator Schematic diagram of a tomographic image of the fetal head represented by 256-level luminance values
- Example of offset table setting for improving ventricular visibility Schematic diagram of a 3D tomogram generated based on 3D tomogram volume data that has been offset calculated by the offset calculator based on the offset table shown in FIG.
- Example of offset table setting for improving visibility of brain parenchyma Schematic diagram of a 3D tomogram generated based on 3D tomogram volume data that has been offset calculated by the offset calculator based on the offset table shown in FIG. Figure showing a display example of a two-dimensional tomographic image and a luminance-opacity map A figure showing an example of display of 3D tomographic image, 2D tomographic image and brightness-opacity map A figure showing an example of display of 3D tomographic image, 2D tomographic image and brightness-opacity map The figure which shows the creation flow of the color conversion table The figure which shows an example of the process which produces the color map table OUTMAP [i] after a synthesis
- the figure which shows an example of the setting screen of the offset table used in an offset calculating part Data flow diagram of luminance value conversion processing performed in the offset calculator
- FIG. 1 is a block diagram showing the overall configuration of the ultrasonic diagnostic apparatus according to the first embodiment.
- the ultrasonic diagnostic apparatus 100 supplies an ultrasonic probe 2 that transmits and receives ultrasonic waves to and from the subject 1 and a drive signal to the ultrasonic probe 2.
- a phasing addition unit 10 is provided to generate an RF signal by phasing and adding the received reflected echo signals.
- a tomographic image processing unit 12 that generates tomographic image data by performing various processes such as logarithmic compression, filter processing, and image processing on the RF signal (ultrasound signal) output from the phasing addition unit 10;
- a tomogram volume data generation unit 14 that performs coordinate transformation on the tomogram data of a plurality of tomographic planes of the specimen 1 and creates three-dimensional tomogram volume data orthogonal to each axis, and each voxel of the three-dimensional tomogram volume data
- An offset calculation unit 16 which is a feature of the present embodiment that performs an offset calculation of the luminance value of the image, and a tomographic image that generates a three-dimensional tomographic image using volume rendering technology for the offset calculated three-dimensional tomographic image volume data
- a volume rendering unit 18 is provided.
- a tomographic image 2D coordinate conversion unit 20 that generates a 2D tomographic image on at least one tomographic plane of 3D tomographic image volume data based on output data from the tomographic image processing unit 12, and a tomographic image volume rendering unit 18
- an image composition unit 22 that synthesizes the three-dimensional tomographic image generated in step 2 and the two-dimensional tomographic image generated by the tomographic image two-dimensional coordinate conversion unit 20, and a display unit that displays the image output from the image composition unit 22
- a display unit 24 is provided.
- a control panel 26 as an input interface that receives an input of a command or the like from an examiner, and a control unit 28 that controls each of the above-described components constituting the ultrasonic diagnostic apparatus 100 based on an input command from the control panel 26. It has. For example, if the examiner designates an arbitrary cross section of the three-dimensional tomographic volume data via the control panel 26, the designated cross-sectional position information is sent to the tomographic image two-dimensional coordinate conversion unit 20, and the two-dimensional image at the cross-sectional position is sent. A tomographic image is generated.
- transducer elements are arranged for 1 to m channels in the long axis direction of the ultrasonic probe.
- the short axis can be changed by changing the delay time given to each transducer element (1 to k channels) in the short axis direction.
- the direction of transmission and reception can also be applied to the direction.
- transmission weighting is applied by changing the amplitude of the ultrasonic transmission signal applied to each transducer element in the short axis direction, and the amplification level or attenuation level of the ultrasonic reception signal from each transducer element in the short axis direction is set. By changing, receiving weighting can be applied.
- the aperture control can be performed by turning each transducer element in the short axis direction on and off.
- the ultrasonic probe 2 is driven by a motor by a control signal from the control unit 28 or manually moved while moving in the short axis direction to collect three-dimensional data of a plurality of tomographic planes of the subject 1. Is possible.
- an ultrasonic beam in the short axis direction along the curvature of the probe head or in the short axis direction generated by electronic focusing is used. It is possible to collect 3D ultrasound data.
- the ultrasonic probe 2 has an ultrasonic transmission / reception sensitivity, that is, an electromechanical coupling coefficient that changes in accordance with the magnitude of a bias voltage applied in a superimposed manner on the drive signal supplied from the transmission unit 4, for example, a cMUT (Capacitive, Micromachined, Ultrasonic, Transducer: IEEE, Trans, Ultrason, Ferroelect, Freq, Contr, Vol45, pp.678-690, May 1998, etc.) can be applied.
- the cMUT is an ultrafine capacitive ultrasonic transducer manufactured by a semiconductor microfabrication process (for example, LPCVD: Low, Pressure, Chemical, Vapor, Deposition).
- the transmission unit 4 and the reception unit 6 supply a transmission signal to the ultrasonic probe 2 and process the received reflected echo signal.
- the transmission unit 4 and the reception unit 6 control the ultrasonic probe 2 and transmit an ultrasonic beam.
- a receiving circuit that receives a reflected echo signal of the emitted ultrasonic beam from within the subject 1 and collects biological information, and is controlled by the ultrasonic transmission / reception control unit 8. .
- the phasing adder 10 controls the phase of the reflected echo signal output from the receiver 6 and forms an ultrasonic wave reception beam at one point or a plurality of convergence points.
- the RF signal generated in the phasing adder 10 may be a complex demodulated I and Q signal.
- the tomographic image processing unit 12 processes the reflected echo signal phased and added by the phasing adder 10, and a signal processing circuit that performs logarithmic compression, filter processing, and image processing based on the sequentially input reflected echo signal And a storage device comprising a magnetic disk device for storing an ultrasonic image and a RAM.
- the tomographic volume data generation unit 14 generates three-dimensional tomographic volume data based on the tomographic image data of a plurality of tomographic planes processed by the tomographic image processing unit 12.
- the offset calculation unit 16 performs a luminance value offset calculation for each voxel of the three-dimensional tomographic image volume data. Details of this will be described later.
- the tomogram volume rendering unit 18 performs two-dimensional projection processing such as volume rendering on the three-dimensional tomogram volume data subjected to the offset calculation, generates a three-dimensional tomographic image, and transfers it to the image composition unit 22.
- the tomographic image two-dimensional coordinate conversion unit 20 generates a two-dimensional tomographic image on at least one tomographic plane of the three-dimensional tomographic image volume data based on the output data from the tomographic image processing unit 12 by resampling and interpolation processing. Transfer to the combining unit 22.
- the image composition unit 22 synthesizes the three-dimensional tomographic image generated by the tomographic image volume rendering unit 18 and the two-dimensional tomographic image generated by the tomographic image two-dimensional coordinate conversion unit 20 and transfers them to the display unit 24.
- the display unit 24 inputs the image generated by the image composition unit 22 and displays it as an ultrasonic image, and is formed by, for example, a CRT monitor or a liquid crystal monitor.
- the tomographic image volume rendering unit 18 of the ultrasonic diagnostic apparatus 100 of the present embodiment generates a projection image (three-dimensional tomographic image) when viewed from at least one line-of-sight direction on the two-dimensional projection surface based on the three-dimensional tomogram volume data.
- a three-dimensional tomographic image is constructed by multiplying the luminance value in the line-of-sight direction in the data by the transparency value for each luminance transferred from the control unit 28 and adding it.
- a formula of a known volume rendering method used in the present embodiment is defined as follows.
- Ai in Equations 1 and 2 is the opacity of the i-th voxel value on the line of sight, and takes a value of 0.0 to 1.0.
- Cout and Aout both have an initial value of 0.
- Aout is accumulated (cumulative addition) and converges to 1.0 each time it passes through a voxel. Therefore, as shown in Expression 1, when the integrated value Aout-1 of the opacity of the voxels up to the (i-1) th is about 1.0, the ith voxel value Ci is not reflected in the output image.
- the transparency when the opacity is Ai is represented by 1-Ai, and the opacity and transparency are complementary to each other. Therefore, in this specification, the concept of transparency and opacity is appropriately described as transparency / opacity. For example, even when opacity is described for explanation, the concept of transparency is included at the same time.
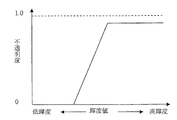
- Fig. 2 shows the relationship between voxel values and opacity.
- the relationship between voxel values and opacity is generally expressed as an opacity table (opacity table) with luminance on the horizontal axis and opacity on the vertical axis. Refer to opacity from the voxel luminance value. To do.
- the volume radar processing it is possible to display three-dimensional tomographic image data in a three-dimensional manner with voxels having high opacity as the surface.
- the maximum projection method (Maximum intensity projection) that displays only the high-intensity structure in the region of interest, the minimum that draws only the low-intensity structure
- a value projection method (Minimum intensity projection)
- a method of displaying an accumulated image of voxel values in the line of sight (Ray summation) are used.
- the ultrasonic diagnostic apparatus of the present embodiment includes an ultrasonic probe 2 that transmits and receives ultrasonic waves to and from the subject 1, and reflected echoes of a plurality of tomographic planes of the subject 1 that are measured by the ultrasonic probe 2.
- a tomographic volume data generation unit 14 that generates 3D tomographic volume data based on the signal, and a 3D tomographic image viewed from at least one line of sight on the 2D projection plane based on the 3D tomographic volume data
- An ultrasonic diagnostic apparatus comprising a tomogram volume rendering unit 18 and a display unit 24 for displaying a three-dimensional tomographic image, each voxel corresponding to a luminance value of each voxel of three-dimensional tomogram volume data
- An offset calculation unit 16 that increases or decreases the luminance value of the offset calculation unit 16 can be adjusted via an input interface (control panel) 26, and the tomogram volume range can be adjusted.
- Ring section 18 is for generating a three-dimensional tomographic image based on three-dimensional tomogram volume data which the luminance value is offset by the offset calculating section 16.
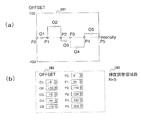
- FIG. 3 is a diagram showing an example of an offset table setting screen used in the offset calculation unit 16.
- 3 (a) and 3 (b) are examples of setting an offset table.
- the offset table is a boundary value that divides the range of brightness values (0 to 255) that each voxel of the three-dimensional tomographic volume data can take into a plurality of regions (N: 5 in this embodiment). (P0 to P5) and an increase / decrease amount (O1 to O5) of the luminance value for each of the plurality of divided areas are set.
- the boundary of the area can be set by moving the boundary value setting pointers indicated by P0 to P5 to the left and right via the control panel 26.
- O1 to O5 are pointers indicating the increase / decrease amount (offset value) of the luminance value of each area, and the offset value of each area can be set by moving up and down.
- the upper and lower limits of the graph 31 are 100 and -100, respectively. However, the upper limit and the lower limit are shown as an example, and any number can be used as long as the input and output data can be taken. It is assumed that the offset process is not performed on input luminance values that are not subject to offset by moving P0 or P5.
- P0 and P5 can be fixed at both ends of the range of luminance values that each voxel can take.
- the boundary values (P0 to P5) and the luminance value increase / decrease amounts (O1 to O5) can be set using a toggle, an encoder, an adjustment button on the liquid crystal panel, or the like.
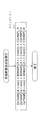
- FIG. 4 is a data flow diagram of luminance value conversion processing performed by the offset calculation unit 16.
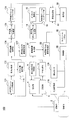
- the counter i is initialized to 0 (step 41).
- the luminance value m (i) of each voxel of the three-dimensional tomographic image volume data is read (step 42). It is determined whether i is larger than the total number of data (the number of voxels) (step 43). If i is larger (Yes in step 43), the offset filter process is terminated. On the other hand, if the offset processing is not performed for all voxels of the three-dimensional tomographic image volume data that are not large, the process proceeds to step 44, and the area selection counter n is initialized to 1 (step 44).
- step 45 It is determined whether the area selection counter n is smaller than the brightness adjustment area number N (step 45) . If the area selection counter n is smaller (Yes in step 45), the i-th brightness value m read from the three-dimensional tomographic volume data is read. It is determined whether (i) is within the range of P (n-1) and P (n) (step 46). If Yes in step 46, the increase / decrease amount (offset value) O (n) of the brightness value is added in step 48 (step 48). On the other hand, if No in step 46, the area selection counter n is updated and the process returns to step 45 (step 47).
- step 45 the i-th luminance value m (i) from which the three-dimensional tomographic volume data is read is divided into any region divided by the boundary values P (0) to P (N).
- step 48 the luminance value increase / decrease amount (offset value) O (n) corresponding to the divided area is added.
- the luminance value increase / decrease amount (offset value) O (n) for each region divided by the boundary values P (0) to P (N) is added to the luminance values of all voxels of the three-dimensional tomographic volume data.
- the offset process is performed using the offset table.
- the present invention is not limited to this.
- a function that outputs an increase / decrease amount of the luminance value according to the input of the luminance value of each voxel of the three-dimensional tomographic volume data is set in the offset calculation unit, and the luminance value of each voxel is calculated based on this function. It can be increased or decreased.
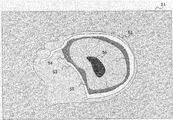
- FIG. 5 is a schematic view of a tomographic image of the fetal head represented by 256 gradation luminance values.
- the luminance value of the fetal epidermis 52 is 128.
- the luminance value of the fetal skull 53 is 200 and the luminance value of the skull lumen region 54 is 32.
- the luminance value of the brain parenchyma 55 is 80 and the luminance value of the ventricle 56 is 16.
- the background around the fetal head is not considered because the effect is simply explained.
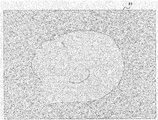
- FIG. 6 shows a three-dimensional tomographic image when the general opacity setting is used.
- the three-dimensional tomographic image 61 is constructed as a three-dimensional surface image in which most of the output luminance is determined by the high-luminance fetal epidermis 52 and fetal skull 53 and the surface of the fetal head is rendered.
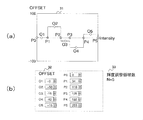
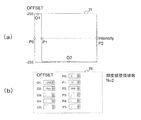
- an offset table is set as shown in FIG. That is, the offset table is like a graph 71 shown in FIG. 7A and a display window 72 shown in FIG. 7B.
- the number N of adjustment areas is 2, and P0 and P2 are the minimum and maximum values of the input luminance and are fixed.
- an increase / decrease amount (offset value) of the luminance value added to the target part O1 255
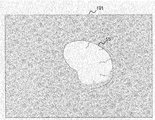
- FIG. 8 is a schematic diagram of a three-dimensional tomographic image generated based on the three-dimensional tomographic image volume data subjected to the offset calculation by the offset calculation unit 16 based on the offset table as shown in FIG.
- the luminance value of the ventricle 56 is 16, which is within the range of P0 (0) to P1 (17), so an offset of +255 is made, and the other tissues are within the range of P1 (17) to P2 (255) An offset of -255 is made. Therefore, as shown in FIG. 8, the three-dimensional tomographic image 81 is generated and displayed as a three-dimensional tomographic image in which the visibility of the ventricle 56 is enhanced.
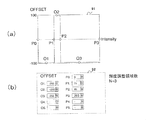
- an offset table is set as shown in FIG. That is, as shown in FIG. 5, the brain parenchyma 55 has a low-brightness ventricle 56 inside, a low-luminance cranial lumen region 54 around it, and a fetal skull 53 around it. Therefore, the luminance range for which visibility is desired to be improved is one area corresponding to the intermediate luminance. Therefore, the offset table has an adjustment area number N of 3, as in the graph 91 shown in FIG. 9A and the display window 92 shown in FIG. 9B, and P0 and P3 are the minimum and maximum values of the input luminance.
- the boundary values P1 and P2 can be arbitrarily set via the control panel 26 while confirming the image.
- FIG. 10 is a schematic diagram of a three-dimensional tomographic image generated based on the three-dimensional tomographic image volume data that has been subjected to the offset calculation by the offset calculation unit 16 based on the offset table as shown in FIG.
- the luminance value of the brain parenchyma 55 is 80 and is within the range of P1 (75) to P2 (85), so +255 offset is made, and other tissues are P0 (0) to P1 (75) or P2 (85) Since it is within the range of P3 (255), an offset of -255 is made. Therefore, as shown in FIG. 10, the three-dimensional tomographic image 101 is generated and displayed as a three-dimensional tomographic image with improved visibility of the brain parenchyma 55.
- the increase / decrease in the number N of brightness adjustment areas, the boundary values P0-Pn, and the offset O0-On can be set from the control panel 26 on the liquid crystal panel on the display or by the trackball operation on the control panel 26 or the touch panel on the display unit 24. It is also possible to set from the control panel 26 by using a pull-down menu (up / down bar) in the display window 32.
- an example is shown in which the examiner adjusts the offset table via the control panel 26, but the present invention is not limited to this.
- Multiple offset tables by default, such as an offset table that increases the visibility of tissues with low luminance values, an offset table that increases the visibility of tissues with intermediate luminance values, and an offset table that increases the visibility of tissues with high luminance values It may be prepared and the examiner may select which offset table to use. According to this, the examiner can obtain a three-dimensional tomographic image with improved visibility of a desired specific tissue by a simple operation.
- FIG. 11 is a diagram illustrating a display example of a two-dimensional tomographic image and a luminance-opacity map.
- FIG. 11 (a) shows a two-dimensional tomographic image
- FIG. 11 (b) shows a luminance-opacity map.
- the luminance-opacity map 111 is set with a color code using a two-dimensional table in which the vertical axis and the horizontal axis take the luminance value and the opacity, respectively. That is, the color code is set according to the luminance value and the transparency / opacity.
- the two-dimensional tomographic image 112 is colored according to the color code of the luminance-opacity map 111.
- the broken line in the luminance-opacity map 111 corresponds to the relationship between the voxel value and the opacity shown in FIG. 2, and the opacity with respect to the input luminance value is uniquely determined, and the pixels displayed in the two-dimensional tomographic image 112 Is determined at one point on the broken line in the luminance-opacity map 111.
- the tomographic image data that is the basis of the two-dimensional tomographic image 112 is generated by the tomographic image two-dimensional coordinate conversion unit 20.
- the tomographic image data is tomographic image data of an arbitrary cross section of the three-dimensional tomographic volume data designated by the examiner via the control panel 26, and is not subjected to offset processing by the offset calculation unit 16.
- This tomographic image data is input to the image composition unit 22.
- the image composition unit 22 acquires the boundary value of the offset table, the luminance increase / decrease amount (offset value), and the luminance-opacity map 111 from the control unit 28.
- the image composition unit 22 offsets the luminance value of the tomographic image data input from the tomographic image two-dimensional coordinate conversion unit 20 based on the offset table, and the luminance-opacity for each voxel of the offset tomographic image data.
- a color is converted based on the map 111 to generate a two-dimensional tomographic image.
- the luminance value and opacity of each voxel of the tomographic image data with the luminance value offset are converted into numerical values having color information such as RGB and YUV.
- the luminance value is set on the vertical axis as in the luminance-opacity map 111, and the color data with high saturation that is not correlated with the input data is set on the horizontal axis as the opacity decreases.
- a transparent region, a non-transparent region, and an intermediate region in the three-dimensional tomographic image can be displayed in stages.
- a high intermediate region 115 and a transparent region 116 that does not affect the three-dimensional tomographic image are encoded and displayed with a hue different from the luminance.
- the examiner can grasp which region on the two-dimensional tomographic image 112 is reflected in the three-dimensional tomographic image and which part is not reflected.
- the transparent area 116 is not reflected in the three-dimensional tomographic image by the current offset table setting, and it can be seen that the offset table setting must be adjusted if it is to be reflected.
- FIG. 12 is a diagram showing an example of display of a 3D tomographic image, a 2D tomographic image, and a luminance-opacity map.
- the three-dimensional tomographic image 121, the two-dimensional tomographic image 122, and the luminance-opacity map 123 are displayed side by side.
- the examiner can recognize that the opaque region 113 is drawn opaquely, the transparent region 116 is not drawn at all, and the intermediate regions 114 and 115 are drawn translucently.
- the opaque region 113 is emphasized, the target portion can be clearly visualized.
- FIG. 13 is a diagram showing an example of display of a 3D tomographic image, a 2D tomographic image, and a luminance-opacity map.
- the transparency map 135 can also be displayed side by side.
- FIG. 14 is a diagram showing a flow of creating a color conversion table. Symbols P and O shown in FIG. 14 indicate the boundary value P (n) and the luminance value increase / decrease amount (offset value) O (n).
- the color conversion table OUTMAP [i] used in this embodiment is a post-combination color map table
- BWMAP [i] is an RGB conversion table for tomographic image output
- COLMAP [i] is an RGB for transparency setting.
- a color table is shown. These are tables that perform conversion to natural colors by returning the three primary colors R, G, and B for the input i. R, *. G, *.
- i indicates a gradation based on the input luminance, which is often 256 gradations from 0 to 255, but any number can be used.
- an input gradation value (indicating an input luminance value, an elast value, or other input) represented by a counter i is initialized to 0 (step 141). ). Subsequently, the counter i is compared with Mmap (the number of gradations of the map) (step 142). If i is smaller than Mmap (No in step 142), the process proceeds to step 143. In step 143, the area selection counter n is initialized to 1, and the selected input gradation value i is any area divided by the boundary values P (0) to P (N) in steps 144 and 145.
- a post-synthesis color map table OUTMAP [i] is created using this opacity mm (i).
- step 146 is a parameter that gives the influence of the opacity color, and is usually 1.0.
- Steps 143 and 147 are an initialization process and an update process for the area selection counter n, and step 149 is an update process for the counter i.
- FIG. 15 is a diagram showing an example of processing for creating the post-combination color map table OUTMAP [i] in step 148.
- each element of OUTMAP [i] is added by multiplying BWMAP [i] and OUTMAP [i] by coefficients mm (i) and (1.0-mm (i)), respectively. Calculated as a value.
- a tomographic image area that is imaged as an opaque three-dimensional voxel is displayed as it is in black and white or a tonal image of a set color tone, and a tomographic image area that is imaged as a transparent three-dimensional voxel is set.
- the transparency setting color other than the tones is displayed, and the ratio of the transparency setting color is strongly displayed on the tomographic image as it becomes opaque to transparent.
- the constant v used in step 146 is set to 1.0 or less (for example, 0.9 or 0.8). It is possible to adjust the color development such as translucency. As a result, the completely opaque area of the input gradation value i is not completely green but translucent green, so that the examiner can visually recognize the form of the area.
- FIG. 16 is a diagram showing an example of processing for creating the post-combination color map table OUTMAP [i] in step 148.
- the RGB color table for transparency setting is not prepared, the composite color with the fixed transparency setting color value is calculated using the opacity coefficient mm (i), and the post-synthesis color map table OUTMAP is simplified. Have created it.
- composition may be performed by using those in which these parameters are changed by mm (i), and the output format is not limited to the RGB format, and may be a YUV format.
- FIG. 17 is a block diagram showing the configuration of the ultrasonic diagnostic apparatus of the second embodiment. The description of the same configuration as in the first embodiment is omitted.
- the ultrasound diagnostic apparatus 100 stores the RF signal frame data output from the phasing adder 10, and an RF signal frame data selector 171 that selects at least two pieces of frame data;
- a displacement measuring unit 172 that measures the displacement of the biological tissue of the subject, an elastic information calculating unit 173 that obtains a strain or elastic modulus from the displacement information measured by the displacement measuring unit 172, and a strain calculated by the elastic information calculating unit 173
- An elastic image processing unit 174 that forms a color elastic image from the elastic modulus, and an elastic image two-dimensional coordinate conversion unit 177 that converts an output signal from the elastic image processing unit 174 to match the display on the display unit 24 are provided. .
- an elastic image volume data generation unit 175 that performs coordinate conversion to three-dimensional elasticity data based on an output signal from the elastic image processing unit 174 and generates elastic image volume data
- the RF signal frame data selection unit 171 stores a plurality of RF signal frame data from the phasing addition unit 10, and selects one set, that is, two RF signal frame data from the stored RF signal frame data group. For example, the RF signal frame data generated from the phasing adder 10 based on the time series, that is, the frame rate of the image, is sequentially stored in the RF signal frame data selection unit 171 and the stored RF signal frame data (N) is stored in the first order. Select one RF signal frame data (X) from the RF signal frame data group (N-1, N-2, N-3 ... NM) stored in the past in time at the same time To do.
- N, M, and X are index numbers assigned to the RF signal frame data, and are natural numbers.
- the displacement measuring unit 172 performs one-dimensional or two-dimensional correlation processing from the selected set of data, that is, the RF signal frame data (N) and the RF signal frame data (X), and corresponds to each point of the tomographic image.
- a one-dimensional or two-dimensional displacement distribution related to the displacement or movement vector in the living tissue, that is, the direction and magnitude of the displacement is obtained.
- a block matching method is used to detect the movement vector.
- the block matching method divides an image into blocks consisting of N ⁇ N pixels, for example, focuses on the block in the region of interest, searches the previous frame for the block that most closely matches the block of interest, and refers to this
- predictive coding that is, processing for determining the sample value by the difference is performed.
- the elasticity information calculation unit 173 is a strain or elasticity of the biological tissue corresponding to each point on the tomographic image from the measurement value output from the displacement measurement unit 172, for example, the movement vector and the pressure value output from the pressure measurement unit 178.
- the modulus is calculated, and an elastic image signal, that is, elastic frame data is generated based on the strain and elastic modulus.
- the strain data is calculated by spatially differentiating the movement amount of the living tissue, for example, the displacement.
- the elastic modulus can be calculated, and the elastic modulus can be used as elastic data.
- the Young's modulus is a ratio of a simple tensile stress applied to the object and a strain generated in parallel with the tension.
- the elastic image processing unit 174 includes a frame memory and an image processing unit.
- the elastic image processing unit 174 secures elastic frame data output in time series from the elastic information calculation unit 173 in the frame memory, In contrast, image processing is performed.
- the elastic image processing unit 174 evaluates an error of the elastic image from the output information of the RF signal frame data selection unit 171, the displacement measurement unit 172, or the elastic information calculation unit 173, and masks the output image.
- the elastic image two-dimensional coordinate conversion unit 177 converts the elastic frame data from the elastic image processing unit 174 into coordinates according to the monitor.
- the ultrasonic probe 2 can be driven by a motor or manually scanned in the short axis direction by a control signal from the control unit 28.
- the elastic image volume data generating unit 175 performs coordinate conversion from the elastic image processing unit 174 to three-dimensional elastic data, and the elastic image volume rendering unit 176 is a volume existing in the line-of-sight direction of each pixel on the output two-dimensional projection plane. Volume rendering, maximum value, minimum value projection, or average processing is performed on the data.
- the image synthesizing unit 22 synthesizes the tomographic data and the strain / elasticity data created by the tomographic and elastic image volume rendering unit.
- the luminance information and hue information of each pixel of the composite image is to add each information of the black-and-white tomographic image and the color elastic image at a composite ratio, perform RGB conversion, and create an image to be displayed on the display unit 24.
- the offset calculation unit 16 converts the luminance of the three-dimensional tomographic volume data output from the tomographic volume data generation unit 14 using the three-dimensional elastic image data, and transfers it to the tomographic volume rendering unit 18.
- the offset calculation unit 16 of this embodiment is output from the tomogram volume data generation unit 14 according to the elasticity value of each voxel of the three-dimensional elasticity image volume data output from the elasticity image volume data generation unit 175.
- the luminance value of each voxel corresponding to the three-dimensional tomographic volume data is increased or decreased.
- Elastic image data is a general term for elastic parameters representing hardness, such as strain value, Young's modulus, longitudinal elastic modulus, and transverse elastic modulus calculated by the above method, and does not indicate a specific one.
- FIG. 18 is a diagram showing an example of an offset table setting screen used in the offset calculation unit 16.
- 18 (a) and 18 (b) are examples of setting an offset table.
- the offset table is a boundary value that divides the range of elastic values (0 to 255) that each voxel of the three-dimensional elastic image volume data can take into a plurality of regions (N: 5 in this embodiment). (E0 to E5) and the increase / decrease amount (O1 to O5) of the luminance value for each of the plurality of divided areas are set.
- the boundary of the region can be set by moving the boundary value setting pointers indicated by E0 to E5 to the left and right via the control panel 26.
- O1 to O5 are pointers indicating the increase / decrease amount (offset value) of the luminance value of each area, and the offset value of each area can be set by moving up and down.
- the upper limit and lower limit values of the graph 181 are 100 and -100, respectively, but they represent an example and may be any number as long as the input and output data can be taken. It is assumed that the offset process is not performed on the input elasticity value that is not subject to offset by moving E0 or E5.
- E0 and E5 can also be fixed at both ends of the range of elastic values that each voxel can take.
- the boundary values (E0 to E5) and the luminance value increase / decrease amounts (O1 to O5) can be set using a toggle, an encoder, an adjustment button on the liquid crystal panel, or the like.
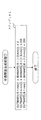
- FIG. 19 is a data flow diagram of luminance value conversion processing performed by the offset calculation unit 16.
- a counter i is initialized to 0 (step 191).
- the luminance value m (i) of each voxel of the 3D tomographic image volume data and the elasticity value e (i) of each voxel of the 3D elastic image volume data are read (step 192). It is determined whether i is larger than the total number of data (number of voxels) (step 193). If i is larger (Yes in step 193), the offset filter process is terminated. On the other hand, if the offset processing is not performed for all voxels of the three-dimensional tomographic volume data, that is, the region selection counter n is initialized to 1 (step 194).
- step 195 It is determined whether or not the area selection counter n is smaller than the brightness adjustment area number N (step 195) . If it is smaller (Yes in step 195), the i-th elasticity value e from which the three-dimensional elasticity image volume data is read e It is determined whether (i) is within the range of E (n-1) and E (n) (step 196). If Yes in step 196, the increase / decrease amount (offset value) O (n) of the brightness value is added to the brightness value of the corresponding voxel of the three-dimensional tomographic image volume data in step 198 (step 198). On the other hand, if No in step 196, the area selection counter n is updated and the process returns to step 195 (step 197).
- step 198 the increase / decrease amount (offset value) O (n) of the luminance value corresponding to the segmented area is added to the luminance value of the corresponding voxel of the three-dimensional tomographic image volume data.
- the luminance value increase / decrease amount (offset value) O (n) for each region divided by the boundary values E (0) to E (N) is added to the luminance values of all voxels of the three-dimensional tomographic volume data. ) Is added.
- the offset process is performed using the offset table.
- the present invention is not limited to this.
- the offset calculation unit in accordance with the input of the elasticity value of each voxel of the 3D elasticity image volume data, a function that outputs the increase / decrease amount of the luminance value of the corresponding voxel of the 3D tomogram volume data is set, Based on this function, the luminance value of the corresponding voxel of the three-dimensional tomographic volume data can be increased or decreased.
- the image composition unit 22 displays a two-dimensional tomographic image and a three-dimensional tomographic image based on the output from the tomographic image two-dimensional coordinate conversion unit 20 and the output from the tomographic image volume rendering unit 18. .
- a three-dimensional elasticity image obtained by projecting the three-dimensional elasticity image volume data onto a two-dimensional projection plane may be displayed on the image composition unit 22 based on the output from the elasticity image volume rendering unit 176. it can.
- the examiner pays attention to the desired elasticity value of the specific tissue (hardness or softness of the tissue) and increases the visibility of the tissue having the specific elasticity value. Can be generated. For example, if the degree of elasticity of a specific tissue desired is grasped, the increase (offset amount) of the luminance value corresponding to the vicinity of the elasticity can be increased in advance. On the other hand, if you want to observe a hard (or soft) tissue, increase the brightness value (offset amount) corresponding to a high (or low) elasticity value to increase the visibility of the hard (or soft) tissue. Since a high three-dimensional tomographic image is displayed, observation of a hard (or soft) tissue is facilitated.
- FIG. 20 is a block diagram showing the configuration of the ultrasonic diagnostic apparatus of the third embodiment.
- the present embodiment inputs the output of the elastic image volume data generation unit 175 to the tomogram volume rendering unit 18 with respect to the ultrasonic diagnostic apparatus of the second embodiment, and the tomogram volume rendering unit 18 is different in that the 3D elastic image volume data can be referred to. Description of other parts similar to those of the second embodiment is omitted.
- the present embodiment has a function of generating a 3D tomographic image requested by the examiner using both 3D tomographic volume data and 3D elastic image volume data.
- the offset calculation unit 16 is configured to increase or decrease the luminance value of each voxel according to the luminance value of each voxel of the three-dimensional tomographic image volume data, as in the first embodiment.
- the control panel 26 has a function of setting a threshold value based on the elasticity value, and the elasticity value threshold value information set by the control panel 26 is set in the tomogram volume rendering unit 18 via the control unit 28. .
- the tomogram volume rendering unit 18 performs the volume rendering of the tomogram using the above-described equations (1) and (2), and the elasticity value of each voxel exceeds the elasticity threshold value. If (or below), the opacity Ai in equation (1) is set to zero for the voxel.
- the input luminance value is subjected to luminance conversion by the offset calculation process, and as a result of comparing with the opacity table, it is opaque, that is, the luminance value to be displayed, but the elastic value is not in the target region, Make it transparent.
- FIG. 21 shows a display example when only the voxel data (luminance data) within the range of the target luminance value is visualized by the processing of this embodiment.
- a three-dimensional tomographic image 211 that visualizes only voxel data (luminance data) that is the target elasticity value and within the range of the target luminance value, and a tomogram at an arbitrary cross section of the three-dimensional tomographic image 211
- Images 212 to 213 obtained by superimposing an image and an elastic image can be displayed side by side.
- These images 212 to 214 are generated by the tomographic image two-dimensional coordinate conversion unit 20 and the elastic image two-dimensional coordinate conversion unit 177, and after being subjected to color coding processing by the image composition unit 22, are superimposed using a method such as ⁇ blending. . Note that these images 212 to 213 can display not only three images but also any number of slice images simultaneously as shown in the figure.
- the elasticity image volume rendering unit 176 uses the elasticity value threshold set from the control panel 26 to effectively display the elasticity value of the range to be displayed as opacity 1.0 and the opacity of the other range as 0.0. Only the surface of the range image can be visualized.
- the effective display range is set such that the elasticity value of the region where the opacity of the input luminance is not zero is opacity 1.0, and the opacity of the other region is 0.0. Only the surface of the image can be visualized.
- FIG. 22 is a display example when only the voxel data (luminance data) within the range of the target luminance value is visualized by the processing of the present embodiment.
- a three-dimensional tomographic elasticity image 221 and images 222 to 224 obtained by superimposing tomographic images and elasticity images on an arbitrary cross section of the three-dimensional tomographic elasticity image 221 can be displayed side by side.
- Three-dimensional tomographic elasticity image 221 is a three-dimensional representation of an image obtained by using the above method to three-dimensional the elasticity of the image surface and voxel data (luminance data) in the range of the target elasticity and the target luminance value.
- the image synthesis unit 22 superimposes the obtained image using a method such as ⁇ blending. Compared with the three-dimensional tomographic image 211, coloring by the elastic image is performed, so that it is possible to intuitively discriminate information on hardness.
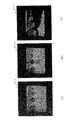
- FIG. 23 is a diagram showing a display example of a three-dimensional tomographic image using the threshold value based on the elasticity value described in the paragraph 0099 above.
- FIGS. 23 (a), (b), and (c) are each a three-dimensional tomographic image 231 when there is no threshold (all displayed), and the threshold is set to an intermediate value (part of soft tissue is not displayed).
- a three-dimensional tomographic image 232 is shown, and a three-dimensional tomographic image 233 is shown when the threshold value is set to a high value (only hard tissue is displayed).
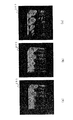
- FIG. 24 is a diagram showing a display example of a three-dimensional elasticity image when the elasticity value in the range to be displayed is changed using a threshold value based on the elasticity value.
- FIGS. 24 (a), (b), and (c) are each a three-dimensional elastic image 241 when there is no threshold value (all are displayed), and the threshold value is an intermediate value (a part of soft tissue is not displayed).
- a three-dimensional elasticity image 242 is shown, and a three-dimensional elasticity image 243 is shown when the threshold value is set to a high value (only hard tissue is displayed).
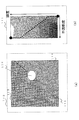
- the threshold value of the elasticity value is reduced. By changing the setting, it is possible to make the cylindrical low-intensity region formed inside the phantom gradually visible.
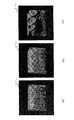
- FIG. 25 is an example of an image obtained by superimposing RGB elements after RGB conversion of the 3D tomographic image and the 3D elastic image shown in FIG. 23 and FIG. 24 using ⁇ blending that adds weights. 25 (a), (b), and (c), respectively, the three-dimensional tomographic elasticity image 251 when there is no threshold (all displayed), and the threshold value is an intermediate value (soft tissue is partially hidden) 3D shows a 3D tomographic elasticity image 252 and a 3D tomographic elasticity image 253 when the threshold value is set to a high value (only hard tissue is displayed).
- the threshold of the elasticity value is similar to that in the three-dimensional tomographic elasticity images 252 and 253.
- the value setting it is possible to make it easier to see the cylindrical low-intensity region formed gradually inside the phantom.
- an image more suitable for diagnosis can be provided to the examiner.
- FIG. 26 and FIG. 27 show image display examples when the threshold value processing based on the elasticity value described in the above paragraph 0099 is used and the offset filter is set based on the luminance.
- the offset is set so as to emphasize a target observation site with a low luminance and suppress a high luminance region beyond that.
- FIG. 26 is a diagram showing a display example of a three-dimensional tomographic image when the threshold value based on the elastic value described in the above paragraph 0099 is used and the offset filter is set based on the luminance.
- FIGS. 26 (a), (b), and (c) are each a three-dimensional tomographic image 261 when there is no threshold (display all), and the threshold is an intermediate value (soft tissue is partially hidden).
- a three-dimensional tomographic image 262 is shown, and a three-dimensional tomographic image 263 is shown when the threshold value is set to a high value (only hard tissue is displayed).
- FIG. 27 shows the RGB elements after RGB conversion of the three-dimensional elasticity image when the three-dimensional tomographic image shown in FIG. 26 is used and the threshold value based on the elasticity value is set and the offset filter is set based on the luminance. This is an example of an image superimposed using ⁇ blending that adds weights.
- 27 (a), (b), and (c) are three-dimensional tomographic images 271 when there is no threshold value (all displayed), and the threshold value is an intermediate value (soft tissue is partially hidden) 3D tomographic elasticity image 272 and threshold value to a high value (only hard tissue is displayed).
- the threshold value of the elasticity value is similar to that in the three-dimensional tomographic elasticity images 272 and 273.
- the value setting it is possible to make it easier to see the cylindrical low-intensity region formed gradually inside the phantom.
- an image more suitable for diagnosis can be provided to the examiner.
- the threshold processing is set so as to display the hard tissue and remove the soft tissue, the hard target observation site is displayed, and a part of the soft peripheral site is removed. As a result, unnecessary portions that cannot be removed by either offset processing or threshold processing are removed from the three-dimensional image, and the target observation portion can be displayed more emphasized than in FIGS. 23 and 25. .
- the present invention can be applied to an ultrasonic image processing apparatus such as a PC that generates a three-dimensional tomographic image offline with respect to three-dimensional tomographic image volume data of a subject generated in advance by an ultrasonic diagnostic apparatus.
- the present invention can also be an ultrasonic image processing program incorporated in a medical image processing apparatus such as a PC.
- an ultrasonic image processing apparatus such as a PC to which the present invention is applied is a three-dimensional tomographic image volume data generated based on reflected echo signals of a plurality of tomographic surfaces of a subject measured by an ultrasonic probe.
- a tomographic volume rendering unit that generates a 3D tomographic image viewed from at least one line of sight on a 2D projection plane based on the 3D tomographic volume data stored in the memory, and 3
- a display unit that displays a dimensional tomographic image.
- An offset calculation unit is provided for increasing or decreasing the luminance value of each voxel in accordance with the luminance value of each voxel of the three-dimensional tomographic image volume data.
- the tomogram volume rendering unit can be configured to generate a three-dimensional tomographic image based on the three-dimensional tomographic volume data in which the luminance value is offset by the offset calculation unit.
- the offset calculation unit when the 3D elastic image volume data generated based on the reflected echo signals of the plurality of tomographic planes of the subject is stored in the memory, the offset calculation unit The luminance value of each corresponding voxel in the three-dimensional tomographic image volume data can be increased or decreased according to the elasticity value of each voxel in the data.
- the examiner saves 3D tomographic volume data of the subject generated by an ultrasonic diagnostic device in an information recording medium such as USB or CD-ROM, and performs ultrasonic image processing such as a PC via an image input unit. Enter into the device.
- 3D tomographic volume data of a subject can be input via a network without using an information recording medium.
- the ultrasonic image processing apparatus increases or decreases the luminance value of each voxel in accordance with the luminance value of each voxel of the three-dimensional tomographic image volume data, and the three-dimensional luminance value is offset.
- a step of generating a 3D tomographic image viewed from at least one line-of-sight direction on the 2D projection plane based on the tomographic image volume data and a step of displaying the generated 3D tomographic image are executed.
- the step of generating three-dimensional elastic image volume data based on the reflected echo signals of a plurality of tomographic planes of the subject is incorporated in the ultrasound image processing program, the step of increasing or decreasing the luminance value of each voxel
- the luminance value of each corresponding voxel of the three-dimensional tomographic image volume data can be increased or decreased according to the elasticity value of each voxel of the elastic image volume data.
- the examiner can adjust the increase / decrease amount of the luminance value of each voxel of the offset calculation unit offline via the input interface of the ultrasonic processing apparatus, only the tissue having a specific luminance value is emphasized. 3D tomographic images can be generated. Therefore, by adjusting the luminance value of a desired specific tissue in an increased amount, adjusting the luminance value of a tissue other than the desired specific tissue in a reduced amount, or by performing both adjustments, the visual recognition of the desired specific tissue is performed. A three-dimensional tomographic image with improved characteristics can be generated.
- the amount of increase (offset amount) of the luminance value corresponding to the vicinity of the luminance value can be increased in advance.
- the luminance value (offset amount) corresponding to the vicinity of the high luminance value when looking at the generated three-dimensional tomographic image, if it is difficult to see the desired specific tissue behind the high-intensity tissue, decrease the luminance value (offset amount) corresponding to the vicinity of the high luminance value. If the size is increased, the high-intensity tissue that has become a wall is less likely to be reflected in the three-dimensional tomographic image, so that the visibility of the desired specific tissue can be improved.
- the examiner pays attention to the elasticity value (the hardness or softness of the tissue) of the desired specific tissue for the increase / decrease amount of the brightness value of each voxel of the offset calculation unit via the input interface of the ultrasonic processing apparatus offline. Therefore, it is possible to generate a three-dimensional tomographic image with improved visibility of a tissue having a specific elasticity value. For example, if the degree of elasticity of a specific tissue desired is grasped, the increase (offset amount) of the luminance value corresponding to the vicinity of the elasticity can be increased in advance. On the other hand, if you want to observe hard (or soft) tissue, you can search for hard (or soft) tissue by increasing the increase (offset amount) of the brightness value corresponding to the high (or low) elasticity value. Can be observed.
Landscapes
- Health & Medical Sciences (AREA)
- Life Sciences & Earth Sciences (AREA)
- Engineering & Computer Science (AREA)
- Physics & Mathematics (AREA)
- Public Health (AREA)
- Medical Informatics (AREA)
- Biomedical Technology (AREA)
- General Health & Medical Sciences (AREA)
- Pathology (AREA)
- Animal Behavior & Ethology (AREA)
- Radiology & Medical Imaging (AREA)
- Molecular Biology (AREA)
- Surgery (AREA)
- Nuclear Medicine, Radiotherapy & Molecular Imaging (AREA)
- Biophysics (AREA)
- Veterinary Medicine (AREA)
- Heart & Thoracic Surgery (AREA)
- Theoretical Computer Science (AREA)
- General Physics & Mathematics (AREA)
- Computer Graphics (AREA)
- Computer Vision & Pattern Recognition (AREA)
- Physiology (AREA)
- Neurology (AREA)
- General Engineering & Computer Science (AREA)
- Computer Hardware Design (AREA)
- Primary Health Care (AREA)
- Epidemiology (AREA)
- Databases & Information Systems (AREA)
- Data Mining & Analysis (AREA)
- Ultra Sonic Daignosis Equipment (AREA)
- Image Generation (AREA)
Abstract
Priority Applications (4)
| Application Number | Priority Date | Filing Date | Title |
|---|---|---|---|
| JP2011518508A JP5730196B2 (ja) | 2009-06-10 | 2010-06-04 | 超音波診断装置、超音波画像処理装置、超音波画像生成方法 |
| EP10786118.9A EP2441389A4 (fr) | 2009-06-10 | 2010-06-04 | Dispositif de diagnostic à ultrasons, dispositif de traitement d'image ultrasonore, programme de traitement d'image ultrasonore et procédé de génération d'image ultrasonore |
| US13/377,384 US8948485B2 (en) | 2009-06-10 | 2010-06-04 | Ultrasonic diagnostic apparatus, ultrasonic image processing apparatus, ultrasonic image processing program, and ultrasonic image generation method |
| CN201080025521.2A CN102458255B (zh) | 2009-06-10 | 2010-06-04 | 超声波诊断装置、超声波图像处理装置、超声波图像处理程序、以及超声波图像生成方法 |
Applications Claiming Priority (2)
| Application Number | Priority Date | Filing Date | Title |
|---|---|---|---|
| JP2009139101 | 2009-06-10 | ||
| JP2009-139101 | 2009-06-10 |
Publications (1)
| Publication Number | Publication Date |
|---|---|
| WO2010143587A1 true WO2010143587A1 (fr) | 2010-12-16 |
Family
ID=43308842
Family Applications (1)
| Application Number | Title | Priority Date | Filing Date |
|---|---|---|---|
| PCT/JP2010/059502 Ceased WO2010143587A1 (fr) | 2009-06-10 | 2010-06-04 | Dispositif de diagnostic à ultrasons, dispositif de traitement d'image ultrasonore, programme de traitement d'image ultrasonore et procédé de génération d'image ultrasonore |
Country Status (5)
| Country | Link |
|---|---|
| US (1) | US8948485B2 (fr) |
| EP (1) | EP2441389A4 (fr) |
| JP (1) | JP5730196B2 (fr) |
| CN (1) | CN102458255B (fr) |
| WO (1) | WO2010143587A1 (fr) |
Cited By (3)
| Publication number | Priority date | Publication date | Assignee | Title |
|---|---|---|---|---|
| WO2014168249A1 (fr) * | 2013-04-12 | 2014-10-16 | 日立アロカメディカル株式会社 | Dispositif de diagnostic par ultrasons et procédé de génération d'image tridimensionnelle ultrasonore |
| JP6765583B1 (ja) * | 2020-02-14 | 2020-10-07 | 三菱電機株式会社 | 画像処理装置、画像処理プログラム及び画像処理方法 |
| JP2023108812A (ja) * | 2022-01-26 | 2023-08-07 | キヤノンメディカルシステムズ株式会社 | 情報処理装置、超音波診断装置、および方法 |
Families Citing this family (22)
| Publication number | Priority date | Publication date | Assignee | Title |
|---|---|---|---|---|
| WO2010143587A1 (fr) * | 2009-06-10 | 2010-12-16 | 株式会社 日立メディコ | Dispositif de diagnostic à ultrasons, dispositif de traitement d'image ultrasonore, programme de traitement d'image ultrasonore et procédé de génération d'image ultrasonore |
| US20120062551A1 (en) * | 2010-09-13 | 2012-03-15 | Lg Electronics Inc. | Image display apparatus and method for operating image display apparatus |
| US9354310B2 (en) | 2011-03-03 | 2016-05-31 | Qualcomm Incorporated | Systems, methods, apparatus, and computer-readable media for source localization using audible sound and ultrasound |
| CN104169739B (zh) | 2011-10-28 | 2017-04-12 | 决策科学国际公司 | 超声成像中的扩频编码波形 |
| WO2014038812A1 (fr) * | 2012-09-06 | 2014-03-13 | Samsung Electronics Co., Ltd. | Procédé et appareil pour afficher des informations stéréoscopiques associées à un plan-coupe ultrasonore d'un objet cible |
| US9128584B2 (en) * | 2013-02-15 | 2015-09-08 | Carl Zeiss X-ray Microscopy, Inc. | Multi energy X-ray microscope data acquisition and image reconstruction system and method |
| KR101851221B1 (ko) * | 2013-07-05 | 2018-04-25 | 삼성전자주식회사 | 초음파 영상 장치 및 그 제어 방법 |
| US9390548B2 (en) * | 2014-06-16 | 2016-07-12 | Sap Se | Three-dimensional volume rendering using an in-memory database |
| KR102270712B1 (ko) * | 2014-11-28 | 2021-06-30 | 삼성메디슨 주식회사 | 볼륨 렌더링 장치 및 볼륨 렌더링 방법 |
| US10743838B2 (en) * | 2015-02-25 | 2020-08-18 | Decision Sciences Medical Company, LLC | Acoustic signal transmission couplants and coupling mediums |
| CN108140257B (zh) | 2015-10-06 | 2022-04-22 | 圣犹达医疗用品心脏病学部门有限公司 | 用于产生电生理图的方法和系统 |
| US10169865B2 (en) | 2015-10-18 | 2019-01-01 | Carl Zeiss X-ray Microscopy, Inc. | Multi energy X-ray microscope data acquisition and image reconstruction system and method |
| WO2017149027A1 (fr) * | 2016-03-01 | 2017-09-08 | Koninklijke Philips N.V. | Mesure ultrasonore automatisée de la clarté nucale |
| DE102017203702A1 (de) * | 2017-03-07 | 2018-09-13 | Siemens Healthcare Gmbh | Verfahren und Vorrichtung zum Erzeugen eines Ausgabebildes aus einem Volumendatensatz |
| US10708270B2 (en) | 2018-06-12 | 2020-07-07 | Sap Se | Mediated authentication and authorization for service consumption and billing |
| TWI769435B (zh) * | 2020-02-14 | 2022-07-01 | 佳世達科技股份有限公司 | 可改善超音波影像品質之方法和相關超音波探測系統 |
| CN115397336A (zh) * | 2020-03-31 | 2022-11-25 | 泰尔茂株式会社 | 图像处理装置、图像处理系统、图像显示方法及图像处理程序 |
| JP7613995B2 (ja) * | 2021-04-13 | 2025-01-15 | キヤノンメディカルシステムズ株式会社 | 超音波診断装置、画像処理装置、およびプログラム |
| JP2022178316A (ja) * | 2021-05-20 | 2022-12-02 | コニカミノルタ株式会社 | 超音波診断装置及びプログラム |
| EP4360564A4 (fr) * | 2021-06-24 | 2024-11-27 | FUJIFILM Corporation | Dispositif de diagnostic ultrasonore et procédé de commande de dispositif de diagnostic ultrasonore |
| KR102684318B1 (ko) * | 2022-02-28 | 2024-07-12 | 메디컬아이피 주식회사 | 반투명 영상을 표시하는 방법 및 그 장치 |
| CN116509455B (zh) * | 2023-05-11 | 2025-09-09 | 上海博动医疗科技股份有限公司 | 血管超声图像处理方法、装置、设备和介质 |
Citations (3)
| Publication number | Priority date | Publication date | Assignee | Title |
|---|---|---|---|---|
| JP2006288495A (ja) * | 2005-04-06 | 2006-10-26 | Toshiba Corp | 画像処理装置 |
| JP2007054504A (ja) * | 2005-08-26 | 2007-03-08 | Hitachi Medical Corp | 超音波診断装置 |
| JP2008259605A (ja) * | 2007-04-11 | 2008-10-30 | Hitachi Medical Corp | 超音波診断装置 |
Family Cites Families (20)
| Publication number | Priority date | Publication date | Assignee | Title |
|---|---|---|---|---|
| JP4421016B2 (ja) * | 1999-07-01 | 2010-02-24 | 東芝医用システムエンジニアリング株式会社 | 医用画像処理装置 |
| JP4907798B2 (ja) * | 2001-08-24 | 2012-04-04 | 株式会社東芝 | 超音波診断装置 |
| US20050207630A1 (en) * | 2002-02-15 | 2005-09-22 | The Regents Of The University Of Michigan Technology Management Office | Lung nodule detection and classification |
| US6658080B1 (en) * | 2002-08-05 | 2003-12-02 | Voxar Limited | Displaying image data using automatic presets |
| WO2007010537A2 (fr) * | 2005-07-19 | 2007-01-25 | Spectrum Dynamics Llc | Stabiliseur de reconstruction et vision active |
| JP4299189B2 (ja) * | 2004-05-27 | 2009-07-22 | アロカ株式会社 | 超音波診断装置及び画像処理方法 |
| US9060737B2 (en) * | 2005-05-09 | 2015-06-23 | Hitachi Medical Corporation | Ultrasonic diagnostic apparatus and ultrasonic image display method |
| EP1935344B1 (fr) * | 2005-10-07 | 2013-03-13 | Hitachi Medical Corporation | Procede d'affichage d'image et système de diagnostic d'image médicale |
| EP1938754A4 (fr) * | 2005-10-19 | 2011-01-05 | Hitachi Medical Corp | Echographe destine a creer une image elastique |
| JP4945273B2 (ja) * | 2006-04-24 | 2012-06-06 | 株式会社東芝 | 超音波診断装置、及び超音波診断装置の制御プログラム |
| US8041129B2 (en) * | 2006-05-16 | 2011-10-18 | Sectra Ab | Image data set compression based on viewing parameters for storing medical image data from multidimensional data sets, related systems, methods and computer products |
| JP4859648B2 (ja) | 2006-12-11 | 2012-01-25 | 株式会社日立メディコ | 超音波診断装置及びプログラム |
| JP4907382B2 (ja) | 2007-02-23 | 2012-03-28 | ジーイー・メディカル・システムズ・グローバル・テクノロジー・カンパニー・エルエルシー | 超音波画像表示方法および超音波診断装置 |
| US8213696B2 (en) * | 2007-07-12 | 2012-07-03 | Siemens Medical Solutions Usa, Inc. | Tissue detection method for computer aided diagnosis and visualization in the presence of tagging |
| US7630533B2 (en) * | 2007-09-20 | 2009-12-08 | Hologic, Inc. | Breast tomosynthesis with display of highlighted suspected calcifications |
| JP5304986B2 (ja) * | 2008-03-31 | 2013-10-02 | 株式会社日立メディコ | 超音波診断装置 |
| US20110224549A1 (en) * | 2008-11-14 | 2011-09-15 | Hitachi Medical Corporation | Ultrasonic diagnostic apparatus and method for generating ultrasonic images |
| US20110218440A1 (en) * | 2008-11-14 | 2011-09-08 | Hitachi Medical Corporation | Ultrasonic diagnostic apparatus and signal processing method in ultrasonic diagnostic apparatus |
| WO2010143587A1 (fr) * | 2009-06-10 | 2010-12-16 | 株式会社 日立メディコ | Dispositif de diagnostic à ultrasons, dispositif de traitement d'image ultrasonore, programme de traitement d'image ultrasonore et procédé de génération d'image ultrasonore |
| CN102711625B (zh) * | 2010-01-18 | 2015-03-25 | 株式会社日立医疗器械 | 超声波诊断装置以及超声波图像显示方法 |
-
2010
- 2010-06-04 WO PCT/JP2010/059502 patent/WO2010143587A1/fr not_active Ceased
- 2010-06-04 EP EP10786118.9A patent/EP2441389A4/fr not_active Withdrawn
- 2010-06-04 US US13/377,384 patent/US8948485B2/en active Active
- 2010-06-04 JP JP2011518508A patent/JP5730196B2/ja active Active
- 2010-06-04 CN CN201080025521.2A patent/CN102458255B/zh active Active
Patent Citations (3)
| Publication number | Priority date | Publication date | Assignee | Title |
|---|---|---|---|---|
| JP2006288495A (ja) * | 2005-04-06 | 2006-10-26 | Toshiba Corp | 画像処理装置 |
| JP2007054504A (ja) * | 2005-08-26 | 2007-03-08 | Hitachi Medical Corp | 超音波診断装置 |
| JP2008259605A (ja) * | 2007-04-11 | 2008-10-30 | Hitachi Medical Corp | 超音波診断装置 |
Non-Patent Citations (1)
| Title |
|---|
| See also references of EP2441389A4 * |
Cited By (11)
| Publication number | Priority date | Publication date | Assignee | Title |
|---|---|---|---|---|
| WO2014168249A1 (fr) * | 2013-04-12 | 2014-10-16 | 日立アロカメディカル株式会社 | Dispositif de diagnostic par ultrasons et procédé de génération d'image tridimensionnelle ultrasonore |
| CN105073017A (zh) * | 2013-04-12 | 2015-11-18 | 日立阿洛卡医疗株式会社 | 超声波诊断装置以及超声波三维图像生成方法 |
| JPWO2014168249A1 (ja) * | 2013-04-12 | 2017-02-16 | 株式会社日立製作所 | 超音波診断装置及び超音波三次元画像作成方法 |
| US11134921B2 (en) | 2013-04-12 | 2021-10-05 | Hitachi, Ltd. | Ultrasonic diagnostic device and ultrasonic three-dimensional image generation method |
| JP6765583B1 (ja) * | 2020-02-14 | 2020-10-07 | 三菱電機株式会社 | 画像処理装置、画像処理プログラム及び画像処理方法 |
| WO2021161535A1 (fr) * | 2020-02-14 | 2021-08-19 | 三菱電機株式会社 | Dispositif, programme et procédé de traitement d'image |
| GB2605539A (en) * | 2020-02-14 | 2022-10-05 | Mitsubishi Electric Corp | Imaging processing apparatus, image processing program and image processing method |
| GB2605539B (en) * | 2020-02-14 | 2023-05-17 | Mitsubishi Electric Corp | Imaging processing apparatus, image processing program, and image processing method |
| US11880929B2 (en) | 2020-02-14 | 2024-01-23 | Mitsubishi Electric Corporation | Image processing apparatus, computer readable medium, and image processing method |
| JP2023108812A (ja) * | 2022-01-26 | 2023-08-07 | キヤノンメディカルシステムズ株式会社 | 情報処理装置、超音波診断装置、および方法 |
| JP7770196B2 (ja) | 2022-01-26 | 2025-11-14 | キヤノンメディカルシステムズ株式会社 | 情報処理装置、超音波診断装置、および方法 |
Also Published As
| Publication number | Publication date |
|---|---|
| JP5730196B2 (ja) | 2015-06-03 |
| EP2441389A1 (fr) | 2012-04-18 |
| CN102458255B (zh) | 2015-04-01 |
| US20120087564A1 (en) | 2012-04-12 |
| EP2441389A4 (fr) | 2017-03-01 |
| US8948485B2 (en) | 2015-02-03 |
| JPWO2010143587A1 (ja) | 2012-11-22 |
| CN102458255A (zh) | 2012-05-16 |
Similar Documents
| Publication | Publication Date | Title |
|---|---|---|
| JP5730196B2 (ja) | 超音波診断装置、超音波画像処理装置、超音波画像生成方法 | |
| JP5770189B2 (ja) | 超音波診断装置 | |
| JP5689073B2 (ja) | 超音波診断装置、及び3次元弾性比算出方法 | |
| JP4455003B2 (ja) | 超音波診断装置 | |
| KR101121301B1 (ko) | 3차원 측정을 수행하는 초음파 시스템 및 방법 | |
| JP5647990B2 (ja) | 超音波診断装置及び画像構成方法 | |
| CN103124523B (zh) | 超声波诊断装置、超声波图像显示方法 | |
| US9514564B2 (en) | Ultrasonic diagnostic apparatus and ultrasonic image display method | |
| KR101100464B1 (ko) | 부 관심영역에 기초하여 3차원 초음파 영상을 제공하는 초음파 시스템 및 방법 | |
| WO2014168249A1 (fr) | Dispositif de diagnostic par ultrasons et procédé de génération d'image tridimensionnelle ultrasonore | |
| JP2012005593A (ja) | 三次元超音波画像を生成表示する超音波診断装置 | |
| WO2011086774A1 (fr) | Dispositif de diagnostic ultrasonore et procédé d'affichage d'image ultrasonore | |
| CN103118600B (zh) | 超声波诊断装置以及超声波图像的显示方法 | |
| JP5473527B2 (ja) | 超音波診断装置 | |
| KR101107478B1 (ko) | 다수의 3차원 초음파 영상을 형성하는 초음파 시스템 및 방법 | |
| JP5996268B2 (ja) | 超音波診断装置、画像処理装置、及びプログラム | |
| JP2011240131A (ja) | スライス映像および付加情報を提供する超音波システムおよび方法 | |
| JP5623609B2 (ja) | 超音波診断装置 |
Legal Events
| Date | Code | Title | Description |
|---|---|---|---|
| WWE | Wipo information: entry into national phase |
Ref document number: 201080025521.2 Country of ref document: CN |
|
| 121 | Ep: the epo has been informed by wipo that ep was designated in this application |
Ref document number: 10786118 Country of ref document: EP Kind code of ref document: A1 |
|
| WWE | Wipo information: entry into national phase |
Ref document number: 2011518508 Country of ref document: JP |
|
| WWE | Wipo information: entry into national phase |
Ref document number: 13377384 Country of ref document: US |
|
| NENP | Non-entry into the national phase |
Ref country code: DE |
|
| WWE | Wipo information: entry into national phase |
Ref document number: 2010786118 Country of ref document: EP |