WO2011132525A1 - 自動分析装置及び自動分析方法 - Google Patents
自動分析装置及び自動分析方法 Download PDFInfo
- Publication number
- WO2011132525A1 WO2011132525A1 PCT/JP2011/058595 JP2011058595W WO2011132525A1 WO 2011132525 A1 WO2011132525 A1 WO 2011132525A1 JP 2011058595 W JP2011058595 W JP 2011058595W WO 2011132525 A1 WO2011132525 A1 WO 2011132525A1
- Authority
- WO
- WIPO (PCT)
- Prior art keywords
- straight line
- time
- approximate expression
- automatic analyzer
- value
- Prior art date
- Legal status (The legal status is an assumption and is not a legal conclusion. Google has not performed a legal analysis and makes no representation as to the accuracy of the status listed.)
- Ceased
Links
Images


Classifications
-
- G—PHYSICS
- G01—MEASURING; TESTING
- G01N—INVESTIGATING OR ANALYSING MATERIALS BY DETERMINING THEIR CHEMICAL OR PHYSICAL PROPERTIES
- G01N21/00—Investigating or analysing materials by the use of optical means, i.e. using sub-millimetre waves, infrared, visible or ultraviolet light
- G01N21/17—Systems in which incident light is modified in accordance with the properties of the material investigated
- G01N21/25—Colour; Spectral properties, i.e. comparison of effect of material on the light at two or more different wavelengths or wavelength bands
- G01N21/27—Colour; Spectral properties, i.e. comparison of effect of material on the light at two or more different wavelengths or wavelength bands using photo-electric detection ; circuits for computing concentration
- G01N21/272—Colour; Spectral properties, i.e. comparison of effect of material on the light at two or more different wavelengths or wavelength bands using photo-electric detection ; circuits for computing concentration for following a reaction, e.g. for determining photometrically a reaction rate (photometric cinetic analysis)
-
- G—PHYSICS
- G01—MEASURING; TESTING
- G01N—INVESTIGATING OR ANALYSING MATERIALS BY DETERMINING THEIR CHEMICAL OR PHYSICAL PROPERTIES
- G01N21/00—Investigating or analysing materials by the use of optical means, i.e. using sub-millimetre waves, infrared, visible or ultraviolet light
- G01N21/75—Systems in which material is subjected to a chemical reaction, the progress or the result of the reaction being investigated
- G01N21/77—Systems in which material is subjected to a chemical reaction, the progress or the result of the reaction being investigated by observing the effect on a chemical indicator
- G01N21/78—Systems in which material is subjected to a chemical reaction, the progress or the result of the reaction being investigated by observing the effect on a chemical indicator producing a change of colour
-
- G—PHYSICS
- G01—MEASURING; TESTING
- G01N—INVESTIGATING OR ANALYSING MATERIALS BY DETERMINING THEIR CHEMICAL OR PHYSICAL PROPERTIES
- G01N35/00—Automatic analysis not limited to methods or materials provided for in any single one of groups G01N1/00 - G01N33/00; Handling materials therefor
- G01N35/00584—Control arrangements for automatic analysers
-
- G—PHYSICS
- G01—MEASURING; TESTING
- G01N—INVESTIGATING OR ANALYSING MATERIALS BY DETERMINING THEIR CHEMICAL OR PHYSICAL PROPERTIES
- G01N35/00—Automatic analysis not limited to methods or materials provided for in any single one of groups G01N1/00 - G01N33/00; Handling materials therefor
- G01N2035/00465—Separating and mixing arrangements
-
- G—PHYSICS
- G01—MEASURING; TESTING
- G01N—INVESTIGATING OR ANALYSING MATERIALS BY DETERMINING THEIR CHEMICAL OR PHYSICAL PROPERTIES
- G01N35/00—Automatic analysis not limited to methods or materials provided for in any single one of groups G01N1/00 - G01N33/00; Handling materials therefor
- G01N35/00584—Control arrangements for automatic analysers
- G01N35/00594—Quality control, including calibration or testing of components of the analyser
- G01N35/00693—Calibration
Definitions
- the present invention relates to an automatic analyzer and method for qualitative or quantitative analysis of blood, urine and other biological samples, for example, an automatic analyzer and method having a function of monitoring a reaction during a clinical test.
- An automated analyzer for clinical testing measures the absorbance of the reaction solution over a certain period of time after a certain amount of sample and reagent are dispensed and reacted, and based on the measurement result, the test value (concentration and activity value) ) Etc.
- the rate method which is one of the measurement methods for clinical tests, is mainly used for measuring the activity value of enzyme components contained in a sample.
- a certain amount of a substrate is added as a reagent, and an element that changes due to the consumption of the substrate by the enzyme is measured.
- the reagent contains a sufficient amount of substrate. For this reason, if the reaction between the sample and the reagent is normally performed, the absorbance of the reaction generally changes linearly by a certain amount with respect to the time change.
- the activity value of the substance to be measured is obtained from the slope (reaction rate) of this straight line.
- the reaction may proceed quickly.
- a sufficient amount of the reagent substrate may not be obtained during the measurement, and the reaction rate in the latter half may not be constant. That is, the reaction rate in the latter half may change non-linearly (curve).
- Patent Documents 1 and 2 There are methods disclosed in Patent Documents 1 and 2 as methods for determining a time range (straight line range) used for conversion of inspection values.
- an absorbance difference between two adjacent photometric points is calculated, and a photometric point showing the largest absorbance difference (dmax) among them is determined as a reference point, and the measurement range before and after that is determined.
- a method is disclosed in which an interval in which the difference in absorbance is 80% or more of the absorbance difference (dmax) at the reference point is determined as a linear range.
- the range width used for conversion is set to be constant, and the correlation coefficient of the absorbance corresponding to each range is calculated by the least squares calculation method while shifting from the first metering point by one point.
- a method for determining a range having a good correlation as a linear range is shown.
- reaction process data is approximated using the approximate expression shown in (Equation 1), and regarding the rate method, between two predetermined points or a predetermined point after differentiating the approximate expression with time, A method for determining the slope of a straight line is shown.
- Equation 1 t represents time
- y represents absorbance
- A, B, and K are parameters.
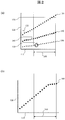
- the horizontal axis 110 shows the passage of time
- the vertical axis 120 shows the absorbance.
- the conventional apparatus defines a time range (linear range) for each inspection item. That is, the straight line start time and straight line end time are determined in advance.
- a range 160 in the figure indicates a predetermined time range for a certain inspection item.
- reference numerals 130, 140, and 150 in FIG. 2 indicate absorbance data of different specimens of the same item, and ranges 135, 145, and 155 indicate lag time portions of the respective absorbance data.
- Reference numeral 170 indicates a predetermined limit value of absorbance.
- the original straight line portion (original inspection object) may be included in the predetermined time range 160, while the lag time is indicated by the absorbance data indicated by reference numeral 150.
- a part of the part 155 may be included in the predetermined time range 160.
- the linearity check function of the conventional apparatus determines that there is an abnormality in the reaction process data, and the specimen is subjected to retesting.
- reexamination is not necessary as long as the straight line portion can be accurately determined.
- an abnormality is detected in the linearity check (the lag time portion 155 is included in the measurement period of the linear range. May not be detected, and the slope of the straight line may be calculated while the information on the curved portion is included. In this case, since the inclination of the straight line is not accurately calculated, there is a possibility that the error of the inspection value becomes large.
- the measurement result shows a straight line within a predetermined range 160.
- the absorbance data indicated by reference numeral 130 exceeds the limit value of absorbance in the latter half of the range 160.
- the sample of the absorbance data indicated by reference numeral 130 is also subject to reexamination.
- the data after the absorbance limit value can be used for test value conversion. Inspection can be reduced.
- the photometric point indicating the greatest absorbance difference is the time indicated by circles in the figure. However, this point is the boundary between the lag time portion 155 and the straight line portion.
- the period before and after is determined as a linear range with reference to a photometric point surrounded by a circle. This means that the lag time portion 155 that is not the original linear portion is used for the conversion of the inspection value. That is, there is a possibility that the error of the inspection value becomes large.
- the present invention provides an automatic analyzer that mixes a sample and a reagent and measures a change in the mixture over time.
- A Measurement point data acquisition that acquires a plurality of measurement point data from a reaction process of a sample and a reagent. Unit, (b) a data processing unit for processing the measurement point data, (c) a storage unit storing the first approximate expression used in the data processing unit, and (d) a processing result of the data processing unit is output.
- a device having an output unit is proposed.
- the data processing unit a straight line of the reaction process based on the process of approximating the first approximate expression stored in the storage unit to a plurality of measurement point data and the second approximate expression obtained as a result of the approximate process. And processing for determining the range.
- the data processing unit calculates a second approximate expression using a plurality of measurement point data acquired up to a predetermined time, and estimates or predicts a linear range of the reaction process based on the second approximate expression. It is desirable to have a function.
- the present invention relates to an automatic analysis method for measuring a time-dependent change of a mixed solution in which a sample and a reagent are mixed using an automatic analyzer, wherein (a) a plurality of automatic analyzers are included in a reaction process between a sample and a reagent. (B) A process in which the automatic analysis device approximates the first approximate expression read from the storage unit to a plurality of measurement point data, and (c) A process in which the automatic analysis device performs an approximation process. And a process for determining the linear range of the reaction process based on the second approximate expression obtained as a result of the above. After all, it has a process of calculating a second approximate expression using a plurality of measurement point data acquired by a predetermined time and estimating or predicting a linear range of the reaction process based on the second approximate expression. desirable.
- the present invention preferably has a function of calculating the accuracy index of the linear range and outputting the result as a processing result to the output unit.
- the present invention it is possible to determine the linear range used for the test value conversion for each specimen. As a result, an accurate test value can be obtained for each specimen. In addition, the number of samples to be retested can be reduced as compared with the conventional apparatus. Furthermore, when calculating the second approximate expression using a plurality of measurement point data acquired by a predetermined time and estimating the linear range of the reaction process based on the second approximate expression, The time required for the decision can be shortened. In addition, in the case of having a function of outputting the accuracy index of the linear range, it is possible to guarantee the accuracy of the inspection value and the predicted value.
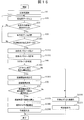
- FIG 3 is a process flowchart according to the first embodiment.
- the processing flowchart which determines the curve part of the reaction late stage.
- the present invention includes an invention in which a known technique is combined with an apparatus configuration and processing operation described later, and an invention in which a part of the apparatus configuration and processing operation described later is replaced with a known technique.
- FIG. 3 shows a schematic configuration of a biochemical automatic analyzer that implements the analysis function according to the present invention.
- the biochemical automatic analyzer includes a sample disk 1, a reagent disk 2, a reaction disk 3, a reaction tank 4, a sampling mechanism 5, a pipetting mechanism 6, a stirring mechanism 7, a photometric mechanism 8, a cleaning mechanism 9, a computer (PC) 10, Storage device 12, control unit 13, piezoelectric element driver 14, stirring mechanism controller 15, sample container 16, circular disks 17 and 19, reagent bottle 18, cool box 20, reaction container 21, reaction container holder 22, drive mechanism 23, probe 24, 27, bearing shafts 25, 28, arms 26, 29, fixing portion 31, nozzle 33, and vertical drive mechanism 34.
- the storage device 12 stores analysis parameters, the number of times each reagent bottle can be analyzed, the maximum number of times that analysis can be performed, a calibration result, an analysis result, and the like.
- Sample analysis in the biochemical automatic analyzer is performed in the order of data processing such as sampling, reagent dispensing, stirring, photometry, reaction vessel cleaning, concentration conversion, and the like.
- the sample disk 1 is controlled by the control unit 13 via the computer 10.
- a plurality of sample containers 16 are arranged side by side on the circumference.
- the sample container 16 is moved under the sampling probe 24 according to the analysis order.
- the sample in the sample container 16 is dispensed into the reaction container 21 by a predetermined amount by a sample pump connected to the sample sampling mechanism 5.
- the reaction vessel 21 into which the sample has been dispensed is moved through the reaction vessel 4 to the position where the first reagent is added.
- a predetermined amount of reagent sucked from the reagent container 18 by a reagent pump (not shown) connected to the reagent dispensing probe 27 is added to the moved reaction container 16.
- the reaction vessel 21 is moved to the position of the stirring mechanism 7 and initial stirring is performed. Such addition and stirring of the reagent are performed for the first to fourth reagents, for example.
- the reaction vessel 21 in which the contents are agitated is placed in a light beam emitted from a light source. A part of the light beam passes through the reaction vessel 21 and a part is absorbed by the contents.
- the degree of absorption is detected by, for example, a photometric mechanism 8 configured with a multiwavelength photometer.
- the photometric mechanism 8 outputs the degree of absorption relating to the specimen detected over time to the control unit 13 as measurement point data (absorbance signal).
- the control unit 13 determines the linear range of the measurement point data through data processing to be described later, and then calculates the test value (inclination of the linear range) of the specimen.
- the calculated inspection value (data) is stored in the storage device 12 and displayed on a display device attached to the computer 10. After completion of photometry, the reaction vessel 21 is transported to the position of the cleaning mechanism 9 and used for the next analysis after cleaning.
- FIG. 1 shows the processing procedure.
- FIG. 1 shows only the part related to the straight line range determination program executed in the control unit 13.
- FIG. 4 shows functional blocks of the control unit 13 realized through a linear range determination program.
- FIG. 4 shows the determination program from the viewpoint of hardware.
- the control unit 13 shown in FIG. 4 includes an absorbance data acquisition unit 410, an approximate expression parameter calculation unit 420, a lag time unit determination unit 425, a second half curve unit determination unit 435, a linear range absorbance data number determination unit 440, and a test value calculation unit. 445, and a data bus 450 that connects them to each other. Each unit can exchange data with each other through the data bus 450.
- the functional blocks constituting the control unit 13 may be configured by hardware other than the control unit 13 or a CPU. Of course, the functional blocks constituting the control unit 13 may be implemented as software modules in the same CPU.
- step S5 measurement of a certain test item is started for a certain sample. Simultaneously with the start of measurement, in step S5, the approximate expression parameter calculation unit 420 selects an approximate expression (first approximate expression) suitable for determining the linear range. It is assumed that a plurality of approximate expressions representing changes in absorbance as selection targets are stored in the storage device 12 in advance. The approximate expression parameter calculation unit 420 selectively reads out an optimum approximate expression corresponding to the combination of the test item and the reagent from the plurality of approximate expressions.
- the functions shown in (Expression 2) to (Expression 5) are approximate expressions that can be selected.
- t represents time and x represents absorbance.
- a, b, c, d, e, k, p, q, r, u, v, and w are parameters.
- the selection of the approximate expression by the approximate expression parameter calculation unit 420 may employ a method that is automatically executed based on the combination of the test item and the reagent, or a method that is freely selected by the user. Also good.
- an approximate expression most suitable for each combination of the test item and the reagent may be stored in the storage device 12 as a table.
- the approximate expression parameter calculation unit 420 searches the table by a combination of the test item and the reagent, and selects an optimal approximate expression corresponding to the combination.
- FIG. 5 shows an example of this type of table.
- the table 500 is composed of columns 510, 520 and 530.
- the column 510 describes the test item
- the column 520 describes the type of reagent
- the column 530 describes the optimum approximate expression type associated with the test item and the type of reagent.
- the approximate expression parameter calculation unit 420 searches the table 500 based on the combination of the test item and the reagent, and selects an approximate expression optimal for determining the linear range.
- the contents of the correspondence relationship stored in the table 500 may be configured to be changeable by the user.
- the absorbance data acquisition unit 410 inputs absorbance data of one measurement or a plurality of measurement averages from the photometric mechanism 8. That is, the absorbance data is input to the control unit 13.
- the dominant wavelength In a measurement method that uses two-wavelength light of a wavelength (primary wavelength) where the absorbance largely changes due to a change in color tone due to the reaction between the reagent and the specimen, and a wavelength (subwavelength) light whose absorbance hardly changes, the dominant wavelength The difference between the light absorbance and the sub-wavelength light absorbance is input as absorbance data.
- step S15 the absorbance data acquisition unit 410 determines whether the main reaction reagent has been added. When it is determined that the main reaction reagent has not been added, the processing process returns to step S10, and the next absorbance data is input. The above determination operation is repeatedly performed until the addition of the main reaction reagent is determined.
- the main reaction reagent refers to a reagent (usually the final reagent) that causes a main change in absorbance in a reaction using a plurality of reagents.
- the processing process moves to step S20.
- step S20 the absorbance data acquisition unit 410 stores the input absorbance data in the storage device 12.
- step S25 the absorbance data acquisition unit 410 determines whether or not the last absorbance data has been stored. In other words, in this embodiment, it is necessary that all absorbance data corresponding to a predetermined reaction period be stored in the storage device 12 before the linear range is determined.
- the processing process returns to step S10. This loop operation (input and storage of absorbance data) is repeated until the necessary number of data is stored in the storage device 12. If accumulation of the necessary number of data is determined by the absorbance data acquisition unit 410, the processing process proceeds to step S30.
- the approximate expression parameter calculation unit is configured so that the difference between the change in absorbance represented by the approximate expression (first approximate expression) selected in step S5 and the actual change in absorbance over time is as small as possible.
- 420 calculates the value of the parameter in the equation. Specifically, the parameter value in the equation is calculated so that the square error between the absorbance data stored as the measurement result and the absorbance data at the corresponding time calculated by the approximate equation is as small as possible.
- the parameter value becomes “ Limit asymptotic to 0 (zero) ".
- the initial value of the parameter is set so that the approximate expression is fitted to the absorbance data at the initial stage of the reaction.
- the existing least square calculation method can be used to calculate the parameter value.
- the approximate expression after optimizing the parameter value of each term according to the measurement result (absorbance data) is referred to as a second approximate expression, and is selected according to the combination of the test item and the reagent. It is distinguished from the approximate expression.
- step S30 the approximate expression parameter calculation unit 420 calculates the difference (error) between the absorbance (approximate value) calculated by the second approximate expression and the actually measured absorbance (actual value) at each time. calculate.
- step S35 the approximate expression parameter calculation unit 420 stores the parameter value defining the second approximate expression and the difference (error) between the approximate value calculated for each time and the actual measurement value in the storage device 12.
- the lag time part determination unit 425 calculates a lag time part where the absorbance at the initial stage of the reaction changes in a curve based on the second approximate expression.
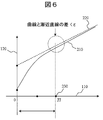
- FIG. 6 illustrates a method for determining the lag time portion.
- the horizontal axis 110 represents the elapsed time from the start of the reaction
- the vertical axis 120 represents the absorbance.
- a curve 210 shows an approximate curve of the absorbance change obtained by the second approximate expression.
- the straight line 220 is a straight line that the curve 210 asymptotically approaches.
- a point 230 on the horizontal axis 110 indicates a time (Tl) when the curve 210 is sufficiently asymptotic to the straight line 220, and a range from 0 to Tl on the horizontal axis 110 corresponds to a lag time portion. Since the end time of the lag time portion corresponds to the straight line start time, the time corresponding to the point 230 is the straight line start time.
- the sufficiently asymptotic time is defined as a time at which, for example, a minute value ⁇ is determined in advance and the difference between the curve 210 and the straight line 220 becomes equal to or less than ⁇ .
- ⁇ may be a constant value, or may be set according to the initial absorbance or the change width of the absorbance.
- a value obtained by multiplying the initial absorbance by a constant or a value obtained by multiplying the difference between the initial absorbance and the final absorbance by a constant may be ⁇ .
- the time asymptotically approached may be defined as a time when a small value ⁇ is determined and the difference between the slopes of the curve 210 and the straight line 220 becomes ⁇ or less.
- ⁇ may be a constant value or may be set according to the slope of the straight line 220.
- ⁇ may be a value obtained by multiplying the slope of the straight line 220 by a constant.
- step S45 the lag time part determination unit 425 stores the calculated time in the storage device 12 as the straight line start time.
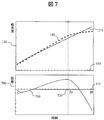
- the second half curve portion determination unit 435 determines a curve portion appearing in the second half of the reaction process data (hereinafter referred to as “second half curve portion”). A method for determining the second half curve portion will be described with reference to FIGS.
- the horizontal axis 110 in the upper diagram represents the elapsed time from the start of the reaction
- the vertical axis 120 represents the absorbance.
- a curve 210 is an approximate curve of absorbance change obtained by the second approximate expression.
- Symbol 180 indicates the absorbance data of the specimen.
- the horizontal axis 110 in the lower part of FIG. 7 indicates the elapsed time from the start of the reaction
- the vertical axis 700 indicates the error.
- the error here is given as a difference value between the actually measured value and the approximate value.
- a curve 710 shows a time change of a value obtained by subtracting an approximate value from an actual measurement value.
- the obtained error is a value obtained by subtracting an actual measurement value from an approximate value.
- step S800 the second half curve portion determination unit 435 reads the error stored in the storage device 12, and determines whether the error is within a predetermined allowable range. It is assumed that the allowable range used for the determination is stored in the storage device 12 in advance.
- step S810 the second half curve portion determination unit 435 determines that there is no curve portion in the second half portion of the reaction process data. In this case, the straight line end time becomes the reaction end time. If it is determined in step S800 that the error is outside the allowable range, the second half curve portion determination unit 435 proceeds to step S820.
- step S820 the second half curve portion determination unit 435 monitors the time change of the error as shown in the lower diagram of FIG. 7, and detects a time 720 (denoted as Te) at which the error has a maximum value.
- the second half curve portion determination unit 435 determines whether or not the distribution of errors after the time 720 is monotonously decreased. Whether or not monotonously decreases can be determined, for example, based on whether or not the sign of the difference between adjacent time errors is constant. When monotonous decrease is indicated, it indicates that there is a curved portion in the latter half as shown in the upper diagram of FIG. Accordingly, the second half curve portion determination unit 435 proceeds to step S840 and determines that there is a curve portion in the second half of the reaction process data. In this case, the straight line end time is the curve start time. That is, the time is 720 in FIG.
- step S830 When it is determined in step S830 that the monotonic decrease does not occur, the second half curve portion determination unit 435 proceeds to step S850 and outputs a signal indicating “abnormal” of measurement.
- a method of outputting a signal indicating “abnormal” a method of sounding an alarm, a method of displaying on a display device attached to the computer 10 in FIG.
- step S55 the second half curve portion determination unit 435 proceeds to step S60.
- step S ⁇ b> 60 the second half curve portion determination unit 435 stores the straight line end time obtained as the determination result in the storage device 12.
- step S70 the absorbance data number determination unit 440 in the straight line range determines a straight line range from the straight line start time and the straight line end time stored in the storage device 12.
- the absorbance data number determination unit 440 in the linear range determines whether the number of absorbance data appearing in the linear range is equal to or greater than a predetermined threshold.
- formula is represented by a linear formula as shown, for example in (Formula 6).
- the range of the number of absorbance data necessary when calculating the slope of the straight line using (Equation 6) is two or more.
- t represents time
- x represents absorbance
- a and b represent parameters.
- step S75 when it is determined that the number of absorbance data within the linear range is smaller than the threshold value, the absorbance data number determination unit 440 within the linear range proceeds to step S90, and the measurement is “abnormal”. judge.
- a method of outputting a signal indicating “abnormal”, a method of sounding an alarm a method of displaying on a display device attached to the computer 10 in FIG.
- step S75 when it is determined that the number of absorbance data within the linear range is equal to or greater than the threshold value, the absorbance data number determination unit 440 within the linear range advances the process to step S80.
- step S80 the test value calculation unit 445 calculates a linear equation that approximates the absorbance data within the linear range, and calculates a slope used for test value conversion from the linear equation.
- the test value calculation unit 445 calculates a straight line given by (Equation 6) approximating the absorbance data within the linear range. That is, the slope of the straight line is calculated. Further, the inspection value calculation unit 445 can also calculate an inspection value based on the calibration curve from the slope. Calibration curve data is stored in the storage device 12 in advance. The linear range in which the linear equation is calculated, the linear equation parameter, and the calculated inspection value are stored in the storage device 12.
- the inspection value calculation unit 445 outputs the calculated inspection value.
- a method for outputting the inspection value it is conceivable to display it on a display device attached to the computer 10 in FIG.
- a display example is shown in FIG.
- the measurement result display screen shown in FIG. 9 includes columns 900 to 960.
- the column 900 describes the specimen ID, and the column 910 describes the test value.
- Column 905 describes the approximate expression (first approximate expression) used to determine the linear range.
- a column 920 describes the start time (straight line disclosure time) of the straight line range used for conversion of the inspection value.
- a column 930 describes the end time (straight line end time) of the straight line range used for conversion of the inspection value.
- a column 940 describes the number of absorbance data appearing in the linear range used for the test value conversion.
- Columns 950 and 960 describe accuracy indices when test values are calculated based on the linear range used for test value conversion and the number of absorbance data.
- a CV value is used as the accuracy index.
- the CV value may be determined in advance by performing an experiment using a sample whose test value is clear, such as a sample for calibration. In the experiment, CV values (values indicating variations such as dispersion and standard deviation) may be calculated for various combinations of line start time and line end time (absorbance data number).
- an average value and variation variation (variance, standard deviation, etc.) of the number of absorbance data are used.
- the average value and variation of the number of absorbance data may be calculated for each item from the results of the most recent measurement of general (patient) samples and calibration samples. Note that the sample, the number of samples, and the period used for the calculation may be freely selected by the user. Usually, the greater the number of absorbance data within the linear range, the higher the reliability of the detected value.
- the processing of FIG. 1 can be executed as software processing executed in the computer (PC) 10. Further, a storage device inside the computer (PC) 10 can be used as the storage device 12.
- FIGS. 10A and 10B show an example in which the linear range is determined by the first embodiment described above.
- the horizontal axis 110 in (a) and (b) indicates the elapsed time from the start of the reaction, and the vertical axis 120 indicates the absorbance.
- Time 1000 indicates a straight line start time determined through the present embodiment
- time 1020 indicates a straight line end time determined through the present embodiment.
- a range 1030 represents a linear range determined according to this embodiment.
- 10A shows an example of reaction process data having a lag time
- FIG. 10B shows an example of reaction process data having a curve in the latter half of the reaction process. In both cases, it was confirmed that only the straight line portion excluding the curved line portion could be determined as the straight line range.
- the linear range used for the conversion of the test value can be determined for each specimen. Therefore, it is possible to obtain a highly accurate inspection value as compared with the conventional apparatus. At the same time, it is possible to reduce re-inspection. Furthermore, since accuracy indices such as the linear range used for test value conversion, the number of absorbance data, the reference CV value, and the average value of reference absorbance data can be output, the accuracy of the test value for each sample can be guaranteed.
- an automatic analyzer according to a second embodiment will be described with reference to the drawings. Also in this embodiment, the automatic analyzer is assumed to be a biochemical automatic analyzer. Therefore, the apparatus configuration is the same as that of the first embodiment. That is, the apparatus has the configuration shown in FIG. The operations other than the control unit 13 are the same as those in the first embodiment. Therefore, detailed description other than the control unit 13 is omitted.
- control unit 13 determines the linear range based on the processing procedure shown in FIG. In FIG. 11, processing steps that perform the same processing as the processing shown in FIG.
- control unit 13 starts the determination process of the start point of the linear range in parallel with the measurement operation of the absorbance data without waiting for all the absorbance data in the reaction process to be measured. .
- step S5 to step S20 in the processing process shown in FIG. 11 is the same as the processing from step S5 to step S20 in FIG.
- the approximate expression parameter calculation unit 420 calculates the approximate expression parameter and the parameter change value based on the absorbance data acquired so far.
- the calculation method of the approximate expression parameter is the same as step S30 shown in FIG. However, in the first example, the linear range was calculated using all the acquired absorbance data after the last absorbance data of the reaction process was acquired, whereas in the case of this second example, Each time the absorbance data is acquired, the approximate expression parameter and the parameter change value are sequentially calculated.
- the parameter change value is a value obtained by quantifying the time change of the approximate expression parameter, and the approximate expression parameter representing the slope of the straight line portion is used for the calculation.
- the approximate expression parameter a is used.
- Various methods can be used as a method for quantifying the change of the parameter. For example, a method of calculating a difference from a parameter value calculated once before, a method of calculating a ratio with a parameter calculated once before, or the like can be used.
- attention is focused only on the parameter that gives the inclination of the straight line portion, but other parameters, for example, changes in the parameter of the non-linear portion may also be focused.
- step S1110 the approximate expression parameter calculation unit 420 stores the calculated approximate expression parameter and the parameter change value in the storage device 12.
- step S40 and step S45 are the same as step S40 and step S45 shown in FIG.
- the timing at which the parameter change value falls below the allowable range is determined as the end point of the lag time portion.
- the second half curve portion determination unit 435 determines whether or not the calculated parameter change value is within a predetermined range, and determines the second half curve portion of the reaction process data. A method for determining the second half curve portion will be described with reference to FIGS.
- FIG. 12 shows changes over time when, for example, parameter a in (Expression 2) to (Expression 5) is used as an approximate expression parameter representing the slope of a straight line.
- the horizontal axis 110 shows the elapsed time from the start of the reaction, and the vertical axis 1200 shows the value of the approximate expression parameter a.
- a symbol 1210 indicates the value of the approximate expression parameter a calculated at each time. It can be seen that the reaction process data is located on a straight line while the approximate expression parameter a is substantially constant, and that the reaction process data changes along the curve when the approximate expression parameter a deviates from a constant value.
- the latter half curve portion determination unit 435 determines that the approximate expression parameter a is constant, the latter half curve portion determination unit 435 determines that the line is a straight line and proceeds to step S25.
- the second-half curve portion determination unit 435 determines that the straight line range has ended, and proceeds to step S1130.
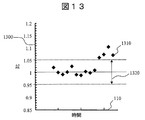
- FIG. 13 shows a case where the ratio with the parameter calculated once before is quantified as a parameter change value based on the parameter distribution shown in FIG.
- the horizontal axis 110 indicates the elapsed time from the start of the reaction
- the vertical axis 1300 indicates the parameter ratio.
- a symbol 1310 indicates a value of a ratio with a parameter calculated one time before each time. As shown in FIG. 13, when the reaction process data shows a straight line, the parameter ratio becomes a value close to 1, and when no straight line is shown, the parameter ratio becomes a value away from 1.
- the second-half curve portion determination unit 435 reads the predetermined allowable range 1320 from the storage device 12 and uses it for the determination processing in step S1120.
- the second-half curve portion determination unit 435 determines that the parameter is a straight line and proceeds to step S25.
- the second half curve portion determination unit 435 determines that the straight line range has ended, and proceeds to step S1130.
- the absorbance data acquisition unit 410 determines whether or not the input absorbance data is the last absorbance data. If it is determined that it is not the last absorbance data, the absorbance data acquisition unit 410 returns the processing process to step S10. On the other hand, if it is determined in step S25 that the necessary number of data has been accumulated, the absorbance data acquisition unit 410 advances the processing process to step S70.
- step S1130 the second-half curve section determination unit 435 stores the determined straight line end time in the storage device 12, and then advances the process to step S70.
- Step S70 to step S90 are the same as the processing of step S70 to step S90 shown in FIG.
- the latter half curve determination method described in step S1120 of the present embodiment can also be used for determination of the lag time portion.
- the time when the parameter change value has changed from outside the predetermined allowable range to within the allowable range may be determined as the straight line start time.
- the processing shown in FIG. 11 can be performed by the control unit 13
- the processing can also be performed by other parts of the apparatus.
- the processing of FIG. 11 can be executed as software in the computer (PC) 10.
- a storage device inside the computer (PC) 10 can be used as the storage device 12.
- FIG. 14 shows an example in which the linear range is determined using the processing method described in this embodiment.
- the horizontal axis 110 represents the elapsed time from the start of the reaction, and the vertical axis 120 represents the absorbance.
- Time 1400 indicates the straight line start time determined by the present embodiment
- time 1410 indicates the straight line end time determined by the present embodiment
- range 1420 indicates the straight line range determined by the present embodiment. As shown in FIG. 14, it was confirmed that only the straight line portion excluding the curved line portion could be determined as the straight line range.
- the linear range used for conversion of the test value can be determined for each specimen. Therefore, it is possible to obtain a highly accurate inspection value as compared with the conventional apparatus. At the same time, it is possible to reduce re-inspection. In addition, since the second half curve portion can be determined before obtaining the final absorbance data, the processing time can be shortened.
- the linear range used for test value conversion, the number of absorbance data, the accuracy index such as the reference CV value and the reference absorbance data average value can also be output. Can be guaranteed.
- an automatic analyzer according to a third embodiment will be described with reference to the drawings. Also in this embodiment, the automatic analyzer is assumed to be a biochemical automatic analyzer. Therefore, the apparatus configuration is the same as that of the first embodiment. That is, the apparatus has the configuration shown in FIG. The operations other than the control unit 13 are the same as those in the first embodiment. Therefore, detailed description other than the control unit 13 is omitted.
- control unit 13 determines the linear range based on the processing procedure shown in FIG. In FIG. 15, processing steps that perform the same processing as the processing shown in FIG.
- control unit 13 is characterized in that the test value is predictedly calculated before the reaction process is completed (before all the absorbance data is measured).
- step S5 to step S20 in the processing process shown in FIG. 15 is the same as the processing from step S5 to step S20 in FIG.
- the absorbance data acquisition unit 410 determines whether or not the absorbance data at the predicted time point is stored.
- the predicted time point is a point determined in the middle of the reaction process in order to calculate a predicted value of the inspection point (hereinafter referred to as “predicted detection point”).
- the prediction time point here may be determined as one time point regardless of the inspection item, or an optimal prediction time point may be determined for each inspection item.
- the predicted time point is stored in the storage device 12 in advance.
- the absorbance data acquisition unit 410 When the absorbance data at the predicted time point is not stored, the absorbance data acquisition unit 410 returns the processing process to step S10 and repeats the input and storage of the absorbance data until the predicted time point is reached. On the other hand, when the absorbance data at the predicted time point is stored, the absorbance data acquisition unit 410 advances the processing process to step S1510.
- step S1510 the approximate expression parameter calculation unit 420 calculates the approximate expression parameter value by the same method as in step S30 of FIG. That is, in this example, the second approximate expression is calculated based only on the absorbance data acquired from the start of the reaction process to the predicted time point.
- the approximate expression parameter calculation unit 420 stores the calculated approximate expression parameter value in the storage device 12.
- the next step S40 is the same as step S40 in FIG. That is, based on the calculated second approximate expression, the lag time part determination unit 425 calculates the lag time part of the reaction process data.
- the lag time part determination unit 425 determines whether or not the calculated length of the lag time part is within a predetermined range. This processing step is executed to determine whether or not the reaction process data is suitable for the prediction of the detected value.
- the range of the lag time part is experimentally determined in advance for each item and stored in the storage device 12.
- the lag time part determination part 425 advances the processing process to step S1560. If the determined lag time portion is outside the predetermined range, the lag time portion determination unit 425 advances the processing process to step S1550.
- the lag time part determination unit 425 stops the calculation of the inspection value by the prediction process, and continues to accumulate the absorbance data until all the absorbance data of the reaction process is acquired. That is, the acquisition of absorbance data that has been performed in the background after the prediction time is continued until all reaction processes are completed.
- step S1555 following step S1550 the test value of the specimen is calculated and output based on the actual measurement data by the same processing method as in the first and second embodiments described above.
- the lag time part determination unit 425 stores the calculated end time of the lag time part, that is, the straight line start time, in the storage device 12.
- step S70 and step S75 are the same as step S70 and step S75 in FIG. However, in step S70, the predicted time point stored in the storage device 12 as the straight line end time is used. Accordingly, when the straight line start time is determined in step S1560, the linear range of the specimen is automatically determined.
- step S75 the absorbance data number determination unit 440 in the linear range determines whether the absorbance data number is within a predetermined numerical range.
- the absorbance data number determination unit 440 within the linear range moves the processing process to step S1550. That is, the prediction process is stopped.
- the linear-range absorbance data number determination unit 440 moves the process to step S1570.
- step S1570 the test value calculation unit 445 calculates a linear equation that approximates the absorbance data within the linear range, and calculates an inclination used for test value conversion from the linear equation.
- the parameter of the straight line given by (Equation 6) is calculated so as to approximate the absorbance data within the linear range using an existing least squares calculation method or the like. That is, the slope of the straight line is calculated.
- step S1580 the test value calculation unit 445 calculates the predicted value of the test value based on the calibration curve from the slope of the approximate line. Calibration curve data is read from the storage device 12. Thereafter, the inspection value calculation unit 445 stores the linear range used for calculating the linear expression, the linear expression parameter, and the calculated predicted value in the storage device 12.
- the inspection value calculation unit 445 outputs the calculated predicted value.
- a method of outputting the inspection value a method of displaying on a display device attached to the computer 10 in FIG.
- a display example is shown in FIG.
- the measurement result display screen shown in FIG. 16 includes columns 900, 905, 910, 920, 930, 940, 950, 960, 1605, 1620, 1630, 1640, 1650, 1660, and 1670.
- a column 900 describes a specimen ID
- a column 905 describes an approximate expression (first approximate expression) used for prediction and test value output.
- a column 1605 describes a predicted value
- a column 1620 describes a straight line start time (straight line start time) used for prediction.
- Column 1630 describes the end time (straight line end time) of the straight line used for prediction
- column 1640 describes the number of absorbance data within the linear range used for prediction.
- Columns 1650, 1660, and 1670 describe accuracy indices when predicted values are calculated using absorbance data in the linear range used for prediction.
- a CV value is used as the accuracy index.
- the CV value may be determined in advance by performing an experiment using a sample whose test value is clear, such as a sample for calibration. In the experiment, it is only necessary to calculate CV values (values representing variations such as dispersion and standard deviation) when predicted by various combinations of line start time and line end time (absorbance data number).
- an average value and variation (variance, standard deviation, etc.) of the number of absorbance data are used.
- the average value and variation of the number of absorbance data may be calculated for each item from the prediction results of the most recently measured general (patient) sample and calibration sample. Note that the sample, the number of samples, and the period used for the calculation may be freely selected by the user.
- a correct answer rate (match rate) is used as another example of the accuracy index. The correct answer rate may be calculated for each item and each number of absorbance data from the predicted value and the test value obtained from the most recently measured general sample or calibration sample. Note that the sample, the number of samples, and the period used for the calculation may be freely selected by the user.
- the processing described in the first and second embodiments may be used for normal measurement.
- both the columns 1605 to 1670 relating to the predicted value and the columns 910 to 960 relating to the test value may be described.
- the processing of FIG. 15 can be executed as software in the computer (PC) 10.
- a storage device inside the computer (PC) 10 can be used as the storage device 12.
- the absorbance data used for prediction is only a straight line portion, so that the approximation accuracy is improved, and accurate prediction is possible.
- the linear range is determined for each sample, the predicted value can be output with higher accuracy for each sample. In the prediction process, it is not necessary to wait for the end of the reaction process. Therefore, the time until the predicted value is output can be shortened.
- accuracy indicators such as the linear range used for prediction, the number of absorbance data, the reference CV value, and the reference correct answer rate are output, it is possible to guarantee the accuracy of the predicted value for each specimen.
- the automatic analyzer to which the present invention is applied can provide accurate inspection values for inspection items measured by the rate method, and the reliability of the inspection. Can contribute to the improvement of performance. Further, as described in the third embodiment, the automatic analyzer to which the present invention is applied can accurately predict the inspection items measured by the rate method, and can contribute to shortening the inspection time. .
Landscapes
- Physics & Mathematics (AREA)
- Chemical & Material Sciences (AREA)
- Immunology (AREA)
- Life Sciences & Earth Sciences (AREA)
- Analytical Chemistry (AREA)
- Biochemistry (AREA)
- General Health & Medical Sciences (AREA)
- General Physics & Mathematics (AREA)
- Health & Medical Sciences (AREA)
- Pathology (AREA)
- Engineering & Computer Science (AREA)
- Chemical Kinetics & Catalysis (AREA)
- Mathematical Physics (AREA)
- Theoretical Computer Science (AREA)
- Spectroscopy & Molecular Physics (AREA)
- Plasma & Fusion (AREA)
- Automatic Analysis And Handling Materials Therefor (AREA)
- Investigating Or Analysing Materials By The Use Of Chemical Reactions (AREA)
- Investigating Or Analysing Biological Materials (AREA)
Abstract
Description
以下、第1の実施例に係る自動分析装置の装置構成及び処理動作を、図面を参照して詳細に説明する。図3に、本発明に係る分析機能を実装する生化学自動分析装置の概略構成を示す。
(数3) x=a * t + b + e / (t + d)
(数4) x=a * t + b + w / {exp(u * t) + v}
(数5) x=a * t + b + p * log{1 + q * exp(r * t)}
例示した4つの関数は、いずれも、時間に比例した成分と、定数成分と、時間変化率が異なる非直線成分で構成される。勿論、これ以外の関数を近似式として用意することも可能である。
また、信頼できる検査値を算出するために必要な最低限の吸光度データ数を予め実験から定めておいても良い。
次に、第2の実施例に係る自動分析装置を、図面を参照しながら説明する。本実施例の場合も、自動分析装置は生化学自動分析装置であるものとする。従って、その装置構成は、第1の実施例と同じである。すなわち、図3に示す装置構成を有している。また、制御部13以外の動作は、第1の実施例と同じである。従って、制御部13以外の詳細な説明は省略する。
次に、第3の実施例に係る自動分析装置を、図面を参照しながら説明する。本実施例の場合も、自動分析装置は生化学自動分析装置であるものとする。従って、その装置構成は、第1の実施例と同じである。すなわち、図3に示す装置構成を有している。また、制御部13以外の動作は、第1の実施例と同じである。従って、制御部13以外の詳細な説明は省略する。
出に用いる検体,検体数,期間はユーザーが自由に選択できるようにすれば良い。更に、精度指標の他の例としては、例えば正答率(一致率)を用いる。正答率は、直近に測定した一般検体やキャリブレーション用検体などから得られた予測値と検査値の結果から、項目ごと、吸光度データ数ごとに算出すれば良い。なお、算出に用いる検体,検体数,期間はユーザーが自由に選択できるようにすれば良い。
Claims (14)
- 試料と試薬を混合し、混合液の経時的な変化を測定する自動分析装置において、
前記試料と前記試薬の反応過程から複数の測定点データを取得する測定点データ取得部と、
前記測定点データを処理するデータ処理部と、
前記データ処理部で使用する第1の近似式を格納した記憶部と、
前記データ処理部の処理結果を出力する出力部と、を有し、
前記データ処理部は、前記記憶部に格納された第1の近似式を前記複数の測定点データに近似する処理と、近似処理の結果得られる第2の近似式に基づいて前記反応過程の直線範囲を決定する処理とを実行する
ことを特徴とする自動分析装置。 - 請求項1に記載の自動分析装置において、
前記データ処理部は、所定時刻までに取得された前記複数の測定点データを用いて前記第2の近似式を算出し、当該第2の近似式に基づいて前記反応過程の直線範囲を推定する
ことを特徴とする自動分析装置。 - 請求項2に記載の自動分析装置において、
前記データ処理部は、前記第2の近似式が漸近する直線を算出し、当該直線に前記第2の近似式が基準値以下に達した時刻を直線開始時刻とし、当該直線開始時刻と事前に定めた直線終了時刻との間の期間を直線範囲として推定する
ことを特徴とする自動分析装置。 - 請求項2に記載の自動分析装置において、
前記記憶部は、前記直線開始時刻の基準範囲を記憶し、
前記データ処理部は、前記直線範囲の推定値と前記基準範囲を比較し、比較結果に基づいて直線範囲の推定が可能か否かを判定する
ことを特徴とする自動分析装置。 - 請求項2に記載の自動分析装置において、
前記記憶部は、前記直線範囲が含むべき前記測定点データの数の基準値を記憶し、
前記データ処理部は、信号処理を通じて推定した前記直線範囲に含まれる測定点データの数をカウントする処理と、カウントされた前記測定点データの数と前記基準値とを比較し、直線範囲の推定が可能か否かを判定する処理とを有する
ことを特徴とする自動分析装置。 - 請求項1に記載の自動分析装置において、
前記第1の近似式は、以下に示す数1~数4のいずれか1つである
ことを特徴とする自動分析装置。
数1:x = a * t + b + c * exp( -k * t )
数2:x = a * t + b + e / ( t + d )
数3:x = a * t + b + w / { exp( u * t ) + v }
数4:x = a * t + b + p * log{ 1 + q * exp( r * t ) }
ただし、tは時刻、xは吸光度、a、b、c、d、e、k、p、q、r、u、v、wはパラメータである。 - 請求項1に記載の自動分析装置において、
前記データ処理部は、前記第2の近似式が漸近する直線を算出し、当該直線に前記第2の近似式が基準値以下に達した時刻を直線開始時刻に決定する
ことを特徴とする自動分析装置。 - 請求項1に記載の自動分析装置において、
前記データ処理部は、直線開始時刻以降の測定点データと前記第2の近似式が漸近する直線との差分値を算出し、当該差分値の経時変化に基づいて直線終了時刻を決定する
ことを特徴とする自動分析装置。 - 請求項1に記載の自動分析装置において、
前記データ処理部は、各時点までに取得された複数の測定点データを用いて前記第2の近似式を逐次算出する処理と、逐次算出される前記第2の近似式のうち少なくとも1つのパラメータの変化が許容範囲以下に小さくなった時点を直線開始時刻に決定する
ことを特徴とする自動分析装置。 - 請求項1に記載の自動分析装置において、
前記データ処理部は、直線開始時刻の決定後も、各時点までに取得された複数の測定点データを用いて前記第2の近似式を逐次算出する処理と、逐次算出される前記第2の近似式のうち少なくとも1つのパラメータに閾値を越える変化が検出された時点を直線終了時刻に決定する
ことを特徴とする自動分析装置。 - 請求項10に記載の自動分析装置において、
前記1つのパラメータは、前記第2の近似式を規定する直線成分の傾きを与えるパラメータである
ことを特徴とする自動分析装置。 - 請求項1に記載の自動分析装置において、
前記記憶部は、前記直線範囲が含むべき前記測定点データの数の基準値を記憶し、
前記データ処理部は、信号処理を通じて決定した直線範囲に含まれる測定点データの数をカウントする処理と、カウントされた前記測定点データの数と前記基準値とを比較して決定された直線範囲に関する異常の有無を判定する処理とを有する
ことを特徴とする自動分析装置。 - 請求項1に記載の自動分析装置において、
前記データ処理部は、決定された前記直線範囲の精度指標を算出する処理と、算出された前記精度指標を前記出力部に出力する処理とを有する
ことを特徴とする自動分析装置。 - 試料と試薬を混合した混合液の経時的な変化を、自動分析装置を用いて測定する自動分析方法において、
前記自動分析装置が、前記試料と前記試薬の反応過程から複数の測定点データを取得する処理と、
前記自動分析装置が、記憶部から読み出した第1の近似式を前記複数の測定点データに近似する処理と、
前記自動分析装置が、近似処理の結果得られる第2の近似式に基づいて前記反応過程の直線範囲を決定する処理と
を有することを特徴とする自動分析方法。
Priority Applications (3)
| Application Number | Priority Date | Filing Date | Title |
|---|---|---|---|
| US13/641,881 US10203277B2 (en) | 2010-04-20 | 2011-04-05 | Automatic analysis device and automatic analysis method |
| EP11771862.7A EP2562547B1 (en) | 2010-04-20 | 2011-04-05 | Automatic analysis device and automatic analysis method |
| CN201180019415.8A CN102859366B (zh) | 2010-04-20 | 2011-04-05 | 自动分析装置以及自动分析方法 |
Applications Claiming Priority (2)
| Application Number | Priority Date | Filing Date | Title |
|---|---|---|---|
| JP2010096770A JP5599219B2 (ja) | 2010-04-20 | 2010-04-20 | 自動分析装置及び自動分析方法 |
| JP2010-096770 | 2010-04-20 |
Publications (1)
| Publication Number | Publication Date |
|---|---|
| WO2011132525A1 true WO2011132525A1 (ja) | 2011-10-27 |
Family
ID=44834058
Family Applications (1)
| Application Number | Title | Priority Date | Filing Date |
|---|---|---|---|
| PCT/JP2011/058595 Ceased WO2011132525A1 (ja) | 2010-04-20 | 2011-04-05 | 自動分析装置及び自動分析方法 |
Country Status (5)
| Country | Link |
|---|---|
| US (1) | US10203277B2 (ja) |
| EP (1) | EP2562547B1 (ja) |
| JP (1) | JP5599219B2 (ja) |
| CN (1) | CN102859366B (ja) |
| WO (1) | WO2011132525A1 (ja) |
Cited By (6)
| Publication number | Priority date | Publication date | Assignee | Title |
|---|---|---|---|---|
| CN103091287A (zh) * | 2011-10-31 | 2013-05-08 | 深圳迈瑞生物医疗电子股份有限公司 | 一种血液分析仪测量结果的自诊断方法和装置 |
| WO2014174818A1 (ja) * | 2013-04-26 | 2014-10-30 | パナソニックIpマネジメント株式会社 | 酸化物質定量方法および酸化物質定量装置 |
| EP2799882A4 (en) * | 2011-12-26 | 2015-08-19 | Hitachi High Tech Corp | AUTOMATIC ANALYSIS DEVICE AND DETECTION METHOD FOR MEASUREMENT ANALYSIS |
| WO2016147527A1 (ja) * | 2015-03-19 | 2016-09-22 | テルモ株式会社 | 成分測定装置セット及び体液測定チップ |
| JP2016211971A (ja) * | 2015-05-08 | 2016-12-15 | シスメックス株式会社 | 検体分析装置、血液凝固分析装置、検体分析方法、及びコンピュータプログラム |
| JPWO2023132155A1 (ja) * | 2022-01-05 | 2023-07-13 |
Families Citing this family (10)
| Publication number | Priority date | Publication date | Assignee | Title |
|---|---|---|---|---|
| US9395268B2 (en) * | 2013-07-03 | 2016-07-19 | General Electric Company | Method and system to tolerance test a component |
| JP6104746B2 (ja) * | 2013-07-23 | 2017-03-29 | 株式会社日立ハイテクノロジーズ | 自動分析装置および分析方法 |
| JP6174411B2 (ja) * | 2013-07-29 | 2017-08-02 | 株式会社堀場製作所 | 水質分析装置及び水質分析方法 |
| KR102220812B1 (ko) * | 2013-12-09 | 2021-02-26 | 삼성전자주식회사 | 검사장치 및 검사방법 |
| EP3415920B1 (en) * | 2016-02-10 | 2021-12-15 | Hitachi High-Tech Corporation | Automatic analysis device |
| JP7042045B2 (ja) * | 2017-08-10 | 2022-03-25 | シスメックス株式会社 | 試料分析装置 |
| CN110347122B (zh) * | 2018-04-03 | 2022-07-22 | 阿里巴巴集团控股有限公司 | 一种出站时刻确定、数据确定方法、装置及其设备 |
| CN109146236A (zh) * | 2018-07-06 | 2019-01-04 | 东软集团股份有限公司 | 指标异常检测方法、装置、可读存储介质及电子设备 |
| CN110967306B (zh) * | 2019-11-14 | 2023-11-24 | 迈克医疗电子有限公司 | 反应稳定起始时间确定方法和装置、分析仪器和存储介质 |
| CN115561153B (zh) * | 2022-11-07 | 2024-07-26 | 西南石油大学 | 天然气海洋管道腐蚀剩余寿命预测方法 |
Citations (6)
| Publication number | Priority date | Publication date | Assignee | Title |
|---|---|---|---|---|
| JPS61149848A (ja) * | 1984-12-24 | 1986-07-08 | Shimadzu Corp | 酵素活性測定装置 |
| JPS6468642A (en) | 1987-09-09 | 1989-03-14 | Toshiba Corp | Reaction rate measuring method |
| JPH06194313A (ja) | 1992-12-24 | 1994-07-15 | Jeol Ltd | 反応測定方法 |
| JPH10185687A (ja) | 1996-12-24 | 1998-07-14 | Shimadzu Corp | 分光光度計を用いた酵素活性値測定装置 |
| JP2006337125A (ja) * | 2005-06-01 | 2006-12-14 | Hitachi High-Technologies Corp | 自動分析装置,自動分析装置を用いた分析方法 |
| JP2009098029A (ja) * | 2007-10-17 | 2009-05-07 | Kowa Co | 生物学的反応の評価方法及び評価装置 |
Family Cites Families (15)
| Publication number | Priority date | Publication date | Assignee | Title |
|---|---|---|---|---|
| US3881992A (en) * | 1973-07-02 | 1975-05-06 | Wilson Ralston | Optical rate measurement method |
| US3891848A (en) * | 1973-12-27 | 1975-06-24 | Nasa | Fluorescence detector for monitoring atmospheric pollutants |
| US3963909A (en) * | 1974-08-22 | 1976-06-15 | The Perkin-Elmer Corporation | Method and apparatus for computation in a kinetic analyzer |
| US4268171A (en) * | 1977-07-18 | 1981-05-19 | Beckman Instruments, Inc. | Method determining concentration in rate nephelometric immunochemical analysis |
| JPS56155835A (en) * | 1980-05-02 | 1981-12-02 | Olympus Optical Co Ltd | Component analyzing method |
| JPS57108643A (en) * | 1980-12-26 | 1982-07-06 | Hitachi Ltd | Method for measuring reaction |
| JPS5821544A (ja) * | 1981-07-31 | 1983-02-08 | Japan Spectroscopic Co | 化学反応速度測定方法 |
| US4750133A (en) | 1983-07-21 | 1988-06-07 | Beckman Instruments, Inc. | Validation of kinetic chemical reaction |
| JPS61218948A (ja) * | 1985-03-25 | 1986-09-29 | Toshiba Corp | 分析装置 |
| JP2727510B2 (ja) * | 1987-09-30 | 1998-03-11 | 株式会社島津製作所 | レート分析方法 |
| JP3645023B2 (ja) * | 1996-01-09 | 2005-05-11 | 富士写真フイルム株式会社 | 試料分析方法、検量線の作成方法及びそれを用いる分析装置 |
| DE19640121B4 (de) * | 1996-09-28 | 2007-04-26 | Dade Behring Marburg Gmbh | Verfahren zur Bestimmung einer sich zeitabhängig ändernden Meßgröße |
| US7276377B2 (en) * | 2003-05-02 | 2007-10-02 | Wada, Inc. | Method and apparatus for determining anticoagulant therapy factors |
| JP4986487B2 (ja) * | 2006-03-30 | 2012-07-25 | シスメックス株式会社 | 血液凝固時間測定装置 |
| JP4654256B2 (ja) * | 2008-02-28 | 2011-03-16 | 株式会社日立ハイテクノロジーズ | 自動分析装置 |
-
2010
- 2010-04-20 JP JP2010096770A patent/JP5599219B2/ja not_active Expired - Fee Related
-
2011
- 2011-04-05 CN CN201180019415.8A patent/CN102859366B/zh active Active
- 2011-04-05 WO PCT/JP2011/058595 patent/WO2011132525A1/ja not_active Ceased
- 2011-04-05 US US13/641,881 patent/US10203277B2/en not_active Expired - Fee Related
- 2011-04-05 EP EP11771862.7A patent/EP2562547B1/en active Active
Patent Citations (6)
| Publication number | Priority date | Publication date | Assignee | Title |
|---|---|---|---|---|
| JPS61149848A (ja) * | 1984-12-24 | 1986-07-08 | Shimadzu Corp | 酵素活性測定装置 |
| JPS6468642A (en) | 1987-09-09 | 1989-03-14 | Toshiba Corp | Reaction rate measuring method |
| JPH06194313A (ja) | 1992-12-24 | 1994-07-15 | Jeol Ltd | 反応測定方法 |
| JPH10185687A (ja) | 1996-12-24 | 1998-07-14 | Shimadzu Corp | 分光光度計を用いた酵素活性値測定装置 |
| JP2006337125A (ja) * | 2005-06-01 | 2006-12-14 | Hitachi High-Technologies Corp | 自動分析装置,自動分析装置を用いた分析方法 |
| JP2009098029A (ja) * | 2007-10-17 | 2009-05-07 | Kowa Co | 生物学的反応の評価方法及び評価装置 |
Non-Patent Citations (2)
| Title |
|---|
| KUMIKO KAMIHARA ET AL.: "Hanno Katei Kinjiho o Mochiita Rate-ho no Data Hyoka", JAPANESE JOURNAL OF CLINICAL LABORATORY AUTOMATION, vol. 34, no. 4, 1 September 2009 (2009-09-01), pages 476, XP008168842 * |
| YOSHIKAZU YAMAMOTO: "Jido Bunseki Sochi Joho o Mochiita Kensa Data no Hosho Hanno Katei o Mochiita Hannokei ni Kiin suru Ijo no Kenshutsu", JAPANESE JOURNAL OF CLINICAL LABORATORY AUTOMATION, vol. 34, no. 2, 1 April 2009 (2009-04-01), pages 163 - 169, XP008168318 * |
Cited By (13)
| Publication number | Priority date | Publication date | Assignee | Title |
|---|---|---|---|---|
| CN103091287B (zh) * | 2011-10-31 | 2015-04-01 | 深圳迈瑞生物医疗电子股份有限公司 | 一种血液分析仪测量结果的自诊断方法和装置 |
| CN103091287A (zh) * | 2011-10-31 | 2013-05-08 | 深圳迈瑞生物医疗电子股份有限公司 | 一种血液分析仪测量结果的自诊断方法和装置 |
| US9506942B2 (en) | 2011-12-26 | 2016-11-29 | Hitachi High-Technologies Corporation | Automatic analyzer and method for detecting measurement value abnormalities |
| EP2799882A4 (en) * | 2011-12-26 | 2015-08-19 | Hitachi High Tech Corp | AUTOMATIC ANALYSIS DEVICE AND DETECTION METHOD FOR MEASUREMENT ANALYSIS |
| CN104380086A (zh) * | 2013-04-26 | 2015-02-25 | 松下知识产权经营株式会社 | 氧化物质定量方法以及氧化物质定量装置 |
| WO2014174818A1 (ja) * | 2013-04-26 | 2014-10-30 | パナソニックIpマネジメント株式会社 | 酸化物質定量方法および酸化物質定量装置 |
| US9513227B2 (en) | 2013-04-26 | 2016-12-06 | Panasonic Intellectual Property Management Co., Ltd. | Method for quantitative determination of oxidant and apparatus for quantitative determination of oxidant |
| JPWO2014174818A1 (ja) * | 2013-04-26 | 2017-02-23 | パナソニックIpマネジメント株式会社 | 酸化物質定量方法および酸化物質定量装置 |
| WO2016147527A1 (ja) * | 2015-03-19 | 2016-09-22 | テルモ株式会社 | 成分測定装置セット及び体液測定チップ |
| JP2016211971A (ja) * | 2015-05-08 | 2016-12-15 | シスメックス株式会社 | 検体分析装置、血液凝固分析装置、検体分析方法、及びコンピュータプログラム |
| JPWO2023132155A1 (ja) * | 2022-01-05 | 2023-07-13 | ||
| WO2023132155A1 (ja) * | 2022-01-05 | 2023-07-13 | 株式会社日立ハイテク | 予測線計算装置、予測線計算方法 |
| JP7741896B2 (ja) | 2022-01-05 | 2025-09-18 | 株式会社日立ハイテク | 予測線計算装置、予測線計算方法 |
Also Published As
| Publication number | Publication date |
|---|---|
| JP5599219B2 (ja) | 2014-10-01 |
| EP2562547A4 (en) | 2014-06-11 |
| CN102859366B (zh) | 2015-11-25 |
| EP2562547A1 (en) | 2013-02-27 |
| CN102859366A (zh) | 2013-01-02 |
| US20130046480A1 (en) | 2013-02-21 |
| JP2011226909A (ja) | 2011-11-10 |
| US10203277B2 (en) | 2019-02-12 |
| EP2562547B1 (en) | 2019-10-02 |
Similar Documents
| Publication | Publication Date | Title |
|---|---|---|
| JP5599219B2 (ja) | 自動分析装置及び自動分析方法 | |
| JP5562421B2 (ja) | 自動分析装置、分析方法及び情報処理装置 | |
| CN102422144B (zh) | 自动分析装置 | |
| JP5520519B2 (ja) | 自動分析装置及び分析方法 | |
| CN101520461B (zh) | 自动分析装置 | |
| CN103534596B (zh) | 自动分析装置以及自动分析方法 | |
| EP3693744A1 (en) | Automatic analyzer | |
| JP7299914B2 (ja) | 異常判定方法、および自動分析装置 | |
| JP5891288B2 (ja) | 自動分析装置及び自動分析プログラム | |
| JPH09257804A (ja) | 多項目自動分析方法およびその装置 | |
| JP2008203008A (ja) | 自動分析装置 | |
| JP5839849B2 (ja) | 自動分析装置 | |
| JP2017020956A (ja) | 自動分析装置、自動分析方法及びプログラム | |
| JP2006292698A (ja) | 臨床検査用自動分析装置の精度管理方法、及び自動分析装置 |
Legal Events
| Date | Code | Title | Description |
|---|---|---|---|
| WWE | Wipo information: entry into national phase |
Ref document number: 201180019415.8 Country of ref document: CN |
|
| 121 | Ep: the epo has been informed by wipo that ep was designated in this application |
Ref document number: 11771862 Country of ref document: EP Kind code of ref document: A1 |
|
| WWE | Wipo information: entry into national phase |
Ref document number: 13641881 Country of ref document: US Ref document number: 9069/DELNP/2012 Country of ref document: IN Ref document number: 2011771862 Country of ref document: EP |
|
| NENP | Non-entry into the national phase |
Ref country code: DE |