WO2012176520A1 - 予測装置、予測方法及び予測プログラム - Google Patents
予測装置、予測方法及び予測プログラム Download PDFInfo
- Publication number
- WO2012176520A1 WO2012176520A1 PCT/JP2012/057844 JP2012057844W WO2012176520A1 WO 2012176520 A1 WO2012176520 A1 WO 2012176520A1 JP 2012057844 W JP2012057844 W JP 2012057844W WO 2012176520 A1 WO2012176520 A1 WO 2012176520A1
- Authority
- WO
- WIPO (PCT)
- Prior art keywords
- prediction
- items
- data
- item
- value
- Prior art date
- Legal status (The legal status is an assumption and is not a legal conclusion. Google has not performed a legal analysis and makes no representation as to the accuracy of the status listed.)
- Ceased
Links
Images







Classifications
-
- G—PHYSICS
- G06—COMPUTING OR CALCULATING; COUNTING
- G06Q—INFORMATION AND COMMUNICATION TECHNOLOGY [ICT] SPECIALLY ADAPTED FOR ADMINISTRATIVE, COMMERCIAL, FINANCIAL, MANAGERIAL OR SUPERVISORY PURPOSES; SYSTEMS OR METHODS SPECIALLY ADAPTED FOR ADMINISTRATIVE, COMMERCIAL, FINANCIAL, MANAGERIAL OR SUPERVISORY PURPOSES, NOT OTHERWISE PROVIDED FOR
- G06Q10/00—Administration; Management
- G06Q10/06—Resources, workflows, human or project management; Enterprise or organisation planning; Enterprise or organisation modelling
- G06Q10/063—Operations research, analysis or management
- G06Q10/0639—Performance analysis of employees; Performance analysis of enterprise or organisation operations
- G06Q10/06395—Quality analysis or management
-
- G—PHYSICS
- G05—CONTROLLING; REGULATING
- G05B—CONTROL OR REGULATING SYSTEMS IN GENERAL; FUNCTIONAL ELEMENTS OF SUCH SYSTEMS; MONITORING OR TESTING ARRANGEMENTS FOR SUCH SYSTEMS OR ELEMENTS
- G05B13/00—Adaptive control systems, i.e. systems automatically adjusting themselves to have a performance which is optimum according to some preassigned criterion
- G05B13/02—Adaptive control systems, i.e. systems automatically adjusting themselves to have a performance which is optimum according to some preassigned criterion electric
- G05B13/0205—Adaptive control systems, i.e. systems automatically adjusting themselves to have a performance which is optimum according to some preassigned criterion electric not using a model or a simulator of the controlled system
- G05B13/026—Adaptive control systems, i.e. systems automatically adjusting themselves to have a performance which is optimum according to some preassigned criterion electric not using a model or a simulator of the controlled system using a predictor
-
- G—PHYSICS
- G06—COMPUTING OR CALCULATING; COUNTING
- G06Q—INFORMATION AND COMMUNICATION TECHNOLOGY [ICT] SPECIALLY ADAPTED FOR ADMINISTRATIVE, COMMERCIAL, FINANCIAL, MANAGERIAL OR SUPERVISORY PURPOSES; SYSTEMS OR METHODS SPECIALLY ADAPTED FOR ADMINISTRATIVE, COMMERCIAL, FINANCIAL, MANAGERIAL OR SUPERVISORY PURPOSES, NOT OTHERWISE PROVIDED FOR
- G06Q10/00—Administration; Management
- G06Q10/04—Forecasting or optimisation specially adapted for administrative or management purposes, e.g. linear programming or "cutting stock problem"
-
- G—PHYSICS
- G06—COMPUTING OR CALCULATING; COUNTING
- G06Q—INFORMATION AND COMMUNICATION TECHNOLOGY [ICT] SPECIALLY ADAPTED FOR ADMINISTRATIVE, COMMERCIAL, FINANCIAL, MANAGERIAL OR SUPERVISORY PURPOSES; SYSTEMS OR METHODS SPECIALLY ADAPTED FOR ADMINISTRATIVE, COMMERCIAL, FINANCIAL, MANAGERIAL OR SUPERVISORY PURPOSES, NOT OTHERWISE PROVIDED FOR
- G06Q30/00—Commerce
- G06Q30/02—Marketing; Price estimation or determination; Fundraising
- G06Q30/0201—Market modelling; Market analysis; Collecting market data
- G06Q30/0202—Market predictions or forecasting for commercial activities
-
- G—PHYSICS
- G06—COMPUTING OR CALCULATING; COUNTING
- G06Q—INFORMATION AND COMMUNICATION TECHNOLOGY [ICT] SPECIALLY ADAPTED FOR ADMINISTRATIVE, COMMERCIAL, FINANCIAL, MANAGERIAL OR SUPERVISORY PURPOSES; SYSTEMS OR METHODS SPECIALLY ADAPTED FOR ADMINISTRATIVE, COMMERCIAL, FINANCIAL, MANAGERIAL OR SUPERVISORY PURPOSES, NOT OTHERWISE PROVIDED FOR
- G06Q50/00—Information and communication technology [ICT] specially adapted for implementation of business processes of specific business sectors, e.g. utilities or tourism
- G06Q50/04—Manufacturing
-
- Y—GENERAL TAGGING OF NEW TECHNOLOGICAL DEVELOPMENTS; GENERAL TAGGING OF CROSS-SECTIONAL TECHNOLOGIES SPANNING OVER SEVERAL SECTIONS OF THE IPC; TECHNICAL SUBJECTS COVERED BY FORMER USPC CROSS-REFERENCE ART COLLECTIONS [XRACs] AND DIGESTS
- Y02—TECHNOLOGIES OR APPLICATIONS FOR MITIGATION OR ADAPTATION AGAINST CLIMATE CHANGE
- Y02P—CLIMATE CHANGE MITIGATION TECHNOLOGIES IN THE PRODUCTION OR PROCESSING OF GOODS
- Y02P90/00—Enabling technologies with a potential contribution to greenhouse gas [GHG] emissions mitigation
- Y02P90/30—Computing systems specially adapted for manufacturing
Definitions
- the present invention relates to a prediction device, a prediction method, and a prediction program for predicting a variation factor of a prediction target based on a prediction target related to a product or a production process and a plurality of process values that can be a variation factor of the prediction target.
- an analysis using multiple regression analysis has a problem that the analysis itself cannot be performed when the number of items is larger than the number of data.
- this problem has been solved, but there is a problem of how to select items used for analysis.
- selecting an item for example, as described in Non-Patent Document 1, a method called a two-sided T method has been proposed.
- the inventor of the present application has found a problem of further improving the prediction accuracy based on a prediction method using the T method, and realizes improvement of the prediction accuracy in order to solve the problem, a prediction method, and a prediction program
- the purpose is to provide.
- the calculation means includes a means for setting a value not more than the minimum value (or more than the maximum value) of the factor effect value derived by the derivation means as an initial value of the threshold value, and a value not less than the set threshold value.
- the prediction apparatus further includes a weight for each item based on the strength of correlation of the prediction target with respect to the data for each item selected by the selection means, and a linear relationship between the data for each selected item and the prediction target.
- a prediction formula deriving unit for deriving a prediction formula based on a proportional constant for each item indicating a relationship or a non-linear relationship that can be substituted for the linear relationship is provided.
- the prediction method according to the present invention is a prediction device that is accessible to a recording unit that records data of a numerical value of a prediction target related to a product or a production process and data of a plurality of process values that can be a variation factor of the prediction target.
- the prediction device for each item that can be a fluctuation factor, of other items excluding the data of the item Deriving a factor effect value indicating the strength of the correlation of the prediction target for the data of each item including the data of the item with respect to the strength of the correlation of the prediction target for each data, and the factor effect value derived by the deriving means Calculating the strength of correlation with the prediction target for the data of a plurality of items selected in descending order for each item, and the calculation means Determining the number of items based on the strength of correlation for each number of items, and selecting items corresponding to the number of items determined by the determining unit in descending order of the factor effect value derived by the deriving unit; And a step of outputting a plurality of items selected by the selection means as a prediction result of a variation factor to be predicted.
- a procedure for deriving a factor effect value indicating the strength of the correlation of the prediction target for the data of each item including the data of the item with respect to the strength of the correlation of the prediction target for each data of the item, and the factor derived by the deriving means Calculates the strength of the correlation with the prediction target for the data of multiple items selected in descending order of effect value for each number of items.
- the present invention is characterized in that a procedure for selecting items for several minutes and a procedure for outputting a plurality of items selected by the selection means as prediction results of a variation factor to be predicted are executed.
- the number of items can be determined based on the correlation for each item, and the optimal item selection can be performed based on the determined number of items and the factor effect value. It is possible to improve the prediction accuracy.
- the prediction method which concerns on this invention it is a graph which shows an example of the relationship between the item selection number and the S / N ratio of a comprehensive estimated value.
- it is a graph which shows an example of SN ratio of the comprehensive estimated value with respect to a selection item.
- it is a graph which shows an example of the contribution rate with respect to a selection item.
- it is a graph which shows notionally an example of the process for determining the optimal number of item selection.
- the prediction method according to the present invention has been subjected to various technical improvements in order to make the prediction method using the MT system, particularly the T method, industrially applicable.
- the prediction target related to the product or the production process is regarded as the target characteristic, and the fluctuation factors of the prediction target are predicted using the data on the process values of a plurality of items that can be the fluctuation factors of the prediction target, and the fluctuation of the prediction target is determined.
- the purpose is to predict.
- the prediction target indicates, for example, data that can be quantified such as measured values such as quality and quantity of industrial products to be produced, process values in the production process, and other management values.
- the prediction target does not necessarily need to be an industrial product, and the present invention can be applied to various fields such as a yield, a characteristic value, and the like of a product such as an agricultural product other than the industrial product as a prediction target.
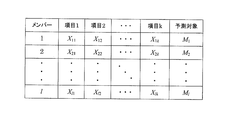
- FIG. 1 is a chart showing an example of each item and prediction target data used in the prediction method according to the present invention.
- a member is an index for a record in which each item that can be a prediction target and its variation factor is associated, and is indicated as 1, 2,.
- Item 1, item 2,..., Item k are a plurality of items indicating process values that can be the variation factors of the prediction target, and X11, X12,.
- the prediction target is an item indicating the prediction target, and M1, M2,... Indicate data obtained by quantifying the prediction target.
- the data used for prediction may be actual data, but it is preferable to use the data after normalizing it by subtracting the average value of the data of the item from the data of each item. By normalizing, it becomes possible to express a prediction formula described later as a straight line passing through the origin in the unit space for each item.
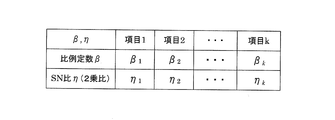
- the S / N ratio is a value expressed by using the reciprocal of variance as shown in the following formula 2, is the sensitivity of the prediction target for each item, and indicates the strength of correlation between each item and the prediction target.
- FIG. 3 is a chart showing an example of the actual value and the overall estimated value of the prediction target used in the prediction method according to the present invention.
- FIG. 3 is a table showing a list of the actual value of the prediction target indicating the actual data or normalized data of each member and the overall estimated value obtained by the above equation 4.
- the SN ratio ⁇ (db) of the total estimated value can be calculated by the following formula 5 using the actual value and the total estimated value of the prediction target shown in the table of FIG.
- a general estimation formula can be derived as a prediction formula indicating the relationship between the item data and the total estimation value of the prediction target.
- the comprehensive estimation formula using all items related to the prediction target does not necessarily have the highest prediction accuracy. Therefore, it is necessary to select an appropriate combination of items from all items in order to increase the contribution to the influence on the prediction target and increase the prediction accuracy.
- the prediction formula is based on the premise that the relationship between the item and the prediction target has linearity.
- the relationship between the item and the prediction target does not necessarily indicate linearity, and as a result, the prediction value of the prediction target and the actual measurement value may deviate, and the prediction accuracy may decrease. Therefore, in the present invention, a prediction formula indicating a non-linear relationship may be used instead of a prediction formula indicating a linear relationship, if necessary.
- a prediction formula obtained by approximating the relationship between the prediction target and the item with a quadratic expression may be substituted with a prediction expression indicating a linear relationship as a prediction expression indicating a non-linear relationship.
- FIG. 4 is an example of a factor effect diagram used in the prediction method according to the present invention.
- FIG. 4 is a factor effect diagram using a two-level orthogonal table showing the item selection method.
- the horizontal axis indicates items to be selected, the vertical axis indicates the SN ratio of the overall estimated value, The SN ratio for each item is shown.
- the orthogonal table shown in FIG. 4 for each item, the SN ratio of the overall estimated value for each data including the data of the item on the left side, that is, the strength of the correlation of the prediction target is shown, and the data of the item is shown on the right side.
- the SN ratio of the comprehensive estimated value for each excluded data is shown. More specifically, in the example shown in FIG. 4, 36 items are selected.
- the SN ratio of the prediction target for one or a plurality of items is derived.
- the average value of SN ratio of the combination containing the said item used as object and the average value of S / N ratio of the combination which does not contain the said item are calculated.
- the average value of the SN ratio including the data of the item calculated in this way is shown on the left side, and the average value of the SN ratio not including the data of the item is shown on the right side for each item. is there.
- FIG. 5 is a graph showing an example of the influence on the factor effect of each item used in the prediction method according to the present invention.
- the horizontal axis indicates items to be selected, and the vertical axis indicates the factor effect value, indicating the factor effect value for each item.
- the factor effect value shown on the vertical axis in FIG. 5 is the left SN ratio relative to the right SN ratio with respect to the SN ratio of the overall estimated value indicating the strength of correlation of the prediction target in db units in FIG. A value obtained by subtracting the SN ratio on the left side from the SN ratio on the right side is shown. Therefore, in FIG. 5, the item whose factor effect value is positive indicates that the SN ratio of the comprehensive estimated value is increased by using the item.
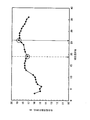
- FIG. 6 is a graph showing an example of the relationship between the number of item selections and the SN ratio of the overall estimated value in the prediction method according to the present invention.
- the horizontal axis indicates the number of items selected
- the vertical axis indicates the SN ratio of the comprehensive estimated value.
- the selection of items is made by selecting the number of items shown as the number of item selections in order from the item with the largest factor effect value. That is, when the number of item selection is 10, it indicates that the item with the largest factor effect value is selected from the 10th highest item.
- the item selection number of 19 indicated by a dotted line with an arrow indicates the SN ratio when only the item having the positive factor effect value shown in FIG. 5 is selected. As shown in FIG.
- the S / N ratio with respect to the number of item selections does not increase monotonously or decreases monotonically, and the S / N ratio always shows the maximum value when only items with positive factorial effect values are selected. Not a translation.
- the SN ratio is the maximum when the number of item selections indicated by the solid line with an arrow is 26.
- FIG. 7 is a graph showing an example of a relationship between the total estimated value and the S / N ratio with respect to the number of item selections in the prediction method according to the present invention.
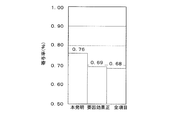
- FIG. 7A shows the total of the case where 26 items with the maximum S / N ratio used in the prediction method according to the present invention are selected, the case where only items with positive factorial effect values are selected, and the case where all items are selected. The SN ratio of the estimated value is shown.
- FIG. 7B shows a case where 26 items with the maximum S / N ratio used in the prediction method according to the present invention are selected, an item with a positive factor effect value is selected, and a case where all items are selected. The contribution rate is shown.
- FIGS. 7A and 7B when the items are selected so that the S / N ratio used in the prediction method according to the present invention is the maximum, both the S / N ratio and the contribution ratio are the best. It is a value.
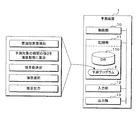
- FIG. 9 is a block diagram illustrating a configuration example of the prediction apparatus of the present invention.
- 1 is a prediction apparatus to which the prediction method of the present invention is applied, and the prediction apparatus 1 is configured using various computers such as a personal computer.
- the prediction device 1 includes various mechanisms such as a control unit 10, a recording unit 11, an input unit 12, and an output unit 13.
- the recording unit 11 shows various recording means for recording various information, and is a mechanism such as volatile memory such as various RAMs for temporarily recording information, non-volatile memory such as ROM, hard disk drive, or the like.
- volatile memory such as various RAMs for temporarily recording information
- non-volatile memory such as ROM, hard disk drive, or the like.
- other devices such as an external hard disk drive, an optical disk drive, and a file server connected via a communication network can be used as the recording unit 11. That is, the recording unit 11 here is a general term for one or a plurality of information recording media accessible from the control unit 10.
- the recording unit 11 records the prediction program 2 of the present invention including various procedures for realizing the prediction method of the present invention.
- a part of the recording area of the recording unit 11 is used as a database (DB) 110 that records data on a prediction target and a plurality of items, and the control unit 10 accesses the database 110 as necessary. It is possible.
- the database 110 records data, for example, in the format of the chart shown in FIG.
- the input unit 12 is a mechanism for receiving user operation inputs such as a keyboard and a mouse.
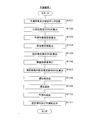
- control unit 10 calculates the SN ratio of the comprehensive estimated value for the data of a plurality of items selected in order from the largest factor effect value for each number of items (S107). Specific processing for calculating the SN ratio of the comprehensive estimated value calculated in step S107, that is, the strength of the correlation of the prediction target for the data of a plurality of items, for each number of items will be described later.
- control unit 10 selects items for the number of items determined in step S108 in descending order of the factor effect value derived in step S106 (S109).
- control part 10 records the some formula selected in step S109, and the prediction formula derived
- the plurality of items output in step S111 are candidates for analysis of the variation factors to be predicted.
- actions such as verification of prediction accuracy, examination of analysis results, prediction of effects at the time of process improvement, and the like using the output prediction formula.
- it is possible to predict the effect at the time of process improvement by substituting the predicted process value after process improvement into the derived prediction formula and performing an operation based on the prediction formula.
- conversion processing such as normalization and logarithmization in advance, it is necessary to perform inverse conversion of the conversion.
- FIG. 11 is a flowchart showing an example of prediction processing by the prediction device 1 of the present invention.
- the prediction device 1 executes the process exemplified below as a specific process for the process of step S107 in the prediction process described with reference to FIG. 10 under the control of the control unit 10 that executes the prediction program 2.
- the process shown using the flowchart of FIG. 11 corresponds to the process described using the graph of FIG.
- Step S201 is a state in which an initial value is set in FIG. As shown in FIG. 8, the processing amount can be reduced by setting the minimum factor effect value as a threshold value.
- control unit 10 selects an item for which a factor effect value equal to or greater than the set threshold is calculated (S202).
- the minimum factor effect value is set as the initial value of the threshold value, all items are selected in the first step S202.
- step S205 When it is determined in step S205 that calculation of the SN ratio of the total estimated value for the selected item has not been completed and calculation of the SN ratio of the total estimated value for a smaller number of items is required (S205: NO), the control unit 10 resets the set threshold value to a value larger by a predetermined value (S206), proceeds to step S202, and repeats the subsequent processing.
- the mode in which the initial value of the threshold value is set to be equal to or less than the minimum value of the factor effect value and the threshold value is reset so as to increase by a predetermined value is shown, but the reverse processing may be performed. . That is, the initial value of the threshold is set to be equal to or greater than the maximum value of the factor effect value, the item for which the factor effect value equal to or greater than the set threshold is calculated is selected, and the threshold is reset so that the threshold value is decreased by a predetermined value. May be.
- the prediction process by the prediction device according to the present invention is executed.
- Example 1 As Example 1, an example in which the prediction method of the present invention is applied to quality control in an engine manufacturing factory will be described.
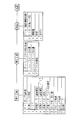
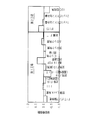
- FIG. 12 is an explanatory diagram conceptually showing items related to quality control according to the first embodiment to which the prediction method of the present invention is applied.
- the engine which concerns on Example 1 demonstrated using FIG. 12 is manufactured through the manufacturing process in a 1st factory, and the manufacturing process in a 2nd factory.
- the first factory manages 11 item process values
- the second factory manages 4 item process values.
- the engine that is a manufactured product is subjected to a total inspection or a sampling inspection for various items. There are five items to be subjected to the sampling inspection, and “FIR (dynamic injection timing)” among them is a prediction target in the first embodiment.
- FIR dynamic injection timing
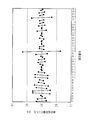
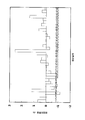
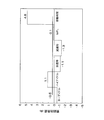
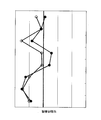
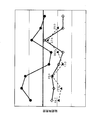
- FIG. 16 is a management chart showing the variation of the prediction target according to the first embodiment to which the prediction method of the present invention is applied.
- FIG. 16 shows the FIR test results before and after the improvement when the factor effect value shown in FIG. 14B is further analyzed and the TDC phase angle is improved. As shown in FIG. 16, after the improvement of the TDC phase angle, the value that deviates from the upper limit value or the lower limit value of the management indicated by the thick line is decreased, and it can be read that this was an effective improvement.
- FIG. 18 is a graph showing the influence of each item on the factor effect value according to Example 2 to which the prediction method of the present invention is applied.
- the horizontal axis indicates each item
- the vertical axis indicates the factor effect value
- the degree of the factor effect for each item is indicated in db units.
- the solid line shown slightly above the position where the factor effect value is 0 indicates the threshold when the SN ratio of the overall estimated value is maximized when the prediction method of the present invention is applied. In this case, the number of items having a value equal to or greater than the threshold is two items.
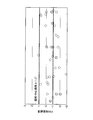
- FIG. 19 is a graph showing the relationship between measured values and estimated values according to Example 2 to which the prediction method of the present invention is applied.
- the horizontal axis represents the engine lot
- the vertical axis represents the amount of black smoke generated at the start of the prediction, and the relationship is shown.
- the points indicated by black circles are actually measured values, and the points indicated by white squares are predicted values.
- the horizontal thick line is a management standard for the amount of black smoke generated at the time of start-up, and it is required for the quality control that the amount of black smoke generated be a value equal to or smaller than the thick line.
- the predicted value in FIG. 19 is obtained by deriving a prediction formula using the two items selected as the factor effect value being equal to or greater than the threshold in FIG. 18 and using the derived prediction formula. As shown in FIG. 19, there is a correlation between the relationship between the actual measurement value and the predicted value, and it is clear that the reliability of the prediction formula derived using the prediction method of the present invention is high.
- FIG. 20 is a scatter diagram showing the relationship between measured values and estimated values in Example 2 to which the prediction method of the present invention is applied.
- the actual value of the amount of black smoke generated at the start is taken on the horizontal axis
- the estimated value of the amount of black smoke generated at the start is taken on the vertical axis, and the relationship is shown.
- FIG. 20 shows the relationship between the actual measurement value and the predicted value shown in FIG. 19 as a scatter diagram, and it can be confirmed from the scatter diagram that the correlation is high.
- the contribution rate is 0.71.
- the points indicated by black squares in the figure indicate points that serve as unit space criteria for selecting items.
- FIG. 21 is a graph showing the relationship between measured values and estimated values according to Example 2 to which the prediction method of the present invention is applied.
- the horizontal axis represents the engine lot
- the vertical axis represents the amount of black smoke generated at the start of the prediction, and the relationship is shown.
- the points indicated by black circles are actually measured values before the process improvement, and are the same as the values shown in FIG.
- points indicated by white squares indicate predicted values after process improvement.
- the process improvement shown in Example 2 indicates an improvement in the amount of black smoke generated during high idle among the items targeted for improvement.
- the points indicated by black triangles indicate the actual measurement values after the process improvement.
- the black smoke generation amount at the time of start is less than the management standard due to the process improvement of the black smoke generation amount at the time of high idle, which has been focused as an improvement target, and the predicted value due to the improvement It is clear that the measured values are approximate.
- the above-described embodiments are merely examples of the innumerable forms of the present application, and various hardware configurations, processing procedures, mathematical formulas, alternative formulas, and other conditions are set for purposes, uses, etc. It is possible to design accordingly.
- the SN ratio using the reciprocal of the variance is used as the numerical value indicating the strength of the correlation.
- the present invention is not limited to this, and the definition of the energy ratio type SN ratio is different.
- An indicator may be used.
Landscapes
- Business, Economics & Management (AREA)
- Engineering & Computer Science (AREA)
- Human Resources & Organizations (AREA)
- Strategic Management (AREA)
- Economics (AREA)
- Development Economics (AREA)
- Entrepreneurship & Innovation (AREA)
- Physics & Mathematics (AREA)
- General Physics & Mathematics (AREA)
- Marketing (AREA)
- Theoretical Computer Science (AREA)
- General Business, Economics & Management (AREA)
- Game Theory and Decision Science (AREA)
- Tourism & Hospitality (AREA)
- Accounting & Taxation (AREA)
- Finance (AREA)
- Educational Administration (AREA)
- Operations Research (AREA)
- Quality & Reliability (AREA)
- Health & Medical Sciences (AREA)
- Data Mining & Analysis (AREA)
- Primary Health Care (AREA)
- General Health & Medical Sciences (AREA)
- Manufacturing & Machinery (AREA)
- Artificial Intelligence (AREA)
- Computer Vision & Pattern Recognition (AREA)
- Evolutionary Computation (AREA)
- Medical Informatics (AREA)
- Software Systems (AREA)
- Automation & Control Theory (AREA)
- Management, Administration, Business Operations System, And Electronic Commerce (AREA)
- General Factory Administration (AREA)
Priority Applications (2)
| Application Number | Priority Date | Filing Date | Title |
|---|---|---|---|
| US14/128,430 US20140136299A1 (en) | 2011-06-21 | 2012-03-27 | Prediction device, prediction method, and computer readable medium |
| EP12802500.4A EP2725440A4 (de) | 2011-06-21 | 2012-03-27 | Vorhersagevorrichtung, vorhersageverfahren und vorhersageprogramm |
Applications Claiming Priority (2)
| Application Number | Priority Date | Filing Date | Title |
|---|---|---|---|
| JP2011137744A JP5068383B1 (ja) | 2011-06-21 | 2011-06-21 | 予測装置、予測方法及び予測プログラム |
| JP2011-137744 | 2011-06-21 |
Publications (1)
| Publication Number | Publication Date |
|---|---|
| WO2012176520A1 true WO2012176520A1 (ja) | 2012-12-27 |
Family
ID=47277796
Family Applications (1)
| Application Number | Title | Priority Date | Filing Date |
|---|---|---|---|
| PCT/JP2012/057844 Ceased WO2012176520A1 (ja) | 2011-06-21 | 2012-03-27 | 予測装置、予測方法及び予測プログラム |
Country Status (4)
| Country | Link |
|---|---|
| US (1) | US20140136299A1 (de) |
| EP (1) | EP2725440A4 (de) |
| JP (1) | JP5068383B1 (de) |
| WO (1) | WO2012176520A1 (de) |
Cited By (1)
| Publication number | Priority date | Publication date | Assignee | Title |
|---|---|---|---|---|
| WO2023233927A1 (ja) * | 2022-06-03 | 2023-12-07 | オムロン株式会社 | 異常検知装置、異常検知方法およびプログラム |
Families Citing this family (11)
| Publication number | Priority date | Publication date | Assignee | Title |
|---|---|---|---|---|
| US20130018689A1 (en) * | 2011-02-10 | 2013-01-17 | Diego Guicciardi | System and Method for Enhancing and Sustaining Operational Efficiency |
| JP5680144B2 (ja) * | 2013-06-14 | 2015-03-04 | ヤンマー株式会社 | 予測装置、予測方法及びコンピュータプログラム |
| JP5602283B1 (ja) * | 2013-06-14 | 2014-10-08 | ヤンマー株式会社 | 予測装置、予測方法及びコンピュータプログラム |
| WO2014200080A1 (ja) * | 2013-06-14 | 2014-12-18 | ヤンマー株式会社 | 予測装置、予測方法及びコンピュータプログラム |
| JP5572738B1 (ja) * | 2013-06-14 | 2014-08-13 | ヤンマー株式会社 | 予測装置、予測方法及びコンピュータプログラム |
| JP5564604B1 (ja) * | 2013-06-14 | 2014-07-30 | ヤンマー株式会社 | 予測装置、予測方法及びコンピュータプログラム |
| CN103544543A (zh) * | 2013-10-28 | 2014-01-29 | 南京航空航天大学 | 一种可重构性指标分配方法 |
| JP5826348B1 (ja) * | 2014-09-08 | 2015-12-02 | ヤンマー株式会社 | 予測装置、予測方法及びコンピュータプログラム |
| JP7514445B2 (ja) * | 2020-10-16 | 2024-07-11 | 株式会社サタケ | 生産計画作成方法およびそのシステム |
| CN114360651B (zh) * | 2021-12-28 | 2025-03-28 | 中国海洋大学 | 一种基因组预测方法、预测系统及应用 |
| JP2023133887A (ja) * | 2022-03-14 | 2023-09-27 | オムロン株式会社 | 制御装置、制御方法およびプログラム |
Citations (1)
| Publication number | Priority date | Publication date | Assignee | Title |
|---|---|---|---|---|
| JP2010211684A (ja) * | 2009-03-12 | 2010-09-24 | Toshiba Corp | データ処理方法、データ処理プログラム、データ処理装置 |
Family Cites Families (3)
| Publication number | Priority date | Publication date | Assignee | Title |
|---|---|---|---|---|
| JP5068382B1 (ja) * | 2011-06-21 | 2012-11-07 | ヤンマー株式会社 | 予測装置、予測方法及び予測プログラム |
| US20150170169A1 (en) * | 2012-06-27 | 2015-06-18 | Yanmar Co., Ltd. | Prediction device, prediction method, and computer readable medium |
| JP5416809B2 (ja) * | 2012-06-27 | 2014-02-12 | ヤンマー株式会社 | 予測装置、予測方法及びコンピュータプログラム |
-
2011
- 2011-06-21 JP JP2011137744A patent/JP5068383B1/ja not_active Expired - Fee Related
-
2012
- 2012-03-27 US US14/128,430 patent/US20140136299A1/en not_active Abandoned
- 2012-03-27 EP EP12802500.4A patent/EP2725440A4/de not_active Withdrawn
- 2012-03-27 WO PCT/JP2012/057844 patent/WO2012176520A1/ja not_active Ceased
Patent Citations (1)
| Publication number | Priority date | Publication date | Assignee | Title |
|---|---|---|---|---|
| JP2010211684A (ja) * | 2009-03-12 | 2010-09-24 | Toshiba Corp | データ処理方法、データ処理プログラム、データ処理装置 |
Non-Patent Citations (3)
| Title |
|---|
| KAZUO TATEBAYASHI ET AL., NYUMON MT SYSTEM, 4 December 2008 (2008-12-04), pages 72 - 90, XP008172525 * |
| See also references of EP2725440A4 |
| SHOICHI TEJIMA; YOSHIKO HASEGAWA: "Nikkagiren Shuppan-Sha", December 2008, JUSE PRESS, LTD, article "Introduction to MT system" |
Cited By (2)
| Publication number | Priority date | Publication date | Assignee | Title |
|---|---|---|---|---|
| WO2023233927A1 (ja) * | 2022-06-03 | 2023-12-07 | オムロン株式会社 | 異常検知装置、異常検知方法およびプログラム |
| TWI867544B (zh) * | 2022-06-03 | 2024-12-21 | 日商歐姆龍股份有限公司 | 異常偵測裝置、異常偵測方法及電腦可讀取儲存媒體 |
Also Published As
| Publication number | Publication date |
|---|---|
| EP2725440A4 (de) | 2014-10-01 |
| EP2725440A1 (de) | 2014-04-30 |
| JP2013004034A (ja) | 2013-01-07 |
| US20140136299A1 (en) | 2014-05-15 |
| JP5068383B1 (ja) | 2012-11-07 |
Similar Documents
| Publication | Publication Date | Title |
|---|---|---|
| JP5068383B1 (ja) | 予測装置、予測方法及び予測プログラム | |
| JP5068382B1 (ja) | 予測装置、予測方法及び予測プログラム | |
| Höhle et al. | Bayesian nowcasting during the STEC O104: H4 outbreak in Germany, 2011 | |
| Bornmann et al. | Scientometrics in a changing research landscape: bibliometrics has become an integral part of research quality evaluation and has been changing the practice of research | |
| Ma et al. | On estimation efficiency of the central mean subspace | |
| JP7231829B2 (ja) | 機械学習プログラム、機械学習方法および機械学習装置 | |
| Peltola et al. | Hierarchical Bayesian Survival Analysis and Projective Covariate Selection in Cardiovascular Event Risk Prediction. | |
| JP5373870B2 (ja) | 予測装置、予測方法、及び、プログラム | |
| JP4627674B2 (ja) | データ処理方法及びプログラム | |
| Qiuheng et al. | Model selection method based on maximal information coefficient of residuals | |
| Jin et al. | Dynamic quality-process model in consideration of equipment degradation | |
| JP2014010482A (ja) | 予測装置、予測方法及びコンピュータプログラム | |
| TW202514413A (zh) | 構建時序異常檢測模型的方法和系統及層次分析方法和系統、電腦可讀儲存媒介 | |
| Chen et al. | Prediction of preload attenuation of ball screw based on support vector machine | |
| Qi et al. | State of Health Estimation for Lithium-Ion Batteries Based on Gray Wolf-Optimized CNN-BiLSTM-Attention Hybrid Model | |
| JP5636922B2 (ja) | 性能予測装置、性能予測方法およびプログラム | |
| CN115394380A (zh) | 一种基于随机退化过程的材料相关参数间的预测方法 | |
| Mensah et al. | A Stratification and Sampling Model for Bellwether Moving Window. | |
| US20150170169A1 (en) | Prediction device, prediction method, and computer readable medium | |
| Wang et al. | Multi-criteria decision-making method-based approach to determine a proper level for extrapolation of Rainflow matrix | |
| WO2022157862A1 (ja) | トラフィック変動予測装置、及びトラフィック変動予測方法、並びにトラフィック変動予測プログラム | |
| JP5572738B1 (ja) | 予測装置、予測方法及びコンピュータプログラム | |
| Guo et al. | Life expectancy prediction based on particle swarm optimization support vector machine regression | |
| CN118673468A (zh) | 模型设定支援装置、模型设定支援方法及存储介质 | |
| JP5602283B1 (ja) | 予測装置、予測方法及びコンピュータプログラム |
Legal Events
| Date | Code | Title | Description |
|---|---|---|---|
| 121 | Ep: the epo has been informed by wipo that ep was designated in this application |
Ref document number: 12802500 Country of ref document: EP Kind code of ref document: A1 |
|
| WWE | Wipo information: entry into national phase |
Ref document number: 14128430 Country of ref document: US |
|
| NENP | Non-entry into the national phase |
Ref country code: DE |
|
| WWE | Wipo information: entry into national phase |
Ref document number: 2012802500 Country of ref document: EP |