WO2013124973A1 - Dispositif permettant d'afficher des informations de système de puissance électrique, et procédé permettant d'afficher des informations de système de puissance électrique - Google Patents
Dispositif permettant d'afficher des informations de système de puissance électrique, et procédé permettant d'afficher des informations de système de puissance électrique Download PDFInfo
- Publication number
- WO2013124973A1 WO2013124973A1 PCT/JP2012/054169 JP2012054169W WO2013124973A1 WO 2013124973 A1 WO2013124973 A1 WO 2013124973A1 JP 2012054169 W JP2012054169 W JP 2012054169W WO 2013124973 A1 WO2013124973 A1 WO 2013124973A1
- Authority
- WO
- WIPO (PCT)
- Prior art keywords
- display
- power
- power system
- information
- distribution
- Prior art date
- Legal status (The legal status is an assumption and is not a legal conclusion. Google has not performed a legal analysis and makes no representation as to the accuracy of the status listed.)
- Ceased
Links
Images











Classifications
-
- H—ELECTRICITY
- H02—GENERATION; CONVERSION OR DISTRIBUTION OF ELECTRIC POWER
- H02J—ELECTRIC POWER NETWORKS; CIRCUIT ARRANGEMENTS OR SYSTEMS FOR SUPPLYING OR DISTRIBUTING ELECTRIC POWER; SYSTEMS FOR STORING ELECTRIC ENERGY
- H02J13/00—Circuit arrangements for providing remote monitoring or remote control of equipment in a power distribution network
- H02J13/18—Circuit arrangements for providing remote monitoring or remote control of equipment in a power distribution network characterised by the remotely-controlled equipment, e.g. converters or transformers
- H02J13/333—Circuit arrangements for providing remote monitoring or remote control of equipment in a power distribution network characterised by the remotely-controlled equipment, e.g. converters or transformers the equipment forming part of substations
-
- H—ELECTRICITY
- H02—GENERATION; CONVERSION OR DISTRIBUTION OF ELECTRIC POWER
- H02J—ELECTRIC POWER NETWORKS; CIRCUIT ARRANGEMENTS OR SYSTEMS FOR SUPPLYING OR DISTRIBUTING ELECTRIC POWER; SYSTEMS FOR STORING ELECTRIC ENERGY
- H02J13/00—Circuit arrangements for providing remote monitoring or remote control of equipment in a power distribution network
-
- G—PHYSICS
- G06—COMPUTING OR CALCULATING; COUNTING
- G06T—IMAGE DATA PROCESSING OR GENERATION, IN GENERAL
- G06T11/00—Two-dimensional [2D] image generation
- G06T11/20—Drawing from basic elements
- G06T11/26—Drawing of charts or graphs
-
- H—ELECTRICITY
- H02—GENERATION; CONVERSION OR DISTRIBUTION OF ELECTRIC POWER
- H02J—ELECTRIC POWER NETWORKS; CIRCUIT ARRANGEMENTS OR SYSTEMS FOR SUPPLYING OR DISTRIBUTING ELECTRIC POWER; SYSTEMS FOR STORING ELECTRIC ENERGY
- H02J13/00—Circuit arrangements for providing remote monitoring or remote control of equipment in a power distribution network
- H02J13/10—Circuit arrangements for providing remote monitoring or remote control of equipment in a power distribution network characterised by displaying of information or by user interaction, e.g. supervisory control and data acquisition [SCADA] systems
-
- Y—GENERAL TAGGING OF NEW TECHNOLOGICAL DEVELOPMENTS; GENERAL TAGGING OF CROSS-SECTIONAL TECHNOLOGIES SPANNING OVER SEVERAL SECTIONS OF THE IPC; TECHNICAL SUBJECTS COVERED BY FORMER USPC CROSS-REFERENCE ART COLLECTIONS [XRACs] AND DIGESTS
- Y04—INFORMATION OR COMMUNICATION TECHNOLOGIES HAVING AN IMPACT ON OTHER TECHNOLOGY AREAS
- Y04S—SYSTEMS INTEGRATING TECHNOLOGIES RELATED TO POWER NETWORK OPERATION, COMMUNICATION OR INFORMATION TECHNOLOGIES FOR IMPROVING THE ELECTRICAL POWER GENERATION, TRANSMISSION, DISTRIBUTION, MANAGEMENT OR USAGE, i.e. SMART GRIDS
- Y04S10/00—Systems supporting electrical power generation, transmission or distribution
- Y04S10/40—Display of information, e.g. of data or controls
Definitions
- the present invention relates to a display device and a display method for power system information, and is particularly suitable for a power system simulation device including a plurality of distributed power sources using natural energy and a power system integrated monitoring and control device incorporating this simulation device.
- the present invention relates to a display device and a display method for accurate power system information.
- Patent Document 1 a method for displaying power system information three-dimensionally on the screen of the display device is disclosed in Patent Document 1.
- the power system displayed three-dimensionally is displayed.
- the voltage at each node or the deviation from the node voltage reference value is displayed by a cylinder whose size corresponds to the height in the axial direction, and this cylinder is arranged upward or downward from the node.
- the increase or decrease tendency of the deviation from the voltage at the node or the node voltage reference value is displayed by changing the diameters of the upper surface and the lower surface of the cylindrical body.
- the branch active / reactive power flow and the installed capacity are also displayed three-dimensionally using a solid. When two arbitrary nodes are selected, a sine waveform of the voltage phase angle is displayed.
- Patent Document 2 discloses a comprehensive monitoring and control system for monitoring and controlling the power generation output of each distributed power source and the load on a demand facility in a smart grid or a microgrid.
- This system uses the information acquired by the measurement value monitoring means and the information managed by the customer information management means in the event of an accident in the microgrid or smart grid system.
- An abnormality-time accommodation procedure creating means for creating an accommodation procedure for matching the output amount with the total load amount of each demand facility is provided.
- Patent Document 3 discloses a power distribution system power flow simulation device capable of individually considering the power used and the reverse power flow of a large number of consumers.
- a plurality of consumer load simulation units and distributed power supply simulation units are arranged to change fluctuations in load power and fluctuations in generated power from distributed power sources such as solar power generation in consumers such as a plurality of general households. By simulating individually and considering this result, the power flow in the distribution system closer to reality is calculated.
- visualization technology is important for quickly and accurately determining the operation content, the relationship between causes and results, etc. It is considered to be. For example, when reverse flow power is generated, it is desirable to display on the display device not only the fact but also the cause of the power flow so that signal changes in the power system can be seen at a glance.
- Patent Document 1 is suitable for centralized control, but sufficient consideration is not given to visualization in a power system including many distributed power sources.
- Patent Document 3 and Patent Document 2 consider distributed power sources, sufficient consideration has not been given to visualizing the relationship between inputs and results with high visibility.
- An object of the present invention is to provide a power system information display device and a display method capable of displaying a signal change in a power system including a distributed power source together with the fluctuation factors with high visibility.
- the display device for power system information is a display device for power system information including a display unit having a display screen and a screen display control unit for controlling the display unit, and the display screen has a relative positional relationship. And a display area divided into a plurality of display cells, and the display unit is configured to display a state of a power system to be monitored on the display screen and on the display cell.
- a menu display function for displaying a menu or icon for selection on the display screen and accepting a selection operation for the menu or icon, and the power system to be monitored is distributed
- the map display item is information on a state quantity related to the state of the power system to be monitored, and the display cell unit is different in color display according to the value of the state quantity.
- the map display item is displayed.
- the state quantity that is a variation factor together with the state of the power system including the distributed power source is obtained for each display cell unit.
- the figure which showed the other example of the display method and its utilization form on a display part corresponding to the electric power adjustment procedure of FIG. The figure which showed the other example of the display method and its utilization form on a display part corresponding to the electric power adjustment procedure of FIG.
- the term “cell” is used like a display cell or a control cell, but the cell may be replaced with other words such as a grid or a lattice.
- the word grid is used in the present invention because the word grid may be confused with the smart grid used in the same power field.
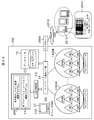
- FIG. 1 is a diagram illustrating an overall configuration example of a power system simulation apparatus including a power system information display device according to the first embodiment.
- the power system simulation apparatus 100 includes a simulation control unit 11, a simulation model 12 having models of the power systems 13A to 13N, a network communication unit 14, a database 15, an input / output control unit 16, and an operator terminal 17 having a display screen 170. ing.
- the power system simulation apparatus 100 can be connected to the weather information provider terminal 18 via the network communication unit 14.
- Each model of the power systems 13A to 13N is configured to correspond to a plurality of energy management systems EMS (Energy Management System) 131 and a local energy management system CEMS (Community Energy Management System) 132 that integrates them.
- the power system simulation apparatus 100 includes a plurality of distribution system simulation apparatuses (see FIG. 3A).
- the computer simulation control unit 11 includes, as module applications for realizing each distribution system simulation device, a distribution system power flow calculation unit 1100, a distribution system occurrence phenomenon calculation unit 1110, a power flow calculation cooperation unit 1120, an autonomous distributed system state.
- a program for realizing functions of the management unit 1130, the network communication unit 14, and the like is included.
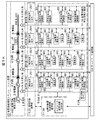
- FIG. 2 is a diagram illustrating an example of a configuration of a “distribution system” in an actual power system (real system) to which the power system simulation apparatus is applied.
- the distribution system refers to a section from the terminal substation 1 to the customer 7 (7a to 7n) in the power system connecting the power customer to the power plant.
- the section from the terminal substation 1 to the pole transformer 5 is called the distribution line 2
- the section from the pole transformer 5 to the consumer 7 such as a general household is It is called a service line 6 (also called a branch branch line).
- the voltage of the distribution line 2 is 6 kV or 6.6 kV (high voltage system)
- the voltage of the lead-in wire 6 is 100 V or 200 V (low voltage system).
- a switch 3 is provided on the distribution line 2 for safety and accident countermeasures, and a voltage is adjusted by SVR (Step Voltage Regulator) 4 and reactive power (Q) control for voltage adjustment.
- a static reactive power compensator (SVC: Static Var Compensator) is provided as appropriate.
- pole transformers 5 are provided at a plurality of positions branching from the distribution line 2, and a plurality of customers 7 a to 7 n are connected to the lead-in wires 6 drawn from the pole transformer 5.
- the customer 7 a is configured to include an electronic measuring instrument (smart meter) 71, a load device 72, a distributed power source 73, a PCS (Power Conditioning System) 74, and a storage battery 75.
- the consumer 7b is comprised including the smart meter 71 and the load apparatus 72, it does not include the distributed power supply 73 and PCS.
- the consumer 7n includes a smart meter 71, a load device 72, a distributed power source 73, a PCS 74, and an electric vehicle 76.
- the distributed power source 73 represents a solar power generation device, a wind power generation device, or the like.
- the smart meter 71 is used by an electric power company to collect information on the power value (voltage value, current value) and power consumption of the consumer 7.
- the high-voltage system of the transmission system is divided into a plurality of systems.
- an autonomous distributed power monitoring control device (management server) 9 is installed for each “distribution system”. , They perform autonomous, cooperative, and centralized control that optimizes the entire power transmission system in cooperation with the upper management server.
- the autonomous distributed power monitoring and control device 9 does not have to be installed for each “distribution system”, and may be appropriately installed within a necessary range according to the actual situation. For example, in the case where a region where “distributed control” is performed and a region where “centralized control” is performed are mixed depending on the installation status of the distributed power supply, the autonomous distributed power monitoring controller 9 may be installed only in the former good.
- the smart meter 71 has an AMI (Advanced Metering Infrastructure) function, and not only a function of measuring the power of the forward flow and the power of the reverse flow, but also an autonomous distributed power monitoring control for managing the state of the distribution line 2 A function of communicating with the device 9 is provided. Furthermore, the wattmeter may have a so-called DSM (Demand Side Management) function.
- AMI Advanced Metering Infrastructure
- DSM Demand Side Management
- the voltage of the lead-in wire 6 is adjusted within 101 ⁇ 6 volts at a standard voltage of 100 volts and within 202 ⁇ 20 volts at a standard voltage of 200 volts.
- FIG. 3A is a diagram illustrating a configuration of functional blocks of a simulation model unit of the power system simulation apparatus 100.
- the distribution system simulation device 10 of the simulation model unit includes a distribution system power flow calculation unit 1100, a distribution system occurrence phenomenon calculation unit 1110, a power flow calculation cooperation unit 1120, an autonomous distributed system state management unit 1130, a customer load simulation unit 80, a distributed It includes functional blocks such as a power supply simulation unit 90 and an electric vehicle simulation unit 92.
- FIG. 3A also shows a part of the configuration of the power distribution system shown in FIG. 2 in order to clearly indicate which part of the distribution system to be applied that each functional block simulates.
- Distribution system power flow calculation unit 1100 Distribution system occurrence phenomenon calculation unit 1110, power flow calculation linkage unit 1120, autonomous distributed system state management unit 1130, network communication unit 14, customer load simulation unit 80, distributed power supply simulation unit 90, electricity
- the functional blocks such as the automobile simulation unit 92 are realized by the CPU executing programs corresponding to the respective functional blocks stored in the storage device.
- the distribution system power flow calculation unit 1100 is a functional block that simulates the power flow in the power distribution system portion from the substation 1 to the pole transformer 5, that is, the so-called distribution line 2 portion. That is, when the load power for the pole transformer 5 is input, the distribution system power flow calculation unit 10 determines the voltage at each point on the distribution line 2 (including the position on the secondary side of the pole transformer 5). Calculate the value. SVR and SVC are installed in the high voltage system (6 KV) of the distribution system power flow calculation unit 1100, and voltage control is performed cooperatively by combining both. When a large number of customers are connected to the low-voltage distribution line, the individual customers cannot be distinguished from the high-voltage side, and can be seen as a group of customers via a columnar transformer.
- a power distribution system simulation device is used to develop and evaluate these control algorithms.
- the power distribution system simulation device 10 includes an autonomous distributed system state management unit 1130 that functions as a simulation unit of the autonomous distributed power monitoring control device in order to perform autonomous distributed control.
- the state of the system is simulated based on a new control algorithm assuming such a system configuration.
- voltage control devices called SVR and SVC are installed on the distribution system high voltage side (6 KV).
- SVR and SVC are installed on the distribution system high voltage side (6 KV).
- a method of controlling the voltage cooperatively by combining both has been proposed.
- the distribution system simulation device develops and evaluates its control algorithm.
- the control method also includes “distributed” and “centralized”.
- the customer load simulation unit 80 simulates the time fluctuation of the power used by the customer 7 in units of one day. And when a certain time is input, based on the result of the simulation, the meter value (electric energy) of the smart meter 71 at that time is output.
- the use schedule of lighting devices and home appliances according to the family structure of the customer 7 and the rhythm of life is made into a database with a table or the like. Based on the usage schedule, time fluctuations in the power consumption are simulated.
- the distributed power supply simulation unit 90 simulates time variation of power generated by the distributed power supply 73 such as a photovoltaic power generation device PV (Photovoltaic Power Generation) or a wind power generation device owned by the customer 7 on a daily basis.
- the distributed power supply 73 such as a photovoltaic power generation device PV (Photovoltaic Power Generation) or a wind power generation device owned by the customer 7 on a daily basis.
- PV Photovoltaic Power Generation
- a wind power generation device owned by the customer 7 on a daily basis.
- the autonomous distributed system state management unit 1130 aggregates the values of the smart meter 71 read from each of the customer load simulation unit 80 and the distributed power supply simulation unit 90 for each lead-in line 6 to which they are connected, The load power (total load power 201) for the pole transformer 5 to which the lead-in wire 6 is connected is calculated. Then, the total load power 201 is input to the power distribution system power flow calculation unit 1100 via the power flow calculation cooperation unit 1120, and the power flow simulation unit 1100 is requested to execute a power flow simulation.
- the autonomous distributed system state management unit 1130 acquires the voltage value at the position of the pole transformer 5 obtained as a result of the simulation in the distribution system power flow calculation unit 1100, that is, the voltage value of the lead-in line 6, and acquires the voltage value.
- the voltage value of the lead-in line 6 is transmitted to each of the customer load simulation unit 80 and the distributed power supply simulation unit 90 via the network communication unit 14.
- the autonomous distributed system state management unit 1130 acquires detailed information for each pole transformer and distribution system section, and enables appropriate voltage management of the distribution network. Data of each customer is collected in the autonomous distributed system state management unit 1130.
- the autonomous distributed system state management unit 1130 collects various information for each pole transformer and distribution system section, and controls the SVC and SVR.
- the SVC is responsible for short-term voltage fluctuations
- the SVR is responsible for voltage control corresponding to long cycles and daily load fluctuations. Thereby, for example, it is possible to estimate the load amount of each section of the distribution system, and more appropriate distribution system operation, in particular, more detailed voltage management of the distribution network.
- the occurrence phenomenon calculation unit 1110 in the distribution system acquires data on the fluctuation factors of the state of the power system in the distribution system section in conjunction with the simulation of the load power and the generated power, or acquires the acquired data based on some algorithm. Calculate and output.
- the customer load simulation unit 80 and the distributed power supply simulation unit 90 that can simulate the load power and the generated power that fluctuate in various forms are actually used.
- the power flow of the distribution system can be simulated in accordance with the arrangement of the distribution line 2, the pole transformer 5 and the lead-in line 6. Therefore, simulation of the power flow of the distribution system can be performed more faithfully.
- the smart meter is a multi-function electronic energy meter having a bidirectional communication function and advanced information processing capability, and each customer 7 has a temperature and a sunshine amount.
- the power company collects information on the state of the load devices of each customer 7 and the environment such as temperature, and information on the status of the distributed power supply, storage battery, and storage battery of the electric vehicle through this smart meter. It is possible to make it possible.
- the electric power company can obtain more detailed weather information and information on energy in addition to the information from the weather information provider terminal 18, so this can be used for simulation to improve the energy supply-demand balance, predict demand, etc. It can be used for.
- the electric power company secures a stable local power source by controlling the load devices and distributed power sources of each customer 7 within a predetermined range through a smart meter. It is also possible to perform control. On the other hand, it is also conceivable that each customer 7 is provided with information about energy in the surrounding area as well as the power company from the power company so that the energy can be used effectively.
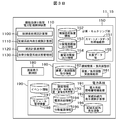
- FIG. 3B is a diagram illustrating an example of functional blocks of a control unit of the power system simulation apparatus.
- the control unit 11 of the power distribution system simulation device 10 includes a simulated autonomous distributed power monitoring control device 110, a measurement / monitoring unit 150, a simulated demand / load adjustment unit 160, a screen display control unit 180, and a power system management unit 190.
- the control unit 11 can be realized by a computer including a CPU and a storage device such as a RAM or a hard disk device.
- the measurement / monitoring unit 150 includes a smart meter data processing function unit 151, and further stores, as a database, simulated load device information 152, distributed power source simulated output information 153, storage battery simulated output information 154, weather data 155, and the like. Yes.
- the simulated demand / load adjustment unit 160 has a demand / load adjustment execution function unit, and further holds demand / load adjustment command information 162 as a database.
- the electric power system management unit 190 includes an electric power system information management function unit 191 and an occurrence phenomenon calculation unit 192 in the wiring system, and further includes customer information (location, contracted electric energy, presence / absence of storage battery) 193, power system information 194 as a database. , Distributed power supply information 195, occurrence phenomenon 196 in the wiring system, event information 197, and module management information 198.
- the autonomous distributed system state management unit 1130 enables calculation of a distributed power supply possible capacity, a voltage distribution at the time of distributed power supply connection, a short-circuit capacity, and the like using power flow calculation.
- data such as utility poles, high-voltage lines, switches, voltage regulators, etc. can be automatically captured and analyzed in accordance with the actual situation.
- the display screen 170 of the operator terminal 17 has a GUI function, and functions as an input / output unit for the operator terminal 17 together with a mouse, a keyboard, a printer, and the like.
- the display screen 170 is a screen that employs liquid crystal or organic electroluminescence (EL), and corresponds to an electrostatic touch panel.
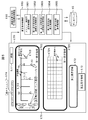
- FIG. 4 is a diagram illustrating a configuration example of a display screen 170 that is a display unit of power system information in the first embodiment.
- the display screen 170 includes a first display area 171 at the center, a second display area 172 below it, and a third display area 173 (173A to 173C) located on the right side of the first display area 171.
- a display selection menu 174 at the upper left of the first display area
- a power system / area selection menu 175 at the right end of the first display area
- a selection element 176 that can be displayed at a plurality of locations in the first display area.
- the energy system diagram to be monitored is made concrete, and a plurality of spots are selectably displayed on the screen display area on the energy system diagram.
- the energy system corresponds to, for example, a power system or a distribution system to be monitored.
- the energy distribution between at least two spots (points A and B in this example) of the energy system in the selected first display area 171 is displayed.
- the third display area 173 in this example, the three-phase unbalance (173A) and the pole transformer voltage (173B) related to the point C selected from the pull-down menu of the selection element 176 at the point C of the energy system.
- the supply and demand adjustment function (173C) are displayed.
- the voltage three-phase imbalance as reference information displayed in the third display area is displayed three-dimensionally for ease of viewing due to restrictions on the screen area.
- the layout of the first display area to the third display area on the display screen 170 is an example and is not limited to this. Of these, the first display area needs to have the maximum display area. is there.
- the energy state around the spots is displayed in color using a plurality of cells as the background of the energy system diagram.
- the plurality of cells also have a map function that represents the relative positional relationship between the energy system and the customer.
- the display selection menu 174 overlaps with the diagram of the energy system that is the monitoring target, and uses a display cell that represents the relative positional relationship of the monitoring target as a background to display the state quantity corresponding to each position as a map display item As a color display.
- the map display items that can be selected are state quantities such as voltage distribution, temperature distribution, solar radiation distribution, distributed power source / battery power distribution, power consumption distribution, and the like corresponding to the selected energy system. As the state quantity, not only the current value but also a future predicted value and a past actual value can be displayed on a map.
- the display such as SVR, SVC, PCS, etc. displayed in the first display area 171 can also function as an icon for operation input.
- the operator operates these icons on the display of the first display area 171 and inputs necessary data to change the control parameters of the SVC at each point including the PCS and the X point, It is also possible to control so that the voltage values of the distribution line 2 and the lead-in line 6 are within the range of the control allowable value in the entire region.
- FIG. 5 is a diagram illustrating a configuration example of the display unit 170 of FIG. 4 and the screen display control unit 180 that controls the display unit 170.
- the display unit 170 includes an energy system diagram display function unit 1710 and a map item display function unit 1720.
- the energy system diagram display function unit 1710 mainly displays the state of the system line to be monitored, and displays at least the system line 1711, the system line 1712, and the display element 1713.
- the map item display function unit 1720 associates the energy system, that is, the power system / area to be monitored, with each cell region 1721 subdivided into a mesh shape corresponding to a map representing the positional relationship on the plane, and relates to the state of the system line. Displays information about the state quantity to be used.
- the screen display control unit 180 includes a menu / time display control unit 1801, a first display region system line display control unit 1802, a first display region system cell region display control 1803, a second display region display control unit 1804, a third display.
- An area display control unit 1805 is provided.
- the screen display control unit 180 has a display selection menu 174, a power system / area selection menu 175 at the right end of the first display area, or a menu, command, data input by operating a mouse or a keyboard, and simulated autonomous distributed power monitoring. Necessary information is output and displayed at a predetermined position on the display unit 170 at a predetermined timing based on the calculation result regarding the monitoring target by the control device 110 and the value of the database 15.
- the screen display control unit 180 takes into account the geographical or relative positional relationship for each cell, the state of the customer, the weather conditions, etc. for the cell display of the cell region 1721 of the first display region of the display unit 170, Calculations are performed in consideration of the influence from a plurality of spots, and the calculation results are displayed in cell units.
- the cell has a large area compared to the display of the line, so that the display can be easily seen by the observer. This is because the entire power distribution system and the power in the vicinity of the distribution system using a plurality of cells are used. It is suitable for showing a tendency. Or it is suitable for the display for calling out some attention.
- energy system lines 1711 and 1712 capable of selecting at least one of the voltage, current, and phase of the power system, and a display element 1713 capable of selecting display contents of a phenomenon occurring in the power system.
- a display element 1713 capable of selecting display contents of a phenomenon occurring in the power system.
- the state quantity is displayed in a different “color display”, for example, a different color, for each display cell, depending on the strength, height, and the like. That is, at least one attribute of hue, saturation, and brightness is changed and displayed according to the value of the state quantity color. For example, as commonly used in other fields, a strong or high state quantity such as a high voltage is displayed in a warm color, and a low state quantity such as a low voltage is displayed. If the low state is displayed in a cold color, the operator can easily recognize the change in the state quantity of each display cell.
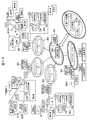
- FIG. 6 is a diagram illustrating an example of a hierarchical structure of power system information displayed on the display unit 170 in the first embodiment.
- This electric power system may cover, for example, the entire electric power system of a certain electric power company, or may cover an electric power system in a specific range.
- the power system has a plurality of backbone systems, a plurality of high voltage systems 2 constituting the backbone system, and a plurality of low voltage systems 6 (6-1 to 6-n, 60a to 60n belonging to each high voltage system. ) Can be selectively displayed at the upper, middle, and lower levels.
- the lowest level low-pressure system 60 (60a-60n) is displayed in a one-to-one correspondence with the final customer 7 (7a-7n), and the medium-level low-pressure system 6 (6-1) is displayed. 6 to n), lower-level information is displayed in a reduced manner, and medium-level information is further reduced and displayed in a higher level.
- the configuration of the simulation model unit in FIG. 3A is displayed on the display unit 170 as it is. Therefore, the operator can select power system information at an arbitrary hierarchical level and display it on the screen.
- control unit on the distribution system simulation apparatus 10 corresponding to the cell unit in the screen display area is defined as a control cell
- the distribution of the simulation unit 9 may be different depending on the purpose of the simulation. For example, in addition to the standard pattern as shown in FIG. 3A, it is possible to easily distinguish a consumer who needs to supply power preferentially in response to an emergency and other general consumers with a control cell. An emergency pattern may be prepared.
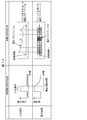
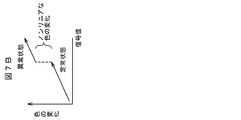
- FIG. 7A and 7B are diagrams illustrating an example of a display method of the display unit 170 in the first embodiment.
- the display unit 170 displays the positions of two points of the power system and displays signal characteristics between the two points.
- the phenomenon occurring in the power system is displayed by converting the temporal and area resolution. For example, when a signal change is replaced with a color change using a plurality of display cells, a linear change is made in a steady state. However, as shown in FIG. Color pop).
- a function for displaying the abnormal operation so as to be obvious at a glance is provided.
- the abnormality there is an abnormality in state quantities such as voltage, current, frequency, and power flow.
- the power flow peculiar to the power is visualized as a flow (arrow flow) on the system line.
- a voltage profile peculiar to electric power may be graphed in association with a system line.
- the phenomenon occurring in the electric power system including the cause of the abnormality is converted and displayed in terms of temporal and area resolution.
- the first display area system line display control unit 1802 and the first display area system cell area display control 1803 can improve visibility by including the following means and methods. it can.
- the first display area system line display control unit 1802 and the first display area system cell area display control 1803 have a function of converting temporal and area resolution.
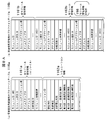
- FIG. 8A is a diagram illustrating a configuration example of a profile table in the first embodiment, where (a) is an example of a profile table 116a of a customer load simulation unit 80, and (b) is an autonomous distributed system. It is an example of the profile table 116b of the state management part 1130. The operator can input data regarding necessary profile items from the control terminal 17 via the input reception screen.
- the profile table 116a of the consumer load simulation part 80 is comprised including the own module attribute information 1161a and the simulation information 1162a.
- the own module attribute information 1161a includes information for specifying the own module such as a module ID, a module type ID, a module application ID, a time stamp ID, an IP address, a branch branch ID, and a module geographic coordinate.
- Simulation information 1162a includes simulation ID, current time, grid voltage, grid voltage time, wattmeter / forward current measurement value, wattmeter / forward current measurement time, wattmeter / reverse current measurement value, wattmeter / reverse current measurement time, etc. , Composed of information indicating the status of the simulation.
- the simulation ID is information for identifying the execution of the simulation
- the current time is the time at the time of the simulation execution
- the system voltage is the value of the voltage applied to the customer 7 simulated by the own module
- the system voltage The time is the time when the system voltage is acquired.
- the wattmeter / forward current measurement value and the wattmeter / reverse current measurement value are respectively the forward and reverse flow energy measurements obtained from the smart meter 71 of the customer 7 simulated by the module. Value.
- the simulation information 1162a is information for the module application 111 of the own module to provide information indicating the simulation status to the outside in the simulation.
- the profile table 116a of the customer load simulation unit 80 is an example of the profile table 116a of the customer load simulation unit 80, but the profile table 116 of the distributed power supply simulation unit 90 can be applied with the same configuration.
- the profile table 116b of the autonomous distributed system state management unit 1130 includes own module attribute information 1161b and module management information 1162b.
- the profile table 116b of the autonomous distributed system state management unit 1130 corresponds to information stored in the module management information storage unit 198 of the autonomous distributed system state management unit 1130 in FIG. 3A.
- FIG. 8B is a diagram illustrating an example of an execution procedure of the power system simulation according to the first embodiment.
- the distribution system simulation 10 is started when each of the customer load simulation unit 80 and the distributed power supply simulation unit 90 transmits a module activation message to the autonomous distributed system state management unit 1130 (S01).
- the module activation message is a message indicating that each of the customer load simulation unit 80 and the distributed power supply simulation unit 90 has started execution of the program of its own module.
- the autonomous distributed system state management unit 1130 determines the module configuration to be simulated based on the received module activation message (S02).
- time information for executing the simulation is transmitted to the customer load simulation unit 80 and the distributed power supply simulation unit 90 to be managed by simulation (S03).
- Each of the customer load simulation unit 80 and the distributed power supply simulation unit 90 calculates load power or generated power (S04), and sends the load power or generated power obtained by the calculation to the autonomous distributed system state management unit 1130. Transmit (S05).
- the autonomous distributed system state management unit 1130 aggregates the load power and the generated power for each service line 6 and calculates the total load power 201 for the pole transformer 5 connected to the service line 6 (S06).
- the calculated total load power 201 is transmitted to the tidal current calculation cooperation unit 1120 (S07).
- the power flow calculation cooperation unit 1120 attaches the total load power 201 to the power distribution system power flow calculation unit 1100, and instructs power flow calculation in the distribution line 2 (S08).
- the distribution system power flow calculation unit 1100 executes the power flow calculation of the instructed power (S09), and as a result, the autonomous distributed system state management unit 1130 receives voltage values (hereinafter, referred to as “voltage values” at each point on the distribution line 2). (Referred to as system voltage) is output (S10).
- the autonomous distributed system state management unit 1130 transmits the system voltage to each of the customer load simulation unit 80 and the distributed power supply simulation unit 90 (S11), and determines whether to end the simulation (15). If the simulation is not terminated, the process from S03 is repeated until the process from S03 is terminated.
- In-distribution-system occurrence phenomenon calculation unit 1110 in conjunction with the operation of autonomous distributed system state management unit 1130, displays the measured value of display cell 1721 corresponding to the module to be displayed, data such as weather information, and the like. Obtained from the supervisory control device 110 (S12), it is calculated as a phenomenon occurring in units of display cells 1721 to be displayed (S13). This calculation result is sent to the screen display control unit 180 via the autonomous distributed system state management unit 1130, and information is displayed on the display cell 1721 (S14).
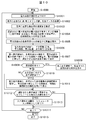
- FIG. 9 shows an example of the power adjustment procedure by the power system simulation according to the first embodiment.
- control parameters initial settings / changes
- set measurement / monitoring values and weather data are acquired (S902)
- a simulation is performed under the set conditions. That is, a calculation such as a phenomenon (three-phase imbalance / active power / reactive power) occurring in the specified power system is performed (S903).
- S904 it is determined whether the voltage of each spot and each grid in the power system is within a predetermined range (S904). If it is not within the range, the simulation is performed after changing the control parameters of the SVC / PCS so as to be within the range (S905).
- the determination result is NO in S911, it is next determined whether or not power interchange from another power system is possible (S913). As a result of the determination, if possible, the process proceeds to S919. On the other hand, if not possible, it is next determined whether it takes time to recover from the accident of the power system (S914). If it does not take time, a recovery process is performed (S915), and the process ends (S916). If time is required, emergency processing such as emergency measures is performed (S917), and the process ends (S918).
- the selection of the power system is accepted (S1001). That is, selection of a power system or a distribution system (hereinafter simply referred to as a power system) to be displayed is accepted by the power system / area selection menu 175 or the like in the first display area 171 of the display unit 170. Then, measurement / monitoring values, weather data, and the like necessary for displaying the selected power system or distribution system (hereinafter, the power system) are acquired (S1002). Next, a calculation value for control necessary for display is acquired (S1003). Furthermore, information on a phenomenon occurring in the power system selected by the display selection menu 174 or the like in the first display area 171 is acquired (S1004).
- a power system or a distribution system hereinafter simply referred to as a power system
- the values of phenomena such as three-phase unbalance, active power, reactive power values, and other state quantities are acquired in units of control cells. Then, the state quantity is calculated in units of each display cell in the power system (S1005). Also, information on the control mode in the power system (normal, power limitation, power interchange, emergency, etc.) is acquired (S1006). Then, in the first display area 171 of the display unit 170, the phenomenon and the state quantity occurring in the power system are displayed for each display cell unit using the display elements that can be selected by overlapping the power system line. (S1007). If there is a section selection for the power system (S1008), the signal characteristics of the section specified in the second display area 172 are displayed (S1009).
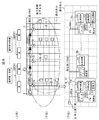
- FIG. 11A the operator selects one power system or wiring system to be displayed from the power system / area selection menu 175 in the first display area 171 of the display unit 170, and displays “power system voltage” from the display selection menu 174.
- the screen of the first display area 171 when “distribution” is selected is shown. In this screen, an arrow or the like indicates that a reverse power flow is occurring in the distribution line 2 in the selected wiring system. This is a case where the determination in S904 in FIG. 9 is NO.
- This reverse power flow generation state can also be grasped from the energy distribution diagram between points AB of the distribution line 2 displayed in the second display area 172.
- voltage distribution is also displayed in units of each display cell.
- the situation shown in FIG. 11B can be considered as the cause of the reverse power flow. That is, in the area including the point X, the number of households where the photovoltaic power generation system as a distributed power source is installed is larger than in other areas. Therefore, the amount of generated power exceeds the amount of power consumed in the daytime when the amount of sunlight is large. This is a case where the voltage value exceeds the control allowable value of 107V.
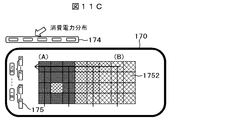
- the operator operates the display selection menu 174 to display “power consumption distribution” on the screen of the first display area 171 in a state where the reverse power flow is occurring. This is the state of FIG. 11C, and it can be seen that there is much demand for “power consumption” on the side closer to the point A.
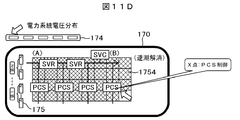
- the operator changes the control parameters of the SVC at each point including the PCS and the X point so that the voltage values of the distribution line 2 and the lead-in line 6 are within the range of the control allowable value in the entire region.
- the simulation is performed again. This is processing corresponding to S905 and S906 in FIG. Whether or not the voltage value of the distribution line 2 or the lead-in line 6 has fallen within the control allowable value range in the entire area due to the change of the control parameter or the like is selected and displayed on the screen of the first display area 171. This can be confirmed.
- FIG. 11D shows a state in which power adjustment is performed in this way.
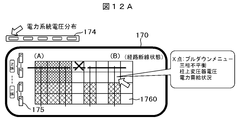
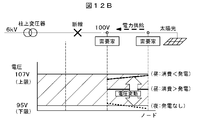
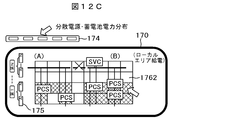
- FIG. 12A the fact that a disconnection has occurred in the wiring system selected by the operator is indicated by a cross in the middle of the distribution line 2.
- the local area “power system voltage distribution” on the upstream side and downstream side of the point where the disconnection occurs is also displayed.
- the operator takes emergency measures using a distributed power source, a storage battery, and an electric vehicle.
- the operator operates the display selection menu 174 to display “distributed power source / battery power distribution” on the screen of the first display area 171. This is the state of FIG.
- distributed power / battery power can be used at a plurality of points upstream and downstream of the point where the disconnection occurs.
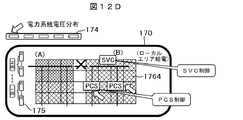
- the operator can individually control the voltage values of the distribution line 2 and the lead-in line 6 in the entire local area in the local area upstream and downstream of the point where the disconnection occurs.
- the simulation is performed again after changing the control parameters of the SVC at each point including the PCS and the X point so as to fall within the range of. This is, for example, processing corresponding to S907 and S908 (or S915 and S917) of FIG.
- FIG. 12D shows a state in which power adjustment is performed in this way.
- simulation apparatus of the present invention needs to have a function of outputting the above information to the display unit 170, but the specific configuration of the simulation apparatus itself is not limited to that described with reference to FIGS. 3A and 3B. Needless to say.
- the display of the display unit 170 with excellent visibility is used for the problems of complicating tidal current management due to difficulty in grasping the amount of power generated by distributed power sources and difficulty in grasping the actual load of each general consumer. By repeating the simulation, it is possible to develop a system that can operate the power system stably and appropriately.
- FIG. 13 is a diagram showing an example of the overall configuration of the power system control apparatus according to the second embodiment of the present invention. That is, the power system control apparatus of the present embodiment is an apparatus in which the power system simulation apparatus of the first embodiment is incorporated in the power system control apparatus that controls the “distribution system” in the actual power system (real system). is there.
- the power system control apparatus 102 includes a real system online monitoring control program 200, and is configured to be able to control the real power distribution systems A to N to be controlled. That is, the power system control apparatus of the present embodiment has both a control function for the real system as shown in FIG. 2 and a control function for the simulation model as shown in FIG.
- the control function for the real system is basically the same as the control function for the simulation model described in the first embodiment, whether the data to be handled is an actual value or a simulation value, and the real system
- the configuration and data corresponding to the simulation model are sequentially updated. Therefore, in the following, the description will be focused on matters specific to the control function for the actual system.
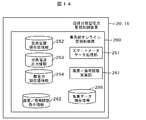
- FIG. 14 is a diagram illustrating an example of functional blocks of the control unit 20 of the power system control apparatus 102 according to the second embodiment.
- the control unit 20 can be realized by a computer including a CPU and a storage device such as a RAM or a hard disk device.
- the autonomous distributed power monitoring and control device 200 of the control unit 20 includes a smart meter data processing unit 251 and a demand / load adjustment execution unit 261, and further, as a database, load device current value information 252, distributed power supply output information 253, storage battery Current value information 254, weather data current value, etc. 255 are stored. Further, the demand / load adjustment command information 262 is held.
- the autonomous decentralized power monitoring and control apparatus 200 enables calculation of a distributed power supply possible capacity, a voltage distribution at the time of distributed power supply connection, a short-circuit capacity, and the like using power flow calculation.
- data such as utility poles, high-voltage lines, switches, voltage regulators, etc. are automatically imported, enabling analysis and control in line with the actual situation.
- Power company servers collect electricity usage and reverse power flow from smart meters in each home at appropriate time intervals, and collect various information from sensors of various devices attached to the power system. It is possible to perform voltage management in the distribution line using the estimated information calculated based on some algorithm based on the collected information and the collected information.
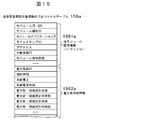
- FIG. 15 is a diagram showing a configuration example of a profile table of customer load current value information in the second embodiment. This table is different in that real system data is held instead of the simulation values of the table shown in FIG. 8A.
- FIG. 16 is a diagram illustrating an example of a power adjustment procedure by the power system control apparatus according to the second embodiment.
- control parameters initial setting / change
- measurement / monitoring values and weather data of the actual system are acquired (S1602).
- calculations such as phenomena (three-phase unbalanced / active power / reactive power) occurring in the actual power system are performed (S1603).
- the processing result of the built-in power system simulation apparatus may be adopted. Then, it is determined whether the power supply amount of each spot and each grid in the power system is sufficient (S1606). If not, the parameter of the power generation output of the distributed power source in the power system is adjusted so as to be within the range, and the control parameter of the SVC / PCS is changed (S1607). At this time, the processing result of the built-in power system simulation apparatus may be adopted. Then, it is determined whether the power supply amount in the power system is sufficient (S1608). If not, the control parameter is changed so as to limit the allowable load in the power system to the limit amount (S1609). At this time, the processing result of the built-in power system simulation apparatus may be adopted.
- S110 determines whether or not power interchange from another power system is possible. As a result of the determination, if possible, the process proceeds to S1613. On the other hand, if it is not possible, it is next determined whether it takes time to recover from the accident of the power system (S1614). If it does not take time, a recovery process is performed (S1615), and the process ends (S1616). If time is required, emergency processing such as emergency measures is performed (S1617), and the process ends (S1618).
- control device 200 grasps the voltage distribution of the entire distribution system by power flow calculation.
- the control amount of each device is determined using optimal calculation. As a result, it is possible to perform control sharing in which each device responds locally to suppress voltage fluctuations in a short cycle, and the monitoring and control device instructs the overall control for long cycle fluctuations.
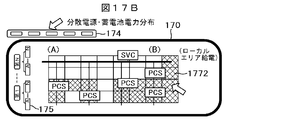
- FIG. 17A the operator selects one power system or wiring system to be displayed from the power system / area selection menu 175 in the first display area 171 of the display unit 170, and displays “power system voltage” from the display selection menu 174.
- the screen of the first display area 171 when “distribution” is selected is shown. In this screen, it is displayed that an excessive voltage is generated in a specific area. This is a case where the determination in S1604 of FIG. 16 is NO.
- voltage distribution is also displayed in units of each display cell.
- the operator clicks the display element 1713 in the display cell in the area where the voltage distribution is high, for example, to know the state of the R point, and the data at that point is clicked.
- the details can be confirmed by selecting from the pull-down menu and displaying it in the third display area 173. Therefore, the operator operates the display selection menu 174 to display “distributed power source / battery power distribution” on the screen of the first display area 171 in a state where the excessive voltage is generated. This is the state of FIG. 17B, and it can be seen that there is much demand for “power consumption” in a plurality of areas.
- the operator changes the SVC control parameters at each point including the PCS and the X point so that the voltage value of the distribution line 2 and the lead-in line 6 is within the control allowable value range in all regions.
- the control parameters of the actual SVC are changed. This is processing corresponding to S1605 and S1626 in FIG. Whether or not the voltage value of the distribution line 2 or the lead-in line 6 has fallen within the control allowable value range in the entire area due to the change of the control parameter or the like is selected and displayed on the screen of the first display area 171. This can be confirmed.
- FIG. 17C shows a state in which power adjustment is performed in this way.
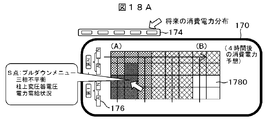
- FIG. 17A the operator selects one power system or wiring system to be displayed from the power system / area selection menu 175 in the first display area 171 of the display unit 170, and displays “future consumption” from the display selection menu 174.
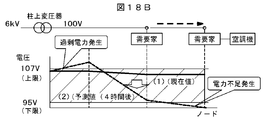
- the screen of the 1st display area 171 at the time of selecting "electric power distribution" is shown. In this screen, for example, it is displayed that an excessive voltage and power shortage have occurred in a specific area after 4 hours. That is, the voltage distribution is also displayed in the first display area 171 in units of each display cell.
- the 18B also shows a graph of the degree of excess voltage and power shortage along the wiring system. This is a case where the determination in S1604 of FIG. 16 is NO.
- the operator clicks on the display element 1713 to know the state of, for example, the R point in the display cell in the region where the voltage distribution is high, in order to investigate the factors that are expected to cause excess voltage and power shortage.
- the data at the point can be selected from the pull-down menu and displayed in the third display area 173 to confirm the details. Therefore, the operator operates the display selection menu 174 to display “distributed power / battery power distribution” on the screen of the first display area 171 in a state where the excessive voltage is generated.
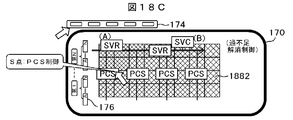
- the operator changes the SVC control parameters at each point including the PCS and the X point so that the voltage value of the distribution line 2 and the lead-in line 6 is within the control allowable value range in all regions.
- the control parameters of the actual SVC are changed. This is processing corresponding to S1605 and S1626 in FIG. Whether or not the voltage value of the distribution line 2 or the lead-in line 6 has fallen within the control allowable value range in the entire area due to the change of the control parameter or the like is selected and displayed on the screen of the first display area 171. This can be confirmed.
- FIG. 18C shows a state in which power adjustment is performed in this way.
- the simulation using the display of the display unit 170 with excellent visibility is used together, so that the distributed power supply to the distribution system can be performed. Even when mass introduction is advanced, it is possible to secure voltage control technology that can quickly take measures against voltage rise and fluctuation due to fluctuations in output power, and to maintain stable power quality.
- the display of the display unit 170 with excellent visibility is used for the problems of complicating tidal current management due to difficulty in grasping the amount of power generated by distributed power sources and difficulty in grasping the actual load of each general consumer. By using the simulation together, it becomes possible to operate the power system stably and appropriately.
- FIG. 19 is a diagram showing an overall configuration example of a smart grid incorporating the power system simulation apparatus according to the embodiment of the present invention, according to the third embodiment of the present invention.
- the example based on the control in units of “distribution system” has been described.
- the present invention is not limited to the system configuration, and is widely used for various power system configurations. Available.
- the present invention can also be applied to control in units of microgrids.
- a backbone system connected to each of hydropower, thermal power, and nuclear power plants is connected to microgrids A to N, and each microgrid includes an autonomous distributed power monitoring control device 90.
- a natural gas private power generation device 840 As the distributed power source, a natural gas private power generation device 840, a mega solar 850, a solar power generation device 860, and a wind power generation device 870 are installed.
- the target of control is not only the power system but also the entire energy supply system including the gas supply system line.
- Information about the energy of each customer 7 is collected through a smart meter.
- Distribution lines are generally divided into a high voltage system (6 kV) and a low voltage system (100 V) after being stepped down by a columnar transformer.
- General consumers are connected to a low voltage (100 V), and large consumers such as factories are connected to a high voltage system (6 kV).
- Solar cells (PV) are installed for both general and large-scale importance.
- FIG. 20 is a diagram illustrating an example of functional blocks of the control unit of the power system control apparatus 102 according to the third embodiment and an example of a display method on the display unit. It is desirable that the information displayed on the display unit 170 be provided not only to the operator who monitors and controls the power system, but also to the consumers in the microgrid with a possible range of hands. That is, the information displayed on the display unit 170 is processed, and can be viewed on the consumer terminal 2012 in the microgrid via the website 2000 and the Internet 2010. Information disclosed on the screen of the terminal 2012 can be provided as detailed information in accordance with the actual situation in each microgrid, and by adding a message such as “request for power saving cooperation” to this, It can contribute to the effective use of electric power and energy.
- a message such as “request for power saving cooperation”
- the simulation results according to the second and third embodiments of the present invention can be used not only as a display screen of a simulation apparatus but also for display and maintenance management in various fields.
- the terminal 2012 can be used by an operator who performs monitoring and control of the power system for browsing through a communication network such as the Internet 2010 at an arbitrary place. Or it can also utilize in order to improve work efficiency by the operator in connection with the maintenance management of an electric power system comparing the browsing screen of the terminal 2012, and the actual apparatus which is the object of browsing.
- the signal processing function of the simulator and the function of displaying the result through the network the following advantages can be realized.
- the device configuration for executing the processing can be arbitrarily selected / changed / updated.
- the simulation apparatus of this embodiment may be constructed using a data center or cloud computing spread globally on the Internet.
- the user uses a client such as an information terminal and a browser running on the client to connect to the simulation apparatus of the present embodiment, browse the simulation result, and power the entire region as well as individual consumers.
- System information may also be used. That is, a terminal having a display function can be arbitrarily selected as long as it can display the same data format.
- an HTML language Hyper text markup language
- the power system of each of the embodiments described above is actually made by wiring an electrical conductor along a path. If it is the earth's surface, install a pole such as a utility pole to route the cable. If it is underground, prepare a route similar to the underground tunnel and route the cable. These routes can be represented superimposed on a global geodetic map using GPS, such as Google Maps (registered trademark), car navigation, or satellite photographs, as created by public institutions and private companies. it can. Since these maps are very commonly used to represent two-dimensional positional relationships, the power system with the positions of wiring, utility poles, underground cables, etc.
- real maps displayed on these maps.
- the present invention employs a coordinate system on a virtual map (hereinafter referred to as a virtual map) in order to place importance on the connection between the power system and the energy system, and the relative positional relationship on the virtual map.
- the display unit called a display cell which has the map function which represents is characterized by the above-mentioned.
- the real system diagram and the power system diagram and energy system diagram on the simulator shown in FIGS. 2 and 3 have a coordinate system on the virtual map.
- the present invention does not exclude the display format based on the actual map as described above.
- a coordinate conversion function for performing a coordinate conversion process between the coordinate system of the virtual map and the coordinate system of the real map, A database of map information, customer addresses, etc. is required.
- the display cell can be provided with a switching unit that can switch, for example, data related to the same power system between a cell-based display on a virtual map and a map-based display on a real map. In this way, display according to the tastes of various observers can be easily realized.
- Distributed power supply simulation unit 100 ... Power system simulation device, 102 ... Power system control device, 131 ... EMS, 132 ... CEMS, 170 ... Display screen, 1 DESCRIPTION OF SYMBOLS 1 ... 1st display area, 172 ... 2nd display area, 173 (173A-173C) ... 3rd display area, 174 ... Display selection menu, 175 ... Electric power system / area selection menu, 176 ... Displayable selection element, 177 ... Time display field, ..., 180 ... Screen display control part, ... 1110 ... Distribution system power flow calculation part, 1120 ... Power flow calculation cooperation part, 1130 ... Autonomous distributed system state management part, 1710 ... Energy system diagram display function part , 1711 ... system line, 1712 ... system line, 1713 ... display element, 1720 ... map item display function part, 1721 ... cell area.
Landscapes
- Engineering & Computer Science (AREA)
- Power Engineering (AREA)
- Physics & Mathematics (AREA)
- General Physics & Mathematics (AREA)
- Theoretical Computer Science (AREA)
- Remote Monitoring And Control Of Power-Distribution Networks (AREA)
- Supply And Distribution Of Alternating Current (AREA)
Abstract
Priority Applications (3)
| Application Number | Priority Date | Filing Date | Title |
|---|---|---|---|
| US14/377,021 US10090704B2 (en) | 2012-02-21 | 2012-02-21 | Display device and display method of electric power system information |
| JP2014500786A JP5802324B2 (ja) | 2012-02-21 | 2012-02-21 | 電力系統情報の表示装置及び表示方法 |
| PCT/JP2012/054169 WO2013124973A1 (fr) | 2012-02-21 | 2012-02-21 | Dispositif permettant d'afficher des informations de système de puissance électrique, et procédé permettant d'afficher des informations de système de puissance électrique |
Applications Claiming Priority (1)
| Application Number | Priority Date | Filing Date | Title |
|---|---|---|---|
| PCT/JP2012/054169 WO2013124973A1 (fr) | 2012-02-21 | 2012-02-21 | Dispositif permettant d'afficher des informations de système de puissance électrique, et procédé permettant d'afficher des informations de système de puissance électrique |
Publications (1)
| Publication Number | Publication Date |
|---|---|
| WO2013124973A1 true WO2013124973A1 (fr) | 2013-08-29 |
Family
ID=49005196
Family Applications (1)
| Application Number | Title | Priority Date | Filing Date |
|---|---|---|---|
| PCT/JP2012/054169 Ceased WO2013124973A1 (fr) | 2012-02-21 | 2012-02-21 | Dispositif permettant d'afficher des informations de système de puissance électrique, et procédé permettant d'afficher des informations de système de puissance électrique |
Country Status (3)
| Country | Link |
|---|---|
| US (1) | US10090704B2 (fr) |
| JP (1) | JP5802324B2 (fr) |
| WO (1) | WO2013124973A1 (fr) |
Cited By (17)
| Publication number | Priority date | Publication date | Assignee | Title |
|---|---|---|---|---|
| JP2015076995A (ja) * | 2013-10-09 | 2015-04-20 | 富士通株式会社 | 不平衡判定プログラム、不平衡判定方法および不平衡判定装置 |
| JP2015080401A (ja) * | 2013-10-17 | 2015-04-23 | ゼネラル・エレクトリック・カンパニイ | 電気ネットワークを制御するための方法およびシステム |
| WO2015072531A1 (fr) * | 2013-11-15 | 2015-05-21 | 株式会社エプセル | Dispositif de gestion de génération de puissance solaire |
| JP2016082631A (ja) * | 2014-10-10 | 2016-05-16 | 富士通株式会社 | 不等率の算出方法、不等率の算出プログラム及び不等率の算出装置 |
| CN106250015A (zh) * | 2016-07-25 | 2016-12-21 | 珠海市魅族科技有限公司 | 一种移动终端及控制方法 |
| JP2017046506A (ja) * | 2015-08-28 | 2017-03-02 | 株式会社日立製作所 | 電圧無効電力制御システム |
| JP2017147875A (ja) * | 2016-02-18 | 2017-08-24 | 富士電機株式会社 | 無効電力出力装置、無効電力出力装置の制御方法及び電力システム |
| CN108122172A (zh) * | 2014-10-30 | 2018-06-05 | 卢润湖 | 一种展示分布式电力使用情况的系统 |
| WO2018181598A1 (fr) * | 2017-03-28 | 2018-10-04 | 東芝エネルギーシステムズ株式会社 | Système de surveillance, dispositif de fourniture d'informations d'image, dispositif de commande client, programme de fourniture d'informations d'image et programme de commande client |
| JP2019083662A (ja) * | 2017-10-31 | 2019-05-30 | 中国電力株式会社 | 配電系統管理支援システムおよび配電系統管理支援方法 |
| JP2019208304A (ja) * | 2018-05-28 | 2019-12-05 | 三菱電機株式会社 | 電力制御装置、電力制御システム、無効電力制御器および電力制御方法 |
| KR20190137429A (ko) * | 2018-06-01 | 2019-12-11 | 한국전력공사 | 전력계통의 계층적 시각화 시스템 및 방법 |
| CN112130015A (zh) * | 2020-09-08 | 2020-12-25 | 中国联合网络通信集团有限公司 | 一种配电设备的智能监测故障分析方法和系统 |
| JP2023044242A (ja) * | 2021-09-17 | 2023-03-30 | 中国電力株式会社 | 電圧不平衡抑制支援方法、及び電圧不平衡抑制支援装置 |
| JP2023114283A (ja) * | 2022-02-04 | 2023-08-17 | 東芝エネルギーシステムズ株式会社 | 電力系統解析システム、および、プログラム |
| JP2023152340A (ja) * | 2022-04-04 | 2023-10-17 | トヨタ自動車株式会社 | 予測方法および予測装置 |
| JP7620167B1 (ja) * | 2023-10-04 | 2025-01-22 | 日本碍子株式会社 | 電圧調整器選定装置、電圧調整器選定プログラム、および、電圧調整器選定方法 |
Families Citing this family (11)
| Publication number | Priority date | Publication date | Assignee | Title |
|---|---|---|---|---|
| US9893524B2 (en) * | 2012-12-20 | 2018-02-13 | Abb Schweiz Ag | Coordinated control method of generator and SVC for improving power throughput and controller thereof |
| CN105408898B (zh) * | 2013-03-15 | 2019-05-28 | 弗兰克公司 | 测量数据的自动记录和图形生成 |
| US9613359B2 (en) * | 2014-02-18 | 2017-04-04 | San Diego Gas & Electric Company | Distribution interconnection information systems and methods |
| US10257100B2 (en) | 2016-05-04 | 2019-04-09 | University of Conneticut | Enabling resilient microgrid through ultra-fast programmable network |
| CN110112827A (zh) * | 2019-04-25 | 2019-08-09 | 宁波天灵信息科技有限公司 | 分布式电源信息采集系统 |
| JP7311319B2 (ja) * | 2019-06-19 | 2023-07-19 | ファナック株式会社 | 時系列データ表示装置 |
| KR102544189B1 (ko) | 2020-12-21 | 2023-06-16 | 주식회사 그리드위즈 | 분산 전원 조류 해석 시스템 및 해석 방법 |
| CN115543139B (zh) * | 2022-10-18 | 2026-03-13 | 广东电网有限责任公司 | 一种配网线路的馈线组网图生成方法及相关装置 |
| CN118116179B (zh) * | 2024-04-11 | 2024-09-10 | 中电装备山东电子有限公司 | 一种智能集中器 |
| CN121866964A (zh) * | 2024-10-15 | 2026-04-17 | 江苏东成园林机械有限公司 | 一种多功能车辆、园林作业车辆及骑乘式割草机 |
| CN120338443B (zh) * | 2025-06-18 | 2025-08-19 | 国网湖北省电力有限公司经济技术研究院 | 计及自然灾害的配网-微网韧性提升鲁棒规划方法及装置 |
Citations (6)
| Publication number | Priority date | Publication date | Assignee | Title |
|---|---|---|---|---|
| JPH10283589A (ja) * | 1997-04-08 | 1998-10-23 | Alpine Electron Inc | ナビゲーション装置における道路混雑状況表示方法 |
| JPH11206016A (ja) * | 1998-01-08 | 1999-07-30 | Mitsubishi Electric Corp | 負荷予測方法および負荷状況表示方法 |
| JP2000287388A (ja) * | 1999-03-31 | 2000-10-13 | Hitachi Ltd | グラフイックユーザインタフェース |
| JP2004108846A (ja) * | 2002-09-17 | 2004-04-08 | Aisin Aw Co Ltd | 渋滞情報表示システム |
| JP2009089594A (ja) * | 2007-09-28 | 2009-04-23 | Kankoku Denryoku Kosha | 検針データを利用した電力設備の時空間負荷分析システム及び負荷の計算方法 |
| JP2012005210A (ja) * | 2010-06-15 | 2012-01-05 | Hitachi Ltd | 配電系統潮流シミュレーション装置、配電系統潮流シミュレーション方法およびそのプログラム |
Family Cites Families (7)
| Publication number | Priority date | Publication date | Assignee | Title |
|---|---|---|---|---|
| US20020032535A1 (en) * | 1998-03-19 | 2002-03-14 | James O. Alexander | Energy information management method for use with a circuit breaker |
| JP4069541B2 (ja) | 1999-03-19 | 2008-04-02 | 富士電機ホールディングス株式会社 | 電力系統情報の表示方法 |
| US6549880B1 (en) * | 1999-09-15 | 2003-04-15 | Mcgraw Edison Company | Reliability of electrical distribution networks |
| US8321804B2 (en) * | 2007-07-26 | 2012-11-27 | Areva T & D, Inc. | Methods for assessing reliability of a utility company's power system |
| WO2009117741A1 (fr) * | 2008-03-21 | 2009-09-24 | The Trustees Of Columbia University In The City Of New York | Centres de contrôle d'aide à la décision |
| JP5618511B2 (ja) | 2009-09-08 | 2014-11-05 | 株式会社東芝 | スマートグリッド及びマイクログリッド向け総合監視制御システム |
| JP5492501B2 (ja) * | 2009-09-09 | 2014-05-14 | 中国電力株式会社 | 電力供給制御システム |
-
2012
- 2012-02-21 WO PCT/JP2012/054169 patent/WO2013124973A1/fr not_active Ceased
- 2012-02-21 JP JP2014500786A patent/JP5802324B2/ja not_active Expired - Fee Related
- 2012-02-21 US US14/377,021 patent/US10090704B2/en active Active
Patent Citations (6)
| Publication number | Priority date | Publication date | Assignee | Title |
|---|---|---|---|---|
| JPH10283589A (ja) * | 1997-04-08 | 1998-10-23 | Alpine Electron Inc | ナビゲーション装置における道路混雑状況表示方法 |
| JPH11206016A (ja) * | 1998-01-08 | 1999-07-30 | Mitsubishi Electric Corp | 負荷予測方法および負荷状況表示方法 |
| JP2000287388A (ja) * | 1999-03-31 | 2000-10-13 | Hitachi Ltd | グラフイックユーザインタフェース |
| JP2004108846A (ja) * | 2002-09-17 | 2004-04-08 | Aisin Aw Co Ltd | 渋滞情報表示システム |
| JP2009089594A (ja) * | 2007-09-28 | 2009-04-23 | Kankoku Denryoku Kosha | 検針データを利用した電力設備の時空間負荷分析システム及び負荷の計算方法 |
| JP2012005210A (ja) * | 2010-06-15 | 2012-01-05 | Hitachi Ltd | 配電系統潮流シミュレーション装置、配電系統潮流シミュレーション方法およびそのプログラム |
Cited By (26)
| Publication number | Priority date | Publication date | Assignee | Title |
|---|---|---|---|---|
| JP2015076995A (ja) * | 2013-10-09 | 2015-04-20 | 富士通株式会社 | 不平衡判定プログラム、不平衡判定方法および不平衡判定装置 |
| JP2015080401A (ja) * | 2013-10-17 | 2015-04-23 | ゼネラル・エレクトリック・カンパニイ | 電気ネットワークを制御するための方法およびシステム |
| JPWO2015072531A1 (ja) * | 2013-11-15 | 2017-03-16 | 株式会社エプセル | 太陽光発電管理装置 |
| WO2015072531A1 (fr) * | 2013-11-15 | 2015-05-21 | 株式会社エプセル | Dispositif de gestion de génération de puissance solaire |
| US9520722B2 (en) | 2013-11-15 | 2016-12-13 | Epsel Co., Ltd. | Solar power generation management apparatus |
| JP2016082631A (ja) * | 2014-10-10 | 2016-05-16 | 富士通株式会社 | 不等率の算出方法、不等率の算出プログラム及び不等率の算出装置 |
| CN108122172A (zh) * | 2014-10-30 | 2018-06-05 | 卢润湖 | 一种展示分布式电力使用情况的系统 |
| JP2017046506A (ja) * | 2015-08-28 | 2017-03-02 | 株式会社日立製作所 | 電圧無効電力制御システム |
| US10283961B2 (en) | 2015-08-28 | 2019-05-07 | Hitachi, Ltd. | Voltage and reactive power control system |
| JP2017147875A (ja) * | 2016-02-18 | 2017-08-24 | 富士電機株式会社 | 無効電力出力装置、無効電力出力装置の制御方法及び電力システム |
| CN106250015A (zh) * | 2016-07-25 | 2016-12-21 | 珠海市魅族科技有限公司 | 一种移动终端及控制方法 |
| JPWO2018181598A1 (ja) * | 2017-03-28 | 2020-02-06 | 東芝エネルギーシステムズ株式会社 | 監視システム、画像情報提供装置、クライアント制御装置、画像情報提供プログラム、及びクライアント制御プログラム |
| WO2018181598A1 (fr) * | 2017-03-28 | 2018-10-04 | 東芝エネルギーシステムズ株式会社 | Système de surveillance, dispositif de fourniture d'informations d'image, dispositif de commande client, programme de fourniture d'informations d'image et programme de commande client |
| JP2019083662A (ja) * | 2017-10-31 | 2019-05-30 | 中国電力株式会社 | 配電系統管理支援システムおよび配電系統管理支援方法 |
| JP2019208304A (ja) * | 2018-05-28 | 2019-12-05 | 三菱電機株式会社 | 電力制御装置、電力制御システム、無効電力制御器および電力制御方法 |
| JP7097748B2 (ja) | 2018-05-28 | 2022-07-08 | 三菱電機株式会社 | 電力制御装置、電力制御システム、無効電力制御器および電力制御方法 |
| KR20190137429A (ko) * | 2018-06-01 | 2019-12-11 | 한국전력공사 | 전력계통의 계층적 시각화 시스템 및 방법 |
| KR102531072B1 (ko) * | 2018-06-01 | 2023-05-11 | 한국전력공사 | 전력계통의 계층적 시각화 시스템 및 방법 |
| CN112130015A (zh) * | 2020-09-08 | 2020-12-25 | 中国联合网络通信集团有限公司 | 一种配电设备的智能监测故障分析方法和系统 |
| JP2023044242A (ja) * | 2021-09-17 | 2023-03-30 | 中国電力株式会社 | 電圧不平衡抑制支援方法、及び電圧不平衡抑制支援装置 |
| JP7652030B2 (ja) | 2021-09-17 | 2025-03-27 | 中国電力株式会社 | 電圧不平衡抑制支援方法、及び電圧不平衡抑制支援装置 |
| JP2023114283A (ja) * | 2022-02-04 | 2023-08-17 | 東芝エネルギーシステムズ株式会社 | 電力系統解析システム、および、プログラム |
| JP2023152340A (ja) * | 2022-04-04 | 2023-10-17 | トヨタ自動車株式会社 | 予測方法および予測装置 |
| JP7761521B2 (ja) | 2022-04-04 | 2025-10-28 | トヨタ自動車株式会社 | 予測方法 |
| JP7620167B1 (ja) * | 2023-10-04 | 2025-01-22 | 日本碍子株式会社 | 電圧調整器選定装置、電圧調整器選定プログラム、および、電圧調整器選定方法 |
| WO2025074548A1 (fr) * | 2023-10-04 | 2025-04-10 | 日本碍子株式会社 | Dispositif de sélection de régulateurs de tension, programme de sélection de régulateurs de tension et procédé de sélection de régulateurs de tension |
Also Published As
| Publication number | Publication date |
|---|---|
| JPWO2013124973A1 (ja) | 2015-05-21 |
| JP5802324B2 (ja) | 2015-10-28 |
| US10090704B2 (en) | 2018-10-02 |
| US20150054830A1 (en) | 2015-02-26 |
Similar Documents
| Publication | Publication Date | Title |
|---|---|---|
| JP5802324B2 (ja) | 電力系統情報の表示装置及び表示方法 | |
| Di Santo et al. | A review on smart grids and experiences in Brazil | |
| US20100292857A1 (en) | Electrical network command and control system and method of operation | |
| JP5576498B2 (ja) | 電力管理システム及び電力管理方法 | |
| National Academies of Sciences et al. | Analytic research foundations for the next-generation electric grid | |
| KR20130140237A (ko) | 배전 계통의 최적 신뢰도 평가 시스템 및 그 방법 | |
| Malik | Evolution of power systems into smarter networks | |
| US12512696B2 (en) | Power switching via arc schematic | |
| US9454143B2 (en) | Electrical transfer capacity optimization systems and methods thereof | |
| Ghiani et al. | Definition of smart distribution networks | |
| Köhler et al. | Cloud-Based Digital Twin for Distribution Grids: What Is Already Available Today | |
| JP6009369B2 (ja) | 系統設備計画支援装置及び方法 | |
| Boardman | The role of integrated distribution management systems in smart grid implementations | |
| WO2015092911A1 (fr) | Dispositif et procédé d'affichage de données de système électrique | |
| Vukasovic et al. | Impact of regional redispatching cooperation and involvement of distributed electricity prosumers | |
| Eren et al. | A Web-based dispatcher information system for electricity transmission grid monitoring and analysis | |
| Ramachandra et al. | Decision support system for regional electricity planning | |
| Chen et al. | Bringing probabilistic analysis capability from planning to operation | |
| Jdeed | Comparison of the smart grid simulation tools rapsim and gridlab-d | |
| Hilliard et al. | Work Domain Analysis of power grid operations | |
| Kocaarslan et al. | Demand response in grid operations | |
| Neupane et al. | Dynamic Visualization of the KU Distribution System | |
| Ali | Proposed Design of Distribution Network Considering Sensor Measurement Strategy on Active Network Management: A Case Study | |
| Dissanayake et al. | Real-Time Control and Monitoring of Decentralized Solar Energy Systems Using IoT and GPS Integration | |
| XIN | Theoretical Innovation of the NTPS |
Legal Events
| Date | Code | Title | Description |
|---|---|---|---|
| 121 | Ep: the epo has been informed by wipo that ep was designated in this application |
Ref document number: 12869192 Country of ref document: EP Kind code of ref document: A1 |
|
| ENP | Entry into the national phase |
Ref document number: 2014500786 Country of ref document: JP Kind code of ref document: A |
|
| WWE | Wipo information: entry into national phase |
Ref document number: 14377021 Country of ref document: US |
|
| NENP | Non-entry into the national phase |
Ref country code: DE |
|
| 122 | Ep: pct application non-entry in european phase |
Ref document number: 12869192 Country of ref document: EP Kind code of ref document: A1 |