WO2013161797A1 - Glycomètre - Google Patents
Glycomètre Download PDFInfo
- Publication number
- WO2013161797A1 WO2013161797A1 PCT/JP2013/061860 JP2013061860W WO2013161797A1 WO 2013161797 A1 WO2013161797 A1 WO 2013161797A1 JP 2013061860 W JP2013061860 W JP 2013061860W WO 2013161797 A1 WO2013161797 A1 WO 2013161797A1
- Authority
- WO
- WIPO (PCT)
- Prior art keywords
- blood glucose
- glucose level
- meal
- record
- blood
- Prior art date
- Legal status (The legal status is an assumption and is not a legal conclusion. Google has not performed a legal analysis and makes no representation as to the accuracy of the status listed.)
- Ceased
Links
Images





Classifications
-
- A—HUMAN NECESSITIES
- A61—MEDICAL OR VETERINARY SCIENCE; HYGIENE
- A61B—DIAGNOSIS; SURGERY; IDENTIFICATION
- A61B5/00—Measuring for diagnostic purposes; Identification of persons
- A61B5/74—Details of notification to user or communication with user or patient; User input means
- A61B5/742—Details of notification to user or communication with user or patient; User input means using visual displays
- A61B5/743—Displaying an image simultaneously with additional graphical information, e.g. symbols, charts, function plots
-
- A—HUMAN NECESSITIES
- A61—MEDICAL OR VETERINARY SCIENCE; HYGIENE
- A61B—DIAGNOSIS; SURGERY; IDENTIFICATION
- A61B5/00—Measuring for diagnostic purposes; Identification of persons
- A61B5/145—Measuring characteristics of blood in vivo, e.g. gas concentration or pH-value ; Measuring characteristics of body fluids or tissues, e.g. interstitial fluid or cerebral tissue
- A61B5/14532—Measuring characteristics of blood in vivo, e.g. gas concentration or pH-value ; Measuring characteristics of body fluids or tissues, e.g. interstitial fluid or cerebral tissue for measuring glucose, e.g. by tissue impedance measurement
-
- A—HUMAN NECESSITIES
- A61—MEDICAL OR VETERINARY SCIENCE; HYGIENE
- A61B—DIAGNOSIS; SURGERY; IDENTIFICATION
- A61B5/00—Measuring for diagnostic purposes; Identification of persons
- A61B5/72—Signal processing specially adapted for physiological signals or for diagnostic purposes
- A61B5/7271—Specific aspects of physiological measurement analysis
- A61B5/7275—Determining trends in physiological measurement data; Predicting development of a medical condition based on physiological measurements, e.g. determining a risk factor
-
- G—PHYSICS
- G16—INFORMATION AND COMMUNICATION TECHNOLOGY [ICT] SPECIALLY ADAPTED FOR SPECIFIC APPLICATION FIELDS
- G16H—HEALTHCARE INFORMATICS, i.e. INFORMATION AND COMMUNICATION TECHNOLOGY [ICT] SPECIALLY ADAPTED FOR THE HANDLING OR PROCESSING OF MEDICAL OR HEALTHCARE DATA
- G16H40/00—ICT specially adapted for the management or administration of healthcare resources or facilities; ICT specially adapted for the management or operation of medical equipment or devices
- G16H40/60—ICT specially adapted for the management or administration of healthcare resources or facilities; ICT specially adapted for the management or operation of medical equipment or devices for the operation of medical equipment or devices
- G16H40/63—ICT specially adapted for the management or administration of healthcare resources or facilities; ICT specially adapted for the management or operation of medical equipment or devices for the operation of medical equipment or devices for local operation
Definitions
- the present invention relates to a blood glucose meter that measures a blood glucose level of a patient and displays the blood glucose level on a display screen.
- blood glucose meter small blood glucose measuring device
- diabetes is a disease that is difficult to cure at present.
- Diabetic patients must always manage their blood glucose level within an appropriate range in daily life.
- the doctor browses the blood glucose level data of the patient stored in the blood glucose meter for a period of several weeks to several months with the blood glucose meter possessed by the patient. For this reason, the blood glucose meter has a history browsing function for browsing the stored blood glucose level data on a liquid crystal display.
- the conventional blood glucose meter has only a function of displaying the past blood glucose level data of the patient on the liquid crystal display by the history browsing function.
- diabetes is a chronic disease, it is important for the patient himself / herself to grasp the improvement or worsening of the medical condition over a certain period of time and to raise awareness of life improvement.
- blood glucose meters have not provided patients with information on such changes over the medium to long term.
- the present invention has been made in view of such a point, and an object thereof is to provide a blood glucose meter having a function of displaying a transition of a blood glucose level over a medium to long term on a display screen at an appropriate timing.
- a blood glucose meter of the present invention includes a blood glucose level measurement unit for measuring a patient's blood glucose level, a blood glucose level field in which the blood glucose level of the patient measured by the blood glucose level measurement unit is stored, A blood glucose level table including a date and time field in which the measurement date and time when the blood glucose level measurement unit measures the blood glucose level, a real-time clock that outputs current date and time information, and a blood glucose level stored in the blood glucose level field are displayed.
- the blood glucose meter of the present invention acquires the current date and time information from the real-time clock after supplying power to the display unit according to the operation of the operation unit, and the current date and time information matches a predetermined day and time zone.
- an input / output control unit that reads a blood glucose level within a predetermined period from the blood glucose level table and displays a graph based on the blood glucose level on the display unit is provided.
- the blood glucose meter of the present invention displays a graph showing the transition of blood glucose level within a predetermined period from the present time on the display screen at the time of starting and / or immediately before stopping in a predetermined time zone on a predetermined day of the week, Can be seen at a glance.
- A is a perspective view
- B is a top view
- C is the figure which removed the cover.
- It is a block diagram which shows the structure of a blood glucose meter. It is the schematic which shows an example of the field structure and record of a blood glucose level table. It is a flowchart which shows the flow of the sleep process of a blood glucose meter. It is a flowchart which shows the flow of the main process of a blood glucose meter. It is a flowchart which shows the flow of a blood glucose level evaluation display process. It is a figure which shows the example of the setting screen of the graph display in a liquid crystal display.
- the other is a graph showing the medium-to-long-term fluctuation state of the blood glucose level at a fixed timing every week, every month, every three months.
- such an information presentation function cannot be easily utilized even if it is configured to be displayed by a patient's voluntary operation. Therefore, immediately after starting the blood glucose meter and / or immediately before stopping, the information is forcibly displayed on the display unit.
- [appearance] 1A, 1B, and 1C are external views of a blood glucose meter 101 as an example of an embodiment of the present invention, in which A is a perspective view, B is a top view, and C is a view with a cover removed.
- the blood glucose meter 101 includes a liquid crystal display 103 capable of color display on the surface of a housing 102 and an operation button including a known membrane switch.
- the operation buttons 104 are provided on the upper surface and side surfaces of the housing 102. That is, as shown in FIGS.
- an upper button 105, a lower button 106, and an enter button 107 are provided on the top surface of the housing 102, and a setting button 111 is provided on the side surface of the housing 102. It is done. Further, a lid 110 of a serial interface terminal made of a well-known MicroUSB is provided on the side surface of the housing 102.
- the operation button 104 is a generic name for the above-described upward button 105, downward button 106, enter button 107, and setting button 111.
- An upward button 105 for moving the cursor displayed on the liquid crystal display 103 upward, a downward button 106 for moving the cursor downward, and a determination button 107 for instructing “execution”, “decision”, etc. 102 is provided on the surface.
- a setting button 111 for performing various settings is provided on the side surface of the housing 102.
- the upward button 105 has a power-on or power-off function when held down for about 1.5 seconds or longer (hereinafter referred to as “long press”).
- the down button 106 has a function of displaying a blood glucose level stored in a blood glucose level table, which will be described later, when pressed down.
- the decision button 107 has a function of recording a “post-meal flag” or “meal record”, which will be described later, in the blood sugar level table when pressed for a long time.
- the determination button 107 functions as the “post-meal button” and records the post-meal flag in the corresponding record of the blood glucose level table.
- the determination button 107 functions as a “meal button” and additionally records a meal record in the blood sugar level table.
- the “post-meal flag” specification and the “meal flag” specification can be switched by operating according to a setting menu displayed by pressing the setting button 111.
- an optical measurement unit 109 protected by a removable cover 108 is provided on one short side of the housing 102 of the blood glucose meter 101.
- a projection (not shown) is provided on the inside of the cover 108, and the projection (not shown) meshes with a recess 112 provided in the housing 102, so that a micro switch (not shown) built in the housing 102 is turned off.
- the blood glucose meter 101 that operates with a battery constituted by a known lithium ion storage battery or the like is a sleep mode that operates with power saving in a non-operating state.
- the blood glucose meter 101 returns to the active mode in which all the functions can be used by pressing and holding the upward button 105 on the blood glucose meter 101 in the sleep mode or removing the cover 108 and turning on the micro switch.
- the sleep mode state is referred to as a “power-off state”
- the active mode state is referred to as a “power-on state”.
- FIG. 1C when the power is turned on by removing the cover 108, a chip mounting guide is displayed on the liquid crystal display 103 assuming that the blood glucose level is immediately measured.
- This chip mounting guide is an illustration and a guide sentence displayed on the liquid crystal display 103 of FIG. 1B.
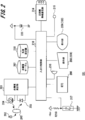
- FIG. 2 is a block diagram showing the configuration of the blood glucose meter 101.
- the blood glucose meter 101 is an electronic device mainly composed of a known microcomputer.
- the microcomputer reads a program stored in a ROM (not shown) and realizes a part of the configuration shown in FIG.
- the blood sugar level measuring unit 201 detects a change in the optical reflectance of the test paper 203 that changes color due to the blood 202 of the measurement subject, and measures the blood sugar level.
- the basic blood glucose measurement mechanism of the blood glucose meter 101 is the same as that of the prior art. Hereinafter, a mechanism for measuring a blood glucose level will be briefly described.
- a measurement chip (not shown) is attached to the blood glucose meter 101, and the measurement subject's blood 202 is sucked into the measurement chip.
- This measuring chip incorporates a test paper 203 made of a porous film such as polyethersulfone.
- the blood 202 sucked into the measurement chip reaches the test paper 203, it reacts with the reagent contained in the test paper 203 and develops a color.
- light emitted from the LED 204 which is a light emitting element is applied to the test paper 303, and reflected light from the test paper 203 is received by the photodiode 205 which is a light receiving element.
- the analog light reception intensity signal obtained by the photodiode 205 is converted into a digital value by an A / D converter (not shown), and then this digital value is converted into a blood glucose level.
- the mechanism of blood glucose level measurement is not limited to the optical measurement method using a coloring reagent, and a mechanism that can be conventionally used for blood glucose measurement, such as an electrochemical sensor method, can be employed.
- a real-time clock (hereinafter referred to as “RTC”) 206 is provided in many general microcomputers and outputs date and time information. Since power is supplied to the RTC 306 even when the power is off, accurate date and time information can be output.
- the blood glucose level table 207 is a table in which the measurement date and time, the measured blood glucose level, and an after-meal flag to be described later are recorded.
- the blood sugar level table 207 is provided in a nonvolatile storage (not shown) such as an EEPROM.
- the operation unit 208 is the operation button 104 in FIG. 1, and the display unit 209 is the liquid crystal display 103 in FIG.
- the input / output control unit 210 additionally records the blood glucose level data obtained from the blood glucose level measurement unit 201 and the measurement date and time obtained from the RTC 206 in the blood glucose level table 207. In addition to displaying the measured blood sugar level on the display unit 209, various data processing is performed in accordance with the operation of the operation unit 208.
- the short-range wireless communication unit 214 is used to transfer blood glucose level data in the blood glucose level table 207 to a personal computer or the like.
- the serial interface 215 is used to transfer blood glucose level data in the blood glucose level table 207 to an external device such as a personal computer.
- the input / output control unit 210 controls power supply to the display unit 209 and the blood glucose level measurement unit 201.
- the input / output control unit 210 does not supply power from the battery 220 to the display unit 209 and the blood glucose level measurement unit 201 in the power-off state.
- the input / output control unit 210 detects that the up button 105 has been pressed for a long time or the cover 108 has been removed and the micro switch 217 has been turned on, the input / output control unit 210 shifts to the power-on state, Electric power is supplied from the battery 220 to the measurement unit 201.
- FIG. 3 is a schematic diagram illustrating an example of a field configuration and a record of the blood sugar level table 207.
- date / time field date / time information at the time of measuring the blood glucose level is stored.
- the measured blood glucose level is stored in the blood glucose level field.
- the post-meal flag field stores a post-meal flag indicating that the blood glucose level being measured is a post-meal blood glucose level by pressing and holding the decision button 107 when measuring the blood glucose level.
- records for recording blood sugar levels are recorded in chronological order. Therefore, the last record is the latest record.
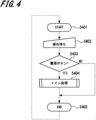
- FIG. 4 is a flowchart showing the flow of the sleep process of the blood glucose meter 101.
- the input / output control unit 210 of the blood glucose meter 101 cuts off the power supply to devices with large power consumption such as an A / D converter, a display unit 209, and an LED 304 (not shown), and several hundred kHz It becomes a sleep mode that operates with a low frequency clock of about several MHz.
- the operation of the operation unit 208 and the state of the micro switch are detected by the input / output control unit 310 (S402).
- the input / output control unit 210 determines whether the operated operation button 104 is a long press of the up button 105, that is, whether the power button is pressed, and whether the micro switch is turned on. (S403). If the power button has been pressed or the micro switch has been turned on (YES in S403), the input / output control unit 210 executes the main process (S404) and then ends (S405). If the power button is not pressed and the micro switch is not turned on (NO in S403), the input / output control unit 210 ends without doing anything (S405). This sleep process is a loop operation that is repeated again from the beginning after the end of the process.
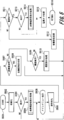
- FIG. 5 is a flowchart showing a detailed flow of the main process of the blood glucose meter 101 in step S404 of FIG.
- the input / output control unit 210 executes a predetermined initialization process such as supplying power to a device with a large power consumption such as the display unit 209 and the LED 204 (S502). Thereafter, with reference to the setting information stored in the various setting values 218, it is confirmed whether or not to display information at the time of activation (S503). If it is a setting to execute information display at the time of activation (YES in S503), the input / output control unit 210 executes blood glucose level evaluation display processing (S504).
- the input / output control unit 210 displays the main menu on the display unit 209 (S505) and waits for the operation of the operation unit 308 (S506).
- step S603 if the setting is such that information display at startup is not executed (NO in S603), the input / output control unit 310 does not execute the blood glucose level evaluation display process in step S504, and immediately displays the main menu on the display unit 309. (S505) and waits for the operation of the operation unit 208 (S506).
- the input / output control unit 210 executes blood glucose measurement processing (S508), and then displays the main menu again (S508). S505). If the operation content obtained from the operation button 104 is not a blood glucose level measurement (NO in S507) and the operation content is an instruction to display a past blood glucose level history (YES in S509), the input / output control unit 310 Executes a history display process (S510), and then displays the main menu again (S505).
- the input / output control unit 310 executes various setting processes (S612), and then displays the main menu again (S505).
- the input / output control unit 210 sets the various setting values 218. With reference to the stored setting information, it is confirmed whether or not the information display at the time of stopping is executed (S613). If the setting is such that information display at the time of stopping is executed (YES in S513), the input / output control unit 310 executes blood glucose level evaluation display processing (S514). Then, the input / output control unit 310 executes a power-off process (S515) and ends a series of processes (S516).
- step S513 if the setting is such that the information display at the time of stopping is not executed (NO in S513), the input / output control unit 210 does not execute the blood glucose level evaluation display process in step S514, but immediately executes the power-off process ( S515), a series of processing ends (S516).
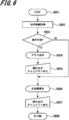
- FIG. 6 is a flowchart showing a detailed flow of the blood sugar level evaluation display process in steps S504 and S514 of FIG.
- the input / output control unit 210 first acquires the current date and time information from the RTC 206 (S602). Then, the input / output control unit 210 refers to the setting information stored in the various setting values 218 and checks whether or not the current date and time is the date and time when the graph is displayed (S603). If the current date and time is the date and time when the graph is displayed (YES in S603), the input / output control unit 210 executes graph display processing and displays the graph on the display unit 209 (S604).
- the input / output control unit 210 waits for an arbitrary button operation and a predetermined time, for example, a timeout of 5 seconds (S605). After executing the graph display process of step S604, the input / output control unit 210 waits for an arbitrary button operation for a maximum of 5 seconds in step S605. When 5 seconds have elapsed from step S604 or when any button is operated, the input / output control unit executes a five-step display process and displays a face illustration of the five-step evaluation result on the display unit 209 (S606). . The face illustration will be described later with reference to FIG.
- the input / output control unit 210 waits for an arbitrary button operation and a predetermined time, for example, a timeout of 5 seconds (S607). After executing the five-step display process in step S606, the input / output control unit 210 waits for an arbitrary button operation for a maximum of 5 seconds in step S607. When 5 seconds have elapsed from step S606 or when any button is operated, the input / output control unit ends a series of processing (S608).
- FIG. 7 is a diagram illustrating a display example of a graph display setting screen on the liquid crystal display 103.
- the input / output control unit 210 executes various setting processes in step S ⁇ b> 512 of FIG. 5, several setting screens are displayed on the display unit 209. One of them is the graph display setting screen of FIG.
- the setting of the three-month graph is entered as “1” in the three-month setting field 701, it is a setting displayed every three months from January. If the three-month graph is not displayed, “0” is entered in the three-month setting field 701. Similarly, since “1” is entered in the one month setting field 702, the setting of the one month graph is a setting displayed in the first week of every month.
- “0” is entered in the one-month setting field 402.
- “Day” is entered in the day setting field 703 and “16: 00-22: 00” is entered in the time zone setting field 704, so the setting of the weekly graph is set from 16:00 to 22:00 every Sunday. It is a setting displayed during When the week graph is not displayed, the day setting column 703 is left blank. Since a check mark is entered in both the power-on check box 705 and the power-off check box 706, and a check mark is entered in the display check box 707 every time, these graphs are displayed when the power is on. It is displayed every time from 16:00 to 22:00 every Sunday at both timings when off.
- the OK button 708 is pressed with the decision button 107
- the setting contents are stored in various setting values 218, and if the cancel button 709 is pressed with the decision button 107, the setting is made. The contents are discarded.
- the three-month graph, the one-month graph, and the weekly graph are all at the time of both power-on and power-off every Sunday from 16:00 to 22:00 on the first week of January. ,Is displayed. From the second week of January and after 16:00 to 22:00 on the last week of January, only the weekly graph is displayed at both the power-on and power-off timings. Then, between 16:00 and 22:00 on Sunday of the first week of February, a one-month graph and a weekly graph are displayed at both the power-on and power-off timings. And from 16:00 to 22:00 on Sunday of the first week of April, the three-month graph, the one-month graph, and the weekly graph are all displayed at both the power-on timing and the power-off timing.
- the blood glucose meter 101 automatically recognizes the first measurement day (the day when the blood glucose level is displayed for the first time), and the graph display function is displayed according to the default settings recorded in advance in the ROM.
- the default setting of the graph display function is “4” in the three-month setting field 701 and “3” in the one-month setting field 702 and the day of the week setting if the recognized date of the first measurement is April 16, 2012.
- “month” is automatically entered.
- “16:00 to 22:00” is set as a default setting.
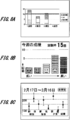
- FIG. 8A, B and C, and FIG. 9D are diagrams showing display examples of graph display on the liquid crystal display 103.
- FIG. FIG. 8A is a weekly graph. The blood glucose level measured every week is roughly classified into three groups with two thresholds, and the number of times of measurement of “high blood glucose” (blood glucose level is higher than the appropriate range), “OK” (blood glucose level is within the appropriate range) ) And the number of times of “low blood glucose” (the blood glucose level is lower than the appropriate range) are formed as a bar graph.
- FIG. 8B is a second week graph. It is the bar graph which integrated
- FIG. 8C is a one month graph.
- the blood glucose level measured every month is classified before breakfast, after breakfast, before lunch, after lunch, before dinner, after dinner, and at bedtime. Calculate the value. These values are displayed in the form of a stock price chart.
- FIG. 9D is a three month graph. Once every three months, the average fasting blood glucose level from now to one month ago, the average fasting blood glucose level from one month to two months ago, and the fasting time from two months to three months ago The average blood glucose level is calculated and displayed as a line graph.
- FIG. 10A, B, C, D, and E are diagrams illustrating display examples of face illustrations of five levels displayed on the liquid crystal display 103.
- FIG. The input / output control unit 210 reads the blood glucose level from the current blood glucose level table 207 from one week to four weeks ago, calculates the moving average value, and stores the five-level evaluation threshold values stored in the various setting values 218. As a result, a five-level evaluation face illustration is displayed.
- the five-step evaluation is based on threshold values based on the Diabetes Care Guidelines (http://www.lifescience.jp/ebm/cms/ms/no.19/topics.pdf) edited by the Japan Diabetes Society. indicate.
- FIG. 10A is a face illustration showing a low blood glucose level. Displayed when fasting blood glucose level and blood glucose level for two hours after meal are less than 80 mg / dl (deciliter). Actually, this face illustration P1001 is displayed in blue.
- FIG. 10B is a face illustration showing an appropriate blood glucose level. Displayed when the fasting blood glucose level is in the range of 80 to 110 mg / dl and the blood glucose level for 2 hours after meal is 80 to 140 mg / dl. Actually, this face illustration P1002 is displayed in yellow green.
- FIG. 10C is a face illustration showing that the blood glucose level is slightly high.
- FIG. 10D is a face illustration showing that the blood sugar level is high. Displayed when the fasting blood glucose level is in the range of 130 mg / dl or more and less than 160 mg / dl, and the blood glucose level for 2 hours after meal is 180 mg / dl or more and less than 220 mg / dl. Actually, this face illustration P1004 is displayed in pink.
- FIG. 10D is a face illustration showing that the blood sugar level is high. Displayed when the fasting blood glucose level is in the range of 130 mg / dl or more and less than 160 mg / dl, and the blood glucose level for 2 hours after meal is 180 mg / dl or more and less than 220 mg / dl. Actually, this face illustration P1004 is displayed in pink.
- FIG. 10D is a face illustration showing that the blood sugar level is high. Displayed when the fasting blood glucose level is in the range of 130 mg / dl or more and less than 160 mg / dl, and
- 10E is a face illustration showing that the blood sugar level is too high and dangerous. Displayed when the fasting blood glucose level is in the range of 160 mg / dl or more, and the blood glucose level for two hours after meal is 220 mg / dl or more. Actually, this face illustration P1005 is displayed in red.
- Different threshold values are set for the five-level evaluation between before and after meals. Therefore, it is not possible to simply add the pre-meal blood glucose level and the post-meal blood glucose level to obtain an average. Therefore, the blood glucose level for two hours after the meal is converted into a blood glucose level before the meal in a pseudo manner. Assuming that the lower limit of blood glucose level for 2 hours after meal is a, the upper limit is b, the lower limit of blood glucose level before meal is c, the upper limit is d, and the blood glucose level for 2 hours after meal is x, blood glucose level x, blood glucose level x, blood glucose level x.
- the added value y of the blood glucose level to be converted into a value can be calculated by the following formula.
- the average value may be calculated by pseudo-converting the pre-meal blood glucose level into a 2-hour post-meal blood glucose level. Further, it may be possible to select whether or not to include the two hours after meal value in the average by setting. That is, an average of only pre-meal values, an average of only post-meal values, an average of pre-meal values, an average of post-meal values, and the like can be selected and displayed as necessary.
- the blood glucose meter 101 of the present embodiment described above can further be applied as follows.
- the five-level evaluation threshold values stored in the various set values 218 are stored for three before a meal and three for two hours after a meal, respectively. It is possible to make this a smaller threshold. However, at least two threshold values are necessary to indicate whether or not the blood glucose level is within the appropriate range. When there are two threshold values, the blood glucose level evaluation stage number of the blood glucose meter 101 is three.
- the blood glucose meter 101 described above is provided with a post-meal flag field in the blood glucose level table 207 as a specification for distinguishing between pre-meal and post-meal blood glucose levels.
- This post-meal flag field is provided in the blood glucose level table 207 when the blood glucose meter 101 has a “post-meal button” specification.
- the blood glucose meter 101 instead of providing this post-meal flag field in the blood glucose level table 207, the blood glucose meter 101 performs an operation of pressing and holding the decision button 107 immediately before eating a meal, so that the blood glucose level table 207 indicates that the meal start is started.
- FIG. 11 is a schematic diagram illustrating an example of a field configuration and a record of the blood glucose level table 207 in the case of the meal button specification.
- the blood glucose level table 207 has no post-meal flag field. Instead, there is a record in which a value (abnormal value) that is impossible as a blood glucose level is recorded, in which the value of the blood glucose level field is “0”. This is a meal record that is recorded in the blood sugar level table 207 by pressing the meal button (holding down the enter button 107).
- the input / output control unit 310 determines that a record immediately after this meal record and a record recorded within 3 hours from the date and time when the meal record was recorded is a record after the meal. And about the record in which the normal blood glucose level which is not matched with this condition is recorded, the input-output control part 210 judges all as a record before a meal.
- the column written as “post-meal flag” in FIG. 10 shows what the stored logical value is when there is an after-meal flag field. Information that is not a numerical value may be recorded as the abnormal value. Even if the blood glucose level table 207 has such a configuration, the above-described graph display and five-stage evaluation can be executed equally.
- the time for determining the blood glucose level before a meal and the blood glucose level after a meal can be set to be changeable with a meal record as a boundary. For example, one hour after the time when the meal record is recorded is set as the determination time. Then, the blood glucose level within one hour immediately before the time when the meal record is recorded is treated as a pre-meal value, and the blood glucose level up to 3 hours immediately after is treated as a post-meal value.
- the blood glucose meter is not limited to the above, and has one aspect as an electronic computer that handles biological information. Therefore, it is preferable that various operating conditions and threshold values can be changed according to the patient using a setting screen similar to FIG. For example, whether or not to display all of the graphs in FIGS. 8 and 9, the range for calculating the average value of the five-stage evaluation in FIG. Corresponding to operating conditions and thresholds that can be changed accordingly.
- the time range that can be set as the pre-meal value is preferably one hour before and after the recording time of the meal record. Moreover, the time range handled as the after-meal value is 3 hours after the meal record recording time from the later time of the meal record recording time and the time before the pre-meal value time range ends.
- FIGS. 12A and 12B are block diagrams showing hardware configurations of the blood glucose meter 101 and the personal computer 1200.
- FIG. 12A is a block diagram showing a hardware configuration of the blood glucose meter 101.
- a blood glucose meter 101 which is an electronic device mainly composed of a known microcomputer, is a nonvolatile memory that includes a CPU 1201, a ROM 1202, a RAM 1203, an RTC 206, an operation unit 208, a display unit 209, a blood glucose level table 207, various setting values 218, and the like.
- the short-range wireless communication unit 214, the serial interface 215, the buzzer 216, and the depression 112, the micro switch 217 for detecting the attachment / detachment of the cover 108, the D / A converter 1204 connected to the LED 204, and the photodiode 205 A / D converter 1205 to be connected is connected to bus 1206.
- FIG. 12B is a block diagram illustrating a hardware configuration of the personal computer 1200.
- a CPU 1201, a ROM 1202, a RAM 1203, an RTC 206, an operation unit 208, a display unit 209, and a nonvolatile storage 1207 are connected to a bus 1206.
- the hardware of the personal computer 1200 is connected from the blood glucose meter 101 to the short-range wireless communication unit 214, the serial interface 215, the buzzer 216, the microswitch 217, the D / A converter 1204 connected to the LED 204, and the photodiode 205. This is equivalent to a configuration in which the A / D converter 1205 is removed. Then, the flowcharts shown in FIGS.
- the personal computer 1200 can realize the function of displaying the blood glucose level evaluation shown in D and E. That is, the blood glucose level measurement function is not necessary for the display functions shown in FIGS. 7, 8A, B and C, 9D, 10A, B, C, D and E. What is necessary for the display function is data (blood glucose level table 307 and the like), an arithmetic processing function (input / output control unit 120 and the like), an operation unit 208, and a display unit 209. That is, the flowcharts shown in FIGS.
- the hardware configuration of the personal computer 1200 may be used if the blood glucose level display function shown in D and E is realized.
- the blood glucose meter 101 is disclosed.
- the blood glucose level table 207 in which the measured blood glucose level is recorded is read, and a moving average value of blood glucose levels measured in the past from the present to a predetermined period is calculated.
- the patient can clearly know the management state of his / her blood glucose level by displaying any one of the face illustrations P1001, P1002, P1003, P1004 or P1005 on the display unit 209.
- the blood glucose level table 207 in which the measured blood glucose level is recorded is read when the blood glucose meter 101 is turned on and / or turned off. Then, by calculating an average value of blood glucose levels measured in the past from the present to a predetermined period and displaying a graph based on this average value on the display unit 209, the patient can clearly know the management state of his / her blood glucose level Can do.
- Mass storage 212 ... Image file directory, 214 ... Short-range wireless communication unit, 215 ... Serial interface, 216 ... Buzzer, 217 ... Micro switch, 218 ... set value, 220 ... battery, 303 ... test paper, 304 ... LED, 306 ... RTC, 3 7 ... blood glucose level table, 308 ... operation unit, 309 ... display unit, 310 ... input / output control unit, 313 ... attribute table, 402 ... one month setting column, 701 ... three month setting column, 702 ... one month setting column, 703 ... day of the week setting field, 704 ... time zone setting field, 705 ... power-on check box, 706 ... power-off check box, 707 ...
Landscapes
- Health & Medical Sciences (AREA)
- Life Sciences & Earth Sciences (AREA)
- Engineering & Computer Science (AREA)
- Biomedical Technology (AREA)
- Public Health (AREA)
- Physics & Mathematics (AREA)
- General Health & Medical Sciences (AREA)
- Medical Informatics (AREA)
- Biophysics (AREA)
- Pathology (AREA)
- Veterinary Medicine (AREA)
- Animal Behavior & Ethology (AREA)
- Surgery (AREA)
- Molecular Biology (AREA)
- Heart & Thoracic Surgery (AREA)
- Business, Economics & Management (AREA)
- Optics & Photonics (AREA)
- General Business, Economics & Management (AREA)
- Epidemiology (AREA)
- Radiology & Medical Imaging (AREA)
- Nuclear Medicine, Radiotherapy & Molecular Imaging (AREA)
- Emergency Medicine (AREA)
- Primary Health Care (AREA)
- Artificial Intelligence (AREA)
- Computer Vision & Pattern Recognition (AREA)
- Physiology (AREA)
- Psychiatry (AREA)
- Signal Processing (AREA)
- Investigating Or Analysing Biological Materials (AREA)
- Measuring And Recording Apparatus For Diagnosis (AREA)
Applications Claiming Priority (2)
| Application Number | Priority Date | Filing Date | Title |
|---|---|---|---|
| JP2012-098367 | 2012-04-24 | ||
| JP2012098367 | 2012-04-24 |
Publications (1)
| Publication Number | Publication Date |
|---|---|
| WO2013161797A1 true WO2013161797A1 (fr) | 2013-10-31 |
Family
ID=49483108
Family Applications (1)
| Application Number | Title | Priority Date | Filing Date |
|---|---|---|---|
| PCT/JP2013/061860 Ceased WO2013161797A1 (fr) | 2012-04-24 | 2013-04-23 | Glycomètre |
Country Status (2)
| Country | Link |
|---|---|
| TW (1) | TW201350086A (fr) |
| WO (1) | WO2013161797A1 (fr) |
Cited By (1)
| Publication number | Priority date | Publication date | Assignee | Title |
|---|---|---|---|---|
| JP2014144025A (ja) * | 2013-01-25 | 2014-08-14 | Terumo Corp | 血糖計 |
Citations (8)
| Publication number | Priority date | Publication date | Assignee | Title |
|---|---|---|---|---|
| JP2003159234A (ja) * | 2001-11-28 | 2003-06-03 | Toshiba Tec Corp | 血糖値測定装置 |
| WO2005106446A1 (fr) * | 2004-04-30 | 2005-11-10 | Matsushita Electric Industrial Co., Ltd. | Dispositif de mesure du niveau de sucre dans le sang |
| JP2006071421A (ja) * | 2004-09-01 | 2006-03-16 | Nishitomo Co Ltd | 生体情報測定装置及び血糖値測定装置 |
| JP2010042261A (ja) * | 2008-08-15 | 2010-02-25 | Lifescan Scotland Ltd | 検体試験方法および検体試験システム |
| JP2011064596A (ja) * | 2009-09-17 | 2011-03-31 | Terumo Corp | 血糖計 |
| JP2011064597A (ja) * | 2009-09-17 | 2011-03-31 | Terumo Corp | 血糖計及び血糖値測定方法 |
| WO2011041007A1 (fr) * | 2009-09-29 | 2011-04-07 | Lifescan Scotland Limited | Méthode d'essai d'analytes et dispositif pour la gestion du diabète |
| JP2012018010A (ja) * | 2010-07-06 | 2012-01-26 | Nipro Corp | 血中グルコース濃度測定装置 |
-
2013
- 2013-04-23 WO PCT/JP2013/061860 patent/WO2013161797A1/fr not_active Ceased
- 2013-04-23 TW TW102114400A patent/TW201350086A/zh unknown
Patent Citations (8)
| Publication number | Priority date | Publication date | Assignee | Title |
|---|---|---|---|---|
| JP2003159234A (ja) * | 2001-11-28 | 2003-06-03 | Toshiba Tec Corp | 血糖値測定装置 |
| WO2005106446A1 (fr) * | 2004-04-30 | 2005-11-10 | Matsushita Electric Industrial Co., Ltd. | Dispositif de mesure du niveau de sucre dans le sang |
| JP2006071421A (ja) * | 2004-09-01 | 2006-03-16 | Nishitomo Co Ltd | 生体情報測定装置及び血糖値測定装置 |
| JP2010042261A (ja) * | 2008-08-15 | 2010-02-25 | Lifescan Scotland Ltd | 検体試験方法および検体試験システム |
| JP2011064596A (ja) * | 2009-09-17 | 2011-03-31 | Terumo Corp | 血糖計 |
| JP2011064597A (ja) * | 2009-09-17 | 2011-03-31 | Terumo Corp | 血糖計及び血糖値測定方法 |
| WO2011041007A1 (fr) * | 2009-09-29 | 2011-04-07 | Lifescan Scotland Limited | Méthode d'essai d'analytes et dispositif pour la gestion du diabète |
| JP2012018010A (ja) * | 2010-07-06 | 2012-01-26 | Nipro Corp | 血中グルコース濃度測定装置 |
Cited By (1)
| Publication number | Priority date | Publication date | Assignee | Title |
|---|---|---|---|---|
| JP2014144025A (ja) * | 2013-01-25 | 2014-08-14 | Terumo Corp | 血糖計 |
Also Published As
| Publication number | Publication date |
|---|---|
| TW201350086A (zh) | 2013-12-16 |
Similar Documents
| Publication | Publication Date | Title |
|---|---|---|
| JP6126589B2 (ja) | 血糖計 | |
| CA2659142C (fr) | Methode et systeme d'essai d'analytes | |
| CN102843968B (zh) | 血糖值测量设备、血糖值测量结果显示方法和血糖值测量结果显示控制程序 | |
| TWI405558B (zh) | 血壓量測裝置 | |
| JP6764784B2 (ja) | 健康管理を支援するデータ管理ユニット | |
| JP5855118B2 (ja) | 高及び低分析物傾向通知を有する分析物試験方法及びシステム | |
| JPWO2012127870A1 (ja) | 生体情報測定装置 | |
| CN102483776A (zh) | 用于糖尿病管理的系统和方法 | |
| JP2014502858A (ja) | 高及び低分析物傾向通知を有する分析物試験方法及びシステム | |
| CN101750499A (zh) | 分析物测量方法和系统 | |
| JP5930823B2 (ja) | 測定装置 | |
| WO2011162823A1 (fr) | Systèmes et procédés de surveillance de substance à analyser | |
| KR101320555B1 (ko) | 혈당측정 시스템 | |
| WO2013038826A1 (fr) | Système de notification | |
| WO2013161797A1 (fr) | Glycomètre | |
| KR20140147849A (ko) | 이전의 생리적 측정치의 분석에 기초한 사용자에 대한 긍정적 강화 메시지 | |
| HK1204056B (en) | Blood glucose meter | |
| JP2013076598A (ja) | 医療機器、エラー情報処理システム及びエラー情報処理プログラム | |
| CN104956227A (zh) | 血糖仪 | |
| HK1135007A (en) | Analyte testing method and system | |
| KR20130116290A (ko) | 고 분석물 및 저 분석물 경향 통지를 갖는 분석물 검사 방법 및 시스템 |
Legal Events
| Date | Code | Title | Description |
|---|---|---|---|
| 121 | Ep: the epo has been informed by wipo that ep was designated in this application |
Ref document number: 13782626 Country of ref document: EP Kind code of ref document: A1 |
|
| NENP | Non-entry into the national phase |
Ref country code: DE |
|
| 122 | Ep: pct application non-entry in european phase |
Ref document number: 13782626 Country of ref document: EP Kind code of ref document: A1 |
|
| NENP | Non-entry into the national phase |
Ref country code: JP |