WO2013190627A1 - Dispositif d'analyse de corrélation et procédé d'analyse de corrélation - Google Patents
Dispositif d'analyse de corrélation et procédé d'analyse de corrélation Download PDFInfo
- Publication number
- WO2013190627A1 WO2013190627A1 PCT/JP2012/065552 JP2012065552W WO2013190627A1 WO 2013190627 A1 WO2013190627 A1 WO 2013190627A1 JP 2012065552 W JP2012065552 W JP 2012065552W WO 2013190627 A1 WO2013190627 A1 WO 2013190627A1
- Authority
- WO
- WIPO (PCT)
- Prior art keywords
- data
- correlation
- language
- numerical
- converted
- Prior art date
- Legal status (The legal status is an assumption and is not a legal conclusion. Google has not performed a legal analysis and makes no representation as to the accuracy of the status listed.)
- Ceased
Links
Images




Classifications
-
- G—PHYSICS
- G05—CONTROLLING; REGULATING
- G05B—CONTROL OR REGULATING SYSTEMS IN GENERAL; FUNCTIONAL ELEMENTS OF SUCH SYSTEMS; MONITORING OR TESTING ARRANGEMENTS FOR SUCH SYSTEMS OR ELEMENTS
- G05B23/00—Testing or monitoring of control systems or parts thereof
- G05B23/02—Electric testing or monitoring
- G05B23/0205—Electric testing or monitoring by means of a monitoring system capable of detecting and responding to faults
- G05B23/0259—Electric testing or monitoring by means of a monitoring system capable of detecting and responding to faults characterized by the response to fault detection
- G05B23/0275—Fault isolation and identification, e.g. classify fault; estimate cause or root of failure
- G05B23/0278—Qualitative, e.g. if-then rules; Fuzzy logic; Lookup tables; Symptomatic search; FMEA
-
- G—PHYSICS
- G05—CONTROLLING; REGULATING
- G05B—CONTROL OR REGULATING SYSTEMS IN GENERAL; FUNCTIONAL ELEMENTS OF SUCH SYSTEMS; MONITORING OR TESTING ARRANGEMENTS FOR SUCH SYSTEMS OR ELEMENTS
- G05B23/00—Testing or monitoring of control systems or parts thereof
- G05B23/02—Electric testing or monitoring
- G05B23/0205—Electric testing or monitoring by means of a monitoring system capable of detecting and responding to faults
- G05B23/0218—Electric testing or monitoring by means of a monitoring system capable of detecting and responding to faults characterised by the fault detection method dealing with either existing or incipient faults
- G05B23/0243—Electric testing or monitoring by means of a monitoring system capable of detecting and responding to faults characterised by the fault detection method dealing with either existing or incipient faults model based detection method, e.g. first-principles knowledge model
- G05B23/0245—Electric testing or monitoring by means of a monitoring system capable of detecting and responding to faults characterised by the fault detection method dealing with either existing or incipient faults model based detection method, e.g. first-principles knowledge model based on a qualitative model, e.g. rule based; if-then decisions
- G05B23/0248—Causal models, e.g. fault tree; digraphs; qualitative physics
Definitions
- the present invention relates to an apparatus for analyzing the relationship between events, and more particularly to a correlation analysis apparatus and method for supporting cause analysis of an event using a plurality of types of data.
- RCA Root Cause Analysis
- FTA Fault Tree Analysis
- Patent Document 1 As an invention of a system for supporting cause investigation work. Patent Document 1 discloses a technique having a function of displaying other selected data when a change per unit time exceeds a preset threshold value.
- Patent Document 2 is an invention of a system for supporting cause investigation work.
- Patent Document 2 discloses a technology having a function of presenting support information for supporting analysis of a cause of a departure event to an analyst by referring to a human error tree diagram when analyzing the cause of the departure event. Is disclosed.
- An object of the present invention is to provide a correlation analysis apparatus and method capable of calculating a correlation between a plurality of types of data even when a plurality of types of data are mixed.
- the present invention uses relevance information for managing relevance between a plurality of data having different types or time resolutions, which is generated for each event.
- the data is converted into data having a common data format, and the correlation between the converted data is calculated.
- the correlation between the multiple types of data can be calculated.
- FIG. 1 is a block diagram showing a first embodiment of a computer system according to the present invention.
- the computer system includes a correlation analysis server 1001, a plurality of terminals 1002, and a network 1003.
- the correlation analysis server 1001 and the plurality of terminals 1002 are connected to the network 1003, respectively.
- the correlation analysis server 1001 is a correlation analysis device for analyzing the correlation.
- Each terminal 1002 is a terminal that presents a result to the user or accepts a user operation input. Note that the terminal 1002 is composed of two or more, and each user may input a different analysis result presentation or request, and individual operations from a plurality of terminals 1002 depending on the configuration of an existing server client method or the like. Can be done.
- the network 1003 is a network that performs information communication with the correlation analysis server 1001 and the terminal 1002.
- the network 1003 may be any communication system that can perform communication that can transmit an operation instruction and a result display to be described later.
- the terminal 1002 may be directly connected to the correlation analysis server 1001 without using the network 1003.
- input data sensor data 1004 and text data 1005 are assumed.
- the correlation analysis server 1001 includes a processing unit 1010 that performs various types of analysis processing, a storage device 1020 that stores various types of data, a data collection interface (I / F) 1030, and a display interface (I / F) 1040.
- the processing unit 1010 stores the sensor data 1004 or text data 1005 as original data 1021 in the storage device 1020, and extracts a feature amount from the original data 1021 by a data management unit 1011 that manages the stored original data 1021, and a procedure that will be described later.
- the storage device 1020 stores various data such as original data 1021 such as sensor data and text data, feature data 1022, and correlation data 1023.
- the data collection I / F 1030 is an interface for collecting data such as sensor data 1004 and text data 1005 and inputting the collected data to the data management unit 1011 in the processing unit 1010.
- the display I / F 1040 is an interface for actually displaying the display content of the display content configuration unit 1014 in the processing unit 1010 on the terminal 1002.
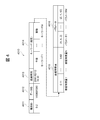
- FIG. 2 is a configuration diagram of sensor system original data such as sensor data.
- sensor system original data 2010 is sensor system original data (measurement data) composed of data extracted from information of a measurement device (sensor) installed in the facility and an operation control panel, and a data ID 2011. , And the description content 2012.
- the data ID 2011 is an ID for identifying which sensor of which equipment the original data 2010 obtained from the sensor data 1004 out of the original data 1021 is generated.
- the description content 2012 includes a date and time 2013 indicating the date and time when the data is generated, a sensor ID 2014 indicating the sensor or measuring device that is the data generation source, a sensor output value 2015 indicating the output value of the sensor, and the occurrence of an event by the sensor.
- the flag 2016 is shown. In the flag 2016, “Y (present)” is recorded when an event has occurred by the sensor, and “N (none)” is recorded when no event has occurred by the sensor.
- an event means that various sensors collect measurement data and an operator creates a business record or the like.
- the data generated by the event is data including measurement data obtained by measurement of various sensors (measurement devices) and language data obtained by converting business records created by an operator into digital data, for example, text data. .
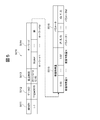
- FIG. 3 is a configuration diagram of text-based original data such as text data.
- text-based original data 3010 is text-based original data originating from text input by a worker, such as daily reports and various report information, and includes a data ID 3011 and description contents 3012.
- the data ID 3011 is an ID for identifying in which equipment or business the original data 3011 obtained from the text data 1005 among the original data 1021 is generated.
- the description content 3012 includes a date and time 3013 indicating the date and time when the data was generated, a report ID 3014 for identifying the reporter, and a report for entering report items such as work content, results, and special notes in natural language. Consists of item 3015.
- FIG. 4 is a configuration diagram of sensor system feature data.
- sensor system feature data 4010 is integrated feature data obtained by converting the sensor system original data 2010 into feature data, and includes a type ID 4011, a data ID 4012, a starting time 4013, and a keyword 4014. , A numerical feature amount 4015 and a parameter 4016.
- the type ID 4011 is an index indicating the type of whether the original data 2010 is a text system or a sensor system. When the original data 2010 is a sensor system, it may indicate a more detailed type such as what type of sensor it is.
- the data ID 4012 is an ID for identifying in which equipment or business the data is generated.
- the starting time 4013 is information indicating the data generation time.
- a keyword 4014 is obtained by estimating a typical keyword with respect to a feature amount from a past feature amount pattern and a corresponding example of the keyword, and adding the estimated keyword. The estimation method will be described later.
- the numerical feature quantity 4015 is obtained by converting the sensor system original data 2010 into a feature quantity in a predetermined format and digitizing the converted feature quantity. For example, the measurement data is divided by a set value larger than the maximum value of the measurement data, and a value obtained by this division is obtained as numerical feature data of 1 or less.
- the defined format is a feature that expands features on multiple time scales and expresses them on multiple scales so that correlation can be calculated on different time scales (1 day and 1 hour, etc.). is there.
- the numerical feature value data obtained from the measurement data is expanded to a plurality of time scales, the numerical feature value data of each time scale is managed as time series data having different time resolutions.
- numerical feature amounts 1 to 100 are managed as time series data indicating numerical feature amounts in one hour units
- numerical feature amounts 101 to 200 are managed as time series data indicating numerical feature amounts in one day units. . If there is insufficient data in the time series data, the shortage can be satisfied by executing interpolation calculation or average value calculation based on the same time series data or other time series data. be able to.
- the contents of the time scale development of the feature amount portion will be separately described with reference to FIG.
- the parameter 4016 is information added to the measurement data, and is information used to determine the correlation calculation at different time delays.
- the parameter 1 includes the time delay of the correlation between the feature quantity whose type ID 4011 is A and the data ID 4012 is X and the feature quantity X (the time when the data to be correlated is obtained, and the feature quantity The difference from the time when X was obtained is 2 hours. At this time, if the difference between the time at which the data to be correlated (data to be correlated) is obtained and the time at which the feature value X is obtained is 2 hours, the time resolution condition is set. This means that matching is established between the two data.
- the parameter M indicates that the time delay between the feature quantity Y having the type ID 4011 of Z and the data ID 4012 of Y and the feature quantity Y is 12 hours.
- the values of these parameters are determined with reference to characteristic values for each type ID 4011 and data ID 4012.
- the single original data alone cannot cover the time scale of the feature amount, the original data from the sensors having the same ID at a plurality of times are collected as one feature amount.
- FIG. 5 is a configuration diagram of text-based feature data.
- text-based feature data 5010 is integrated feature data obtained by converting text-based original data 3010 into feature data, and includes a type ID 5011, a data ID 5012, a starting time 5013, and a keyword 5014. , A numerical feature quantity 5015 and a parameter 5016.
- the type ID 5011 is an index indicating the type of whether the original data 3010 is a text system or a sensor system. When the original data 3010 is a text system, it may indicate a more detailed type such as a daily report or a defect report.
- the data ID 5012 is an ID for identifying in which equipment or business the data is generated.
- the starting time 5013 is information indicating the data generation time.
- a keyword 5014 is obtained by extracting a keyword from text data of the original data 3010 by document processing. At this time, only those existing in a predetermined vocabulary may be left.
- the numerical feature quantity 5015 is obtained by estimating a corresponding feature quantity from text data and digitizing the estimated feature quantity.
- the typical method is to assign a feature amount to a keyword from past sensor system data value patterns and keyword correspondence examples.
- the procedure associates the keyword in the text data with the pattern of the value of the sensor system data, which is known to have occurred at the same time in the past, and stores the feature values that are likely to occur for a specific keyword as a correspondence table.
- the correspondence table for example, the feature quantity / keyword correspondence table
- the most typical feature quantity is given to each keyword extracted this time.
- the average value of the feature values given to each extracted keyword is taken to obtain the estimated feature value for the current keyword.
- the above-described feature amount estimation method is based on past data.
- an expression related to an obvious feature such as a temporal expression in document data is utilized and reflected in a numerical feature amount.
- a method is also possible. For example, if there is a report of “abnormal noise from the afternoon” as text data information, the keywords are extracted by document analysis, and “from the afternoon”, “gradually”, and “abnormal noise” are reflected in the feature amount. .
- the reflection method gives the value from the afternoon of the field related to the feature quantity arranged by time, and from the expression “gradually”, the value increases as time passes. Etc.
- the parameter 5016 is used to determine the correlation calculation at different time delays as in FIG.
- the description content is the same as in FIG.
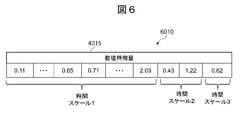
- FIG. 6 is a configuration diagram of multiple time scale numerical feature data.
- the multiple time scale numerical feature value data 6010 shows a specific arrangement example of the numerical feature values 4015 in FIG. 4.
- FIG. 6 shows a case where there are three types of time scales (time resolutions) for the sake of simplicity.
- time scale 1 for example, sensor values are arranged in order of time every hour.
- time scale 2 for example, morning measurement values and afternoon measurement values are input.
- a measurement value is input once a day.
- the missing field is estimated from other fields and interpolated. For example, if measurements are given on the shortest time scale, some representative values such as average, mode, median, and value at a specific time are calculated to estimate other fields. It can be a value. Conversely, when estimating a measurement value of a shorter time scale, a method of calculating by a method of inputting a measurement value having a large scale and the same value in all fields is the simplest method. If the measured values are only possible in principle on a long scale, there is no other way but to interpolate like that. Alternatively, it is also possible to input a value of a higher scale only for a representative time, and enter a predetermined value suitable for the type of sensing, such as a symbol indicating some missing value or a zero value in the other fields. .
- FIG. 6 shows an example in which there is one type of sensor value.
- each type is converted so as to have multiple time scales.
- the order of the fields is determined according to either one of the types arranged for each scale, or the data arranged for each scale for one sensor is arranged for each type.
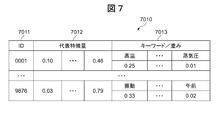
- FIG. 7 is a configuration diagram of the feature quantity / keyword correspondence table.
- a feature quantity / keyword correspondence table 7010 is a table used for estimating a keyword from a numeric feature quantity, or conversely, estimating a numeric feature quantity from a keyword, and includes an ID 7011, a representative feature quantity 7012, a keyword / weight. 7013.
- the ID 7011, the representative feature amount 7012, and the keyword / weight 7013 are configured as a plurality of pieces of data having different types or temporal resolutions as relevance information for managing the relevance between the plurality of pieces of data.
- ID 7011 is an identifier for identifying a feature amount.
- the representative feature amount 7012 is obtained by quantifying a representative feature amount among the feature amounts.
- the keyword / weight 7013 includes a keyword corresponding to the feature amount and the keyword weight, and the upper row indicates the keyword and the lower row indicates the weight.
- the ID 7011, the representative feature amount 7012, and the keyword / weight 7013 include relevance information (first relevance information) in which a correspondence relationship between the numerical feature amount 4015 and the keyword 4014 is defined, and a numerical feature amount 5015. It is configured as relevance information (second relevance information) in which a correspondence relationship with the keyword keyword 5014 is defined, and the ID 7011 includes a place, time, facility, or work as information specifying data generated for each event. Information for identifying the person is stored.
- the feature quantity / keyword correspondence table 7010 In constructing the feature quantity / keyword correspondence table 7010, first, data in which as many corresponding keywords and feature quantities as possible coexist is prepared. Such data may be prepared manually, or may be generated by associating feature data that clearly co-occurred in the past with text data. Although such a plurality of data pairs can be directly used as the feature quantity / keyword correspondence table 7010, the following processing is performed in order to avoid variation in correspondence.
- grouping is performed based on the “numerical proximity” of the feature values of each data.
- the numerical closeness for example, the Euclidean distance is used by regarding the arrangement of feature amounts as one numerical vector.
- clustering the process of grouping is called clustering.
- representative feature values are calculated from the feature values belonging to each group.
- a calculation method for example, it is possible to consider a sequence of feature values as one numerical vector and calculate an average vector thereof.
- the keywords included in each cluster as a pair of feature values are all collected from the data in the cluster, and the frequency of each keyword is aggregated.
- the number of keywords determined in order from the keyword having the highest frequency is adopted as the corresponding keyword in the keyword table.
- the frequency itself or the frequency normalized so that the total sum of the keywords is 1.0 is used as the keyword weight.
- a method of directly calculating the correspondence between the feature amount vector and the vector representing the frequency of each word may be used without using the clustering.
- the procedure regards the feature quantity as a numerical vector, similar to the method used at the time of clustering.
- Prepare hereinafter referred to as keyword appearance frequency vector.
- an expression for predicting a feature quantity vector from a keyword appearance frequency vector may be determined by replacing (feature quantity vector) and (keyword appearance frequency vector) with the above inverse function.
- the calculation procedure of the above coefficient should just use the technique of the multiple regression analysis in multivariate analysis.
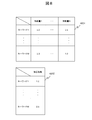
- Fig. 8 shows an example of a conversion function assuming the linear conversion.
- a feature quantity / keyword conversion coefficient 4201 is the coefficient matrix A
- a feature quantity / keyword conversion coefficient 4202 is a coefficient vector b. That is, each component of the coefficient matrix A indicates the magnitude of the relationship between the keyword appearance frequency vector and the feature quantity vector
- the coefficient vector b is the magnitude of the keyword vector after being converted by the feature quantity / keyword correspondence table 4201. It is a value added to optimize the thickness.
- This process shows the procedure for converting the sensor system original data into the sensor system feature quantity using the feature quantity / keyword correspondence table 7010.
- the feature amount extraction unit 1012 determines what type of data is the original data 1021 stored in the storage device 102, and determines that the original data 1020 is text-based original data 2010. In this case, the data ID 4012 is assigned to the original data 2010 (S901).
- the feature quantity extraction unit 1012 shapes the feature quantity according to the type of data based on the original data 2010 (S902). Feature shaping is, for example, missing value interpolation or conversion to a value shifted in time by data interpolation when the data type does not match the standard time measurement. .
- the feature quantity extraction unit 1012 multi-scales the feature quantity with respect to the shaped feature quantity (S903).
- the method is as described in FIG.
- the feature quantity extraction unit 1012 performs keyword estimation as described in FIG. 4 (S9004).
- a typical keyword is assigned to a feature amount from a past feature amount pattern and a corresponding example of the keyword.
- a method using the feature quantity / keyword table 7010 described above with reference to FIG. 7 will be described.
- a representative feature quantity closest to the representative feature quantity 7012 in the feature quantity / keyword table 7010 is selected.
- the closeness between the feature amounts is calculated using, for example, the Euclidean distance used when the feature amount / keyword table 7010 is created.
- the keyword in the feature / keyword table 7010 corresponding to the selected representative feature is estimated, and the estimated keyword is used as the estimated keyword.
- the feature quantity extraction unit 1012 determines a feature quantity parameter (S905).
- the parameter indicates how much time the correlation should be calculated when calculating the correlation of each pair with each feature amount as a brute force pair.
- These parameters are derived from the characteristics for the combination of feature values, and are basically calculated manually. For example, if the feature amount of a certain data ID 4012 indicates the pressure in the container of a certain facility, and the feature amount of another data ID 4012 indicates the temperature of the device attached to the facility, When it is known that a high correlation is produced with a delay of one hour, the time delay between data for which correlation is to be calculated is defined as one hour. Alternatively, a time delay having a high correlation may be empirically set as a parameter by analyzing past data using a plurality of time delays.
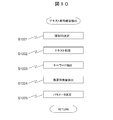
- This process shows a procedure for converting text-based original data into text-based feature values using the feature-value / keyword correspondence table 7010.
- the feature quantity extraction unit 1012 determines what kind of data is the original data 1021 stored in the storage device 1020, and determines that the original data 1021 is text-based original data 3010
- the data ID 5012 is assigned to the original data 3010 (S1001).
- the feature quantity extraction unit 1012 performs text processing on the original data 3010 obtained from the text data 1005 using natural language processing techniques such as word segmentation and part-of-speech identification (S1002).
- the processed results include words that are generally too difficult to use as keywords, numbers, particles, particles that are not independent words, and the like. Therefore, the feature quantity extraction unit 1012 extracts from the original data 3010 what can be a keyword using the frequency, the part of speech, and other features (S1003).
- the feature quantity extraction unit 1012 uses the feature quantity / keyword table 7010 to extract converted feature quantities from the keywords (S1004). For example, in the feature / keyword table 7010, all the lines including the keyword extracted from the current data are extracted, and the weighted average of the extracted lines is converted by the keyword weight. And
- the keyword “vapor pressure” is on the first and second lines in the feature quantity / keyword table 7010
- the keyword “high temperature” is on the first and third lines in the feature quantity / keyword table 7010.
- the weight for the feature amount in the first row is obtained by adding the weights derived from “vapor pressure” and “high temperature”
- the weight for the feature amount in the second row is set as the weight of “vapor pressure”.
- the eye performs a weighted average among the three representative feature amounts as the “high temperature” weight.
- the feature quantity extraction unit 1012 determines parameters (S1005). As in the process of FIG. 9, the parameter is determined by using data given manually or by using past data, depending on the data contents.
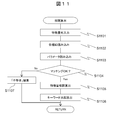
- This process shows a procedure for calculating the correlation between the two feature amounts converted by the processes of FIGS. 9 and 10.
- the parameters of both feature values are viewed, and if they match, the correlation is calculated, and otherwise, the values indicating mismatch are returned assuming that the parameters of both features do not match. It is said.
- the correlation calculation unit 1013 inputs the feature amounts of the two target data from the feature amount data 1022 stored in the storage device 1020 (S1101).
- the correlation calculation unit 1013 reads various IDs from the input feature amount (S1102).
- the various IDs are the above-described type IDs indicating the types of feature quantities and IDs indicating the origin of data.
- the correlation calculation unit 1013 reads parameters corresponding to various IDs of the partner feature amount (S1103).
- the parameter describes a delay time with respect to a partner that can be matched.
- the correlation calculation unit 1013 determines whether or not each read parameter is matched (S1104). As a result of examining the parameters, if the combination can be matched, the time delay specified by the parameter is calculated. Along with this, a correlation value of the feature amount is calculated (S1105). For example, when the time delay of each read parameter satisfies the condition of time resolution and matching is established between both feature quantities, the correlation calculation unit 1013 calculates a correlation value between both feature quantities.
- the correlation calculation unit 1013 also calculates the degree of co-occurrence between keywords (S1106). For example, the correlation calculation unit 1013 selects, from the keyword 4014 and the keyword 5014, the keyword 4014 and the keyword 5014 in which the time delay of each read parameter satisfies the time resolution condition, and between the selected keyword 4014 and the keyword 5014. The co-occurrence degree of is calculated.
- the degree of co-occurrence of keywords is an amount indicating what percentage of common keywords are present between the feature amounts of each other. For example, (number of common keywords) / ⁇ (Total number of keywords in data 1) ⁇ (total number of keywords in data 2) ⁇ It is calculated using the following formula.
- the correlation calculation unit 1013 returns a determination result of “mismatch” (S1107).
- mismatch when the amount of time delay is larger than the time width stored in each feature amount, it is determined that the matching is impossible.
- the feature amount extraction unit 1012 is a feature amount / keyword correspondence table that manages a plurality of pieces of data having different types or time resolutions, which are data generated for each event, and managing the relationship between the pieces of data.
- 7010 functions as a data conversion unit that converts data into a data format common to each data
- the correlation calculation unit 1013 functions as a correlation calculation unit that calculates the correlation of each data obtained by the feature amount extraction unit 1012 To do.
- the feature amount extraction unit 1012 generates data for each event, which is measurement data obtained by measurement by the measuring device or language data (text data) indicating the work record of the worker, and is generated for each event.
- data for each event is measurement data obtained by measurement by the measuring device or language data (text data) indicating the work record of the worker, and is generated for each event.
- a numerical feature quantity (first numerical feature quantity data) 4015 indicating the feature quantity of the measurement data is selected from the measurement data.
- Extraction is performed for each time resolution, and each extracted numeric feature 4015 is converted into a keyword (first language data) 4014 related to language data based on a feature / keyword correspondence table (relevance information) 7010, A keyword (second language data) 5014 related to the event is extracted from the language data for each time resolution, and each extracted keyword is extracted.
- 014 a numerical feature value based on the (first numerical feature data) 5015, functions as a data converter for converting the numerical feature amount indicating a feature value of the keyword 5014 (second numerical feature data) 5015.
- the correlation calculation unit 1013 is specified by parameters 4016 and 5016 added to measurement data or language data (text data) from the numeric feature 4015 and the numeric feature 5015 obtained by the feature extraction unit 1012.
- a numerical feature quantity 4015 and a numerical feature quantity 5015 (numerical feature quantity for which matching is established) satisfying a time resolution condition are selected, and a correlation between the selected numerical feature quantity 4015 and the numerical feature quantity 5015 is calculated.
- the keyword 4014 and the keyword 5014 obtained by the quantity extraction unit 1012 the keyword 4014 and the keyword 5014 satisfying the time resolution condition specified by the parameters 4016 and 5016 added to the measurement data or language data (text data). (Keyword that matches), Functioning as correlation calculating unit that calculates a correlation between the keywords 4014 and the keyword 5014-option was.
- the feature quantity extraction unit 1012 when there is insufficient numeric feature quantity data in the numeric feature quantity data of each time resolution (time scale), the missing numeric feature quantity data is referred to as the numeric feature quantity data. It functions as a data conversion unit that estimates from numerical feature quantity data having other time resolutions having different time resolutions or numerical feature quantity data having the same time resolution as deficient numerical feature quantity data.
- the feature quantity / keyword correspondence table 7010 by using the feature quantity / keyword correspondence table 7010, even when text data (language data) and measurement data are mixed as multiple types of data, the correlation between the multiple types of data is calculated. can do.
- the correlation between different types of data can be calculated with an appropriate time scale, for example, with a time delay.
- the present embodiment by setting importance and correlation criteria and calculating only the correlation of partial data, the relevance of a wide range of data can be monitored, but the calculation amount and data amount are suppressed. Is possible. In addition, it is possible to change the data amount as necessary while leaving data in order from the highest importance.
- the method of the first embodiment it is possible to calculate the correlation even between different types of data.
- the calculation time and the storage device are all calculated. Difficult due to capacity issues. Therefore, a method for presenting an approximate relationship based on partial calculation by some method is required. In the present embodiment, therefore, the method is provided by calculating the importance of the data.
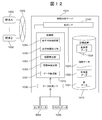
- FIG. 12 is a block diagram showing a second embodiment of the computer system according to the present invention.
- an approximate correlation calculation unit 1015 that calculates a correlation between other elements for which no correlation is calculated based on the correlation calculated by the correlation calculation unit 1013 is added to the processing unit 1010, and the storage device
- the importance level data 1024 is added in 1020, and the other configuration is the same as that of the first embodiment shown in FIG.
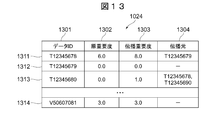
- FIG. 13 is a configuration diagram of importance data used in this embodiment.
- importance level data 1024 includes a data ID 1301, an original importance level 1302, a propagation importance level 1303, and a propagation source 1304, and each row 1311 to 1314 corresponds to one piece of data. The calculation procedure will be described later.
- the data ID 1301 is an identifier for identifying the importance data 1024.
- the original importance 1302 is information indicating the original importance of each data.
- the propagation importance 1303 is information calculated based on the correlation status and the original importance.
- the propagation source 1304 is information indicating the data propagation source.
- This process is a procedure for performing the above-described calculation of importance and correlation calculation of only partial data in the present embodiment. This procedure is performed for each new data and all existing data every time one sensor data 1004 or text data 1005 is added as new data.
- the correlation calculation unit 1013 first inputs the feature amount of the input new data (S1401), and then determines the original importance for the input new data (S1402).
- the original importance of the new data is determined in consideration of the frequency that has become a major factor in the past cause analysis, whether it was related to an important event, and the like.
- the correlation calculation unit 1013 reads the existing data in order (S1403), and proceeds to the correlation calculation procedure between each read existing data and new data.
- the correlation calculation unit 1013 reads the importance of propagation of existing data that has already been calculated (definition will be described later) (S1409), and calculates the correlation between the existing data and new data (S1405). .
- the correlation calculation unit 1013 calculates a link importance level index from the calculated correlation value (S1406).
- the connection importance is an index determined for each pair of data, and represents both the correlation and the importance by a single numerical value. That is, the connection importance is an amount that takes a larger value as the correlation is higher and the importance is higher.
- the correlation calculation unit 1013 determines whether or not the connection importance is greater than a storage threshold (S1407). If the connection importance is greater than a predetermined storage threshold, the correlation is stored ( S1408), the propagation importance of new data is calculated (S1409).
- the coefficient is a predetermined value, and is a coefficient for preventing the propagation importance from becoming an excessively large value, such as the reciprocal of the average combination number of all past data. .
- the correlation calculation unit 1013 updates the propagation importance of existing data (S1410).
- (Updated propagation importance) (Propagation importance before update) + (Coefficient) ⁇ (Propagation importance of new data) ⁇ (Magnitude of correlation)
- the coefficient is a predetermined value, and is set in the same manner as in the case of the propagation importance of new data.
- step S1407 determines whether all the processing of existing data has been completed. If it is determined (S1411) and there is a process for the next existing data, the process returns to the process in step S1409 and the processes in steps S1409 to S1411 are repeated for the next existing data. If it is determined that the processing has been completed, the processing in this routine is repeated.
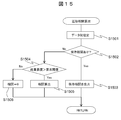
- This process shows a procedure for approximately calculating the correlation between arbitrary data.
- the approximate correlation calculation unit 1015 designates a data pair whose correlation is to be calculated (S1501).
- the approximate correlation calculation unit 1015 determines whether the above-described stored correlation exists for the specified data pair (S1502). If the stored correlation exists, the stored correlation is output (S1503). .
- the approximate correlation calculation unit 1015 calculates the importance of each data, and determines whether both importances are larger than the calculation threshold (S1504). If it is determined that both importance levels are larger than the calculated threshold value, the correlation between both data is calculated (S1505), and there is data with a degree of importance less than the calculated threshold value, and both importance levels are not greater than the calculated threshold value. Is determined, the correlation between the two data is approximately zero (S1506).
- the importance the value is used when the propagation importance exists in the data, and the original importance is used when the propagation importance does not exist.
- the importance of the connection between events is calculated using the importance of each event and the magnitude of the correlation, and only the correlation of the partial data is calculated based on the calculation result.
- the amount of calculation and data can be reduced.
- this invention is not limited to the above-mentioned Example, Various modifications are included.
- the above-described embodiments have been described in detail for easy understanding of the present invention, and are not necessarily limited to those having all the configurations described.
- a part of the configuration of one embodiment can be replaced with the configuration of another embodiment, and the configuration of another embodiment can be added to the configuration of one embodiment.
- the feature amount extraction unit 1012 includes a numerical feature amount (first numerical feature amount) indicating the feature amount of the measurement data from the measurement data.
- Data 4014 is extracted, and the extracted numerical feature quantity 4014 is converted into a keyword (first language data) 4014 based on the feature quantity / keyword correspondence table 7010, and a keyword related to an event is selected from the language data.
- (Second language data) 5014 is extracted, and the extracted keyword 5014 functions as a data conversion unit that converts the extracted keyword 5014 into a numerical feature quantity (second numerical feature quantity data) 5015 based on the feature quantity / keyword correspondence table 7010. .
- the correlation calculation unit 1013 calculates the correlation between the numeric feature 4040 and the numeric feature 5015 based on the numeric feature 4014 and the numeric feature 5015 obtained by the feature extraction unit 1012, and obtains the correlation by the feature extraction unit 1012. Based on the obtained keyword 4014 and keyword 5014, it can function as a correlation calculation unit that calculates the correlation between the keyword 4014 and the keyword 5014.
- each of the above-described configurations, functions, processing units, processing means, and the like may be realized by hardware by designing a part or all of them with, for example, an integrated circuit.
- Each of the above-described configurations, functions, and the like may be realized by software by interpreting and executing a program that realizes each function by the processor.
- Information such as programs, tables, and files that realize each function is stored in memory, a hard disk, a recording device such as an SSD (Solid State Drive), an IC (Integrated Circuit) card, an SD (Secure Digital) memory card, a DVD ( It can be recorded on a recording medium such as Digital Versatile Disc).
Landscapes
- Physics & Mathematics (AREA)
- Engineering & Computer Science (AREA)
- General Physics & Mathematics (AREA)
- Automation & Control Theory (AREA)
- Fuzzy Systems (AREA)
- Mathematical Physics (AREA)
- Quality & Reliability (AREA)
- Information Retrieval, Db Structures And Fs Structures Therefor (AREA)
Priority Applications (1)
| Application Number | Priority Date | Filing Date | Title |
|---|---|---|---|
| PCT/JP2012/065552 WO2013190627A1 (fr) | 2012-06-18 | 2012-06-18 | Dispositif d'analyse de corrélation et procédé d'analyse de corrélation |
Applications Claiming Priority (1)
| Application Number | Priority Date | Filing Date | Title |
|---|---|---|---|
| PCT/JP2012/065552 WO2013190627A1 (fr) | 2012-06-18 | 2012-06-18 | Dispositif d'analyse de corrélation et procédé d'analyse de corrélation |
Publications (1)
| Publication Number | Publication Date |
|---|---|
| WO2013190627A1 true WO2013190627A1 (fr) | 2013-12-27 |
Family
ID=49768258
Family Applications (1)
| Application Number | Title | Priority Date | Filing Date |
|---|---|---|---|
| PCT/JP2012/065552 Ceased WO2013190627A1 (fr) | 2012-06-18 | 2012-06-18 | Dispositif d'analyse de corrélation et procédé d'analyse de corrélation |
Country Status (1)
| Country | Link |
|---|---|
| WO (1) | WO2013190627A1 (fr) |
Cited By (2)
| Publication number | Priority date | Publication date | Assignee | Title |
|---|---|---|---|---|
| CN111538760A (zh) * | 2020-04-21 | 2020-08-14 | 国网信通亿力科技有限责任公司 | 一种基于Apriori算法建立配电负荷线损关联分析模型的方法 |
| CN115563175A (zh) * | 2022-10-28 | 2023-01-03 | 中国银行股份有限公司 | 金融业务的业务数据提取方法及装置 |
Citations (7)
| Publication number | Priority date | Publication date | Assignee | Title |
|---|---|---|---|---|
| JPH0895959A (ja) * | 1994-09-29 | 1996-04-12 | Hitachi Ltd | 時系列データ圧縮、解析、表示方法および解析監視装置 |
| JPH1125169A (ja) * | 1997-06-30 | 1999-01-29 | Toshiba Corp | 相関関係抽出方法 |
| JP2002015000A (ja) * | 2000-06-29 | 2002-01-18 | Toshiba Corp | 多変数時系列データ類似度判定装置 |
| JP2006031378A (ja) * | 2004-07-15 | 2006-02-02 | Nippon Hoso Kyokai <Nhk> | 時系列データ補完装置、その方法及びそのプログラム |
| JP2007279840A (ja) * | 2006-04-03 | 2007-10-25 | Omron Corp | 要因推定装置、要因推定方法、プログラムおよびコンピュータ読取可能記録媒体 |
| JP2008234618A (ja) * | 2007-02-23 | 2008-10-02 | Oki Electric Ind Co Ltd | 知識抽出装置、知識抽出方法およびコンピュータプログラム |
| JP2009265905A (ja) * | 2008-04-24 | 2009-11-12 | Toshiba Corp | 事前ルールを用いた前処理装置、前処理方法および、この前処理装置を用いた情報抽出装置、情報抽出方法 |
-
2012
- 2012-06-18 WO PCT/JP2012/065552 patent/WO2013190627A1/fr not_active Ceased
Patent Citations (7)
| Publication number | Priority date | Publication date | Assignee | Title |
|---|---|---|---|---|
| JPH0895959A (ja) * | 1994-09-29 | 1996-04-12 | Hitachi Ltd | 時系列データ圧縮、解析、表示方法および解析監視装置 |
| JPH1125169A (ja) * | 1997-06-30 | 1999-01-29 | Toshiba Corp | 相関関係抽出方法 |
| JP2002015000A (ja) * | 2000-06-29 | 2002-01-18 | Toshiba Corp | 多変数時系列データ類似度判定装置 |
| JP2006031378A (ja) * | 2004-07-15 | 2006-02-02 | Nippon Hoso Kyokai <Nhk> | 時系列データ補完装置、その方法及びそのプログラム |
| JP2007279840A (ja) * | 2006-04-03 | 2007-10-25 | Omron Corp | 要因推定装置、要因推定方法、プログラムおよびコンピュータ読取可能記録媒体 |
| JP2008234618A (ja) * | 2007-02-23 | 2008-10-02 | Oki Electric Ind Co Ltd | 知識抽出装置、知識抽出方法およびコンピュータプログラム |
| JP2009265905A (ja) * | 2008-04-24 | 2009-11-12 | Toshiba Corp | 事前ルールを用いた前処理装置、前処理方法および、この前処理装置を用いた情報抽出装置、情報抽出方法 |
Cited By (3)
| Publication number | Priority date | Publication date | Assignee | Title |
|---|---|---|---|---|
| CN111538760A (zh) * | 2020-04-21 | 2020-08-14 | 国网信通亿力科技有限责任公司 | 一种基于Apriori算法建立配电负荷线损关联分析模型的方法 |
| CN111538760B (zh) * | 2020-04-21 | 2022-09-09 | 国网信通亿力科技有限责任公司 | 一种基于Apriori算法建立配电负荷线损关联分析模型的方法 |
| CN115563175A (zh) * | 2022-10-28 | 2023-01-03 | 中国银行股份有限公司 | 金融业务的业务数据提取方法及装置 |
Similar Documents
| Publication | Publication Date | Title |
|---|---|---|
| CN109213747B (zh) | 一种数据管理方法及装置 | |
| JP4717945B2 (ja) | 業務分析プログラムおよび業務分析装置 | |
| US20120123994A1 (en) | Analyzing data quality | |
| CN113553341A (zh) | 多维数据分析方法、装置、设备及计算机可读存储介质 | |
| CN112631889B (zh) | 针对应用系统的画像方法、装置、设备及可读存储介质 | |
| KR101435096B1 (ko) | 소셜 네트워크 서비스 데이터에 기반한 상품 수요 예측 장치 및 방법 | |
| JP5588811B2 (ja) | データ分析支援システム及び方法 | |
| JP6210867B2 (ja) | データ関連性解析システムおよびデータ管理装置 | |
| JP2017084224A (ja) | 設計支援装置、プログラムおよび設計支援方法 | |
| WO2012070284A1 (fr) | Dispositif de surveillance de fonctionnement, procédé de surveillance de fonctionnement et programme de surveillance de fonctionnement | |
| Alquthami et al. | Analytics framework for optimal smart meters data processing | |
| CN118014386B (zh) | 针对区域性的用电企业数据趋势分析系统、方法及介质 | |
| CN115409381A (zh) | 线损原因的确定方法、装置、电子设备及存储介质 | |
| CN118760729A (zh) | 一种数值化降雨预报分析方法、设备及介质 | |
| JP5017434B2 (ja) | 情報処理装置およびプログラム | |
| CN107368501A (zh) | 数据的处理方法及装置 | |
| CN117273520A (zh) | 一种it产品的分析方法、装置、电子设备及存储介质 | |
| WO2013190627A1 (fr) | Dispositif d'analyse de corrélation et procédé d'analyse de corrélation | |
| US8825609B2 (en) | Detecting wasteful data collection | |
| CN116205405B (zh) | 一种基于电力大数据的分析处理方法及其系统 | |
| JP6201053B2 (ja) | 素性データ管理システム、および素性データ管理方法 | |
| CN118982256A (zh) | 一种基于大数据的bi决策管理系统和方法 | |
| JP2012088932A (ja) | 会計システム、会計方法、及びプログラム | |
| JP7499597B2 (ja) | 学習モデル構築システムおよびその方法 | |
| CN115964429A (zh) | 一种电力业务数据的报表自动生成方法及终端 |
Legal Events
| Date | Code | Title | Description |
|---|---|---|---|
| 121 | Ep: the epo has been informed by wipo that ep was designated in this application |
Ref document number: 12879505 Country of ref document: EP Kind code of ref document: A1 |
|
| NENP | Non-entry into the national phase |
Ref country code: DE |
|
| 122 | Ep: pct application non-entry in european phase |
Ref document number: 12879505 Country of ref document: EP Kind code of ref document: A1 |
|
| NENP | Non-entry into the national phase |
Ref country code: JP |