WO2014118979A1 - Dispositif et procédé de vérification de modèle de performances - Google Patents
Dispositif et procédé de vérification de modèle de performances Download PDFInfo
- Publication number
- WO2014118979A1 WO2014118979A1 PCT/JP2013/052416 JP2013052416W WO2014118979A1 WO 2014118979 A1 WO2014118979 A1 WO 2014118979A1 JP 2013052416 W JP2013052416 W JP 2013052416W WO 2014118979 A1 WO2014118979 A1 WO 2014118979A1
- Authority
- WO
- WIPO (PCT)
- Prior art keywords
- performance
- model
- verification
- model checking
- time information
- Prior art date
- Legal status (The legal status is an assumption and is not a legal conclusion. Google has not performed a legal analysis and makes no representation as to the accuracy of the status listed.)
- Ceased
Links
Images











Classifications
-
- G—PHYSICS
- G06—COMPUTING OR CALCULATING; COUNTING
- G06F—ELECTRIC DIGITAL DATA PROCESSING
- G06F11/00—Error detection; Error correction; Monitoring
- G06F11/30—Monitoring
- G06F11/34—Recording or statistical evaluation of computer activity, e.g. of down time, of input/output operation ; Recording or statistical evaluation of user activity, e.g. usability assessment
- G06F11/3447—Performance evaluation by modeling
Definitions
- the present invention relates to a performance model checking device and a performance model checking method, and in particular, a technical performance model checking device suitable for easily identifying a system performance bottleneck in model checking without operating an actual machine,
- the present invention also relates to a performance model checking method.
- Patent Document 1 discloses a technique that enables bottlenecks to be identified without requiring specialized knowledge and experience.
- This patent document 1 describes a bottleneck detection system that collects an execution history of a measurement target by a tracer, analyzes the history, and calculates a performance index using a predetermined algorithm to identify a bottleneck.
- a system that measures the performance of an information service system by simulation using a model based on a queuing theory disclosed in Patent Document 2 is known.
- model checking technique As a technique for verifying system specifications.
- Typical model checking tools include “SPIN” (for example, refer to Non-Patent Document 1), “UPPAAL” (for example, refer to Non-Patent Document 2), and the like. It has been known.
- SPIN for example, refer to Non-Patent Document 1
- UPPAAL for example, refer to Non-Patent Document 2
- model checking whether or not a given verification condition is satisfied is verified by exhaustively searching the state of the checking model. If the verification condition is not satisfied as a result of the verification, a counterexample trace which is a counter transition example is output, and the verifier identifies the cause of the problem by examining this.
- Patent Document 3 As a technique for facilitating the identification of the cause of the problem from the counterexample trace of the model check, for example, there is a disclosure in Patent Document 3.
- a plurality of counterexample traces are collected and analyzed to identify the cause of the problem by searching for processes and processes that appear in the most counterexamples.
- JP 2006-227999 A Japanese Patent Laid-Open No. 10-261010 JP 2010-205066 A
- Patent Document 1 collects an execution history of a measurement target by a tracer and analyzes it to calculate a performance index.
- performance verification using an actual machine like Patent Document 1 Since it is necessary to actually construct a system, there is a problem that the labor and cost for implementation are large. In particular, in identifying a bottleneck for performance tuning, there is a case in which eliminating one bottleneck affects another part and creates a new bottleneck. For this reason, it is necessary to perform performance verification by changing settings many times, which further increases labor and cost. For example, in the development of storage information processing devices, there is a problem that a large amount of high-performance servers are required to verify the performance under a high load assumed in actual operation, and the cost for constructing the test environment becomes enormous. Has occurred. Furthermore, performance verification using actual machines can be performed only in the downstream process of development after hardware prototyping and software implementation have been completed, so the cost of returning to the design process by finding performance problems is high.
- Patent Document 3 specifies the cause of a problem from a counterexample trace of model checking.
- the technique of Patent Document 3 is useful in identifying the cause of a problem related to a function or operation logic, but the process or processing appearing in the most counterexample traces is not necessarily the cause of a performance problem. There is a problem that it is not suitable for identifying the cause of performance problems such as bottlenecks.
- the present invention has been made to solve the above problems, and an object of the present invention is to provide a performance model checking apparatus that easily identifies a performance bottleneck of a system in model checking without operating an actual machine. is there.
- Another object of the present invention is to carry out exhaustive verification by model checking, so that bottlenecks that cause performance problems with low reproducibility that are difficult to identify by performance verification by actual machine and performance simulation must be discovered.
- An object of the present invention is to provide a performance model checking apparatus capable of performing the above.
- the performance model checking device includes a CPU and a storage device, and the CPU executes a program stored in the storage device, thereby performing performance verification based on the model check of the verification model of the target system.
- the verification model is a component in which at least one of the components operates based on time and processes a queue.
- the verification model source code describing the verification model is a component of the verification model. It has a part describing the occurrence of an event, and has a time information output instruction insertion part, a model check execution part, and a counterexample trace analysis part.
- the time information output command insertion unit generates a time information output command-completed verification model source code in which a time information output command is inserted at a location describing the occurrence of an event of a component of the input verification model source code.
- the model checking execution unit executes the model checking tool using the input performance verification condition and the time information output instruction inserted verification model source code, and generates a counterexample trace.
- the counterexample trace analysis unit analyzes the counterexample trace generated by the model checking execution unit to calculate the operating rate and queue length of the components in the verification model, and based on the calculation result, the bottleneck of the target system And the calculation result and bottleneck identification information are output.
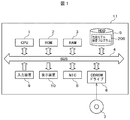
- FIG. 1 is a block diagram showing a hardware configuration of the performance model checking apparatus according to the first embodiment of the present invention.
- FIG. 2 is a block diagram showing a software configuration of the performance model checking device according to the first embodiment of the present invention.
- the performance model checking device 11 is, for example, a personal computer, a server, or dedicated hardware, and includes a CPU (Central Processing Unit) 1, a ROM (Read Only Memory) 2, and a RAM (Random Access Memory) 3. , HDD (Hard Disk Drive) 5, input device 9, display device 10, NIC (Network Interface Card) 8, and CD-ROM drive 6 are connected by BUS4.
- a CPU Central Processing Unit
- ROM Read Only Memory
- RAM Random Access Memory
- HDD Hard Disk Drive
- input device 9 display device
- NIC Network Interface Card
- CD-ROM drive 6 CD-ROM drive 6
- the CPU 1 is a main part of the computer and is the center that controls the arithmetic processing and each part, and loads the performance model checking program 200 stored in the HDD 5 into the RAM 3 and executes it.
- the ROM 2 is a read-only semiconductor memory device that stores a boot program such as BIOS.
- the RAM 3 is a rewritable semiconductor storage device that stores various programs such as an OS (Operating System) and a performance model inspection program 200, work data, and the like, and serves as a main storage device of the performance model inspection device 11.
- OS Operating System
- performance model inspection program 200 work data, and the like
- the HDD 5 is a large-capacity storage device, and is an auxiliary storage device that stores various programs such as an OS and performance model checking program, data used for the program, and the like.
- the CD-ROM drive 6 is a device that reads programs and data stored in a CD-ROM (Compact Disc Read Only Memory) 7.
- the NIC 8 is a device that controls communication with the network.
- the input device 9 is a pointing device such as a keyboard and a mouse for performing various operation instructions.
- the display device 10 is a display device such as an LCD (Liquid Crystal Display) for displaying various information.
- LCD Liquid Crystal Display
- various programs, data, and the like can be stored not only in the HDD 5 but also in a semiconductor storage device such as an SSD, and the storage medium is not limited to a CD-ROM but DVD and other magnetic, optical, semiconductor, etc. A medium using can be used.
- a program or data may be downloaded from the network via the NIC 8 and stored in the HDD 5 or the RAM 3. It does not matter whether the program or data runs on a specific OS, does not require an OS, or is a part of a file constituting a specific OS or application group.
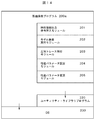
- the software configuration of the performance model checking apparatus includes a performance model checking program 200, a utility library program 220, and an OS 210 as application software.
- the OS 210 is a basic program that provides an interface between the user and the hardware and software, and the utility library program 220 hides the functions of the OS in the application software and provides various functions to the application software. It is a program to do.
- the performance model checking program 200 is application software of the performance model checking device 11, and includes a time information output command insertion module 201, a model checking execution module 202, and a counter example trace analysis module 203.
- the time information output command insertion module 201 is a module for inserting a command for outputting time information to the verification model.
- the model checking execution module 202 is a module that executes model checking under given performance checking conditions.
- the counter example trace analysis module 203 is a module that analyzes a counter example trace that is output as a result of executing model checking and outputs a report of the result.
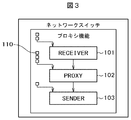
- FIG. 3 is a diagram illustrating a proxy function of a network switch to be model-checked.
- FIG. 4 is a sequence diagram of processing of the proxy function of the network switch to be model-checked.
- RECEIVER 101 As components of the proxy function of the network switch, there are RECEIVER 101, PROXY 102, and SENDER 103 as shown in FIG. 3, and these operate in parallel.
- the processing request is transmitted and the processing is executed in the order of RECEIVER, PROXY, and SENDER.
- the processing request 110 arrives while the components of the proxy function are executing processing, the processing requests are queued and executed sequentially in a FIFO (First In First Out) system.
- FIG. 3 shows that RECEIVER 101 has two waits for processing request 110, three waits for PROXY 102, and one wait for SENDER 103. Then, the time from when the network switch receives the message until SENDER completes the processing is set as the performance to be verified.
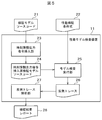
- FIG. 5 is a diagram showing functions and data flow of the entire performance model checking apparatus according to the first embodiment of the present invention.
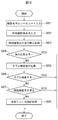
- FIG. 6 is a general chart showing processing of the performance model inspection apparatus according to the first embodiment of the present invention.
- FIG. 7 is a diagram showing the function of the time information output instruction insertion unit and the data flow.
- FIG. 8 is a flowchart showing the processing of the time information output command insertion unit.
- FIG. 9 is a diagram showing a comparison between before and after the time information output instruction insertion processing in the source code expressing the verification model.
- FIG. 10 is a diagram showing the function of the counter example trace analysis unit and the data flow.
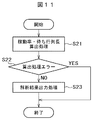
- FIG. 11 is a flowchart showing a counterexample trace analysis process (part 1).
- FIG. 12 is a diagram showing a counter example trace.
- FIG. 13 is a diagram showing a verification result report (part 1).
- the performance model checking apparatus has the hardware configuration shown in FIG. 1, and the performance model checking program stored in the HDD 5 is loaded into the RAM 3 so that the CPU 1 interprets and executes the program. Executed.
- the performance model checking device 11 includes a time information output command insertion unit 23, a model checking execution unit 25, and a counter example trace analysis unit 27.
- the time information output instruction insertion unit 23 is a part that inserts a time information output instruction into the model in order to enable analysis of the counter example trace 26 for identifying a bottleneck.
- the model checking execution unit 25 is a part that executes model checking.
- the counterexample trace analysis unit 27 analyzes the counterexample trace 26 that is output when the model check is executed, and identifies the bottleneck of the model that is the target of the model check.
- the time information output command insertion unit 23 generates the time information output command inserted verification model source code 24 as the temporary data of the processing, and the model check execution unit 25 is a counterexample.
- the trace 26 is generated and temporarily stored in the RAM 3 and the HDD 5, it is not a permanent component of the performance model checking device 11.
- each function is realized by the CPU 1 executing a program, it may be realized as hardware.
- the verification model source code 21 is a source code describing a model that can be verified by a model checking tool that is a target for performance verification and bottleneck identification.
- the verification model includes a plurality of elements that constitute a system to be verified, and each component operates in cooperation with each other by requesting a process or returning a process result.
- RECEIVER 101, PROXY 102, and SENDER 103 shown in FIG. 3 correspond to this.
- the model checking tool for example, “SPIN” and “UPPAAL” are generally used, but other model checking tools may be used.
- the performance verification conditional expression 23 is a performance requirement such as response time and throughput for verification, and is an expression that can be used as a verification expression used in the model checking tool.
- RECEIVER 101, PROXY 102, and SENDER 103 of each component of the verification model of this embodiment are expressions describing conditions such as processing a packet within 100 ms.
- the output of the performance model inspection apparatus 11 includes a verification result report 28.
- the verification result report 28 is information on the maximum queue length and operating rate of each system component obtained by analysis of the counterexample trace 26 in the counterexample trace analysis unit 27 and the bottleneck information specified by them, and is generated in the RAM 3. Then, the data is output to the NIC 8, the display device 10, and the HDD 5.
- the time information output command insertion unit 23 generates a process request event for each system component, a process start event for each system component, and a process end event for each system component included in the input verification model source code 21. By specifying a part to be described and inserting an instruction for outputting the event type and the occurrence time into the description part, the time information output instruction inserted verification model source code 24 is generated.
- the model checking execution unit 25 executes the model checking tool by using the input time information output instruction inserted verification model source code 24 and the performance verification conditional expression 22 so that the performance verification conditional expression 22 is not satisfied.
- a counterexample trace 26 is generated.
- the counterexample trace analysis unit 27 analyzes the counterexample trace 26 generated by the model check execution unit 25 to calculate the queue length and the operating rate of each system component, and identifies the system bottleneck from the calculated values. The result is generated as a verification result report 28 and output to the display device 10 or the like.
- the verification model source code 21 prepared by the user for performance verification and bottleneck identification is input to the performance model inspection apparatus 11 (S01).
- the time information output command insertion unit 23 receives a process request event for each system component included in the input verification model source code 21, a process start event for each system component, and a process end event for each system component. A place where the occurrence is described is specified, and an instruction for outputting the event type and the occurrence time is inserted into the description place (S03).
- step S04 S04
- the model checking execution unit 25 uses the model checking tool to input the time information output instruction inserted verification model source code 24 and the performance verification conditional expression 22 prepared by the user.
- the model check is executed (S05).
- the model check result is output if the performance verification conditional expression 22 is satisfied as a result of the model check execution, and the process ends. If not satisfied, the process proceeds to S07 (S07). At this time, a counter example trace 26 is generated by the model checking tool.
- the counterexample trace analysis unit 27 analyzes the counterexample trace 26 to calculate the maximum queue length and operation rate of each system component, identifies the system bottleneck, and results Is generated as a verification result report 28 and output to the display device 10 (S08).
- the time information output command insertion unit 23 includes an event search unit 31 and a command insertion unit 32, as shown in FIG.
- the event search unit 31 is a part that analyzes the verification model source code 21 and searches for a process request event for each system component in the model, a process start event for each system component, and a process end event for each system component. .
- the instruction insertion unit 32 inserts an instruction that outputs an event type and an occurrence time at an event occurrence location in the verification model source code 21 based on the search result of the event search unit 31, and a time information output instruction inserted verification model source This is the part that generates the code 24.
- time information output command insertion will be described with reference to FIG.
- the event search unit 31 analyzes the verification model source code 21 to search for a description location of a process request event for each system component in the model, a process start event for each system component, and a process end event for each system component. (S11).
- the instruction insertion unit 32 inserts an instruction that outputs the event type and the occurrence time in the event occurrence description location in the verification model 21 based on the search result of the event search unit 31, An information output instruction inserted verification model source code 24 is generated (S13).
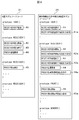
- FIG. 9 shows the source code before and after the insertion of the time information output instruction insertion processing in the verification model of the present embodiment in comparison.
- the RECEIVER processing request 41, the RECEIVER processing start 42, and the RECEIVER processing end 43 in the verification model source code 21 of FIG. 9A are a processing request event for the system component specified in step S11 and a processing start event for the system component, respectively.
- PROXY and SENDER corresponds to the time information output command in which the output command 43a is inserted.
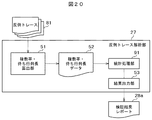
- the counterexample trace analysis unit 27 includes an operation rate / queue length calculation unit 51 and a result output unit 53.
- the operating rate / queue length calculation unit 51 analyzes the counter example trace 26 to calculate the operating rate and the maximum and average values of the operating rate and queue length of each system component in the model. This is the part that is generated as the matrix length data 52.
- the result output unit 53 identifies a bottleneck based on the operation rate / queue length data 52 and outputs the result as a verification result report 28 together with the operation rate of each system component and the maximum value and average value of the queue length. This is the output part.
- the operating rate / queue length calculation unit 51 analyzes the counterexample trace 26 to calculate the operating rate of each system component in the model and the maximum value and the average value of the queue length.
- the queue length data 52 is generated (S21).
- step S23 S22
- the result output unit 53 identifies the bottleneck based on the operation rate / queue length data 52, and the result is the maximum of the operation rate and queue length of each system component. It outputs as a verification result report 28 with a value and an average value (S23).
- step S21 an example of the counterexample trace 26 analyzed in step S21 is shown in FIG.
- the process request event for each system component in the model the process start event for each system component, and the occurrence time of the process end event for each system component are output.
- CLOCK represents a time
- COMPONENT represents a system component identification name (RECEIVER, PROXY, SENDER)
- EVENT represents an event type (START, REQEAST, END).
- the output format is not necessarily the one shown here, and any format that can extract the occurrence time of each event is acceptable.
- the operation rate of each system component the maximum value of the queue length, the calculation method of the average value, and the bottleneck identification method will be described.
- the generation times of the i-th process start event and process end event are Si and Ei, respectively.
- the operating rate of this system component is calculated from the sum of Ei-Si for all i and the ratio ⁇ (Ei-Si) / T of the time T from the start to the end in the counter example trace.
- ⁇ means the sum total of the values moved for all i.
- the queue length L (t) at each time t is obtained by subtracting 1 from the queue length every time, and the maximum value max (L (t)) and the time average ⁇ L (t) / T are obtained.
- the maximum value and average value of the queue length of this system component are calculated.
- ⁇ means the sum of all the movements for t.
- the threshold values of the maximum value and the average value of the operation rate and the queue length are 70%, 3 and 1, respectively, but other values may be used as long as they are appropriate values for specifying the bottleneck.
- the analysis result display report 61 of the verification result report 28 displays the operating rate of each system component (RECEIVER, PROXY, SENDER) in the model, the maximum value and the average value of the queue length, and the bottleneck candidate display unit 62 The system component element identified as the bottleneck included in the verification result report 28 is displayed.
- the PROXY of the component is the operation rate of 90%
- the maximum queue length is 4, and the average queue length is 2.3, it is determined that it is a bottleneck in this inspection model and displayed.
- the maximum value of the operation rate, the queue length, and the threshold value of the average value all exceed the threshold value are determined to be bottlenecks, but any two of them, or any one of them If one exceeds the threshold value, it may be determined as a bottleneck.
- the bottleneck is identified as the bottleneck of the target system by performing model checking for the proxy function of the network switch and analyzing the counterexample trace that is output has been described.
- FIG. 14 is a block diagram showing a software configuration of the performance model checking apparatus according to the second embodiment of the present invention.
- the hardware configuration of the performance model checking device 11a of this embodiment is the same as that of the performance model checking device 11 shown in FIG. 1 of the first embodiment.
- the performance model checking program 200a of the software configuration of the present embodiment has a configuration in which a performance parameter setting module 204 and a performance parameter changing module 205 are added to the performance model checking program 200 shown in FIG. 2 of the first embodiment. It is.
- the performance parameter setting module 204 is a module for setting performance parameters
- the performance parameter changing module 205 is a module for changing performance parameters.
- the performance parameter is a parameter that affects the performance in the system configuration.
- the operating frequency, buffer capacity This includes the number of ports, switching capability (number of frames that the switch can process per unit time), switching capacity (data amount that the switch can process per unit time), and the like.
- FIG. 15 is a diagram showing the functions and data flow of the entire performance model checking apparatus according to the second embodiment of the present invention.
- FIG. 16 is a general chart showing processing of the performance model inspection apparatus according to the first embodiment of the present invention.
- FIG. 17 is a flowchart showing a performance tuning procedure using the performance model checking apparatus.
- the difference between the performance model checking device 11a of this embodiment and the performance model checking device 11 of the first embodiment shown in FIG. 5 is that the processing target and the number of processors that can be set in the model are to be verified.
- a point where a performance parameter 71 which is information on a value related to the performance of the system is input, a point provided with a performance parameter setting unit 72 which sets the performance parameter 71 in the verification model source code 21, and a verification result report 28 are referred to.
- the performance parameter 71 includes a performance parameter changing unit 73 that changes and outputs a part related to the resolution of the identified bottleneck in the performance parameter 71, and other components are the same.
- step S31 the performance parameter setting unit 72 sets the performance parameter 71 in the verification model source code 21.
- the initial value of the performance parameter 71 is input to the performance model checking device 11a (S41).
- step S42 corresponds to the processing of FIG.
- the performance parameter changing unit 73 refers to the verification result report 28, and changes the part effective in eliminating the identified bottleneck in the performance parameter 71 (S45).
- the bottleneck can be specified but also the bottleneck can be easily eliminated, and the performance tuning of the computer system to be verified can be efficiently performed.
- the hardware configuration of the performance model checking device 11b of this embodiment is the same as that of the performance model checking device 11 shown in FIG. 1 of the first embodiment.
- FIG. 18 is a diagram showing the function and data flow of the entire performance model checking apparatus according to the third embodiment of the present invention.
- FIG. 19 is a general chart showing processing of the performance model inspection apparatus according to the third embodiment of the present invention.
- FIG. 20 is a diagram illustrating the function of the counter example trace analysis unit and the data flow.
- FIG. 21 is a flowchart showing the process of the counter example trace analysis unit (part 2).
- FIG. 22 is a diagram showing a verification result report (part 2). The difference between the performance model checking device 12b of this embodiment and the performance model checking device 11a in the first embodiment shown in FIG.
- model checking execution unit 25a generates a plurality of counterexample traces 81, and a counterexample.
- the trace analysis unit 27a inputs a plurality of counterexample traces 81, performs statistical processing, and outputs a statistically processed verification result report, and other components are the same.
- step S51 is added, step S07 is changed to step S07a, and step S08 is step. This is a change to S08a.
- step S07a If it is determined in step S07a that the performance verification condition is not satisfied, the process proceeds to step S51, and a predetermined number of counterexample traces are accumulated.
- the prescribed number may be a fixed value such as 100, or may be arbitrarily designated by the user by input.
- the counter example trace analysis unit 27a of this embodiment is different in that the counter example trace analysis unit 27 and the statistical processing unit 91 of the first embodiment shown in FIG.
- the operation rate / queue length calculation unit 51 calculates the maximum value and average value of the operation rate and queue length for all counter example traces 81 generated by the model checking tool.
- the calculated information is generated as the operation rate / queue length data 52 (S21).
- the calculation method is the same as the calculation method described in the first embodiment. If an error occurs in the calculation process at this time, the process ends in step S22. If there is no error in the calculation process for all counterexample traces 81, the process proceeds to step S61 (S22).
- the statistical processing unit 91 relates to all counterexample traces 81 of the operation rate, the maximum value of the queue length, and the average value for each system component based on the operation rate / queue length data 52. Statistics such as maximum value, minimum value, average value, and variance are calculated (S61).
- the result output unit 53 identifies the bottleneck based on the result of the statistical processing obtained in S61, and outputs it as a verification result report 28 together with the result of the statistical processing (S23a).
- the analysis result display report 61 of the verification result report 28 includes statistical information on all counterexample traces 81 of the operating rate, the maximum queue length, and the average value of each system component (RECEIVER, PROXY, SENDER) in the model.
- the bottleneck candidate display section 62 displays the system component (PROXY) identified as the bottleneck included in the verification result report 28.
- RECEIVER processing request time output command 42a ... RECEIVER processing start time output command 43a ... RECEIVER processing time output command 51 ... Operation rate / queue length calculation unit 52 ; Operation rate / queue length data 53 ... Result output unit 61 ... Analysis result display unit 62 ; Bottleneck candidate Display unit 71 ... performance parameter 72 ; Ability parameter setting unit 73 ; performance parameter changing section 81 ... counterexample traces 91 ... statistical processing unit
Landscapes
- Engineering & Computer Science (AREA)
- General Engineering & Computer Science (AREA)
- Theoretical Computer Science (AREA)
- Life Sciences & Earth Sciences (AREA)
- Bioinformatics & Cheminformatics (AREA)
- Bioinformatics & Computational Biology (AREA)
- Evolutionary Biology (AREA)
- Computer Hardware Design (AREA)
- Quality & Reliability (AREA)
- Physics & Mathematics (AREA)
- General Physics & Mathematics (AREA)
- Debugging And Monitoring (AREA)
Abstract
La présente invention concerne un dispositif de vérification de modèle de performances qui possède une unité d'insertion de commandes de sortie d'informations temporelles, une unité d'exécution de vérification de modèle et une unité d'analyse de trace de contre-exemple. L'unité d'insertion de commandes de sortie d'informations temporelles génère un code de sources de modèle de vérification à insertion de commande de sortie d'informations temporelles dans lequel des commandes de sortie d'informations temporelles ont été insérées en des endroits décrivant des occurrences d'événements pour des composantes de code de source de modèle de vérification qui ont été saisies. Ensuite, l'unité d'exécution de vérification de modèle exécute un outil de vérification de modèle à l'aide d'une condition de vérification de performances qui a été entrée et du code de source de modèle de vérification à insertion de commandes de sortie d'informations temporelles de façon à générer une trace de contre-exemple. Puis l'unité d'analyse de trace de contre-exemple analyse la trace de contre-exemple de façon à calculer le taux d'utilisation et une longueur de file d'attente de composantes à l'intérieur du modèle de vérification, à identifier des goulots d'étranglement du système soumis à vérification sur la base du résultat du calcul et à sortir le résultat du calcul et les informations d'identification du goulot d'étranglement. Il en résulte qu'il est possible d'identifier facilement un goulot d'étranglement de performances d'un système dans une vérification de modèle sans faire fonctionner la machine réelle.
Priority Applications (1)
| Application Number | Priority Date | Filing Date | Title |
|---|---|---|---|
| PCT/JP2013/052416 WO2014118979A1 (fr) | 2013-02-01 | 2013-02-01 | Dispositif et procédé de vérification de modèle de performances |
Applications Claiming Priority (1)
| Application Number | Priority Date | Filing Date | Title |
|---|---|---|---|
| PCT/JP2013/052416 WO2014118979A1 (fr) | 2013-02-01 | 2013-02-01 | Dispositif et procédé de vérification de modèle de performances |
Publications (1)
| Publication Number | Publication Date |
|---|---|
| WO2014118979A1 true WO2014118979A1 (fr) | 2014-08-07 |
Family
ID=51261721
Family Applications (1)
| Application Number | Title | Priority Date | Filing Date |
|---|---|---|---|
| PCT/JP2013/052416 Ceased WO2014118979A1 (fr) | 2013-02-01 | 2013-02-01 | Dispositif et procédé de vérification de modèle de performances |
Country Status (1)
| Country | Link |
|---|---|
| WO (1) | WO2014118979A1 (fr) |
Cited By (1)
| Publication number | Priority date | Publication date | Assignee | Title |
|---|---|---|---|---|
| CN113923143A (zh) * | 2020-07-07 | 2022-01-11 | 中移(苏州)软件技术有限公司 | 一种云网络的调整方法、装置以及存储介质 |
Citations (5)
| Publication number | Priority date | Publication date | Assignee | Title |
|---|---|---|---|---|
| JPH05173847A (ja) * | 1991-12-19 | 1993-07-13 | Fujitsu Ltd | プログラム実行時間測定方法 |
| JP2004318474A (ja) * | 2003-04-16 | 2004-11-11 | Fujitsu Ltd | システムの使用資源を調整する装置および方法 |
| WO2008114323A1 (fr) * | 2007-03-20 | 2008-09-25 | Fujitsu Microelectronics Limited | Appreil de support d'optimisation de processeur/de système et procédé de support |
| JP2010128513A (ja) * | 2008-11-25 | 2010-06-10 | Toshiba Corp | モデル検査装置及びモデル検査方法 |
| JP2010157105A (ja) * | 2008-12-26 | 2010-07-15 | Toshiba Corp | モデル検査用プログラム作成装置 |
-
2013
- 2013-02-01 WO PCT/JP2013/052416 patent/WO2014118979A1/fr not_active Ceased
Patent Citations (5)
| Publication number | Priority date | Publication date | Assignee | Title |
|---|---|---|---|---|
| JPH05173847A (ja) * | 1991-12-19 | 1993-07-13 | Fujitsu Ltd | プログラム実行時間測定方法 |
| JP2004318474A (ja) * | 2003-04-16 | 2004-11-11 | Fujitsu Ltd | システムの使用資源を調整する装置および方法 |
| WO2008114323A1 (fr) * | 2007-03-20 | 2008-09-25 | Fujitsu Microelectronics Limited | Appreil de support d'optimisation de processeur/de système et procédé de support |
| JP2010128513A (ja) * | 2008-11-25 | 2010-06-10 | Toshiba Corp | モデル検査装置及びモデル検査方法 |
| JP2010157105A (ja) * | 2008-12-26 | 2010-07-15 | Toshiba Corp | モデル検査用プログラム作成装置 |
Cited By (2)
| Publication number | Priority date | Publication date | Assignee | Title |
|---|---|---|---|---|
| CN113923143A (zh) * | 2020-07-07 | 2022-01-11 | 中移(苏州)软件技术有限公司 | 一种云网络的调整方法、装置以及存储介质 |
| CN113923143B (zh) * | 2020-07-07 | 2023-04-07 | 中移(苏州)软件技术有限公司 | 一种云网络的调整方法、装置以及存储介质 |
Similar Documents
| Publication | Publication Date | Title |
|---|---|---|
| JP6607565B2 (ja) | セーフティクリティカルソフトウェアのための統合された自動テストケース生成 | |
| US20170235663A1 (en) | Service demand based performance prediction using a single workload | |
| US9053263B2 (en) | Scheduling discrete event simulation | |
| CN101650687A (zh) | 一种大规模并行程序性能预测实现方法 | |
| US9396095B2 (en) | Software verification | |
| CN111651341B (zh) | 一种通用处理器的性能评估方法 | |
| CN102541723A (zh) | 用于软件测试的自动化测试装置 | |
| US20160077860A1 (en) | Virtual machine placement determination device, virtual machine placement determination method, and virtual machine placement determination program | |
| CN111367786B (zh) | 一种符号执行方法、电子设备以及存储介质 | |
| CN119271545A (zh) | 应用于异构多核芯片的代码评估与转换方法及系统、介质 | |
| WO2016018352A1 (fr) | Sélection de configuration de plate-forme basée sur une durée d'exécution dégradée | |
| Willnecker et al. | Optimization of deployment topologies for distributed enterprise applications | |
| JPWO2014188638A1 (ja) | 共有リスクグループ管理システム、共有リスクグループ管理方法および共有リスクグループ管理プログラム | |
| WO2006022204A1 (fr) | Dispositif et procédé d’analyse de programme source | |
| US20080244583A1 (en) | Conflicting sub-process identification method, apparatus and computer program | |
| WO2019163915A1 (fr) | Dispositif et programme d'analyse de projet | |
| WO2014118979A1 (fr) | Dispositif et procédé de vérification de modèle de performances | |
| JP7706020B2 (ja) | 検証システム及び検証方法 | |
| CN118963728A (zh) | 软件跨平台切换管理方法及相关设备 | |
| JP5463226B2 (ja) | ソースコード検査方法およびソースコード検査装置 | |
| JP5875607B2 (ja) | 性能モデル検査装置、方法およびプログラム | |
| Sriraman et al. | Understanding acceleration opportunities at hyperscale | |
| KR101845208B1 (ko) | 데이터베이스와 애플리케이션을 위한 웹기반 성능개선 방법 | |
| Saidi et al. | End-to-end performance forecasting: finding bottlenecks before they happen | |
| JP4918868B2 (ja) | 入力値選定プログラム、入力値選定方法および入力値選定装置 |
Legal Events
| Date | Code | Title | Description |
|---|---|---|---|
| 121 | Ep: the epo has been informed by wipo that ep was designated in this application |
Ref document number: 13874044 Country of ref document: EP Kind code of ref document: A1 |
|
| NENP | Non-entry into the national phase |
Ref country code: DE |
|
| 122 | Ep: pct application non-entry in european phase |
Ref document number: 13874044 Country of ref document: EP Kind code of ref document: A1 |
|
| NENP | Non-entry into the national phase |
Ref country code: JP |