WO2014136276A1 - Dispositif pour régler une région d'intérêt pour une analyse - Google Patents
Dispositif pour régler une région d'intérêt pour une analyse Download PDFInfo
- Publication number
- WO2014136276A1 WO2014136276A1 PCT/JP2013/056538 JP2013056538W WO2014136276A1 WO 2014136276 A1 WO2014136276 A1 WO 2014136276A1 JP 2013056538 W JP2013056538 W JP 2013056538W WO 2014136276 A1 WO2014136276 A1 WO 2014136276A1
- Authority
- WO
- WIPO (PCT)
- Prior art keywords
- region
- small
- integration
- area
- pixels
- Prior art date
- Legal status (The legal status is an assumption and is not a legal conclusion. Google has not performed a legal analysis and makes no representation as to the accuracy of the status listed.)
- Ceased
Links
Images






Classifications
-
- G—PHYSICS
- G01—MEASURING; TESTING
- G01N—INVESTIGATING OR ANALYSING MATERIALS BY DETERMINING THEIR CHEMICAL OR PHYSICAL PROPERTIES
- G01N21/00—Investigating or analysing materials by the use of optical means, i.e. using sub-millimetre waves, infrared, visible or ultraviolet light
- G01N21/17—Systems in which incident light is modified in accordance with the properties of the material investigated
- G01N21/25—Colour; Spectral properties, i.e. comparison of effect of material on the light at two or more different wavelengths or wavelength bands
- G01N21/31—Investigating relative effect of material at wavelengths characteristic of specific elements or molecules, e.g. atomic absorption spectrometry
- G01N21/35—Investigating relative effect of material at wavelengths characteristic of specific elements or molecules, e.g. atomic absorption spectrometry using infrared light
-
- G—PHYSICS
- G01—MEASURING; TESTING
- G01J—MEASUREMENT OF INTENSITY, VELOCITY, SPECTRAL CONTENT, POLARISATION, PHASE OR PULSE CHARACTERISTICS OF INFRARED, VISIBLE OR ULTRAVIOLET LIGHT; COLORIMETRY; RADIATION PYROMETRY
- G01J3/00—Spectrometry; Spectrophotometry; Monochromators; Measuring colours
- G01J3/02—Details
- G01J3/0205—Optical elements not provided otherwise, e.g. optical manifolds, diffusers, windows
- G01J3/0248—Optical elements not provided otherwise, e.g. optical manifolds, diffusers, windows using a sighting port, e.g. camera or human eye
-
- G—PHYSICS
- G01—MEASURING; TESTING
- G01J—MEASUREMENT OF INTENSITY, VELOCITY, SPECTRAL CONTENT, POLARISATION, PHASE OR PULSE CHARACTERISTICS OF INFRARED, VISIBLE OR ULTRAVIOLET LIGHT; COLORIMETRY; RADIATION PYROMETRY
- G01J3/00—Spectrometry; Spectrophotometry; Monochromators; Measuring colours
- G01J3/02—Details
- G01J3/0275—Details making use of sensor-related data, e.g. for identification of sensor parts or optical elements
-
- G—PHYSICS
- G01—MEASURING; TESTING
- G01J—MEASUREMENT OF INTENSITY, VELOCITY, SPECTRAL CONTENT, POLARISATION, PHASE OR PULSE CHARACTERISTICS OF INFRARED, VISIBLE OR ULTRAVIOLET LIGHT; COLORIMETRY; RADIATION PYROMETRY
- G01J3/00—Spectrometry; Spectrophotometry; Monochromators; Measuring colours
- G01J3/02—Details
- G01J3/0289—Field-of-view determination; Aiming or pointing of a spectrometer; Adjusting alignment; Encoding angular position; Size of measurement area; Position tracking
-
- G—PHYSICS
- G01—MEASURING; TESTING
- G01J—MEASUREMENT OF INTENSITY, VELOCITY, SPECTRAL CONTENT, POLARISATION, PHASE OR PULSE CHARACTERISTICS OF INFRARED, VISIBLE OR ULTRAVIOLET LIGHT; COLORIMETRY; RADIATION PYROMETRY
- G01J3/00—Spectrometry; Spectrophotometry; Monochromators; Measuring colours
- G01J3/02—Details
- G01J3/10—Arrangements of light sources specially adapted for spectrometry or colorimetry
- G01J3/108—Arrangements of light sources specially adapted for spectrometry or colorimetry for measurement in the infrared range
-
- G—PHYSICS
- G01—MEASURING; TESTING
- G01J—MEASUREMENT OF INTENSITY, VELOCITY, SPECTRAL CONTENT, POLARISATION, PHASE OR PULSE CHARACTERISTICS OF INFRARED, VISIBLE OR ULTRAVIOLET LIGHT; COLORIMETRY; RADIATION PYROMETRY
- G01J3/00—Spectrometry; Spectrophotometry; Monochromators; Measuring colours
- G01J3/28—Investigating the spectrum
-
- G—PHYSICS
- G01—MEASURING; TESTING
- G01J—MEASUREMENT OF INTENSITY, VELOCITY, SPECTRAL CONTENT, POLARISATION, PHASE OR PULSE CHARACTERISTICS OF INFRARED, VISIBLE OR ULTRAVIOLET LIGHT; COLORIMETRY; RADIATION PYROMETRY
- G01J3/00—Spectrometry; Spectrophotometry; Monochromators; Measuring colours
- G01J3/28—Investigating the spectrum
- G01J3/45—Interferometric spectrometry
- G01J3/453—Interferometric spectrometry by correlation of the amplitudes
-
- G—PHYSICS
- G02—OPTICS
- G02B—OPTICAL ELEMENTS, SYSTEMS OR APPARATUS
- G02B21/00—Microscopes
- G02B21/36—Microscopes arranged for photographic purposes or projection purposes or digital imaging or video purposes including associated control and data processing arrangements
- G02B21/361—Optical details, e.g. image relay to the camera or image sensor
-
- G—PHYSICS
- G02—OPTICS
- G02B—OPTICAL ELEMENTS, SYSTEMS OR APPARATUS
- G02B21/00—Microscopes
- G02B21/36—Microscopes arranged for photographic purposes or projection purposes or digital imaging or video purposes including associated control and data processing arrangements
- G02B21/365—Control or image processing arrangements for digital or video microscopes
-
- G—PHYSICS
- G06—COMPUTING OR CALCULATING; COUNTING
- G06T—IMAGE DATA PROCESSING OR GENERATION, IN GENERAL
- G06T7/00—Image analysis
- G06T7/0002—Inspection of images, e.g. flaw detection
- G06T7/0004—Industrial image inspection
-
- G—PHYSICS
- G06—COMPUTING OR CALCULATING; COUNTING
- G06T—IMAGE DATA PROCESSING OR GENERATION, IN GENERAL
- G06T7/00—Image analysis
- G06T7/10—Segmentation; Edge detection
- G06T7/11—Region-based segmentation
-
- G—PHYSICS
- G06—COMPUTING OR CALCULATING; COUNTING
- G06V—IMAGE OR VIDEO RECOGNITION OR UNDERSTANDING
- G06V10/00—Arrangements for image or video recognition or understanding
- G06V10/70—Arrangements for image or video recognition or understanding using pattern recognition or machine learning
- G06V10/74—Image or video pattern matching; Proximity measures in feature spaces
- G06V10/75—Organisation of the matching processes, e.g. simultaneous or sequential comparisons of image or video features; Coarse-fine approaches, e.g. multi-scale approaches; using context analysis; Selection of dictionaries
- G06V10/751—Comparing pixel values or logical combinations thereof, or feature values having positional relevance, e.g. template matching
-
- G—PHYSICS
- G06—COMPUTING OR CALCULATING; COUNTING
- G06V—IMAGE OR VIDEO RECOGNITION OR UNDERSTANDING
- G06V20/00—Scenes; Scene-specific elements
- G06V20/60—Type of objects
- G06V20/69—Microscopic objects, e.g. biological cells or cellular parts
- G06V20/695—Preprocessing, e.g. image segmentation
-
- G—PHYSICS
- G01—MEASURING; TESTING
- G01N—INVESTIGATING OR ANALYSING MATERIALS BY DETERMINING THEIR CHEMICAL OR PHYSICAL PROPERTIES
- G01N21/00—Investigating or analysing materials by the use of optical means, i.e. using sub-millimetre waves, infrared, visible or ultraviolet light
- G01N21/17—Systems in which incident light is modified in accordance with the properties of the material investigated
- G01N21/25—Colour; Spectral properties, i.e. comparison of effect of material on the light at two or more different wavelengths or wavelength bands
- G01N21/31—Investigating relative effect of material at wavelengths characteristic of specific elements or molecules, e.g. atomic absorption spectrometry
- G01N21/35—Investigating relative effect of material at wavelengths characteristic of specific elements or molecules, e.g. atomic absorption spectrometry using infrared light
- G01N2021/3595—Investigating relative effect of material at wavelengths characteristic of specific elements or molecules, e.g. atomic absorption spectrometry using infrared light using FTIR
-
- G—PHYSICS
- G06—COMPUTING OR CALCULATING; COUNTING
- G06T—IMAGE DATA PROCESSING OR GENERATION, IN GENERAL
- G06T2207/00—Indexing scheme for image analysis or image enhancement
- G06T2207/10—Image acquisition modality
- G06T2207/10048—Infrared image
-
- G—PHYSICS
- G06—COMPUTING OR CALCULATING; COUNTING
- G06T—IMAGE DATA PROCESSING OR GENERATION, IN GENERAL
- G06T2207/00—Indexing scheme for image analysis or image enhancement
- G06T2207/10—Image acquisition modality
- G06T2207/10056—Microscopic image
-
- G—PHYSICS
- G06—COMPUTING OR CALCULATING; COUNTING
- G06T—IMAGE DATA PROCESSING OR GENERATION, IN GENERAL
- G06T2207/00—Indexing scheme for image analysis or image enhancement
- G06T2207/20—Special algorithmic details
- G06T2207/20048—Transform domain processing
- G06T2207/20056—Discrete and fast Fourier transform, [DFT, FFT]
-
- G—PHYSICS
- G06—COMPUTING OR CALCULATING; COUNTING
- G06T—IMAGE DATA PROCESSING OR GENERATION, IN GENERAL
- G06T2207/00—Indexing scheme for image analysis or image enhancement
- G06T2207/30—Subject of image; Context of image processing
- G06T2207/30108—Industrial image inspection
- G06T2207/30164—Workpiece; Machine component
Definitions
- the present invention relates to an apparatus for setting an analysis target region in an observation image of a sample acquired by an observation optical system such as an optical microscope.
- the microspectroscopic analyzer is an apparatus including an observation optical system for microscopic observation of a sample surface and an analysis system for performing spectroscopic analysis on a part or all of the observed region.
- an irradiation optical system that irradiates infrared light as the analysis system and an aperture that irradiates infrared light only to a specific minute region of the sample surface.
- an infrared detector for detecting reflected light or transmitted light from the sample that has passed through the aperture.
- the microinfrared spectroscopy analyzer is simply referred to as an infrared microscope.
- the infrared microscope In the infrared microscope, a visible light observation image of the sample surface is acquired by the observation optical system, and the position, size, and orientation (angle) of the aperture are designated from the visible light observation image.
- an infrared microscope usually, a user views a visible light observation image and designates the position, size, and orientation of the aperture with a pointing device such as a mouse.
- a pointing device such as a mouse.
- an infrared microscope is provided in which a characteristic image region is extracted from an observed image, and the position of the aperture and the like are automatically set for this region.
- Patent Document 1 describes an infrared microscope that extracts a feature image region by performing processing such as edge extraction and binarization based on hue, luminance, and the like on an observation image of a sample. Further, when the user designates an appropriate position in the observation image with a pointing device or the like, an area having a luminance value in a predetermined range centered on the luminance value based on, for example, the luminance value at the designated position is set as the feature image area. Some infrared microscopes are extracted.
- the region to be analyzed includes regions having such a texture, these regions are heterogeneous regions that are not included in the feature image region by the above-described automatic processing (referred to as “pseudo heterogeneous regions”). Will be processed.
- the aperture is also set so as not to include the quasi-heterogeneous area, and the size of the aperture is This is very small compared to the size of the area to be analyzed. Thereby, the signal intensity obtained by using this aperture becomes a low level, and the S / N ratio of the analysis data is lowered.
- the appearance of such a quasi-heterogeneous region can be avoided by adjusting the threshold (for example, the above-mentioned “predetermined range”).
- the threshold for example, the above-mentioned “predetermined range”.
- the optimum threshold varies depending on the sample, a large number of different samples are analyzed sequentially. In this case, it is necessary to adjust the threshold value each time, which increases the user's trouble.
- the above problems are not limited to the infrared microscope, and based on the observation image of the sample, a region to be analyzed by the user (hereinafter referred to as “analysis target region”) is set therein, and the analysis target region It generally occurs in an analyzer that performs the analysis of
- the problem to be solved by the present invention is based on an observation image of a sample obtained with an optical microscope or the like, and when setting an analysis target region therein, the analysis target region is accurately set regardless of the texture of the sample surface.
- Another object of the present invention is to provide an analysis target area setting device capable of performing the above.
- An apparatus for setting an analysis target area which is an area to be analyzed by an analyzer, in an observation area of a sample, Pixel information acquisition means for acquiring pixel information of each pixel constituting the observation region; A small area forming unit that classifies each pixel according to the pixel information, and uses one or more pixels that belong to the same classification as a small area; Integration information calculation means for obtaining feature values relating to some or all pixels in each small region as integration information; Based on the integration information, an area integration means for integrating the small area with one small area adjacent to the small area; It is characterized by providing.
- the area integration unit is configured to calculate the difference between the number of pixels in each small area and the statistical value of pixel information of all pixels in each small area and the statistical value of pixel information of all pixels in the small area adjacent to the small area. Based on the above, two adjacent small regions may be integrated.
- the region integration means may calculate two adjacent small regions based on the number of pixels located at the boundary between each small region and the adjacent small region, and the statistical value of the pixel information of the pixels adjacent at the boundary. The areas may be integrated. Further, the region integration unit integrates adjacent small regions based on the number of pixels in each small region and the circularity calculated from the number of pixels at the boundary between the small region and other small regions. Also good.
- the number of pixels in each small area corresponds to the area of the small area. Further, the number of pixels located at the boundary of each small region with the adjacent small region corresponds to the length of the boundary where both regions contact. Furthermore, the number of pixels at the boundary between each small region and the other small regions corresponds to the perimeter (perimeter length) of each small region. For example, luminance, hue, saturation, and the like can be used as the pixel information, and an average value, median value, standard deviation, and the like can be used as the statistical value.
- the image information acquisition unit acquires pixel information from each pixel in the observation region.
- the small region forming means forms a small region composed of a single or a plurality of adjacent pixels in the observation region based on the pixel information of each pixel thus acquired.
- the integration information calculation unit obtains a feature amount regarding some or all pixels in each small region as the integration information, and the region integration unit calculates adjacent small regions based on the integration information. Integrate.
- the “feature amount related to the pixel” includes the number of pixels, a statistical value of pixel information, and the like.
- “Based on information for integration” means whether the information for integration satisfies a predetermined condition, for example, whether the area (number of pixels) of a certain small region is equal to or less than a reference value, This means based on whether or not the area is in contact with the adjacent small area almost entirely, whether or not the difference between the statistical values of the pixel information of the two adjacent small areas is equal to or less than the reference value, and the like.
- the information for integration may be information using a feature amount relating to one type of pixel or may be a combination of a plurality of types. By such processing, it is possible to eliminate the pseudo-heterogeneous region and integrate it into the original region in a sample in which various pseudo-heterogeneous regions such as texture exist.
- the analysis target region setting device includes a control unit that executes the integration information calculation unit and the region integration unit a plurality of times. Accordingly, it is possible to perform processing for further integrating adjacent small regions based on the integration information for the small regions after integration. It is desirable that the control means is also capable of changing a condition relating to information for integration for integrating the two small areas adjacent to each other by the area integration means. As a result, it is possible to perform processing for integrating the small areas while changing the conditions.
- the position, size, and orientation of the aperture may be automatically set for each small region by calculation such as optimization, and the user may select the aperture from among them.
- a small region is formed in the observation region based on pixel information of each pixel in the observation region, integration information is obtained for each small region, and the integration information is based on the integration information. Then, adjacent small areas are integrated. Thereby, it is possible to divide the observation region into small regions with similar pixel information, ignoring noise due to the surface shape of the sample.
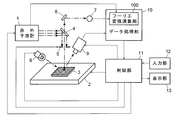
- the block diagram of the principal part of the infrared microscope which is one Example of this invention.
- the flowchart which shows the procedure of the setting of the analysis object area
- the flowchart which shows the procedure of the micro area
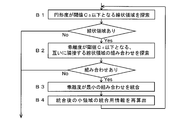
- the flowchart which shows the procedure of the linear area
- region integration process color-coded.
- luminance nonuniformity integration processing color-coded.
- region integration processes color-coded.
- FIG. 7A shows an aperture candidate set after region integration processing for another observation image
- FIG. 6B shows an aperture candidate set after maximum point extraction.
- FIG. 1 is a configuration diagram of a main part of the infrared microscope of the present embodiment.
- the infrared interferometer 1 includes an infrared light source, a fixed mirror, a moving mirror, a beam splitter, and the like, and emits infrared interference light obtained by interfering with infrared light having different wavelengths. .
- the infrared interference light is reflected by the half mirror 4, and the irradiation range is limited by the aperture 5, and then the sample 3 placed on the movable stage 2 is irradiated.
- the infrared light reflected from the sample 3 passes through the aperture 5 and the half mirror 4, enters the infrared detector 7 through the reflecting mirror 6, and is detected by the infrared detector 7.
- the infrared interference light is reflected on the surface of the sample 3, the infrared interference light is absorbed at a wavelength (generally a plurality of wavelengths) specific to the substance present at that location. Therefore, the infrared light reaching the infrared detector 7 reflects the infrared absorption in a specific region irradiated with the infrared interference light in the sample 3.
- a detection signal from the infrared detector 7 is input to the data processing unit 10, and in the data processing unit 10, the Fourier transform operation unit 100 performs a Fourier transform process on the detection signal, thereby indicating red light that indicates absorbance in a predetermined wavelength range.
- An external absorption spectrum is obtained.
- the spectrum data obtained in this way is sent to the control unit 11 and displayed on the screen of the display unit 13 connected to the control unit 11.
- visible light emitted from the visible light source 8 hits a wide range on the sample 3, and visible reflected light from the sample 3 is introduced into the CCD camera 9.
- the CCD camera 9 creates an observation image of the surface of the sample 3 and sends the observation image data to the control unit 11.
- the observation image data sent to the control unit 11 is displayed on the screen of the display unit 13 like the spectrum data.
- the region irradiated with the infrared interference light can be changed by the control unit 11 appropriately controlling the movable stage 2 and the aperture 5.
- the control unit 11 also controls the operation of each unit such as the infrared interferometer 1 and the visible light source 8.
- the data processing unit 10 and the control unit 11 can achieve various functions as will be described later by executing dedicated control / data processing software installed in the personal computer in advance on the computer.
- the configuration in FIG. 1 performs reflected infrared measurement and reflected visible observation, but can be changed to a configuration that performs transmitted infrared measurement or a configuration that performs transmitted visible observation.
- a mechanism that allows the user to observe the sample surface directly visually using an eyepiece may be incorporated.
- the control unit 11 When the sample 3 to be measured is placed on the movable stage 2, first, a visible image of the sample 3 is taken by the CCD camera 9, and the image data is sent to the control unit 11, and an observation image as shown in FIG. Is displayed on the screen of the display unit 13 (step S1).
- the control unit 11 also acquires luminance information of each pixel constituting this observation image as pixel information (step S2). Note that the pixel information can suitably use hue, saturation, and the like in addition to luminance.
- Steps S3 and S4 are small area forming processes.
- this small area forming process each pixel constituting the observation image is classified according to the luminance information, and one or a plurality of mutually contacting pixels belonging to the same classification are grouped into one small area.
- a plurality of small regions are formed in the observation image. Note that if the number of small regions obtained by this small region forming process is large, the subsequent calculation amount becomes enormous. In such a case, the number of pixel classifications in step S3 is reduced. As a result, the number of small regions obtained in step S4 is reduced, so that the amount of calculation can be reduced.
- steps S3 and S4 can be easily performed by, for example, a gradation reduction process. If the number of small regions obtained in step S4 increases so as to cause a problem in the subsequent processing time, the same processing is repeated with the number of gradations reduced.
- Steps S5 to S7 are subregions that should be included in adjacent subregions among the plurality of subregions formed in steps S3 and S4 (such subregions are also referred to as “quasi-heterogeneous regions”). Is integrated into adjacent small areas.
- Step S5 is a micro area integration process in which a micro pseudo-heterogeneous area caused by roughness or unevenness existing on the sample surface is integrated into a small area adjacent thereto. Details of the micro area integration processing will be described with reference to the flowchart of FIG.
- step A1 information for integration of each small area formed in the observation image is calculated (step A1).
- integration information the number of pixels (area) in the small area, the total luminance in the small area, the sum of the squares of the luminance, the length of the boundary with one adjacent small area, and the boundary Use the sum of the luminance differences above. Since these pieces of integration information can be calculated by integrating the integration information of the two small areas, it is possible to calculate the integration information of the small areas after integration. Also, indirectly from these integration information, the luminance average in the small area, the standard deviation, the average luminance difference on the boundary with one adjacent small area, the entire boundary length (peripheral length), the circularity (area) Is obtained by dividing by the perimeter. Note that the length of the boundary between one adjacent small region and the entire length of the boundary can be obtained from the number of pixels located at the boundary.
- Step A2 deviance f ij shown below is the threshold C 2 or less, to search all combinations of small area i and one small area j adjacent thereto (step A3) .
- f ij
- R i and R j are the average luminance of the small areas i and j, respectively, and B ij is the average luminance difference on the boundary between the small areas i and j.
- step A4 a combination of two small areas with the smallest deviation degree f ij is integrated from all the combinations obtained in step A3 (step A4).
- step A5 the integration information for the small areas after integration changes, so the integration information for the small areas after integration is recalculated (step A5), and the processes of steps A2 to A4 are performed again. The above processing is repeated until the combination of small areas to be integrated in step A4 is not searched in steps A2 and A3.
- step A2 may be a process of searching for a combination in which the length of the boundary between the micro region i and the small region j adjacent thereto is equal to or greater than a certain reference value.
- This process may be added between the above step A2 and step A3.
- Step S6 is a linear region integration process for integrating linear luminance unevenness.
- a pseudo-heterogeneous region due to linear luminance unevenness often appears on the boundary between the substances due to a step or the like, so that multiple linear small areas are adjacent to each other. Often appears. Therefore, the purpose of the linear region integration process is to integrate them. Details of the linear region integration processing will be described below with reference to the flowchart of FIG.
- the linear region integration processing searches all linear small regions circularity obtained is the threshold C 3 or less from the integration information (Step B1). Next, of each linear region which is searched in Step B1, adjacent to each other, searching for a combination of two linear areas in which the degrees of deviation f ij is the threshold value C 4 or less (step B2). Then, the combination with the smallest deviation degree f ij is integrated from all the combinations obtained in step B2 (step B3). After the two linear regions are integrated as described above, the integration information for the integrated linear regions (small regions) is recalculated (step B4) and the steps B1 to B are performed again in the same manner as in the microregion integration process. Process B3 is performed. The above processing is repeated until no combination of linear regions is searched in Step B1 and Step B2.
- a linear region may be extracted using the degree of line obtained from the Hesse matrix.
- Step B2 may be a process of searching for a combination of linear regions i and j in which the length of the boundary between two adjacent linear regions is equal to or greater than a certain reference value. Further, this process may be performed after searching for a combination of two linear regions to be above the threshold C 4 or less.
- Step S7 is luminance unevenness integration processing.
- a quasi-heterogeneous region due to unevenness of brightness or color unevenness appears on the sample surface, a small region appears excessively. For this reason, in step S7, the small areas divided by the unevenness are integrated. Details of the luminance unevenness integration processing will be described with reference to FIG.
- step C1 searches the two adjacent small regions combination of relatively long length of the boundary in contact with each other, the degree of deviation f ij a threshold C 5 or less (step C1).
- step C2 searches the two adjacent small regions combination of relatively long length of the boundary in contact with each other, the degree of deviation f ij a threshold C 5 or less (step C1).
- step C2 searches the two adjacent small regions combination of relatively long length of the boundary in contact with each other, the degree of deviation f ij a threshold C 5 or less.
- Step C2 searches the two adjacent small regions combination of relatively long length of the boundary in contact with each other, the degree of deviation f ij a threshold C 5 or less.
- step C4 the integration information of the small areas after the integration is recalculated (step C4), and the processes of steps C1 to C3 are performed again. The above processing is repeated until a combination of two small regions is not searched in Step C1 and Step C2.
- the control unit 11 integrates pseudo-heterogeneous regions of various patterns into the surrounding small regions by changing the integration condition at a predetermined timing. Can continue. Note that various integration conditions may be added according to the type of pseudo-heterogeneous region as long as the integration information for each small region is used. Further, any information may be added as long as the information for integration is information obtained from each small area.
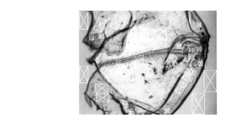
- FIG. 6 is a transmission observation of a resin piece.
- FIGS. 7 to 11 show small areas obtained by respective processes described later in different colors.
- FIG. 7 is a diagram showing a result after performing the small region forming process of step S4 on the observation image of FIG. As shown in this figure, only the processing in step S4 results in the appearance of many noises due to texture.
- FIG. 8 shows the result when the small region integration processing in step S5 is not performed (steps S6 and S7 are performed). As shown in this figure, many minute quasi-heterogeneous regions remain if the minute region integration processing is not performed. In addition, the boundary line of the boundary part becomes ambiguous, and side effects such as overlooking the stripe on the horizontal line in the center also occur.
- FIG. 9 shows the results when the linear region integration processing in step S6 is not performed (steps S5 and S7 are performed). Since the linear regions are not integrated, in FIG. 9, fine small regions that are not fully integrated remain at the boundary or the linear texture portion.
- FIG. 10 shows a result when the luminance unevenness integration process of step S7 is not performed (steps S5 and S6 are performed).
- FIG. 11 shows the results when all the processes of steps S1 to S7 are performed. From the results shown in FIG. 11, it can be seen that minute textures are integrated into the surrounding small areas, and that a large number of small areas are not formed at the boundary or linear texture portion.
- FIG. 12 is a diagram illustrating aperture candidates that are set by the control unit 11 for each small region obtained as illustrated in FIG. 11 and are to be analyzed using an infrared microscope.
- a plurality of aperture sizes and inclinations that can be set realistically are prepared, and these apertures are fitted into each small region, and an optimum aperture is selected.
- two apertures can be set in the case where two apertures can be set with the same aperture size and angle in each area. Is set so that the analysis results for these two apertures can be compared. Further, when it cannot be set in this way, only one aperture is set in each area.
- the apertures are fitted using an aperture set in which squares and rectangles of appropriate sizes are inclined in 16 directions.
- FIG. 13 is a flowchart showing another procedure for setting the analysis target region in the infrared microscope of this embodiment.
- the region formation / integration process steps S2 to S7 and the local maximum extraction process (steps S9 and S10) are performed in parallel, and aperture candidates obtained for these two processes (step S8). , S11), the user selects which aperture to use (step S12).
- Step S9 is an average / standard deviation calculation process.
- the average and standard deviation of local feature amounts (luminance values in this embodiment) of the observation image are calculated to obtain the ⁇ value.
- a low-frequency component is first cut to create an image in which only abnormal points are bright (or dark). Thereafter, a “robust average / standard deviation calculation process” is performed on the abnormal value (value at the abnormal point).
- a general method may be used for the “robust average / standard deviation calculation process”, but in this embodiment, first, a normal average value and a standard deviation value including an abnormal value are calculated, and then the average is calculated. Within the range of ⁇ 1 ⁇ from the value, the process of calculating the average value and the standard deviation value excluding the abnormal value is repeated.
- Step S10 is a local maximum point search process.
- the threshold C 6 is dynamically determined so as to search for the maximum points for the number of apertures required (that is, the number of maximum points searched by the maximum point search process is predetermined). in such a manner that the number, are changing each time C 6).
- FIG. 14 is a diagram showing that apertures are set at the local maximum points searched in step S10. As shown in this figure, in the local maximum point extraction process in steps S9 and S10, minute points that are easily removed as noise in the region formation / integration process in steps S2 to S7 are extracted. Therefore, steps S9 and S10 can be performed as complementary processing to the region formation / integration processing in steps S2 to S7.
- FIG. 15A is a diagram showing the aperture candidates set in step S8 after the region formation / integration processing in steps S2 to S7
- FIG. 15B is the maximum point extraction in steps S9 and S10. It is a figure which shows the candidate of the aperture set in step S11 after a process.
- the small regions appear in a stripe shape, and the aperture can be appropriately set for each of these small regions by using the region formation / integration processing.
- the aperture set after the maximum point extraction process appears only at the boundary portion of the observation image.
- the region formation / integration processing is suitable for a sample in which regions having similar luminance values appear relatively wide.
- FIG. 16A is a diagram showing the aperture candidates set after the region formation / integration processing in steps S2 to S7
- FIG. 16B is set after the maximum point extraction processing in steps S9 and S10. It is a figure which shows the candidate of the made aperture.
- black spots appear in a satin pattern, but in the area formation / integration processing, apertures are set in the areas other than the black spots, and apertures cannot be automatically set in the black spots. .
- the maximum point extraction process an aperture is set on each black point. The maximum point extraction process is suitable for such a satin-like sample.
- control unit 11 may determine that the result is inappropriate, and only the result of the region formation / integration processing may be displayed on the display unit 13. .
- this invention is applicable also to a microspectroscopic analyzer other than an infrared microscope, a microscopic mass spectrometer, etc.
Landscapes
- Physics & Mathematics (AREA)
- Spectroscopy & Molecular Physics (AREA)
- Engineering & Computer Science (AREA)
- General Physics & Mathematics (AREA)
- Computer Vision & Pattern Recognition (AREA)
- Theoretical Computer Science (AREA)
- Multimedia (AREA)
- General Health & Medical Sciences (AREA)
- Health & Medical Sciences (AREA)
- Chemical & Material Sciences (AREA)
- Analytical Chemistry (AREA)
- Life Sciences & Earth Sciences (AREA)
- Optics & Photonics (AREA)
- Immunology (AREA)
- Pathology (AREA)
- Quality & Reliability (AREA)
- Biochemistry (AREA)
- Software Systems (AREA)
- Evolutionary Computation (AREA)
- Medical Informatics (AREA)
- Databases & Information Systems (AREA)
- Computing Systems (AREA)
- Artificial Intelligence (AREA)
- Biomedical Technology (AREA)
- Molecular Biology (AREA)
- Investigating Or Analysing Materials By Optical Means (AREA)
- Microscoopes, Condenser (AREA)
Abstract
Priority Applications (4)
| Application Number | Priority Date | Filing Date | Title |
|---|---|---|---|
| JP2015504108A JP5983858B2 (ja) | 2013-03-08 | 2013-03-08 | 分析対象領域設定装置 |
| US14/773,057 US9995922B2 (en) | 2013-03-08 | 2013-03-08 | Analysis target region setting apparatus |
| PCT/JP2013/056538 WO2014136276A1 (fr) | 2013-03-08 | 2013-03-08 | Dispositif pour régler une région d'intérêt pour une analyse |
| EP13876990.6A EP2966433B1 (fr) | 2013-03-08 | 2013-03-08 | Dispositif pour régler une région d'intérêt pour une analyse |
Applications Claiming Priority (1)
| Application Number | Priority Date | Filing Date | Title |
|---|---|---|---|
| PCT/JP2013/056538 WO2014136276A1 (fr) | 2013-03-08 | 2013-03-08 | Dispositif pour régler une région d'intérêt pour une analyse |
Publications (1)
| Publication Number | Publication Date |
|---|---|
| WO2014136276A1 true WO2014136276A1 (fr) | 2014-09-12 |
Family
ID=51490828
Family Applications (1)
| Application Number | Title | Priority Date | Filing Date |
|---|---|---|---|
| PCT/JP2013/056538 Ceased WO2014136276A1 (fr) | 2013-03-08 | 2013-03-08 | Dispositif pour régler une région d'intérêt pour une analyse |
Country Status (4)
| Country | Link |
|---|---|
| US (1) | US9995922B2 (fr) |
| EP (1) | EP2966433B1 (fr) |
| JP (1) | JP5983858B2 (fr) |
| WO (1) | WO2014136276A1 (fr) |
Families Citing this family (4)
| Publication number | Priority date | Publication date | Assignee | Title |
|---|---|---|---|---|
| US9995922B2 (en) * | 2013-03-08 | 2018-06-12 | Shimadzu Corporation | Analysis target region setting apparatus |
| CN109323999B (zh) * | 2018-10-24 | 2020-06-16 | 大连理工大学 | 一种基于图像数值分析的分光光度检测方法 |
| WO2020210871A1 (fr) * | 2019-04-17 | 2020-10-22 | Swinburne University Of Technology | Système d'identification chimique |
| CN118014999B (zh) * | 2024-04-09 | 2024-06-25 | 东莞虹日金属科技有限公司 | 一种新能源汽车冲压精密件断裂区域快速检测方法 |
Citations (5)
| Publication number | Priority date | Publication date | Assignee | Title |
|---|---|---|---|---|
| JP2004005383A (ja) * | 2002-04-19 | 2004-01-08 | Sony Corp | 画像処理方法、画像処理装置、プログラム及び記録媒体、自動トリミング装置並びに肖像写真撮影装置 |
| JP2006208339A (ja) * | 2005-01-31 | 2006-08-10 | Olympus Corp | 領域抽出装置、顕微鏡システムおよび領域抽出プログラム |
| JP2007130329A (ja) * | 2005-11-11 | 2007-05-31 | Matsushita Electric Works Ltd | 画像による外観検査方法 |
| JP2010266430A (ja) * | 2009-04-15 | 2010-11-25 | Jfe Steel Corp | 鋼板表面欠陥検査方法および装置 |
| JP2010276371A (ja) | 2009-05-26 | 2010-12-09 | Shimadzu Corp | 赤外顕微鏡 |
Family Cites Families (25)
| Publication number | Priority date | Publication date | Assignee | Title |
|---|---|---|---|---|
| JPH03290774A (ja) * | 1990-04-06 | 1991-12-20 | Fuji Facom Corp | 文書画像の文章領域抽出装置 |
| JP2673629B2 (ja) * | 1992-03-02 | 1997-11-05 | 新日本製鐵株式会社 | 線状組織定量化画像処理装置 |
| JP4153675B2 (ja) | 2001-04-10 | 2008-09-24 | 三菱重工業株式会社 | 材料寿命の評価システム、及び、その評価方法 |
| JP2004220555A (ja) * | 2002-12-27 | 2004-08-05 | Fuji Photo Film Co Ltd | 画像から被写体領域を抽出する装置、方法、プログラムおよびプログラムを記録した記録媒体 |
| EP1555804A3 (fr) * | 2004-01-19 | 2006-08-16 | Ricoh Company, Ltd. | Appareil et programme de traitement d'images et support d'enregistrement |
| US20050174085A1 (en) * | 2004-02-10 | 2005-08-11 | Olympus Corporation | Micromanipulation system |
| JP4549093B2 (ja) | 2004-04-12 | 2010-09-22 | キヤノン株式会社 | 画像処理装置及びその方法、プログラム |
| US8073233B2 (en) | 2005-01-31 | 2011-12-06 | Olympus Corporation | Image processor, microscope system, and area specifying program |
| US7831107B2 (en) * | 2005-10-17 | 2010-11-09 | Canon Kabushiki Kaisha | Image processing apparatus, image processing method, and program |
| GB2431793B (en) * | 2005-10-31 | 2011-04-27 | Sony Uk Ltd | Image processing |
| JP2007316460A (ja) * | 2006-05-29 | 2007-12-06 | Epson Imaging Devices Corp | 電気光学装置及び電子機器 |
| US8337379B2 (en) * | 2006-08-17 | 2012-12-25 | Terumo Bct, Inc. | Blood processing apparatus with robust automated process control |
| JP5028337B2 (ja) * | 2008-05-30 | 2012-09-19 | キヤノン株式会社 | 画像処理装置、画像処理方法、プログラム、及び記憶媒体 |
| US8135202B2 (en) * | 2008-06-02 | 2012-03-13 | Nec Laboratories America, Inc. | Automated method and system for nuclear analysis of biopsy images |
| JP5312166B2 (ja) * | 2009-04-13 | 2013-10-09 | キヤノン株式会社 | 画像処理装置及び制御方法及びプログラム |
| JP5351673B2 (ja) * | 2009-09-09 | 2013-11-27 | パナソニック株式会社 | 外観検査装置、外観検査方法 |
| JP5455038B2 (ja) * | 2009-12-28 | 2014-03-26 | キヤノン株式会社 | 画像処理装置、画像処理方法、及びプログラム |
| JP5800468B2 (ja) * | 2010-05-11 | 2015-10-28 | オリンパス株式会社 | 画像処理装置、画像処理方法、および画像処理プログラム |
| JP5555097B2 (ja) * | 2010-08-24 | 2014-07-23 | オリンパス株式会社 | 画像処理装置、画像処理装置の作動方法、および画像処理プログラム |
| JP5417306B2 (ja) * | 2010-11-29 | 2014-02-12 | 株式会社日立ハイテクノロジーズ | 欠陥検査方法および欠陥検査装置 |
| US9077943B2 (en) * | 2012-05-31 | 2015-07-07 | Apple Inc. | Local image statistics collection |
| JP5900644B2 (ja) * | 2012-11-15 | 2016-04-06 | 株式会社島津製作所 | 分析対象領域設定装置 |
| US9995922B2 (en) * | 2013-03-08 | 2018-06-12 | Shimadzu Corporation | Analysis target region setting apparatus |
| US9100631B2 (en) * | 2013-08-05 | 2015-08-04 | Cable Television Laboratories, Inc. | Dynamic picture quality control |
| JP6134348B2 (ja) * | 2015-03-31 | 2017-05-24 | シスメックス株式会社 | 細胞撮像装置及び細胞撮像方法 |
-
2013
- 2013-03-08 US US14/773,057 patent/US9995922B2/en active Active
- 2013-03-08 JP JP2015504108A patent/JP5983858B2/ja active Active
- 2013-03-08 EP EP13876990.6A patent/EP2966433B1/fr active Active
- 2013-03-08 WO PCT/JP2013/056538 patent/WO2014136276A1/fr not_active Ceased
Patent Citations (5)
| Publication number | Priority date | Publication date | Assignee | Title |
|---|---|---|---|---|
| JP2004005383A (ja) * | 2002-04-19 | 2004-01-08 | Sony Corp | 画像処理方法、画像処理装置、プログラム及び記録媒体、自動トリミング装置並びに肖像写真撮影装置 |
| JP2006208339A (ja) * | 2005-01-31 | 2006-08-10 | Olympus Corp | 領域抽出装置、顕微鏡システムおよび領域抽出プログラム |
| JP2007130329A (ja) * | 2005-11-11 | 2007-05-31 | Matsushita Electric Works Ltd | 画像による外観検査方法 |
| JP2010266430A (ja) * | 2009-04-15 | 2010-11-25 | Jfe Steel Corp | 鋼板表面欠陥検査方法および装置 |
| JP2010276371A (ja) | 2009-05-26 | 2010-12-09 | Shimadzu Corp | 赤外顕微鏡 |
Non-Patent Citations (1)
| Title |
|---|
| See also references of EP2966433A4 |
Also Published As
| Publication number | Publication date |
|---|---|
| US20160011408A1 (en) | 2016-01-14 |
| EP2966433B1 (fr) | 2023-04-26 |
| EP2966433A4 (fr) | 2016-04-20 |
| JPWO2014136276A1 (ja) | 2017-02-09 |
| JP5983858B2 (ja) | 2016-09-06 |
| EP2966433A1 (fr) | 2016-01-13 |
| US9995922B2 (en) | 2018-06-12 |
Similar Documents
| Publication | Publication Date | Title |
|---|---|---|
| JP5900644B2 (ja) | 分析対象領域設定装置 | |
| Xing et al. | Bruise detection on ‘Jonagold’apples using hyperspectral imaging | |
| JP6670327B2 (ja) | 宝石用原石の色測定 | |
| US10161796B1 (en) | LED lighting based multispectral imaging system for color measurement | |
| JP5199539B2 (ja) | 焦点ずれ検出のためのマルチスペクトル技術 | |
| US20080266430A1 (en) | Method and system for optimizing an image for improved analysis of material and illumination image features | |
| US20210247233A1 (en) | Foreign matter analysis method, storage medium storing foreign matter analysis program, and foreign matter analysis apparatus | |
| KR20080080998A (ko) | 화상 해석에 의해서 결함 검사를 실시하는 결함검사장치 | |
| US12111258B2 (en) | Instruments and methods for characterizing the appearance of samples | |
| CN111344103B (zh) | 基于高光谱光学传感器的涂层区域定位方法和装置、及除胶系统 | |
| KR101776355B1 (ko) | 광학 검사 파라미터를 설정하는 장치 및 방법 | |
| US20100226524A1 (en) | Apparatus and method for measuring haze of sheet materials or other materials | |
| CN116148265A (zh) | 一种基于合成革高质量图像获取的瑕疵分析方法及系统 | |
| JP5983858B2 (ja) | 分析対象領域設定装置 | |
| CN113252706B (zh) | 图像检查装置、存储介质以及照明设定装置 | |
| US12475555B2 (en) | Artificial intelligence-based hyperspectrally resolved detection of anomalous cells | |
| Xing et al. | Stem-end/calyx identification on apples using contour analysis in multispectral images | |
| Parkot et al. | Development of an automated quality control system of confectionery using a vision system | |
| CN107037005A (zh) | 用于使用离轴检测器测量薄片材料或其他材料的混浊度的设备和方法 | |
| JP2016206060A (ja) | 分光測定装置及び分光測定方法 | |
| KR102749690B1 (ko) | 이색 검사 장치 | |
| JP2019060815A (ja) | 自動ケミカルイメージ作成 | |
| KR101536693B1 (ko) | 다파장 영상구현 및 영상분석을 통한 흑색종판별방법 및 흑색종판별시스템 | |
| JP2002286549A (ja) | 色調検査方法およびそのシステム | |
| JP2017003499A (ja) | 分光測定装置及び分光測定方法 |
Legal Events
| Date | Code | Title | Description |
|---|---|---|---|
| 121 | Ep: the epo has been informed by wipo that ep was designated in this application |
Ref document number: 13876990 Country of ref document: EP Kind code of ref document: A1 |
|
| ENP | Entry into the national phase |
Ref document number: 2015504108 Country of ref document: JP Kind code of ref document: A |
|
| WWE | Wipo information: entry into national phase |
Ref document number: 14773057 Country of ref document: US |
|
| NENP | Non-entry into the national phase |
Ref country code: DE |
|
| WWE | Wipo information: entry into national phase |
Ref document number: 2013876990 Country of ref document: EP |