WO2014155641A1 - 情報処理方法および情報処理システム - Google Patents
情報処理方法および情報処理システム Download PDFInfo
- Publication number
- WO2014155641A1 WO2014155641A1 PCT/JP2013/059439 JP2013059439W WO2014155641A1 WO 2014155641 A1 WO2014155641 A1 WO 2014155641A1 JP 2013059439 W JP2013059439 W JP 2013059439W WO 2014155641 A1 WO2014155641 A1 WO 2014155641A1
- Authority
- WO
- WIPO (PCT)
- Prior art keywords
- vertex
- information
- vertices
- information processing
- data
- Prior art date
- Legal status (The legal status is an assumption and is not a legal conclusion. Google has not performed a legal analysis and makes no representation as to the accuracy of the status listed.)
- Ceased
Links
Images











Classifications
-
- G—PHYSICS
- G06—COMPUTING OR CALCULATING; COUNTING
- G06N—COMPUTING ARRANGEMENTS BASED ON SPECIFIC COMPUTATIONAL MODELS
- G06N7/00—Computing arrangements based on specific mathematical models
- G06N7/01—Probabilistic graphical models, e.g. probabilistic networks
Definitions
- the present invention relates to an information processing method and an information processing system, and more particularly, to an information processing system that executes graph processing and an information processing method thereof.
- simulators for predicting the real world are attracting attention. In this simulator, rather than pursuing the prediction accuracy itself, it is required to present a “bundle of possibilities” including unexpected ones.
- the bundle of possibilities is composed of a plurality of representations of the temporal change of the target called a scenario, and the scenario is a sensor log, a simulator output result, or the like.
- the scenario For example, if the target case is a traffic jam, the scenario represents a change over time such as the length of the traffic jam. If the presentation of the bundle of possibilities can be received, the user of the simulator can obtain the possibility of change of the object by observing a plurality of scenarios.
- a stochastic process graph is used as a scenario expression, and rare cases are predicted based on the stochastic process graph.
- a case is calculated as a program performance and a scenario as a command execution order (that is, a time change of commands). (Program bottleneck) is discovered and analyzed.
- the probabilistic process graph disclosed in Patent Document 1 is suitable when the target is a program, a sentence, music, or the like, but the target such as a traffic jam is divided into a plurality of pieces, or a plurality of pieces are integrated into one. It cannot be adapted to the case.
- the word that comes after "I" in a Japanese sentence is one of "ha” or "tachi”.
- An object of the present invention is to provide information processing corresponding to a case where a transition is made in parallel from one vertex to a plurality of vertices.
- an event is extracted from the time series data, a vertex is generated for the extracted event, and the edge of the vertex is determined based on the time information of the time series data and the relationship information of the sources of the time series data.
- the present invention it is possible to cope with a transition from one vertex to a plurality of vertices in parallel, and as a result, a bundle of possibilities can be calculated, and rare cases can be found and analyzed.
- FIG. 10 is a flowchart of traverse processing in the second embodiment. It is a specific example of the scenario data in Example 2. It is a specific example of the scenario data in Example 3. It is a figure which shows the example of the graph description of the scenario data in Example 3.
- FIG. 12 is a flowchart of scenario graph generation processing in the third embodiment. It is a figure which shows the structure of the information processing system which is an Example of this invention, and a user terminal. It is a schematic diagram which shows the concept that the vertex is integrated about the inputted example graph data and a weighted probability process graph is created.
- FIG. 1 shows a block diagram of an information processing system 101 of this embodiment.
- the information processing system 101 includes a graph processing device 110, a database 125, and a case database 126.
- the graph processing apparatus 110 includes an object selector 120, a case generator 122, a scenario graph generator 123, and a possibility bundle generator 124.
- the graph processing device 110 receives the time-series data 107 and the relationship data 108 and outputs the scenario graph data 105 and the possibility bundle data 102.
- the bundle of possibilities 102 is output to a user interface (I / F) 127 for presentation to the user.
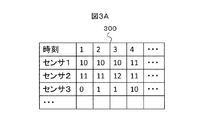
- FIGS. 3A and 3B an example of the time-series data 107 is shown in FIGS. 3A and 3B.
- the time series data 107 is stored in the database 125.
- FIG. 3A shows time-series data 300 of the number of passing vehicles by time
- FIG. 3B shows time-series data 301 of average vehicle speed corresponding to the data 300.
- the time series data 107 is acquired for each sensor arranged on the road, and the number of vehicles passing through the road and the average vehicle speed are acquired.
- FIGS. 4A and 4B Examples of relationship data 108 are shown in FIGS. 4A and 4B.
- FIG. 4C shows the arrangement of sensors with respect to the road that is the basis of the relationship data 108 shown in FIGS. 4A and 4B.
- the relationship data 108 is data representing the relationship between the sources of the time-series data, and in this embodiment is data representing the relationship between the sensors.
- the relationship data 108 is stored in the database 125.
- the sensors 1 to 7 arranged in a distributed manner on the road including the intersection 402 shown in FIG. 4C are expressed as a graph by connecting each sensor as an apex and connecting adjacent sensors with edges, a graph 400 in FIG. 4A is obtained.
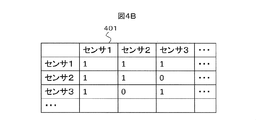
- the relationship data 401 between the sensors in FIG. 4B is the data 400 of the graph 400 in FIG. 4A.
- “1” indicates that there is a relationship between sensors, and “0” indicates that there is no relationship.
- the relationship represents a connection by roads.
- the sensor 1 arranged at the intersection 402 of the road 1 with the road 2 and the sensor 2 arranged at the road 2 have the road 1 and the road 2 at the intersection.
- There is a relationship because they are connected and the sensors are connected adjacent to each other on the graph 400, and the sensor 2 and the sensor 3 are not connected adjacent to each other on the graph 400, so there is no relationship.
- a traffic jam is used as an example, and the relationship is a spatial arrangement relationship of sensor groups.
- a company bankruptcy is used as an example, and the relationship is a business relationship between companies. You can also.
- FIG. 18 shows the hardware configuration of the information processing system 101 and the user terminal 1801.
- the information processing system 101 and the user terminal 1801 are wirelessly connected via a network 1802 and a wireless base station 1803.
- a sensor group (sensors 1, 2,...) 1804 arranged on the road according to the present embodiment is connected to the information processing system 101 via the network 1802.
- the information processing system 101 can collect information from the sensor group 1804 that is a source of time-series data, create the time-series data 107, and store it in the database 125.
- the information processing system 101 includes a central processing unit (CPU) 1805, a main memory 1806, a storage 1807, and a network interface (I / F) 1808.
- the object selector 120, the case generator 122, the scenario graph generator 123, and the possibility bundle generator 124 of the information processing system 101 are stored as programs in the storage 1807 and executed by the CPU 1805 and the main memory 1806.
- User terminal 1801 is a mobile terminal such as a tablet terminal, for example, and implements user I / F 127.
- the user terminal 1801 includes a CPU 1809, a main memory 1810, a storage 1811, a touch panel 1812, and a network I / F 1813.
- the user terminal 1801 accepts input from the user such as selection of a target case on the touch panel 1812 and displays a bundle of possibilities 102 on the liquid crystal screen of the touch panel 1812.
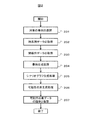
- FIG. 2 shows a flowchart of the graph processing operation of the information processing system 101.
- the user selects a target case.
- the user selects “congestion” among the target candidates presented from the target selector 120 via the touch panel 1812 of the user terminal 1801.
- the target selector 120 that has received that “congestion” has been selected as the target transmits the definition of “congestion” as the target definition 103 to the case generator 122.
- the definition of “traffic jam” is an average vehicle speed of 20 km / h or less.
- the target definition 103 may be stored in the storage 1807 in advance, or may be input by the user from the touch panel 1812.
- the object selector 120 further designates the case of yesterday and the day before yesterday as the object definition 103, and transmits it to the case generator 122.
- the period of the case of yesterday and yesterday may be input by the user from the touch panel 1812 or may be set in advance.
- the case generator 122 that has received the target definition 103 acquires the time series data 107 and the relationship data 108 corresponding to the received target definition 103 from the database 125. In FIG. 2, this process corresponds to Step 202 and Step 203.
- the case generation process 204 will be described.
- the case generation process 204 is executed by the case generator 122.
- the case generator 122 receives the target definition 103, the time series data 107, and the relationship data 108 as input, and outputs the case graph data 106 as output.
- the case generator 122 scans the time-series data 107, extracts an event (congestion in this embodiment) (process 502), and responds to the extracted event. Information on the vertex to be generated is generated (process 503).
- FIGS. 6A, 6B, and 6C show examples of processing 502 and processing 503.
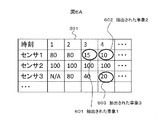
- FIG. The case generator 122 extracts an event that matches the target definition 103 in the time series data 301 of the average vehicle speed.
- events 1 to 3 surrounded by ellipses 601 to 603 in FIG. 6A which are events that meet an average speed of 20 km / h or less, are extracted.
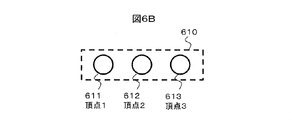
- the extracted event is generated as vertex information, and is represented as a vertex of the graph 610 shown in FIG. 6B in the graph notation, and becomes an entry of the case graph data 620 shown in FIG. 6C when expressed in the data structure.
- the information on each vertex is associated with time series data information such as sensor identification information (ID) and sensor data acquisition time as vertex data, as in each entry of the case graph data 620, and is stored in the main memory 1806. Or stored in the storage 1807 (process 504).
- ID sensor identification information
- sensor data acquisition time as vertex data
- the case generator 122 executes loop processing (processing 505-1 to 505-2) for any two vertices from the generated vertex information.
- loop processing processing 505-1 to 505-2
- vertices selected as two arbitrary vertices are a vertex A and a vertex B, respectively.
- the case generator 122 evaluates the time interval for acquiring sensor data between vertices in the process 506 from the time data held in the information of the two vertices. If the time interval (the time between the acquisition time of the sensor data of the vertex B and the acquisition time of the sensor data of the vertex A) is greater than 0 and smaller than the predetermined threshold value, the case generator 122 performs processing 507.
- the relationship between the two vertices is acquired from the relationship data 401.
- the case generator 122 evaluates the acquired relationship in the process 508, and when the relationship is “1”, that is, there is a relationship, in the process 509, between the two vertices (here, between the vertex A and the vertex B) ) Output edge information.
- the outputted edge information is stored as “1” in the vertex B column of the edge data of the vertex A information.
- the case generator 122 does not output the edge information. Therefore, the edge information remains “0”. As described above, the case generator 122 generates edge information.
- FIG. 7A and 7B show processing examples of processing 505-1 to processing 505-2.
- the threshold is 2
- vertex 1 (611) and vertex 2 (612) in FIG. 6C are taken as an example.
- the evaluation formula (0 ⁇ 1 ⁇ 2) holds.
- the case generator 122 outputs information on the side 2 (702) between the vertex 1 and the vertex 3, and does not output information on the side between the vertex 2 and the vertex 3.
- the side is a directed side having a direction with respect to a direction increasing in the time direction.
- the case generator 122 receives the target definition 103, the time series data 107, and the relationship data 108, and outputs the case graph data 106.
- the scenario graph generation process is a process for generating a scenario graph (stochastic process graph) by integrating a plurality of entries of case graph data.
- Scenario graph generation processing 205 is executed by the scenario graph generator 123.
- the scenario graph generator 123 receives the example graph data 106 and outputs the scenario graph data 105.
- FIG. 8 shows a flowchart of the scenario graph generation process 205.
- the scenario graph generator 123 acquires case graph data. Thereafter, the scenario graph generator 123 executes a loop process (802-1 to 802-2) for selecting an arbitrary vertex from the case graph data (the selected vertex is a vertex A).
- the scenario graph generator 123 evaluates whether or not the vertex A has already been selected as a similar vertex in the process 803. If not selected, the scenario graph generator 123 proceeds to the process 804. Subsequently, the scenario graph generator 123 executes a loop process (805-1 to 805-2) for selecting a vertex other than the vertex A from the acquired case graph data (with the selected vertex as the vertex B). In process 806, the scenario graph generator 123 calculates the similarity between the vertex A and the vertex B. The similarity is, for example, an absolute value of a difference of data such as an average speed held by each vertex as an index. In the process 807, the scenario graph generator 123 compares the calculated similarity with a predetermined threshold value and evaluates. If the evaluation formula (similarity ⁇ threshold) is satisfied, the scenario graph generator 123 proceeds to process 808. Vertex B is registered in the similar vertex list as a similar vertex of vertex A.
- FIGS. 9A, 9B and 9C Specific examples of processing from processing 801 to 805-2 are shown in FIGS. 9A, 9B and 9C.
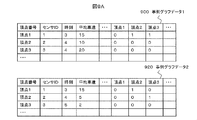
- the case graph data acquired by the scenario graph generator 123 in the process 801 is the case graph data 1 (900) and the case graph data 2 (920) shown in FIG. 9A.
- Each case graph data is specified by the target definition 103, and the case graph data 1 corresponds to yesterday's data, and the case graph data 2 corresponds to the data yesterday.
- the graph notations of event graph data 1 and event graph data 2 are shown in graph 910 and graph 930 in FIG. 9B, respectively.
- the scenario graph generator 123 returns to the processing 805-1, selects the vertex 3 of the case graph data 1 as the vertex B, and performs the same processing. Again, the evaluation formula is not satisfied, so vertex B is not added to the similar vertex list. Subsequently, similarly, the scenario graph generator 123 processes the vertex 1 of the case graph data 2. Since the vertex 1 of the case graph data 2 satisfies the evaluation formula of the process 807, it is added to the similar vertex list. By repeating this, the similar vertex list 940 shown in FIG. 9C is generated.
- the vertex 1 of the case graph data 2 is not included in the column of the vertex A of the similar vertex list 940, but this is because the vertex 1 of the case graph data 2 is a similar vertex because the case graph data 1 was processed first. Because it was selected as.
- the scenario graph generator 123 defines an edge identifier and initializes it with “2”. Thereafter, the scenario graph generator 123 executes a loop process (811-1 to 811-2) for selecting a vertex from the similar vertex list for the vertex A (with the selected vertex as a similar vertex).
- the scenario graph generator 123 acquires edge data of similar vertices, and sets the edge data initialized to “2”, with the edge data set to “1”, that is, the edges corresponding to the related vertices. Change (process 813). Then, in process 814, the scenario graph generator 123 stores the vertex data of the similar vertex and the changed edge data in the vertex A information. The scenario graph generator 123 adds 1 to the edge identifier at the end of the loop. The reason why 1 is added to the edge identifier is to avoid having duplicate values in the edge identifier, and as a modification, it can be realized by a number other than 1 or a duplicate list.
- the integrated graph data is referred to as scenario graph data.
- FIGS. 10A and 10B Specific examples of processing from processing 810 to processing 811-2 are shown in FIGS. 10A and 10B.
- vertex 1 of case graph data 1 is described as vertex 11
- vertex 1 of case graph data 2 is described as vertex 21.
- the scenario graph generator obtains edge data of the vertex 21.
- the scenario graph generator 123 rewrites the edge data to the edge identifier “2” in process 813.
- the scenario graph generator 123 adds the data held by the vertex 21 to the vertex 11.
- the scenario graph data 1010 shown in FIG. 10B is generated.
- the graph notation of the scenario graph data 1010 can be drawn as a graph 1000 in FIG. 10A, and it can be seen that the entries of a plurality of case graph data are integrated into one.
- the edge before integration can be distinguished from the edge identification information data 1011.
- the scenario graph generation processing 205 inputs the case graph data 106 and outputs the scenario graph data 105.
- the possibility bundle generation process is a process for generating a plurality of scenarios (which are defined as a bundle of possibilities) based on the scenario graph data.
- a plurality of scenarios are predicted from time series data and relationship data, for example, a group of cases that may occur in the future, and the user has obtained a plurality of scenarios by the system of the present embodiment, and has not been assumed. Can be discovered.
- the possibility bundle generation process 206 is executed by the possibility bundle generator 124.
- the possibility bundle generator 124 receives the scenario graph data 105 and outputs the possibility bundle 102.
- FIG. 11 shows a flowchart of the possibility bundle generation process 206.
- the possibility bundle generator 124 acquires scenario graph data.
- the possibility bundle generator 124 initializes the vertex list (process 1102), and the user selects the start vertex from the touch panel 1812 (process 1103).
- the graph processing apparatus 110 presents a scenario graph to the user based on the scenario data acquired via the touch panel 1802, and the user selects a start vertex from the presented scenario graph.
- the possibility bundle generator 124 adds the selected start vertex to the vertex list.
- the possibility bundle generator 124 executes the traversing process of the process 1105, which is a recursive function, and the traversing process is executed inside the traversing process.
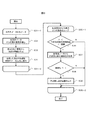
- FIG. 12 shows a flowchart of the traverse processing 1105.
- the edge data of the selected vertex is acquired (process 1201), and the edge identifier that is stochastically transitioned from the edge identifiers stored in the acquired edge data (process 1202) is acquired.
- a transition probability of the edge identifier is calculated (process 1203), and a transition edge is selected from the calculated transition probability (process 1204).
- the transition probability is the same transition probability between the types of identifiers, where the number of types of edge identifiers excluding 0 is used as a parameter. Also, in the process 1204, the possibility bundle generator 124 selects an edge having the lowest transition probability based on the calculated transition probability. The reason why the transition probabilities can be different is that if the plurality of vertices to be integrated have the same transition probabilities to the integrated vertices, the transition probabilities are summed by the integration.
- FIG. 19 is a schematic diagram showing the concept that vertexes are integrated for input case graph data and a weighted probability process graph is created. Between the two case graphs 1901 on the left in FIG. 19, two pairs (1902, 1903) of vertices are integrated because they have similar characteristics, and weights are given to other sides as shown on the right in FIG. A stochastic process graph 1904 with large edges is created.
- the possibility bundle generator 124 acquires edge data of all edges having the same edge identifier as the edge identifier included in the selected edge.
- the possibility bundle generator 124 evaluates whether or not the acquired edge data is 0 (process 1206). If the acquired edge data is not 0, loop processing (1207-1 to 1207-2) of the acquired edge is executed. In the loop process, a vertex to which the side is connected is selected (process 1208), added to the vertex list (process 1209), and the recursive process is executed to execute the traverse process 1105.
- a scenario starting from the selected start vertex can be generated from the scenario graph data 105. Further, a plurality of scenarios can be generated by selecting a plurality of start vertices. The multiple scenarios are called a bundle of possibilities.
- the possibility bundle generator 124 acquires the scenario graph data 1000 of FIG.
- the start vertex selected in the processing 1103 is set as the vertex 11.
- vertex 11 is added to the vertex list.
- the possibility bundle generator 124 acquires the edge data of the vertex 11 (process 1201), and acquires the edge identifier that transitions stochastically (process 1202). Since the number of types of edge identifiers excluding 0 of the vertex 11 is 2 (two types of 1 and 2), the edge identifiers that change probabilistically are edge identifier 1 and edge identifier 2.
- the transition probability of the edge identifier 1 is 1 ⁇ 2, and the transition probability of the edge identifier 2 is 1 ⁇ 2.
- the edge identifier 1 is selected in the process 1205.
- a case where a difference occurs in the transition probability is, for example, a case where there is a side from the vertex X to the vertex Y, the vertex X and the vertex 11 are similar, and the vertex Y and the vertex 22 are similar.
- the probability of transition from the vertex 11 to the vertex 22 is 2/3, which is higher than 1/3 of the probability of transition from the vertex 11 to the vertex 12 and the vertex 13.
- the sides having the side identifier 1 are the vertex 12 and the vertex 13, and the vertex 12 and the vertex 13 are shifted in parallel. Therefore, in the loop processing of the processing 1207-1 to 1207-2, the vertex 12 and the vertex 13 are targeted.
- the vertex 12 is selected (processing 1208), and the vertex 12 is registered in the vertex list (processing 1209).
- the vertex 12 is processed as the selected vertex. Since the vertex does not have an edge to be connected, the evaluation formula (processing 1206) becomes false, and the traversing process ends.
- the vertex 13 is processed in the same manner as the vertex 12.
- scenario data 1310 holds vertex data and edge data of each vertex.
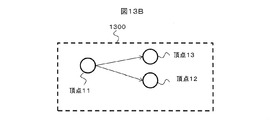
- a graph notation of the scenario data 1310 is shown in a graph 1300 in FIG. 13B.
- the possibility bundle generation process 206 stores the scenario data as the generated possibility bundle in the case database 126 and presents the possibility bundle to the touch panel 1812 (process 207).
- the graph processing apparatus 110 receives the time series data and the relationship data, generates scenario graph data (stochastic process graph), and allows a plurality of scenarios, that is, possible from the scenario graph data. Output a bundle of sex.
- the information processing system 101 can cope with a case of transition from one vertex to a plurality of vertices in parallel. As a result, calculation of a bundle of possibilities and discovery of rare cases And analysis.
- the edge having the lowest transition probability is selected in the process 1204. Conversely, by selecting the edge having the highest transition probability in the process 1204, discovery and analysis of the most likely case can be performed. It becomes possible.
- the second embodiment a case will be described where, in the processing 1203 of the possibility bundle generation processing 206 of the first embodiment, not all sides that transition with the minimum probability but all sides.
- the second embodiment has an effect of creating a plurality of scenarios from one start vertex.
- FIG. 14 shows a flowchart of the traversing process in the second embodiment.
- the same processes as those in FIG. 12 are denoted by the same reference numerals.
- the processes 1210, 1211, 1212, and 1213 are different.
- the possibility bundle generator 124 stores the vertex list in memory. This is because when the edge identifier loop is performed in the next process 1211, the process for each edge identifier starts from the same vertex list. For example, if vertex A is stored in the vertex list, the probability bundle generator 124 stores the vertex list in process 1210, selects the edge identifier A as an edge identifier in process 1211-1, and processes 1212. Thus, the vertex list saved in the process 1212 is acquired.
- the subsequent processing for example, when vertex B is added to the vertex list, vertex A and vertex B are stored in the vertex list.
- the edge identifier B is selected, and in the processing 1212, the vertex list stored in the processing 1210 is acquired.
- the vertex C is added to the vertex list, the vertex A and the vertex C are stored in the vertex list. That is, two scenarios, a scenario for transition from vertex A to vertex B and a scenario for transition from vertex A to vertex C, could be generated.
- transition probability data is added to the selected vertex.
- the transition probability data is the value calculated in process 1203.
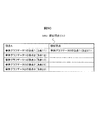
- FIG. 15 shows scenario data 1500 to which transition probability data is added.
- the transition probability data is defined for each side, and in the example of FIG. 15, the probability of transition from the vertex 11 to the vertex 12 and the vertex 13 is 0.5 (50%).
- the transition probability is used when evaluating the occurrence probability of a scenario between a plurality of scenarios.
- the third embodiment a case will be described in which, in the first embodiment, a method is solved by arranging virtual vertices instead of having edge identifiers.
- the third embodiment has an effect that the hierarchical sides can be identified.
- FIG. 17 shows a scenario graph generation process flowchart when virtual vertices are used.
- FIG. 17 describes the processing after the connector “1” in FIG.
- the same processes as those in FIG. 8 are denoted by the same reference numerals.
- the scenario graph generator 123 obtains edge data of similar vertices, and then evaluates whether or not the number of the edge data is greater than 1 in process 1701. When the evaluation is false, the scenario graph generator 123 performs the same process as the process 814 of the first embodiment. On the other hand, when the evaluation is true, the scenario graph generator 123 generates a virtual vertex (process 1702). Next, the scenario graph generator 123 adds the vertex data of the similar vertex to the vertex A (processing 1703), and adds the virtual vertex to the edge data of the similar vertex (processing 1704). By these processes, the vertex A has data of similar vertices and has an edge with respect to the virtual vertex.
- the scenario graph generator 123 stores the edge data of similar vertices in the edge data of the virtual vertex in the process 1705, thereby connecting the vertex from the vertex A to the other vertex. Further, by using a plurality of virtual vertices, a hierarchical graph such as an edge from the virtual vertex to the virtual vertex can be generated.
- FIGS. 16A and 16B show examples of scenario data when virtual vertices are used.
- the scenario data 1610 includes a virtual vertex identifier 1611 and virtual vertex side data 1612.
- the virtual vertex identifier is data that is 1 for a virtual vertex and 0 otherwise.
- the vertex 11 is connected to the virtual vertex 100 by the virtual vertex side data.
- the virtual vertex 100 is connected to the vertex 12 and the vertex 13 by edge data.
- the vertex data is held in the vertex 11, and the virtual vertex has no vertex data.
- a graph representation of the above scenario data 1610 is shown in a graph 1600 in FIG. 16B. In the graph notation, it can be seen that the virtual vertex indicates the role of the branch point of the edge having the same edge identifier in the first embodiment.
- 101 Information processing system
- 110 Graph processing device
- 120 Object selector
- 122 Case generator
- 123 Scenario graph generator
- 124 Possibility bundle generator
- 125 Database
- 126 Case database
- 1801 User terminal
- 1802 Network
- 1803 Wireless base station
- 1804 Sensor group
- 1805 Central processing unit (CPU)
- 1806 Main memory
- 1807 Storage
- 1808 Network interface (I / F)
- 1809 CPU
- 1810 main memory
- 1811 storage
- 1812 touch panel
- 1813 network I / F.
Landscapes
- Physics & Mathematics (AREA)
- Engineering & Computer Science (AREA)
- Theoretical Computer Science (AREA)
- General Physics & Mathematics (AREA)
- Artificial Intelligence (AREA)
- Pure & Applied Mathematics (AREA)
- Data Mining & Analysis (AREA)
- Evolutionary Computation (AREA)
- Algebra (AREA)
- Mathematical Analysis (AREA)
- Mathematical Optimization (AREA)
- Computational Mathematics (AREA)
- Computing Systems (AREA)
- General Engineering & Computer Science (AREA)
- Mathematical Physics (AREA)
- Software Systems (AREA)
- Probability & Statistics with Applications (AREA)
- Traffic Control Systems (AREA)
Abstract
確率過程グラフの頂点がひとつの状態しか保持していないことに起因して、ひとつの頂点から複数の頂点に平行して遷移することができず、状態が分裂したり統合したりする場合に対応できないという課題がある。 本発明では、時系列データから事象を抽出して、抽出した事象に対して頂点を生成し、時系列データの時間の情報および時系列データの源の関係性の情報に基づいて頂点の辺を生成し、頂点間の類似性から複数の頂点を統合することで、上述の課題を解決する。
Description
本発明は、情報処理方法および情報処理システムに関し、特にグラフ処理を実行する情報処理システムとその情報処理方法に関する。
社会インフラや都市などを効率的に設計、運用するためのツールとして、実社会を予測するためのシミュレータが注目されている。このシミュレータにおいては、予測精度そのものの追求よりも、想定外などを含む「可能性の束」を提示することが求められている。
可能性の束は、複数の、シナリオと呼ばれる対象の時間変化を表現したものから構成され、シナリオは、センサのログやシミュレータの出力結果等である。例えば、対象の事例が渋滞であるならば、シナリオは渋滞の長さ等の時間変化を表現したものである。可能性の束の提示を受けることができれば、シミュレータのユーザは複数のシナリオを観測することで、対象の変化の可能性を得ることができる。
特許文献1に開示の技術では、シナリオの表現として確率過程グラフを用い、確率過程グラフに基づいて、希少な事例などの予測を行っていた。特許文献1に開示の技術では、事例がプログラムの性能、シナリオが命令の実行順序(即ち命令の時間変化)として可能性の束を算出しており、算出された可能性の束から希少な事例(プログラムのボトルネック)の発見、解析をしている。
しかし、特許文献1に開示の技術である確率過程グラフは、対象がプログラムや文章や音楽などの場合に適合するが、渋滞などの対象が複数に分裂したり、複数が一つに統合したりする事例には適合できない。例えば、前者の文章の例では、日本語の文章で「私」の次に来る単語は「は」や「たち」などのどれかひとつだが、後者の渋滞では、ある渋滞の次の場合に、対象の渋滞が二つの区間に(即ち二つの渋滞に)分裂、また二つの渋滞が一つの区間に(即ち一つの渋滞に)統合する場合がある。
したがって、渋滞等の対象は、従来の確率過程グラフでは扱えない課題がある。この課題は、確率過程グラフの頂点がひとつの状態しか保持していないことに起因する。各頂点は、接続された複数の辺にそれぞれ付加された遷移確率に従って、複数の辺のどれかひとつの辺に沿って他の頂点へ遷移する。そのため、各頂点から複数の頂点に平行して遷移することができず、状態が分裂したり統合したりする場合に対応できない。
本発明は、ひとつの頂点から複数の頂点に平行して遷移する場合にも対応する情報処理を提供することを目的とする。
本発明では、時系列データから事象を抽出して、抽出した事象に対して頂点を生成し、時系列データの時間の情報および時系列データの源の関係性の情報に基づいて頂点の辺を生成し、頂点間の類似性から複数の頂点を統合することで、上述の課題を解決する。
本発明により、ひとつの頂点から複数の頂点に平行して遷移する場合にも対応することができ、ひいては可能性の束の算出、希少な事例の発見や解析ができる。
本発明の情報処理システムおよび情報処理方法の実施例について以下に説明する。図1に、本実施例の情報処理システム101のブロック図を示す。
情報処理システム101は、グラフ処理装置110と、データベース125と、事例データベース126とを有する。グラフ処理装置110は、対象選択器120と、事例生成器122と、シナリオグラフ生成器123と、可能性の束生成器124とを有する。グラフ処理装置110は、時系列データ107および関係性データ108を入力とし、シナリオグラフデータ105および可能性の束データ102を出力する。可能性の束102は、ユーザに提示するためにユーザインタフェース(I/F)127へ出力される。
本実施例では、例として渋滞を対象としたグラフ処理を処理対象として説明する。ここで、時系列データ107の例を図3A,Bに示す。時系列データ107は、データベース125に保存される。図3Aには、時刻別の通行車両数の時系列データ300を、図3Bにはデータ300に対応する平均車速の時系列データ301を示した。時系列データ107は、道路に配置されたセンサ毎に取得されるものであり、道路を通過する通行車両数および同平均車速が取得される。
関係性データ108の例を図4A,Bに示す。また、図4A,Bに示した関係性データ108の元になる道路に対するセンサの配置を図4Cに示す。
関係性データ108は、時系列データの源と源との間の関係性を表したデータであり、本実施例ではセンサ間の関係性を表したデータである。関係性データ108は、データベース125に保存される。図4Cに示した交差点402を含む道路上に分散して配置されたセンサ1~7を、各センサを頂点とし、隣り合うセンサを辺でつないでグラフ表記すると図4Aのグラフ400になる。また、図4Bのセンサ間の関係性のデータ401は、図4Aのグラフ400をデータ構造で表記したものである。センサ間の関係性のデータ401では、センサ間に関係性がある場合は「1」、無い場合は「0」となる。本実施例では、関係性は道路による繋がりを表し、例えば、道路1の道路2との交差点402に配置されたセンサ1と道路2に配置されたセンサ2は、道路1と道路2が交差点で接続されており、またセンサ同士がグラフ400上で隣り合って接続されているので関係性があり、センサ2とセンサ3はグラフ400上で隣り合って接続されていないので、関係性がない。本実施例では、渋滞を事例とし、関係性はセンサ群の空間的な配置関係であるが、他の実施例としては、会社の倒産を事例とし、関係性は会社間の取引関係とすることもできる。
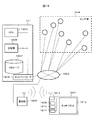
図18に、情報処理システム101およびユーザ端末1801のハードウェア構成を示す。情報処理システム101とユーザ端末1801の間は、ネットワーク1802および無線基地局1803を介して、無線接続される。本実施例では、無線接続の例を示したが、有線接続でも実施可能である。また、本実施例の道路上に配置されたセンサ群(センサ1,2,・・・)1804は、ネットワーク1802を介して情報処理システム101と接続される。これにより、情報処理システム101は、時系列データの源であるセンサ群1804からの情報を収集し、時系列データ107を作成して、データベース125に保存することができる。
情報処理システム101は、中央処理装置(CPU)1805と、主記憶1806と、ストレージ1807と、ネットワークインタフェース(I/F)1808とを有する。情報処理システム101の対象選択器120、事例生成器122、シナリオグラフ生成器123、および可能性の束生成器124は、プログラムとしてストレージ1807に保存され、CPU1805および主記憶1806で実行される。
ユーザ端末1801は、例えばタブレット端末などの携帯端末であり、ユーザI/F127を実現する。ユーザ端末1801は、CPU1809と、主記憶1810と、ストレージ1811と、タッチパネル1812と、ネットワークI/F1813とを備える。ユーザ端末1801は、タッチパネル1812で対象の事例の選択などのユーザからの入力を受け付け、タッチパネル1812の液晶画面に可能性の束102などを表示する。
次に、本実施例の情報処理システム101によるグラフ処理について説明する。図2に、情報処理システム101のグラフ処理の動作のフローチャートを示す。
先ず、対象の選択のステップ201で、ユーザは対象の事例を選択する。本実施例では、ユーザは、対象選択器120からユーザ端末1801のタッチパネル1812を介して提示される対象の候補うち「渋滞」を対象として選択したとする。対象として「渋滞」が選択されたことを受信した対象選択器120は、事例生成器122に、対象の定義103として「渋滞」の定義を送信する。本実施例では、「渋滞」の定義は、平均車速20km/h以下とする。対象の定義103は、予めストレージ1807に保存しておいてもよいし、ユーザがタッチパネル1812から入力できるようにしてもよい。また、対象選択器120は、対象の定義103として、さらに、昨日と一昨日の事例と指定して、事例生成器122に送信する。昨日と一昨日という事例の期間は、ユーザがタッチパネル1812から入力できるようにしてもよいし、予め設定しておいてもよい。
対象の定義103を受信した事例生成器122は、受信した対象の定義103に対応する時系列データ107と関係性データ108とをデータベース125から取得する。図2においては、当該処理はステップ202とステップ203に相当する。
事例生成処理204について説明する。事例生成処理204は事例生成器122で実行される。事例生成器122は、対象の定義103、時系列データ107、および関係性データ108を入力とし、事例グラフデータ106を出力とする。
事例生成処理204の詳細フローチャートを図5に記す。処理501-1~501-2間のループ処理において、事例生成器122は、時系列データ107を走査し、事象(本実施例では渋滞)を抽出し(処理502)、抽出された事象に対応する頂点の情報を生成する(処理503)。
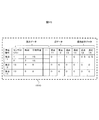
図6A,B,Cに処理502および処理503の例を示す。事例生成器122は、平均車速の時系列データ301において、対象の定義103に適合する事象を抽出する。ここでは平均時速20km/h以下に適合する事象である図6Aで楕円601~603で囲んだ事象1~3が抽出される。抽出された事象は頂点の情報として生成され、グラフ表記では図6Bに示したグラフ610の頂点となり、データ構造で表現すると図6Cに示した事例グラフデータ620のエントリになる。各頂点の情報は、事例グラフデータ620の各エントリのように、頂点データとして、センサ識別情報(ID)やセンサデータの取得の時刻などの時系列データの情報と対応付けられて、主記憶1806やストレージ1807に保持される(処理504)。
続いて、事例生成器122は、生成された頂点の情報から任意の2つの頂点に対するループ処理(処理505-1~505-2)を実行する。ここで、説明のために仮に、任意の2つの頂点として選択された頂点をそれぞれ、頂点Aおよび頂点Bとする。事例生成器122は、当該2つの頂点の情報に保持されている時刻のデータから、頂点間のセンサデータの取得の時間間隔を処理506で評価する。時間間隔(頂点Bのセンサデータの取得の時刻と頂点Aのセンサデータの取得の時刻の間の時間)が0より大きく予め決められた閾値よりも小さい場合、事例生成器122は、処理507において、当該2つの頂点の関係性を関係性データ401から取得する。事例生成器122は、取得した関係性を処理508で評価し、関係性が「1」、即ち関係性がある場合は、処理509において当該2つの頂点間(ここでは頂点Aと頂点Bの間)に辺の情報を出力する。出力された辺の情報は、頂点Aの情報の辺データの頂点Bの列に「1」として保存される。一方、処理507、処理509のいずれかの評価で条件を充たさない(Nであった)場合は、事例生成器122は、辺の情報を出力しない。したがって、辺の情報は「0」のままになる。以上のようにして、事例生成器122は辺の情報を生成する。
図7A,Bに、処理505-1~処理505-2の処理の例を示す。ここで閾値を2とし、図6Cの頂点1(611)と頂点2(612)を例に説明する。頂点1(611)と前記頂点2(612)は、事例グラフデータ620から時間間隔(頂点2の時刻(=4)-頂点1の時刻(=3)=1)が1であり、処理506の評価式(0<1<2)が成り立つ。また、センサ間の関係性のデータ401より関係性があり処理508の評価式(関係性=1)が成り立つ。従って、頂点1と頂点2間で図7Aのグラフ表記700の辺1(701)の情報が図7Bの辺データ711のように出力される。同様に、事例生成器122は、頂点1と頂点3間で辺2(702)の情報を出力し、頂点2と頂点3間には辺の情報を出力しない。ここで、辺は時間方向に大きくなる方向に対して方向を持つ有向辺である。以上の生成された辺の情報をデータ表記で示すと、図7Bの事例グラフデータ710の各エントリのようになる。
以上の処理で、事例生成器122は、対象の定義103、時系列データ107および関係性データ108を入力とし、事例グラフデータ106を出力する。
次に、シナリオグラフ生成処理205について説明する。シナリオグラフ生成処理は、事例グラフデータの複数のエントリを統合し、シナリオグラフ(確率過程グラフ)を生成する処理である。
シナリオグラフ生成処理205は、シナリオグラフ生成器123で実行される。シナリオグラフ生成器123は、事例グラフデータ106を入力とし、シナリオグラフデータ105を出力とする。
シナリオグラフ生成処理205のフローチャートを図8に示す。先ず処理801において、シナリオグラフ生成器123は、事例グラフデータを取得する。その後、シナリオグラフ生成器123は、事例グラフデータから任意の1頂点を選択(選択した頂点を頂点Aとする)するループ処理(802-1~802-2)を実行する。
シナリオグラフ生成器123は、頂点Aが既に類似頂点として選択されているかどうかの評価を処理803で実施し、選択されていない場合は処理804に移行する。続いて、シナリオグラフ生成器123は、取得した事例グラフデータから頂点A以外の頂点を選択(選択した頂点を頂点Bとする)するループ処理(805-1~805~2)を実行する。処理806にて、シナリオグラフ生成器123は、頂点Aと頂点Bの類似度を計算する。類似度は、例えば、それぞれの頂点が保持する平均速度などのデータの差分絶対値を指標とする。シナリオグラフ生成器123は、処理807において、求めた類似度と予め指定された閾値とを比較して評価し、評価式(類似度<閾値)が充たされれば、処理808に移行し、頂点Bを頂点Aの類似頂点として類似頂点リストに登録する。
処理801~805-2までの処理の具体例を図9A,B,Cに示す。例として、処理801でシナリオグラフ生成器123が取得した事例グラフデータを、図9Aに示した事例グラフデータ1(900)と事例グラフデータ2(920)とする。それぞれの事例グラフデータは対象の定義103で指定されたものであり、事例グラフデータ1が昨日のデータで、事例グラフデータ2が一昨日のデータに対応する。事象グラフデータ1および事象グラフデータ2のグラフ表記をそれぞれ図9Bのグラフ910およびグラフ930に示す。
シナリオグラフ生成器123は、先ず頂点Aとして事例グラフデータ1の頂点1を選択する。頂点Aは、類似頂点として選択されたことは無い。ループ処理805にて、シナリオグラフ生成器123は、頂点Bとして事例グラフデータ1の頂点2を選択する。そして、シナリオグラフ生成器123は、頂点Aと頂点Bの平均車速から類似度を計算(頂点Aの平均車速(=15)-頂点Bの平均車速(=10)=5)し、閾値と比較する。ここで、閾値は1とすると、処理807の評価式(5<1)は充足しないことになり、頂点Bは類似頂点リストに追加されない。シナリオグラフ生成器123は、処理805-1に戻り、頂点Bとして事例グラフデータ1の頂点3を選択し、同様に処理する。ここでも、評価式は充足されないので頂点Bは類似頂点リストに追加されない。続いて同様に、シナリオグラフ生成器123は、事例グラフデータ2の頂点1を処理する。事例グラフデータ2の頂点1は処理807の評価式を充足するので、類似頂点リストに追加される。これを繰り返し、図9Cに示した類似頂点リスト940が生成される。ここで、類自頂点リスト940の頂点Aの列に事例グラフデータ2の頂点1が含まれないが、これは事例グラフデータ1を先に処理したために、事例グラフデータ2の頂点1が類似頂点として選択されたためである。
次に、処理810以降を説明する。処理810にて、シナリオグラフ生成器123は、辺識別子を定義し、「2」で初期化する。その後、シナリオグラフ生成器123は、頂点Aに対する類似頂点リストから頂点を選択(選択した頂点を類似頂点とする)するループ処理(811-1~811-2)を実行する。
処理812において、シナリオグラフ生成器123は、類似頂点の辺データを取得し、辺データが「1」のデータ、即ち関係性のある頂点に対する辺、を「2」で初期化された辺識別子に変更する(処理813)。そして処理814にて、シナリオグラフ生成器123は、類似頂点の頂点データおよび変更された辺データを頂点Aの情報に保存する。シナリオグラフ生成器123は、当該ループの最後に辺識別子に1を加える。辺識別子に1を加える理由は、辺識別子が重複した値を持つことを回避するためであり、変形例としては、1以外の数字または重複リストなどによっても実現できる。以上を類似頂点リストの頂点がなくなるまで繰り返すことによって、頂点Aと類似する頂点を、頂点Aに統合し、辺識別子によって、統合された辺と統合前の辺とを区別することが可能となる。これらを繰り返すことによって、事例グラフデータの複数のエントリを、一つのグラフデータに統合できる。ここで、統合されたグラフデータをシナリオグラフデータと呼ぶ。
処理810~処理811-2までの処理の具体例を図10A,Bに示す。図10では、簡単のため、事例グラフデータ1の頂点1を頂点11、事例グラフデータ2の頂点1を頂点21のように記載する。頂点Aが頂点11の際に、類似頂点リスト940の対応する類似頂点は頂点21である。従って、処理812にて、シナリオグラフ生成器は頂点21の辺データを取得する。頂点21の辺データでは、頂点22に対応する辺が「1」となっているため、処理813にて、シナリオグラフ生成器123は、辺データを辺識別子「2」に書き換える。そして処理814にて、シナリオグラフ生成器123は、頂点21の保持するデータを頂点11に追加する。以上を繰り返すことによって、図10Bに示したシナリオグラフデータ1010が生成される。このとき、シナリオグラフデータ1010のグラフ表記は図10Aのグラフ1000のように描け、複数の事例グラフデータのエントリが一つに統合されたことが分かる。さらに、シナリオグラフデータ1010では、辺識別情報データ1011から、統合前の辺を区別できる。
以上の処理で、シナリオグラフ生成処理205では、事例グラフデータ106が入力され、シナリオグラフデータ105が出力される。
次に可能性の束生成処理206について説明する。可能性の束生成処理は、シナリオグラフデータを元に、複数のシナリオ(これを可能性の束と定義する)を生成する処理である。複数のシナリオは、時系列データと関係性データから予測された、例えば、未来の起き得る事例群であり、ユーザは複数のシナリオを本実施例のシステムによって得ることで、想定していなかった事例などを発見できる。
可能性の束生成処理206は、可能性の束生成器124で実行される。可能性の束生成器124は、シナリオグラフデータ105を入力とし、可能性の束102を出力とする。
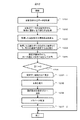
可能性の束生成処理206のフローチャートを図11に示す。先ず、処理1101において、可能性の束生成器124は、シナリオグラフデータを取得する。その後、可能性の束生成器124は頂点リストを初期化し(処理1102)、ユーザがタッチパネル1812から開始頂点の選択をする(処理1103)。処理1103では、例えば、グラフ処理装置110はユーザに対し、タッチパネル1802を介して取得したシナリオデータに基づいてシナリオグラフを提示し、ユーザは提示されたシナリオグラフ内から開始頂点を選択する。
処理1104にて、可能性の束生成器124は、選択された開始頂点を頂点リストへ追加する。次に、可能性の束生成器124は処理1105のトラバース処理を実行するが、当該処理は再帰関数となっており、トラバース処理内部でトラバース処理を実行している。
トラバース処理1105のフローチャートを図12に示す。トラバース処理では、選択された頂点の辺データを取得(処理1201)し、取得した辺データに格納されている辺識別子のうちから確率的に遷移する辺識別子を取得(処理1202)し、取得した辺識別子の遷移確率を算出し(処理1203)、算出した遷移確率から遷移する辺を選択する(処理1204)。
処理1203では、遷移確率は、0を除く辺識別子の種類数を母数として、各識別子の種類間で等しい遷移確率とする。また処理1204では、可能性の束生成器124は、算出した遷移確率に基づいて最も低い遷移確率を持つ辺を選択する。遷移確率に差ができうるのは、統合される複数の頂点がそれぞれ同じ統合された頂点への遷移確率を有すると、統合により遷移確率がその和となるためである。
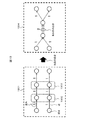
図19は、入力された事例グラフデータについて頂点の統合がなされ、重みつきの確率過程グラフが作成される概念を示した模式図である。図19の左の二つの事例グラフ1901間で、2組(1902、1903)の頂点が類似の特徴を持つために統合され、図19の右に示したように他の辺に対して重みが大きい辺を有する確率過程グラフ1904ができる。
次に、処理1205で、可能性の束生成器124は、選択された辺に含まれる辺識別子と同一の辺識別子を持つ全ての辺の辺データを取得する。可能性の束生成器124は、取得した辺データが0かどうか評価し(処理1206)、0で無かった場合、取得した辺のループ処理(1207-1~1207-2)を実行する。当該ループ処理内では、該辺の接続先の頂点を選択し(処理1208)、頂点リストに追加(処理1209)、そして、トラバース処理1105を実行する再帰処理となる。
上記の処理を行うことで得られた頂点リストをシナリオとして登録することで、シナリオグラフデータ105から、選択された開始頂点を起点としたシナリオを生成することができる。また、複数の開始頂点を選択することで、複数のシナリオを生成することができる。当該複数のシナリオを可能性の束と呼ぶ。
処理1101~処理1106までの処理の具体例を示す。本例では、可能性の束生成器124は、図10Bのシナリオグラフデータ1000を処理1101にて取得する。またここで、処理1103で選択された開始頂点を頂点11とする。処理1104において、頂点11が頂点リストに追加される。その後トラバース処理1105において、可能性の束生成器124は、頂点11の辺データを取得し(処理1201)、確率的に遷移する辺識別子を取得する(処理1202)。頂点11の0を除く辺識別子の種類数は2(1と2の2種類)であるから、確率的に遷移する辺識別子は辺識別子1と辺識別子2である。次に処理1203において、頂点11の辺識別子の種類数は2であるから、辺識別子1の遷移確率は1/2、辺識別子2の遷移確率は1/2となる。本実施例では、最小となる確率の辺が複数あった場合には、若い番号の辺識別子を選択する。したがって本例では、処理1205で辺識別子1が選択される。ここで、遷移確率に差が生じる場合としては、仮に例えば、頂点Xから頂点Yに向かう辺があり、頂点Xと頂点11とが類似し、また頂点Yと頂点22とが類似する場合であり、この場合には頂点11から頂点22に遷移する確率が2/3で、頂点11から頂点12および頂点13に遷移する確率の1/3よりも高くなる。辺識別子1を持つ辺は頂点12と頂点13であり、頂点12と頂点13は並行して遷移するので、処理1207-1~1207-2のループ処理では頂点12と頂点13が対象となる。まず頂点12が選択され(処理1208)、頂点12が頂点リストへ登録される(処理1209)。次のトラバース処理では頂点12が選択された頂点として処理される。当該頂点は接続する辺を持たないため、評価式(処理1206)が偽となり、トラバース処理が終了する。頂点13においても頂点12と同様に処理される。
以上の処理から、頂点リストには頂点11、頂点12、頂点13が登録されており、これがシナリオデータとなる。この登録されたシナリオデータを図13Aに示す。シナリオデータ1310は各頂点の頂点データと辺データを保持している。また、シナリオデータ1310のグラフ表記を図13Bのグラフ1300に示す。さらに、処理1103で複数の頂点が選択されることで、単一のシナリオだけでなく、複数のシナリオ、すなわち可能性の束を得ることができる。
最後に、可能性の束生成処理206は、生成した可能性の束となるシナリオデータを事例データベース126に保存し、タッチパネル1812に可能性の束を提示する(処理207)。
以上の処理(処理201~207)によって、グラフ処理装置110は、時系列データと関係性データを入力とし、シナリオグラフデータ(確率過程グラフ)を生成し、シナリオグラフデータから複数のシナリオ、即ち可能性の束を出力する。
以上のように、本実施例の情報処理システム101は、ひとつの頂点から複数の頂点に平行して遷移する場合にも対応することができ、ひいては可能性の束の算出、希少な事例の発見や解析ができる。また、本実施例では、もっとも小さい遷移確率となる辺を処理1204で選択したが、逆に処理1204でもっとも高い遷移確率となる辺を選択することで、もっとも起こりそうな事例の発見や解析が可能となる。
実施例2では、実施例1の可能性の束生成処理206の処理1203において、最小の確率で遷移する辺でなく、全ての辺である場合を説明する。実施例2は一つの開始頂点から複数のシナリオを作成する効果がある。
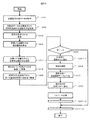
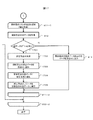
図14に、実施例2におけるトラバース処理のフローチャートを示す。図12と同一の処理は同じ符号を付してある。実施例1と比較すると、処理1210、1211、1212、1213が異なる。
処理1210では、可能性の束生成器124は、頂点リストをメモリに保存する。これは、次処理である処理1211で辺識別子のループを行う際、各辺識別子の処理で同一の頂点リストから開始するためである。例えば、頂点リストに頂点Aが格納されている場合、可能性の束生成器124は、処理1210で前記頂点リストを保存し、処理1211-1で辺識別子として辺識別子Aを選択し、処理1212で、処理1212で保存した頂点リストを取得する。
その後の処理で、例えば、頂点リストに頂点Bが追加されると、頂点リストには頂点Aと頂点Bが格納されている。次に処理1211-1に戻って辺識別子Bが選択され、処理1212で、処理1210で保存した頂点リストを取得する。その後の処理で、例えば、頂点リストに頂点Cが追加されると、頂点リストには頂点Aと頂点Cが格納されている。即ち、頂点Aから頂点Bへ遷移するシナリオと頂点Aから頂点Cへ遷移するシナリオの二つのシナリオを生成できた。
また、処理1213では、選択頂点に対し遷移確率データを付加する。前記遷移確率データは処理1203で算出した値である。図15に、遷移確率データを付加したシナリオデータ1500を示す。遷移確率データは各辺に定義され、図15の例では頂点11から頂点12と頂点13へ遷移する確率は0.5(50%)であることを示している。前記遷移確率は複数のシナリオ間で、シナリオの発生確率を評価する際に用いられる。
以上の処理により、一つの開始頂点から複数のシナリオを生成できる。
実施例3では、実施例1において、辺識別子を持つ代わりに仮想頂点の配置によって解決する方法である場合を説明する。実施例3は階層的な辺の識別が可能になる効果がある。
図17に仮想頂点を用いた場合のシナリオグラフ生成処理フローチャートを示す。図17は図8の結合子「1」以降の処理を記載している。また、図8と同一処理は同一符号を付している。
処理812において、シナリオグラフ生成器123は、類似頂点の辺データを取得した後、処理1701にて前記辺データの数が1より大きいかどうかの評価を行う。前記評価が偽であった場合、シナリオグラフ生成器123は、実施例1の処理814と同様の処理を行う。一方、前記評価が真であった場合、シナリオグラフ生成器123は、仮想頂点を生成する(処理1702)。次に、シナリオグラフ生成器123は、類似頂点の頂点データを頂点Aに追加し(処理1703)、前記類自頂点の辺データに仮想頂点を追加する(処理1704)。これら処理により、頂点Aは、類似頂点のデータを持ち、仮想頂点に対し辺を持つ。さらに、シナリオグラフ生成器123は、処理1705において類似頂点の辺データを仮想頂点の辺データに保存することで、頂点Aから仮想頂点を媒介し他の頂点に接続する。また複数の仮想頂点を用いることで、仮想頂点から仮想頂点への辺など階層的なグラフを生成できる。
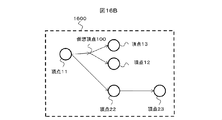
図16A,Bに、仮想頂点を用いた場合のシナリオデータの例を示す。図16Aに示したように、シナリオデータ1610は、仮想頂点識別子1611と仮想頂点辺データ1612を有する。前記仮想頂点識別子は、仮想頂点のとき1、それ以外は0となるデータである。頂点11は仮想頂点辺データによって仮想頂点100に接続する。仮想頂点100は辺データによって頂点12および頂点13に接続する。また、頂点データは、頂点11に保持され、仮想頂点は頂点データを持たない。以上のシナリオデータ1610のグラフ表記を図16Bのグラフ1600に示す。前記グラフ表記では、仮想頂点は、実施例1における同一辺識別子を持つ辺の分岐点の役割を示していることがわかる。
101:情報処理システム、110:グラフ処理装置、120:対象選択器、122:事例生成器、123:シナリオグラフ生成器、124:可能性の束生成器、125:データベース、126:事例データベース、1801:ユーザ端末、1802:ネットワーク、1803:無線基地局、1804:センサ群、1805:中央処理装置(CPU)、1806:主記憶、1807:ストレージ、1808:ネットワークインタフェース(I/F)、1809:CPU、1810:主記憶、1811:ストレージ、1812:タッチパネル、1813:ネットワークI/F。
Claims (14)
- ユーザインタフェースからの対象となる事例の選択を受け付けるステップと、
ストレージに保存されている時系列データから、選択された事例に対応する事象を抽出し、抽出した事象に対して頂点の情報を生成するステップと、
前記時系列データの時間の情報、および前記ストレージに保存されている前記時系列データの源の関係性の情報に基づいて前記頂点の辺の情報を生成するステップと、
前記頂点間の類似性から複数の前記頂点の情報を統合するステップと、を有することを特徴とする情報処理方法。 - 請求項1に記載の情報処理方法において、
前記時系列データは、空間的に分散して配置されたセンサ群で取得され、
前記関係性の情報は、前記センサ群の配置に関する情報であることを特徴とする情報処理方法。 - 請求項1に記載の情報処理方法において、
前記センサ群は道路に配置されており、
前記センサ群の配置に関する情報は、各センサ間が前記道路上で隣り合っているか否かの情報であることを特徴とする情報処理方法。 - 請求項1に記載の情報処理方法において、
統合された前記頂点の情報に基づいて前記頂点間の遷移確率を求めるステップを有することを特徴とする情報処理方法。 - 請求項4に記載の情報処理方法において、
前記ユーザインタフェースからの開始頂点の選択を受け付けるステップと、
求めた遷移確率に基づいて、選択された開始頂点を起点とした頂点群で形成されるシナリオを出力するステップと、を有することを特徴とする情報処理方法。 - 請求項5に記載の情報処理方法において、
前記シナリオは、選択された開始頂点を起点として各頂点から最も高い遷移確率の辺で接続される頂点群で形成されていることを特徴とする情報処理方法。 - 請求項5に記載の情報処理方法において、
前記シナリオは、選択された開始頂点を起点として各頂点から最も低い遷移確率の辺で接続される頂点群で形成されていることを特徴とする情報処理方法。 - 対象となる事例の選択を受け付けるユーザインタフェースと、
時系列データおよび前記時系列データの源の関係性の情報を保存するストレージと、を有し、
前記時系列データから、選択された事例に対応する事象を抽出し、抽出した事象に対して頂点の情報を生成し、
前記時系列データの時間の情報、および前記関係性の情報に基づいて前記頂点の辺の情報を生成し、
前記頂点間の類似性から複数の前記頂点の情報を統合する情報処理システム。 - 請求項8に記載の情報処理システムにおいて、
前記時系列データを取得する空間的に分散して配置されたセンサ群を有し、
前記関係性の情報は、前記センサ群の配置に関する情報であることを特徴とする情報処理システム。 - 請求項9に記載の情報処理システムにおいて、
前記センサ群は道路に配置されており、
前記センサ群の配置に関する情報は、各センサ間が前記道路上で隣り合っているか否かの情報であることを特徴とする情報処理システム。 - 請求項8に記載の情報処理システムにおいて、
統合された前記頂点の情報に基づいて前記頂点間の遷移確率を求めることを特徴とする情報処理システム。 - 請求項8に記載の情報処理システムにおいて、
前記ユーザインタフェースから開始頂点の選択を受け付け、
求めた遷移確率に基づいて、選択された開始頂点を起点とした頂点群で形成されるシナリオを出力することを特徴とする情報処理システム。 - 請求項8に記載の情報処理システムにおいて、
前記シナリオは、選択された開始頂点を起点として各頂点から最も高い遷移確率の辺で接続される頂点群で形成されていることを特徴とする情報処理システム。 - 請求項8に記載の情報処理システムにおいて、
前記シナリオは、選択された開始頂点を起点として各頂点から最も低い遷移確率の辺で接続される頂点群で形成されていることを特徴とする情報処理システム。
Priority Applications (2)
| Application Number | Priority Date | Filing Date | Title |
|---|---|---|---|
| JP2015507831A JP6014751B2 (ja) | 2013-03-29 | 2013-03-29 | 情報処理方法および情報処理システム |
| PCT/JP2013/059439 WO2014155641A1 (ja) | 2013-03-29 | 2013-03-29 | 情報処理方法および情報処理システム |
Applications Claiming Priority (1)
| Application Number | Priority Date | Filing Date | Title |
|---|---|---|---|
| PCT/JP2013/059439 WO2014155641A1 (ja) | 2013-03-29 | 2013-03-29 | 情報処理方法および情報処理システム |
Publications (1)
| Publication Number | Publication Date |
|---|---|
| WO2014155641A1 true WO2014155641A1 (ja) | 2014-10-02 |
Family
ID=51622708
Family Applications (1)
| Application Number | Title | Priority Date | Filing Date |
|---|---|---|---|
| PCT/JP2013/059439 Ceased WO2014155641A1 (ja) | 2013-03-29 | 2013-03-29 | 情報処理方法および情報処理システム |
Country Status (2)
| Country | Link |
|---|---|
| JP (1) | JP6014751B2 (ja) |
| WO (1) | WO2014155641A1 (ja) |
Citations (3)
| Publication number | Priority date | Publication date | Assignee | Title |
|---|---|---|---|---|
| JP2003114977A (ja) * | 2001-10-03 | 2003-04-18 | Hitachi Ltd | 顧客生涯価値算出方法およびシステム |
| JP2011138432A (ja) * | 2009-12-29 | 2011-07-14 | Toshiba Corp | 道路交通管制支援情報作成システム |
| JP2012198839A (ja) * | 2011-03-23 | 2012-10-18 | Denso It Laboratory Inc | 交通量予測装置、交通量予測方法およびプログラム |
-
2013
- 2013-03-29 JP JP2015507831A patent/JP6014751B2/ja not_active Expired - Fee Related
- 2013-03-29 WO PCT/JP2013/059439 patent/WO2014155641A1/ja not_active Ceased
Patent Citations (3)
| Publication number | Priority date | Publication date | Assignee | Title |
|---|---|---|---|---|
| JP2003114977A (ja) * | 2001-10-03 | 2003-04-18 | Hitachi Ltd | 顧客生涯価値算出方法およびシステム |
| JP2011138432A (ja) * | 2009-12-29 | 2011-07-14 | Toshiba Corp | 道路交通管制支援情報作成システム |
| JP2012198839A (ja) * | 2011-03-23 | 2012-10-18 | Denso It Laboratory Inc | 交通量予測装置、交通量予測方法およびプログラム |
Non-Patent Citations (3)
| Title |
|---|
| AKIHIRO KANAZAWA: "Preliminary Consideration of using Decision Tree to Predict the Future Traffic Congestion", IPSJ SIG NOTES, vol. 2004, no. 19, 2 March 2004 (2004-03-02), pages 141 - 148 * |
| HITOSHI MORI: "Traffic Congestion Prediction based on a Case Based Modeling Method", THE TRANSACTIONS OF THE INSTITUTE OF ELECTRONICS, INFORMATION AND COMMUNICATION ENGINEERS, vol. J82-B, no. 11, 25 November 1999 (1999-11-25), pages 1993 - 2001 * |
| KEN'ICHI ICHIKAWA: "Shin Business Soshutsu eno Torikumi", NTT GIJUTSU JOURNAL, vol. 19, no. 3, 1 March 2007 (2007-03-01), pages 27 - 30 * |
Also Published As
| Publication number | Publication date |
|---|---|
| JP6014751B2 (ja) | 2016-10-25 |
| JPWO2014155641A1 (ja) | 2017-02-16 |
Similar Documents
| Publication | Publication Date | Title |
|---|---|---|
| CN111046027B (zh) | 时间序列数据的缺失值填充方法和装置 | |
| US8412660B2 (en) | Multi-pairs shortest path finding method and system with sources selection | |
| JP6613475B2 (ja) | 経路照会方法、装置、デバイス及び不揮発性コンピューター記憶媒体 | |
| JP6719748B2 (ja) | 探索システム、探索方法および物性データベース管理装置 | |
| US20100235814A1 (en) | Apparatus and a method for generating a test case | |
| US11055210B2 (en) | Software test equipment and software testing method | |
| US9491186B2 (en) | Method and apparatus for providing hierarchical pattern recognition of communication network data | |
| Kiss et al. | Exact deterministic representation of Markovian SIR epidemics on networks with and without loops | |
| WO2017040632A2 (en) | Event categorization and key prospect identification from storylines | |
| JP5070574B2 (ja) | 局所交通量予測プログラム生成装置、局所交通量予測装置、局所交通量予測プログラム生成方法、局所交通量予測方法及びプログラム | |
| Hou et al. | The Prediction of Multistep Traffic Flow Based on AST‐GCN‐LSTM | |
| Guettiche et al. | Critical links detection in stochastic networks: application to the transport networks | |
| CN116756330A (zh) | 知识图谱构建方法和装置、电子设备及存储介质 | |
| CN112508518A (zh) | 结合rpa和ai的rpa流程的生成方法以及相应的设备、可读存储介质 | |
| Kas et al. | An incremental algorithm for updating betweenness centrality and k-betweenness centrality and its performance on realistic dynamic social network data | |
| van Engelen et al. | Explainable and efficient link prediction in real-world network data | |
| EP3336719A1 (en) | Future scenario generation device and method, and computer program | |
| CN111274455A (zh) | 图数据处理方法、装置、电子设备及计算机可读介质 | |
| CN107958303B (zh) | 一种拥堵传播数据生成方法及装置、拥堵传播预测方法及系统 | |
| JP6014751B2 (ja) | 情報処理方法および情報処理システム | |
| US11295610B2 (en) | System and method for generating an alert based on change in traffic pattern | |
| JP6282174B2 (ja) | テキストを用いたルート案内方法 | |
| WO2013180920A2 (en) | Buildable part pairs in an unconfigured product structure | |
| Barakathullah et al. | Prediction of Usage Probabilities of Shopping-Mall Corridors Using Heterogeneous Graph Neural Networks | |
| JP7593508B2 (ja) | 生成方法、生成プログラム及び情報処理装置 |
Legal Events
| Date | Code | Title | Description |
|---|---|---|---|
| 121 | Ep: the epo has been informed by wipo that ep was designated in this application |
Ref document number: 13880380 Country of ref document: EP Kind code of ref document: A1 |
|
| ENP | Entry into the national phase |
Ref document number: 2015507831 Country of ref document: JP Kind code of ref document: A |
|
| NENP | Non-entry into the national phase |
Ref country code: DE |
|
| 122 | Ep: pct application non-entry in european phase |
Ref document number: 13880380 Country of ref document: EP Kind code of ref document: A1 |