WO2015129031A1 - Système et procédé de détection de fuite d'eau - Google Patents
Système et procédé de détection de fuite d'eau Download PDFInfo
- Publication number
- WO2015129031A1 WO2015129031A1 PCT/JP2014/055098 JP2014055098W WO2015129031A1 WO 2015129031 A1 WO2015129031 A1 WO 2015129031A1 JP 2014055098 W JP2014055098 W JP 2014055098W WO 2015129031 A1 WO2015129031 A1 WO 2015129031A1
- Authority
- WO
- WIPO (PCT)
- Prior art keywords
- water leakage
- water
- likelihood
- sensor
- leakage
- Prior art date
- Legal status (The legal status is an assumption and is not a legal conclusion. Google has not performed a legal analysis and makes no representation as to the accuracy of the status listed.)
- Ceased
Links
Images











Classifications
-
- G—PHYSICS
- G01—MEASURING; TESTING
- G01M—TESTING STATIC OR DYNAMIC BALANCE OF MACHINES OR STRUCTURES; TESTING OF STRUCTURES OR APPARATUS, NOT OTHERWISE PROVIDED FOR
- G01M3/00—Investigating fluid-tightness of structures
- G01M3/02—Investigating fluid-tightness of structures by using fluid or vacuum
- G01M3/26—Investigating fluid-tightness of structures by using fluid or vacuum by measuring rate of loss or gain of fluid, e.g. by pressure-responsive devices, by flow detectors
- G01M3/28—Investigating fluid-tightness of structures by using fluid or vacuum by measuring rate of loss or gain of fluid, e.g. by pressure-responsive devices, by flow detectors for pipes, cables or tubes; for pipe joints or seals; for valves ; for welds
- G01M3/2807—Investigating fluid-tightness of structures by using fluid or vacuum by measuring rate of loss or gain of fluid, e.g. by pressure-responsive devices, by flow detectors for pipes, cables or tubes; for pipe joints or seals; for valves ; for welds for pipes
- G01M3/2815—Investigating fluid-tightness of structures by using fluid or vacuum by measuring rate of loss or gain of fluid, e.g. by pressure-responsive devices, by flow detectors for pipes, cables or tubes; for pipe joints or seals; for valves ; for welds for pipes using pressure measurements
-
- E—FIXED CONSTRUCTIONS
- E03—WATER SUPPLY; SEWERAGE
- E03B—INSTALLATIONS OR METHODS FOR OBTAINING, COLLECTING, OR DISTRIBUTING WATER
- E03B7/00—Water main or service pipe systems
- E03B7/02—Public or like main pipe systems
-
- E—FIXED CONSTRUCTIONS
- E03—WATER SUPPLY; SEWERAGE
- E03B—INSTALLATIONS OR METHODS FOR OBTAINING, COLLECTING, OR DISTRIBUTING WATER
- E03B7/00—Water main or service pipe systems
- E03B7/003—Arrangement for testing of watertightness of water supply conduits
Definitions
- the present invention relates to a water leakage detection system and a water leakage detection method.
- Patent Document 1 water faucet use amount storage means 11 for storing the amount of water used in each faucet, node demand amount assigning means 12 for setting the demand amount of the nodes, and pipes constituting the distribution pipe network Pipe network analysis model storage means 14 for storing the road material, extension, etc., leakage amount distribution optimization means 13 for setting the leakage amount allocation amount for each node, and inflow flow rate and pressure data to the distribution pipe network are stored.
- Pipe that performs pipe network analysis based on process data storage means 18, pipe network analysis model from pipe network model storage means, nighttime flow rate and pressure data, leak amount allocation amount for each node, and demand amount for each node
- the network analysis means 17 and the pressure error calculation means 16 for calculating the error between the estimated pressure value and the actual pressure value at each node are provided, and the leak error distribution optimization means minimizes the pressure error obtained by the pressure error calculation means.
- the amount of water leakage is distributed at each node. Because of optimization operation for leakage node estimator. "Is described as (see Abstract).
- the present invention provides a technique for detecting water leakage quickly and accurately in order to minimize the cost of water loss due to water leakage and the risk of catastrophic disasters. Thereby, it becomes possible to predict the risk of water leakage detected, and it is possible to perform an efficient repair plan and personnel assignment.
- the present invention employs the following configuration, for example. That is, it is a water leakage detection system that includes a processor and a storage device and detects water leakage in a pipe, and the storage device measures history data of a first sensor that measures a value that reflects the flow rate in the pipe.
- a sensor measurement value database including: the processor selects a measurement value of a first period from the sensor measurement value database, calculates a probability distribution of a predetermined variable from the measurement value of the first period, and A determination target measurement value is selected from a sensor measurement value database, a value of the predetermined variable is calculated from the determination target measurement value, and the probability distribution and the value of the predetermined variable calculated from the determination target measurement value are
- a water leakage detection system that calculates a water leakage likelihood based on the water leakage likelihood and determines whether or not a new water leakage has occurred in the pipe based on the water leakage likelihood.
- Example 1 it is explanatory drawing which shows the outline example of the water distribution pipe network used as the water leak detection object of a water leak detection system.
- Example 1 it is explanatory drawing which shows the example of an outline
- Example 1 it is a block diagram which shows the structural example of a water leak detection apparatus.
- Example 1 it is a block diagram which shows the structural example of a sensor arrangement
- Example 1 it is a flowchart which shows an example of the process by a water leak detection apparatus.
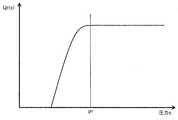
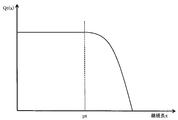
- Example 1 it is a graph which shows the relationship between the measured value of a sensor, and Qt, n (x). In Example 1, it is a graph which shows the relationship between continuation length and Qt, n (x). In Example 1, it is a graph which shows an example of the relationship between time and a water leak likelihood. In Example 1, it is explanatory drawing which shows an example of the concept of the locality of a water leak influence. In Example 1, it is a graph which shows an example of the relationship between time and a water leak likelihood. In Example 1, it is explanatory drawing which shows an example of the method by which a leak location estimation part estimates a leak location. In Example 1, it is explanatory drawing which shows typically the method of learning the transfer characteristic for a leak location estimation part to estimate a leak location.
- Example 1 it is an example of a water leak likelihood ratio database.
- Example 1 it is explanatory drawing which shows the sensor arrangement
- Example 1 it is a block diagram which shows the structural example of a model preparation part, a water leak location estimation part, and a sensor arrangement
- Example 1 it is explanatory drawing which shows the operation example of the water leak location estimation process in which the water leak location estimation part used the neural network.
- Example 1 it is a flowchart which shows an example of the process at the time of the real-time operation of water leak location estimation.
- Example 6 is a flowchart illustrating an example of a sensor arrangement optimization process in the first embodiment.
- Example 1 it is explanatory drawing which shows an example of the method by which the leak amount estimation part estimates a leak amount.
- Example 1 it is explanatory drawing which shows typically the method in which the leak amount estimation part learns the transfer characteristic for estimating a leak amount.
- Example 1 it is an example of a water leak estimated amount database.
- Example 1 it is a block diagram which shows the structural example of a model preparation part, a water leak amount estimation part, and a water leak potential estimation part.
- Example 1 it is explanatory drawing which shows the operation example of the leak amount estimation process using the leak amount estimation part neural network.
- Example 1 it is a flowchart which shows an example of the learning process for water leak amount estimation.
- Example 1 it is a flowchart which shows an example of the process at the time of leak amount estimation real-time operation.
- Example 1 it is a flowchart which shows an example of a water leak potential estimation process.
- Example 1 it is explanatory drawing which shows an example of the transition of the screen which an information terminal displays.
- an example of a real-time monitoring screen is shown.
- an example of a detection result detailed screen is shown.
- positioning screen is shown.
- an example of a report preparation screen is shown.
- an example of a report display screen is shown.
- FIG. 1 shows an example of a water distribution pipe network that is a target of water leakage detection in the water leakage detection system of the present embodiment.
- the distribution pipe network is a distribution line that is a pipe for supplying water from a distribution source to a consumer, including a water distribution station 201 that serves as a water distribution source, such as the Waterworks Bureau, and nodes that collectively represent a plurality of consumers. They are connected by a water pipe 203.
- FIG. 1 shows an example of a pipe network having these three types as elements for simplification, but the water distribution pipe network includes, for example, a valve for adjusting the direction and flow rate of the water flow and a pump for applying pressure. It may be installed.
- a sufficiently small number of sensors 204 are installed compared to the number of nodes.
- the sensor 204 may be any sensor that measures a value reflecting the flow rate of the pipe, such as a pressure gauge, a flow meter, a microphone, or a vibration sensor.
- a pressure gauge is used as an example of the sensor 204 unless otherwise specified.
- FIG. 2A shows an outline example of a water leakage detection system in the present embodiment.
- the water leakage detection system includes a network 101, a water leakage detection device 102, a sensor arrangement optimization device 120, an information terminal 109, a regional information database 111, a water leakage detection history database 112, a repair history database 114, and a sensor measurement value database 115.
- the water leakage detection device 102 detects water leakage in the distribution pipe network, estimates the location of the water leakage, estimates the amount of water leakage, and the like.
- the water leakage detection apparatus 102 receives the measurement value by the sensor 204 installed in the water distribution pipe network via the network 101.
- the sensor arrangement optimizing device 120 optimizes the number and installation locations of the sensors 204.
- the information terminal 109 presents information such as the water leak estimation result received from the water leak detection device 102, the pipe repair plan, and the optimization result received from the sensor arrangement optimization device 120 to the user. In addition, the information terminal 109 receives an input such as a repair history from the user, for example.
- the regional information database 111 holds a failure countermeasure flow manual, regional information, asset information (information relating to the pipe network, such as pipe material and laying years), and the like.
- the water leakage detection history database 112 holds information such as the date and time of occurrence of water leakage detected by the water leakage detection device 102, the estimated water leakage location, and the estimated amount of water leakage.
- the sensor measurement value database 115 holds history data of measurement values obtained by the sensor 204 received by the water leakage detection device 102 and predicted value data of sensor measurement values calculated by the water leakage detection device 102.
- the sensor measurement value database 115 holds the water leakage likelihood in each sensor 204 calculated by the water leakage detection device 102 and the predicted value of the water leakage likelihood.
- the sensor measurement value database 115 holds position information of each sensor 204.
- the water leakage detection device 102 and the sensor arrangement optimization device 120 are described as separate devices, but they may be a single device. Similarly, for example, the water leakage detection device 102 and the information terminal 109 may be one device. Each device included in the water leakage detection system may be configured by a plurality of computers. Further, the area information database 111, the area information database 111, the water leakage detection history database 112, the repair history database 114, and the sensor measurement value database 115 may be held by any device included in the water leakage detection system.
- FIG. 2B shows a configuration example of the water leakage detection device 102.
- the water leakage detection device 102 includes a CPU 150, an input / output interface 151, a memory 152, and a secondary storage device 153.
- the memory 152 includes a water leakage detection unit 103, a water leakage location estimation unit 104, a water leakage amount estimation unit 105, a water leakage potential estimation unit 106, an information integration unit 107, and a model creation unit 113.
- Each unit included in the memory 152 is a program or a program group.
- Each program is executed by the CPU 150 to perform a predetermined process using a storage device and a communication port (communication device). Therefore, in the present embodiment and other embodiments, the description with each part as the subject may be the description with the CPU 150 as the subject. Alternatively, the processing executed by each unit is processing performed by a computer and a computer system on which the program operates.
- the CPU 150 operates as a functional unit (means) that realizes a predetermined function by operating according to a program. The same applies to each unit included in the memory of the sensor arrangement optimization device 120 described later.
- the water leakage detection unit 103 detects the occurrence of water leakage in the distribution pipe network.
- the water leak location estimation unit 104 estimates the location where the water leak detected by the water leak detection unit 103 has occurred.
- the water leakage amount estimation unit 105 estimates the amount of water leakage in the water leakage detected by the water leakage detection unit 103.
- the water leakage potential estimation unit 106 further narrows down the water leakage estimation location by calculating the water leakage probability at each water leakage location estimated by the water leakage location estimation unit 104 using the estimation result by the water leakage amount estimation unit 105.
- the information integration unit 107 integrates information on water leakage estimated by each unit.
- the information integration unit 107 refers to the integrated information and the regional information database 111 and the like, and formulates an efficient repair plan.
- the model creation unit 113 performs model creation processing for water leakage detection and learning processing for water leakage location estimation, water leakage amount estimation, and water leakage potential estimation.
- the secondary storage device 153 includes a water leak likelihood ratio database 1205, a water leak location candidate database 1210, and a water leak estimated amount database 1804.
- the water leakage likelihood ratio database 1205 holds a learning result for water leakage location estimation.
- the leak location candidate database 1210 holds information on leak location candidates estimated by the leak location estimation unit 104.
- the leaked water estimated amount database 1804 holds a learning result for estimating the leaked water amount.
- FIG. 2C shows a configuration example of the sensor arrangement optimization device 120.
- the sensor arrangement optimizing device 120 includes a CPU 160, an input / output interface 161, a memory 162, and a secondary storage device 163.
- the memory 162 includes a sensor arrangement optimization unit 108.
- the sensor arrangement optimization unit 108 optimizes the number and installation locations of the sensors 204.
- the secondary storage device 163 includes an optimization condition database 1212.
- the optimization condition database 1212 holds conditions for sensor placement when the sensor input by the user or the like is optimized.
- FIG. 3 shows an example of processing by the water leakage detection device 102.
- the water leakage detection unit 103 detects the occurrence of water leakage from the measured values of each sensor 204 in a specific period (S301).
- the water leakage detection unit 103 calculates the water leakage likelihood indicating the possibility of water leakage for each sensor 204.
- the water leakage detection unit 103 determines that water leakage has occurred, for example, if the sensor 204 indicating the water leakage likelihood equal to or higher than a predetermined threshold is present.
- the water leakage location estimation unit 104 estimates the water leakage location from the likelihood of water leakage in each sensor 204, and narrows down the sections that may have the water leakage location. (S303). Subsequently, the leakage amount estimation unit 105 estimates the leakage amount from the estimated section information and the leakage likelihood of the specific sensor 204 (S305).
- the water leakage potential estimation unit 106 estimates the water leakage potential from the estimated section information, the water leakage likelihood of the specific sensor 204, and the estimation result of the water leakage amount (S305).
- the information integration unit 107 receives the information created in S301, S303, S304, and S305 and transmits it to the information terminal 109. The above process is repeatedly executed until the system stop process is performed (S306).
- FIG. 4 shows an example of a concept that the water leakage detection unit 103 calculates the water leakage likelihood.
- the pressure in the water distribution pipe fluctuates under the influence of the demand by the customer and the amount of water leakage from the water distribution pipe.
- the demand amount is much larger than the water leakage amount (that is, the S / N ratio is low), it is difficult to detect only the influence of water leakage.
- the water leakage detection system of the present embodiment grasps the influence of water leakage by paying attention to the three types of feature amounts calculated from the measurement values by the sensor 204, and performs water leakage detection.
- the feature amount is a value reflecting the measurement value by the sensor 204 and fluctuation.
- the model creation unit 113 statistically models each feature amount for each sensor, and integrates the evaluation results using the created model, so that the leak likelihood is highly accurate for each sensor. To calculate.
- the first feature value reflects the periodicity of water demand. Since the demand amount changes periodically according to the lifestyle pattern of the consumer, the measured value by the sensor 204 has periodicity when there is no water leakage. When water leakage occurs, the amount of water outflow increases more than usual, so that the periodicity of the measured values by the sensor 204 is lost. Therefore, the water leakage detection unit 103 can detect water leakage based on the disruption of the periodicity.
- the model creation unit 113 models the pressure distribution during normal times (that is, when no water leakage occurs) for each time, and numerically expresses the pressure value deviation from the normal time. For example, the model creation unit 113 calculates a probability distribution 401 of measurement values obtained by the same sensor 204 at each time, and models a demand component that is a portion affected by demand among the feature amount. In the present embodiment, for example, it is assumed that the occurrence probability P t (x) of the pressure value x measured by the sensor 204 at time t follows a Gaussian distribution. That is, the model creation unit 113 performs modeling processing according to the following equation 1 using the measurement values held in the sensor measurement value database 115.
- ⁇ t, n is the average of the measured values of the sensor 204 with the sensor number n at time t
- ⁇ t, n is the standard deviation of the measured value of the sensor 204 with the sensor number n at time t.
- the sensor number is an example of a sensor identifier that identifies a sensor. Therefore, the model is expressed using the average and standard deviation of the measurement values for each sensor 204 and each time.
- the leak detection unit 103 substitutes the determination target measurement value held in the sensor measurement value database 115 into P t, n (x) during the leak detection real time operation, and leaks the likelihood L of the sensor 204 with the sensor number n. Calculate 1n .
- the water leakage detection unit 103 calculates L 1n by the following formula 2. Larger L 1n indicates that there is a larger amount of effluent water from the time of modeling, and the risk of water leakage increases.
- Q t, n (x) is the probability P t of the measurement values x, n a (x), a value obtained by converting the index indicating the likelihood of water leakage, the leakage as P t, n (x) is small It is likely to exist. Since the pressure value decreases when water leaks, the measured value x follows the probability of occurrence P t, n (x) if the measured value x is smaller than the average at the time of modeling. Is small, it is always set to a large value (P t, n ( ⁇ t, n ) which is the maximum value of P t, n (x)). As a result, the relationship between the measured value x and the function Q t, n (x) is as shown in FIG.
- the second feature value reflects the continuity of the leaked water component. If water leakage occurs, it will not stop unless repairs are performed, so the effect of water leakage will appear continuously in the measured values after the water leakage occurs. That is, when water leaks, the state in which the pressure value decreases continues.
- the model creation unit 113 creates a predicted pressure value using a normal measurement value held in the sensor measurement value database 115.
- the model creation unit 113 calculates the length of a period in which the difference obtained by subtracting the pressure measurement value at the time of water leakage detection processing from the predicted value is positive for each sensor and each time. In other words, the model creation unit 113 calculates the length of time during which a phenomenon in which the amount of effluent water is larger than normal occurs continuously for each sensor 204 and each time.
- the model creation unit 113 performs a modeling process using Equation 1.
- ⁇ t, n is the average of the duration of the time when the predicted value exceeds the measured value in the sensor 204 of the sensor number n at time t
- ⁇ t, n is the duration of the sensor 204 of the sensor number n at time t.
- the model creation unit 113 can construct a highly accurate model that suppresses the influence of sudden demand fluctuations by calculating a probability distribution based on the duration.
- the water leak likelihood L 2n of the sensor 204 with the sensor number n is expressed by the following formula 3.
- the relationship between the continuation length x and the function Q t, n (x) in this case is as shown in FIG.
- the model creating unit 113 is used for modeling the pressure value that is the first feature amount. It is easy to use the average ⁇ t, n of the measured values as the predicted value.
- the model creation unit 113 uses a regression curve calculated using past measurement values held in the sensor measurement value database 115 or a prediction filter such as a Kalman filter, a more precise prediction value can be obtained.
- the third feature amount is a value that reflects the correlation between the sensors 204.
- the influence of water leakage on the pressure value in the water distribution pipe propagates with decreasing influence as the distance from the water leakage place increases. Therefore, the correlation between the measurement values obtained by the sensors 204 installed at different locations is different between the normal time and the time of water leakage. Therefore, for example, the model creation unit 113 calculates the pressure ratio between the sensors 204 for each sensor 204 and each time.
- the pressure ratio in a certain sensor 204 represents, for example, the ratio of the pressure value in the sensor 204 to the sum of the pressure values in all the sensors 204.
- Equation 1 the model creation unit 113 performs modeling using Equation 1 in the same manner as other feature amounts.
- ⁇ t, n is the average of the pressure ratios of the sensor 204 with the sensor number n at time t
- ⁇ t, n is the standard deviation of the pressure ratio of the sensor 204 with the sensor number n at time t.
- the water leakage likelihood L 3n is expressed by the following equation 4 or 5.
- the feature amount representing the correlation between the sensors 204 is not limited to the pressure ratio described above, and may be a product-moment correlation coefficient or a rank correlation coefficient between the sensors 204, for example.
- FIG. 7A shows an example of the relationship between time and leak likelihood.
- the water leakage detection unit 103 detects water leakage from the disruption of the periodicity of the measurement value. Therefore, in this case, the leakage likelihood L 1 calculated by the leakage detection unit 103 can be a large value not only when the leakage occurs but also during a period when the water demand increases, for example, in a tray or New Year.
- the water leak detection part 103 can prevent that the increase in water demand is regarded as water leak, and can improve the precision of water leak detection.
- the water leakage detection unit 103 may calculate L n in any way, but for example, can calculate it with a product or weighted sum of each water leakage likelihood shown in the following Equation 6. At this time, for example, the water leakage detection unit 103 may calculate L n after performing processing such as normalization, smoothing, and noise removal on L 1n to L 3n , respectively.
- w 1 , w 2 , and w 3 represent weights for L 1n , L 2n , and L 3n , respectively.
- the water leakage detection unit 103 determines that water leakage has occurred if the maximum value of L n is greater than a predetermined threshold with respect to the water leakage likelihood L n calculated for each sensor 204.
- the water leakage detection device 102 independently calculates the probability distribution at each time, but prepares an N-dimensional vector having measured values at a plurality of times (N points) as an element, and calculates the N-dimensional Gaussian distribution.
- the probability P t, n (x) may be calculated.
- the water leak detection apparatus 102 can perform probability calculation in consideration of the correlation between times, and can improve the accuracy of water leak detection.
- the probability distribution of the measurement values may follow a distribution other than the Gaussian distribution, and any distribution such as a Poisson distribution, a Laplace distribution, a chi-square distribution, a logistic distribution, or the like may be assumed.
- the water leak detection apparatus 102 may fit each distribution with respect to a measured value, and may automatically determine which distribution a measured value follows.
- the model creation unit 113 creates a model with a modeling period of one day for each sensor and each time.
- the modeling period is, for example, one week, one month, and one year. Also good.
- the model preparation part 113 produces a model for every factor which changes water demands, such as a day of the week, a season, weather, and temperature, water leak detection accuracy will improve further.
- the model creation unit 113 updates the old model from time to time using newly measured data, it is not necessary to prepare a large amount of modeling data in advance, thereby reducing the burden at the time of introducing the water leakage detection system. it can. In addition, since the number of models can be reduced, the amount of memory can be greatly reduced. Furthermore, since the model creation unit 113 always creates a model using new data, the water leak detection accuracy by the water leak detection unit 103 can be improved.
- the model creation unit 113 calculates parameters ⁇ t, n and ⁇ t, n in advance using measurement values held in the sensor measurement value database 115. However, it is preferable to dynamically update at the time of water leak detection real-time operation. This is because the model creation unit 113 dynamically updates the above-described parameters, thereby enabling modeling that reflects changes in the lifestyles of consumers accompanying seasonal changes and the like.
- the model creating unit 113 dynamically updates the above parameters, the parameters ⁇ t, n and ⁇ t, n are respectively calculated as a weighted average and a weighted standard deviation. Modeling that reflects changes in the day of the week is possible. In this case, for example, when the number of days from the target day is closer, the model creation unit 113 increases the weight, and when the target day and the day of the week are the same, the model creation unit 113 may significantly reflect the seasonal change and the day of the week change. it can.
- the model creation unit 113 statistically models three types of feature quantities and calculates the water leakage likelihood, but the modeling method is not particularly limited.
- the model creation unit 113 may perform a method of performing subspace conversion such as principal component analysis (PCA) on three types of feature values, and quantifying the change to calculate the leakage probability.
- PCA principal component analysis
- the water leakage detection device 102 of the present embodiment can further improve the detection accuracy by providing an assumption that “water leakage does not occur simultaneously at a plurality of locations”. That is, when the number of leaks occurring at the same time is one location, it is possible to use the locality of the leak effect indicating that the installation location of the sensor that increases the likelihood of leak is limited to the vicinity of the leak location.
- FIG. 7B shows an example of the concept of locality of water leakage effect.
- the influence 2802 of water leakage propagates while gradually weakening around the water leakage place 2801.
- the likelihood of water leakage exceeding the threshold value is calculated from the measured value of the sensor 204 existing in the water leakage influence range 2803, which is a range where the water leakage effect 2802 is not negligibly small.
- the water leakage detection unit 103 can calculate the water leakage likelihood L 4n for quantifying the “leakage likelihood” by paying attention to the locality of the water leakage.
- the water leakage likelihood L 4n is expressed as, for example, the following Expression 7.
- x is in the vicinity of the sensor 204 with the sensor number n.
- the leak likelihood L m is predetermined. The number of objects that are greater than or equal to the threshold value.
- the model creation unit 113 calculates the distance between the sensors 204 from the sensor position information held in the sensor measurement value database 115.
- x may be the number of all the sensors 204 (sensor number m) whose water leakage likelihood L m is equal to or greater than a threshold value.
- P t, n (x) is the occurrence probability of x in the sensor 204 of the sensor number n at time t.
- another calculation example of the water leak likelihood L 4n focusing on the locality of the water leak effect includes the following equation (8).
- x is the number of the sensors 204 (sensor number m) in the vicinity of the sensor 204 with the sensor number n, and the leakage likelihood L m is greater than or equal to the threshold, and y is far from the sensor 204 with the sensor number n.
- the magnitude of the water leakage likelihood L m of each sensor is used as an index, but the water leakage likelihood L 1m to L 3m of each sensor and the measurement of each sensor are used. Any value such as a value may be used.
- the locality of the water leak influence range is utilized, a modeling method will not ask
- the water leak detection unit 103 calculates L n2 using, for example, the following Equation 9. .
- w 4 and w 5 in Equation 9 represent weights for L n and L 4n , respectively.
- FIG. 7C shows an example of the relationship between time and water leakage likelihood when water leakage likelihood L 4n is introduced. Since the locality of the water leakage effect is taken into consideration, the water leakage likelihood L 4n shows a low value in a basin or a New Year where the flow rate increases everywhere. As a result, the outflow of water during the Bon Festival and the New Year is considered to have a low “leakage likelihood”, and thus the value of the leakage likelihood L n2 reflecting the leakage probability L 4n is also low. Therefore, by introducing the water leak likelihood L 4n , the water leak detection unit 103 increases the water leak detection accuracy and can detect a small amount of water leak.
- the water leakage detection device 102 of the present embodiment realizes a highly accurate model with a small amount of calculation in modeling processing for water leakage detection. Furthermore, the water leakage detection unit 103 of the present embodiment calculates the water leakage likelihood based on the sensor value that is constantly measured, and further detects the water leakage quickly because the calculation amount for calculating the water leakage likelihood is also small. Can do.
- the water leakage detection device 102 of the present embodiment does not need to perform pipe network calculation in the modeling process and the water leakage detection process for water leakage detection. Therefore, in the modeling process and the water leakage detection process for detecting water leakage, it is not necessary to prepare facilities and data for creating a pipe network graph, and the burden on investment and labor can be reduced.
- FIG. 8 shows an example of a method by which the leak location estimation unit 104 estimates the leak location.
- the leak location estimation part 104 can investigate the influence of leak on the several sensor 204, and can narrow down a leak location by those relationship.
- the model creation unit 113 learns the relationship between the water leakage likelihood sensor-to-sensor ratio and the water leakage location in advance based on a simulation result by pipe network calculation.
- the water leak location estimation unit 104 can estimate the water leak location by applying the water leak likelihood calculated from the measured value at the time of the water leak location estimation process to the model created by the learning.
- the leak likelihood described here is not necessarily limited to that calculated by the above-described method, but may be any index as long as it is a numerical value that can be used to quantify the possibility that leaks exist for each sensor. .
- FIG. 9 schematically shows a method in which the leak location estimation unit 104 learns transfer characteristics for estimating the leak location in the present embodiment.
- the model creation unit 113 calculates the measurement value (theoretical value) of each sensor 204 when water leakage occurs at a key point in the pipe network by pipe network calculation, and calculates the water leakage likelihood using the theoretical value. . Subsequently, the model creating unit 113 calculates a ratio between the respective leak likelihoods (leak likelihood ratio), and learns by making a pair of the leak occurrence location and the calculated leak likelihood ratio.
- the ratio of each sensor 204 in the leakage likelihood ratio between the sensors 204 is referred to as a leakage likelihood ratio.
- the water leak location estimation unit 104 calculates the water leak likelihood ratio using the measurement values (actual measurement values) of the sensors 204 held in the sensor measurement value database 115.
- the leakage location estimation unit 104 compares the leakage likelihood ratio in the learning result with the leakage likelihood ratio calculated using the actual measurement value, and similar to the learning result, the location corresponding to the leakage likelihood ratio. Is the estimated location of water leakage.
- the leak location estimation unit 104 calculates, for example, the square error sum SSD shown in the following formula 10, and determines that these are similar if they are equal to or less than a threshold value. do it.
- NLSA 1n is the leakage probability ratio in the learned sensor n
- NLSA 2n is the leakage likelihood ratio in the sensor n calculated using the measured values.
- the sensor arrangement optimization unit 108 can also optimize the sensor arrangement at the time of learning or before learning of the water leakage likelihood ratio. That is, the sensor arrangement optimization unit 108 can determine the optimality of the sensor arrangement and the number from the water leak likelihood ratio calculated by the pipe network calculation.
- FIG. 10 shows an example of the water leak likelihood ratio database 1205.
- the leakage probability ratio database 1205 stores, for example, the correspondence between the coordinate values on the pipe network graph and the leakage likelihood ratio.
- the water leakage likelihood ratio database 1205 may be in any format, but if it is in a table format as shown in FIG. 10, a high-speed and stable result can be obtained.
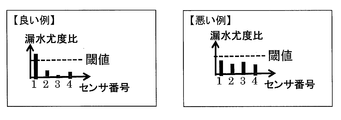
- FIG. 11 shows a guideline for optimality of sensor arrangement and number.
- a sensor arrangement in which the water leakage likelihood ratio of a small number of sensors 204 is larger than a threshold value is preferable.
- the sensor 204 in which the water leakage likelihood ratio is larger than the threshold value is referred to as a peak sensor 204.
- a peak sensor 204 This is because when there is a water leak at the location, there is at least one sensor 204 that reacts strongly, so that the water leak can be detected, and it is not a redundant sensor arrangement in which many sensors 204 react simultaneously. . That is, such a sensor arrangement is in a state where water leakage detection performance and sensor cost are balanced.
- the sensor cost refers to the cost and human labor required for installing the sensor 204.
- a “good example” in FIG. 11 is an example of the leakage likelihood ratio in such a sensor arrangement, and shows a state where the influence of the leakage is propagated only to a small number of sensors 204.
- a sensor arrangement in which there is no peak sensor 204 or a large number of peak sensors 204 is not preferable.
- the fact that there is no peak sensor 204 means that there is no sensor that reacts strongly even if water leaks at that location, so it is not possible to detect water leaks, or that all sensors are reacting strongly. It is because it shows. Also, the fact that there are a large number of sensors 204 that are peaks is because a plurality of sensors 204 react simultaneously, indicating that the sensor arrangement is redundant.
- the sensor arrangement optimizing unit 108 can improve the balance between the water leakage detection performance and the sensor cost by changing the arrangement of the sensor 204 in such cases.
- a “bad example” in FIG. 11 is an example of a water leak likelihood ratio in such a sensor arrangement, and shows a state in which the influence of water leak propagates to a large number of sensors 204.
- the sensor arrangement optimizing unit 108 installs the number of sensors 204 and the sensors 204 so that the leak likelihood ratio by the pipe network calculation has a distribution of “good example” in FIG. 11 at all locations in the pipe network. Decide where to go. In this embodiment, the sensor arrangement optimization unit 108 optimizes the sensor arrangement based on the leakage probability ratio, but the sensor arrangement is optimized by the same method based on the leakage probability. You may go. Since the learning result by the model creation unit 113 depends on the sensor placement, it is preferable that the sensor placement optimization unit 108 completes the optimization before the learning process by the model creation unit 113 is started.
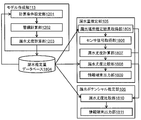
- FIG. 12 shows a configuration example of the model creation unit 113, the leak location estimation unit 104, and the sensor arrangement optimization unit 108 in the present embodiment.
- the model creation unit 113 performs a learning process for estimating a leak location.
- the model creation unit 113 includes a calculation condition setting unit 1201, a pipe network calculation unit 1202, a water leak likelihood calculation unit 1203, and a water leak likelihood ratio calculation unit 1204.
- the calculation condition setting unit 1201 sets calculation conditions in the learning process. For example, the calculation condition setting unit 1201 determines when and where water leakage occurs on the pipe network.
- the pipe network calculation unit 1202 executes pipe network calculation according to the conditions set by the calculation condition setting unit 1201.
- the water leak likelihood calculation unit 1203 calculates the water leak likelihood of each sensor 204 from the calculation result by the pipe network calculation unit 1202.
- the water leak likelihood ratio calculation unit 1204 calculates the water leak likelihood ratio between the sensors 204.
- the water leak likelihood ratio database 1205 stores the relationship between the water leak location and the water leak likelihood ratio. This relationship represents the transfer characteristics of the water leakage phenomenon.
- the leak location candidate database 1210 stores information on leak location candidates.
- the leak location estimation unit 104 performs a leak location estimation process.
- the water leak location estimation unit 104 includes a sensor signal acquisition unit 1206, a water leak likelihood calculation unit 1207, a water leak likelihood ratio calculation unit 1208, a water leak likelihood ratio comparison unit 1209, and an information terminal output unit 1211.
- the sensor signal acquisition unit 1206 acquires the measurement value of each sensor 204.
- the water leak likelihood calculation unit 1207 calculates the water leak likelihood based on the measurement value of each sensor 204.
- the water leak likelihood ratio calculation unit 1208 calculates the water leak likelihood ratio between the sensors 204.
- the water leakage likelihood ratio comparison unit 1209 searches the water leakage likelihood ratio database 1205 for a water leakage likelihood ratio similar to the water leakage likelihood ratio calculated by the water leakage likelihood ratio calculation unit 1208.
- the water leak likelihood ratio comparison unit 1209 determines the coordinates corresponding to the similar water leak likelihood on the water leak likelihood ratio database 1205 as the water leak location candidates.
- the leak location candidate database 1210 stores the leak location candidates.
- the information terminal output unit 1211 outputs the registered leak location candidate to the information integration unit 107.
- the sensor placement optimization unit 108 performs sensor placement optimization processing.
- the sensor arrangement optimization unit 108 includes a water leak likelihood analysis unit 1213 and a sensor installation location adjustment unit 1214.
- the water leak likelihood analysis unit 1213 determines whether or not the water leak likelihood ratio is optimal based on the optimization condition database 1212 input by the user or the like.
- the sensor installation location adjustment unit 1214 adjusts the installation location of the sensor based on the analysis result.
- the leakage likelihood ratio database 1205 performs the learning process by storing the relationship between the leakage location and the leakage likelihood ratio in the table format shown in FIG. Is not particularly limited.
- the amount of data used for leak location estimation can be reduced by performing learning processing using a learning model with high discrimination ability such as multi-class support vector machines and deep learning which is an example of a neural network. .
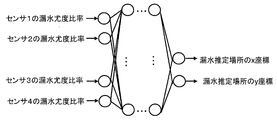
- FIG. 13 shows an operation example of the water leak location estimation process using the neural network by the water leak location estimation unit 104.
- the water leak likelihood ratio comparison unit 1209 inputs the water leak likelihood ratio in each sensor 204 calculated by the water leak likelihood ratio calculation unit 1208 to the discriminator, the water leak likelihood ratio comparison unit 1209 obtains the coordinates (or center coordinates) of the water leak estimation location.
- the water leakage likelihood ratio database 1205 only needs to store the weight between nodes as a learning result, so that the amount of data can be greatly reduced compared to the table format storing the water leakage likelihood ratio for each coordinate. .
- FIG. 14A shows an example of a learning process for estimating a leak location.
- the pipe network calculation unit 1202 performs pipe network calculation on the assumption that water leakage has occurred at one point in the monitoring target area, and calculates the theoretical value of the measured value in each sensor (S1401). Subsequently, the water leakage likelihood ratio calculation unit 1204 calculates a theoretical water leakage likelihood ratio, which is a water leakage likelihood ratio between the sensors 204 calculated from the theoretical value (S1402). The water leakage likelihood ratio calculation unit 1204 learns the theoretical water leakage likelihood ratio paired with the water leakage place, and stores the learning result in the water leakage likelihood ratio database 1205 (S1403).
- step S1401 When the processes of S1401 to S1403 are performed for all points in the monitoring target area and all the dates and times to be learned (S1404: YES), the learning process for estimating the leak location ends. If there is a time and a time when the processing of steps S1401 to S1403 is not performed (S1404: NO), the process proceeds to step S1401.
- the water leakage likelihood ratio calculation unit 1204 calculates a plurality of water leakage likelihood ratios for a specific water leakage point.
- the water leakage likelihood ratio calculation unit 1204 may perform the learning process using, for example, an average value or a median value of the plurality of calculated water leakage likelihood ratios. Further, the water leakage likelihood ratio calculation unit 1204 may statistically model the distribution of the calculated plurality of water leakage likelihood ratios.
- FIG. 14B shows an example of processing at the time of water leak location estimation real-time operation.
- the sensor signal acquisition unit 1206 first acquires the measurement value of each sensor 204, and the water leakage likelihood calculation unit 1207 calculates the water leakage likelihood in each sensor 204 from the acquired measurement value.
- the water leak likelihood ratio calculation unit 1208 calculates the water leak likelihood ratio from the calculated water leak likelihood of each sensor 204 (S1405).
- the water leakage likelihood ratio comparison unit 1209 compares the calculated water leakage likelihood ratio with each water leakage likelihood ratio included in the water leakage likelihood ratio database 1205 using, for example, an SSD.
- the leakage probability ratio comparison unit 1209 specifies corresponding coordinates in the leakage probability ratio database 1205.
- the water leakage likelihood ratio comparison unit 1209 determines each identified coordinate as a candidate for a water leakage estimation location.
- the leak location candidate database 1210 stores the estimated leak location (S1406).
- the water leakage likelihood ratio comparison unit 1209 may determine that the area around the identified coordinates, for example, the inside of a circle having a predetermined radius centered on each coordinate, is a water leakage location candidate. Then, when all candidate locations have been identified, the information terminal output unit 1211 outputs the candidate locations to the information terminal 109 (S1407).
- the water leakage detection apparatus 102 performs water leakage location estimation based on sensor values that are constantly measured, and furthermore, since the amount of calculation for water leakage location estimation is small, the water leakage location can be estimated quickly. Moreover, since the water leak detection apparatus 102 can also use the calculation result at the time of a water leak detection process for water leak location estimation, in this case, the calculation amount can be reduced further. Moreover, the water leakage detection apparatus 102 of a present Example performs a learning process by pipe network calculation based on the water leakage likelihood which is the feature-value which is hard to be influenced by a demand fluctuation, and estimates a water leakage place using the above-mentioned water leakage likelihood. Therefore, it is possible to estimate the location of water leakage with high accuracy and stability.
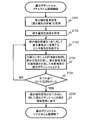
- FIG. 14C shows an example of the sensor placement optimization process.
- the water leakage likelihood analysis unit 1213 determines the number of sensors 204 and the initial value of the installation location (1408).
- the water leak likelihood analysis unit 1213 substitutes 0 for each of the variable plus and the variable minus (S1409).
- the water leak likelihood analysis unit 1213 calculates the theoretical water leak likelihood ratio between the sensors 204 by pipe network calculation, assuming that water leaks at one point in the monitoring target area (S1410).
- the sensor installation location adjustment unit 1214 has the highest water leakage likelihood ratio in the theoretical water leakage likelihood ratio, for example, the highest water leakage likelihood ratio.
- One sensor 204 is moved so as to approach the leak point.
- the water leak likelihood analysis unit 1213 adds 1 to the variable plus (S1412).
- the process proceeds to step S1413.
- the sensor installation location adjustment unit 1214 When the number of sensors 204 equal to or greater than a predetermined threshold has a peak (1413: YES), the sensor installation location adjustment unit 1214 has a leakage probability ratio among some of the sensors 204 that have peaks, for example, the sensors 204 that have peaks. All the sensors 204 that are less than the threshold value are moved away from the water leakage place. The water leak likelihood analysis unit 1213 adds 1 to the variable minus (S1414). When the number of sensors 204 less than the predetermined threshold reaches a peak (1413: NO), the process proceeds to step S1415. Note that the optimization condition database 1212 holds the above-described threshold value, rules for moving the sensor, and the like.
- step S1410 to step S1414 is repeated a predetermined number of times for all points within the monitoring target (S1415). If the process is completed a predetermined number of times for all points (S1415: YES) and the water leakage likelihood analysis unit 1213 determines that both the variables plus and minus are 0, that is, for all the water leakage occurrence locations, If the water leakage likelihood ratio between the sensors is optimal (S1416: YES), the sensor installation location adjustment unit 1214 ends the optimization process.
- the sensor installation location adjustment unit 1214 determines whether to adjust the number of sensors (S1417). ). If the water leak likelihood analysis unit 1213 determines that the variable plus is extremely larger than the variable minus, for example, the difference obtained by subtracting the variable minus from the variable plus is greater than a predetermined threshold, the sensor 204 for detecting water leak Indicates that there are not enough numbers. Therefore, the sensor installation location adjustment unit 1214 adds the sensor 204.
- the sensor installation location adjustment unit 1214 reduces the number of sensors 204.
- the process proceeds to step S1409.
- the method of adjusting the sensor location by the sensor installation location adjustment unit 1214 is not particularly limited, and any method can be used as long as the leakage ratio or leakage likelihood distribution based on the pipe network calculation result is used as an index. It does n’t matter.
- FIG. 15 shows an example of a method by which the leakage amount estimation unit 105 estimates the leakage amount.
- the leak amount estimation unit 105 estimates the leak amount by utilizing the property that the influence of the leak on the sensor 204 installed at a specific location depends on the leak location and the leak amount.
- the model creation unit 113 learns the relationship between the water leakage likelihood of each sensor 204, the water leakage location, and the water leakage amount in advance based on the simulation result by pipe network calculation.
- the leakage amount estimation unit 105 can estimate the leakage amount by applying the leakage likelihood calculated from the measured value and the estimation result of the leakage location to the learning model during the leakage amount estimation real-time operation.
- the likelihood of water leakage is not necessarily limited to that calculated by the above-described method, and may be any index as long as the possibility of water leakage existing for each sensor 204 can be quantified.
- FIG. 16 schematically shows a method in which the leakage amount estimation unit 105 in the present embodiment learns transfer characteristics for estimating the leakage amount.
- the model creation unit 113 calculates the theoretical value of the measured value of each sensor 204 when water leakage occurs at a plurality of water leakage amounts at each important point in the pipe network, and uses the theoretical value. Calculate the likelihood of leakage.
- the model creation unit 113 models the sensor number that maximizes the water leakage likelihood and the distribution of the water leakage likelihood for each amount of water leakage. For example, the leakage amount estimation unit 105 assumes that the distribution of leakage likelihood calculated for a specific sensor 204 follows a different Gaussian distribution for each location and each leakage amount, and the leakage likelihood for each location and each leakage amount. Model the degree distribution.
- FIG. 17 shows an example of the estimated water leakage amount database 1804.
- the estimated water leak amount database 1804 stores, for example, coordinates on the pipe network graph, sensor numbers used for evaluation, and average value and variance value of the leak likelihood for each leak amount. Note that the estimated leak amount database 1804 in FIG. 17 stores an average value and a variance value of the leak likelihood for each leak amount in order to specify a Gaussian distribution that the leak likelihood for each leak amount follows.
- the estimated leak quantity database 1804 may store the standard deviation of the leak likelihood for each leak quantity instead of the variance value of the leak likelihood for each leak quantity. Further, when it is assumed that the distribution of leakage likelihood calculated for a specific sensor 204 follows a distribution other than the Gaussian distribution, the leakage estimated amount database 1804 stores the average value and variance value of the leakage likelihood for each leakage amount. Instead, the information specifying the distribution is stored according to the amount of water leakage.
- model creation unit 113 does not have to perform learning by pipe network calculation. At this time, the model creation unit 113 may perform learning by storing the past water leakage accident history in the water leakage estimated amount database 1804, for example.
- the water leakage estimated amount database 1804 may be in any format, but if it is in a table format as shown in FIG. 10, a high-speed and stable result can be obtained.
- the leakage amount estimation unit 105 acquires the measurement value of the sensor 204 corresponding to the estimated leakage location obtained by the leakage location estimation process during the leakage amount estimation real-time operation.
- the water leakage amount estimation unit 105 calculates the probability of water leakage likelihood in the sensor 204 for each water leakage amount using the probability distribution for each water leakage amount in the water leakage estimation amount database 1804 as a learning result, and the value having the highest probability is calculated.
- the amount of water leakage indicating is the estimated amount of water leakage.
- the leakage amount estimation unit 105 evaluates the leakage amount using the measurement value of one sensor 204, but the measurement values of a plurality of sensors 204 may be used. Moreover, although the model preparation part 113 has modeled the value of the likelihood of water leakage according to the amount of water leaks, the method will not be ask
- FIG. 18 shows a configuration example of the model creation unit 113, the leakage amount estimation unit 105, and the leakage potential estimation unit 106 in the present embodiment.
- the model creation unit 113 performs a learning process for estimating the amount of water leakage. Since the leakage likelihood ratio calculation unit 1204 is not used for the learning process of the leakage amount estimation, the description is omitted in FIG.
- the calculation condition setting unit 1201 sets when, where, and how much water leakage occurs on the pipe network.
- the pipe network calculation unit 1202 executes pipe network calculation according to the conditions set by the calculation condition setting unit 1201.
- the water leak likelihood calculation unit 1203 calculates the water leak likelihood in each sensor 204 and models the distribution of the water leak likelihood for each water leak amount.
- the estimated water leak amount database 1804 stores the relationship between the number of the sensor 204 that has measured the highest water leak likelihood, the leak location, and the modeling result. This relationship represents the transfer characteristics of the water leakage phenomenon.
- the leakage amount estimation unit 105 performs a leakage amount estimation process.
- the water leakage amount estimation unit 105 includes a water leakage location estimation result acquisition unit 1805, a sensor signal acquisition unit 1806, a water leakage likelihood calculation unit 1807, a water leakage likelihood comparison unit 1808, and an information terminal output unit 1809.
- the leak location estimation result acquisition unit 1805 acquires the estimated leak location (area) from the estimated leak database 1804.
- the sensor signal acquisition unit 1806 acquires the measurement value of the sensor 204 used at the acquired estimated water leak location (all locations in the area).
- the water leak likelihood calculation unit 1807 calculates the water leak likelihood in the sensor 204.
- the leakage probability comparison unit 1808 refers to the leakage estimated amount database 1804 modeled for each leakage amount, and calculates the probability of each leakage amount at a point existing in the estimated place (region). For example, the leakage likelihood comparison unit 1808 calculates the sum L l of leakage likelihoods for each leakage amount l (Equation 11), identifies the l that gives the maximum value, and uses the identified l as the estimated result of the leakage amount.
- Equation 12 Let l p (Equation 12).
- C is a water leak estimation region, and x s is a measured value of the sensor 204 corresponding to the location s.
- the water leak likelihood comparison unit 1808 is not limited to the sum L l of the water leak likelihoods for each water leak amount l shown in Equation 11, but for example, an average value or median value of the water leak likelihood for each water leak amount l Alternatively, the amount of water leakage may be estimated using another value representing the likelihood of water leakage for each amount of water leakage l.
- the information terminal output unit 1809 outputs the estimation result to the information terminal 109 to present it to the user.
- the water leak estimation unit 105 can determine the water leak estimation value so that the water leak potential estimation unit 106 can narrow down the water leak estimation locations. That is, when the estimated value of the water leakage amount is determined, the water leakage potential estimation unit 106 can calculate the probability value in detail using the distribution model of the water leakage likelihood for each location, and the larger the probability value, the more likely the water leakage location. It can be judged.
- the probability value calculated for each place is called a water leakage potential.
- the water leakage potential estimation unit 106 includes a water leakage likelihood comparison unit 1810 that calculates the water leakage potential for all water leakage estimation locations from the water leakage estimation location and the water leakage estimation amount, an information terminal output unit 1811 that outputs the water leakage potential on the information terminal, including.
- the water leak likelihood comparing unit 1810 calculates the value LP S of the water leak potential at the location s using Equation 13.
- the estimated water leakage amount database 1804 performs the learning process by storing the relationship between the leakage location and the leakage likelihood ratio in the table format shown in FIG. Is not particularly limited.
- the amount of data used for leak location estimation can be reduced by performing learning processing using a learning model with high discrimination ability such as multi-class support vector machines and deep learning which is an example of a neural network. .
- FIG. 19 shows an operation example of the water leakage amount estimation process by the water leakage amount estimation unit 105 using a neural network.
- the leakage likelihood comparison unit 1808 obtains the probability of the leakage amount at the estimated leakage location.
- the estimated amount of water leakage database 1804 may store the weight between nodes as a learning result, so the amount of data is compared with the table format storing the sensor number for each coordinate and the probability distribution for each amount of water leakage. It can be greatly reduced.
- FIG. 20A shows an example of a learning process for estimating the amount of leaked water.
- the pipe network calculation unit 1202 performs pipe network calculation assuming that a specified amount of water leaks at one point in the monitoring target area (S2001). Subsequently, the water leakage likelihood calculation unit 1203 calculates the water leakage likelihood of each sensor 204 (S2002). And the water leak likelihood calculation part 1203 specifies the sensor 204 with the highest calculated water leak likelihood, and memorize
- the leakage likelihood calculation unit 1203 temporarily stores them.
- a probability distribution model of water leakage likelihood for each amount of water leakage is generated using the value of water leakage likelihood (S2006).
- the water leakage likelihood calculation unit 1203 learns by combining the generated probability distribution model of the water leakage likelihood, the target sensor number, and the water leakage estimation location, and stores the learning result in the water leakage estimation amount database 1804 (S2007). . If the above process is performed for all points in the monitoring target area (S2008: YES), the learning process is terminated.
- FIG. 20B shows an example of processing at the time of real-time operation of water leakage estimation.
- the leakage location estimation result acquisition unit 1805 acquires the estimation result of the leakage location from the estimated leakage amount database 1804 (S2009).
- the leak location estimation result acquisition unit acquires a sensor number corresponding to one of the acquired leak location estimation results from the leak rate database 1804 (S2010).
- the sensor signal acquisition unit 1806 acquires a measurement value by the sensor 204.
- the water leak likelihood calculation unit 1807 calculates the water leak likelihood in the sensor 204 for each water leak amount.
- the leakage probability comparison unit 1808 refers to the estimated leakage amount database 1804, calculates the probability value of the leakage likelihood for each leakage amount at the estimated leakage location, and temporarily stores the probability value (S2011).
- the water leak likelihood comparison unit 1808 uses the probability value temporarily stored to calculate the likelihood for each water leak amount. The sum is calculated, and the amount of water leakage indicating the largest value of the likelihood sum is set as the water leakage estimation amount.
- the information terminal output unit 1811 outputs the estimated leak amount to the information terminal 109, and the information terminal 109 displays the estimated leak amount (S2013).
- the water leakage detection device 102 estimates the amount of water leakage based on the sensor value that is constantly measured, and further has a small amount of calculation for estimating the amount of water leakage, so that the amount of water leakage can be estimated quickly. Moreover, since the water leak detection apparatus 102 can also use the calculation result at the time of a water leak detection process and the time of a water leak location estimation process for the amount of water leaks, in this case, the calculation amount can be further reduced. Further, the water leakage detection device 102 of the present embodiment performs learning processing by pipe network calculation based on the water leakage likelihood, which is a feature amount that is not easily affected by demand fluctuations, and performs water leakage estimation using the above water leakage likelihood. Therefore, the amount of water leakage can be estimated with high accuracy and stability.
- model creation unit 113 does not have to perform learning by pipe network calculation. At this time, the model creation unit 113 may perform learning by storing the past water leakage accident history in the water leakage estimated amount database 1804, for example.
- FIG. 21 shows an example of the leakage potential estimation process.
- the water leak likelihood comparison unit 1810 acquires the water leak location estimation result (S2101). Furthermore, the water leak likelihood comparison unit 1810 acquires the water leak amount estimation result corresponding to the water leak location (S2102). Subsequently, the water leak likelihood comparing unit 1810 refers to the water leak estimated amount database 1804 for one point of the water leak location candidate, acquires a corresponding sensor number, and uses the measured value by the target sensor 204 to leak water. Calculate the likelihood.
- the water leakage likelihood comparing unit 1810 refers to the water leakage estimated amount database 1804, calculates the probability value of the water leakage likelihood using the probability distribution model corresponding to the water leakage estimated amount acquired by the target sensor 204, and calculates the probability.
- the value is the leakage potential value at the target location. (S2104).
- the terminal output unit 1811 outputs the value of the water leakage potential to the information terminal 109, and the information terminal 109 outputs the water leakage potential. Displays the value of.
- the water leak likelihood comparing unit 1810 performs the processes of steps S2101 to S2104 on the water leak estimated place.
- the water leakage detection method in the water supply system has been described.
- the method is a system that distributes energy using a network-shaped medium such as other water leakage in a pipe network that handles water, such as sewerage, and gas leakage or electric leakage. It can be applied to anomaly detection.
- the sensor 204 may be any sensor that can measure the energy value, such as a pressure gauge, a flow meter, a microphone, a vibration system, a voltage system, and a current system.
- the pipe network calculation in the present embodiment is replaced with a physical calculation used for numerical simulation in each field.
- the calculation result by the said physical calculation is a theoretical value which the sensor 204 measures.
- FIG. 22 shows an example of screen transitions displayed by the information terminal 109.
- the user looks at the real-time monitoring screen 2201 and monitors the measured value of each sensor 204 and the possibility of water leakage (that is, the likelihood of water leakage).
- the water leakage detection unit 103 for example, by pressing a “detail” button for a specific detection result, a transition to the detection result detail screen 2202 is made according to a user instruction.
- the detection result detail screen 2202 displays, for example, the estimated leak location and the estimated leak amount.
- the sensor transition screen 2203 is displayed by pressing a “sensor layout optimization” button, for example, according to a user instruction.
- the user interactively optimizes the arrangement of the sensor 204 by an operation on the sensor arrangement screen 2203.
- the repair response is completed for the detected water leak
- the user creates and submits an accident response report on the report creation screen 2204.
- the user can view the reported accident response report on the report display screen 2205 for the leaked water that has been repaired.
- FIG. 23 shows an example of the real-time monitoring screen 2201.
- the real-time monitoring screen 2201 displays the measured value 2302 and the predicted value of each sensor 204 together with the evaluation value of water leakage detection in synchronization with time.
- the evaluation value of water leak detection is, for example, the maximum value of the water leak likelihood calculated for each sensor 204.
- the water leakage detection device 102 determines that the water leakage has been detected, estimates the water leakage location and the water leakage amount, and adds the summary information to the water leakage detection result list item 2304. .
- the real-time monitoring screen 2201 displays a precise predicted value calculated using a prediction filter such as a regression curve or a Kalman filter calculated using past measurement values.
- FIG. 24 shows an example of the detection result detail screen 2202.
- the detection result detail screen 2202 displays detailed information on a specific water leak detection result selected by the user.
- the detection result detail screen 2202 includes an entire map 2401 that displays the map to be monitored and the entire network information.
- the entire map 2401 displays a water leak likelihood 2402 calculated when water leak occurs at a place where the sensor 204 is installed. For example, when the color of the display area of the water leakage likelihood 2402 changes according to the height of the water leakage likelihood 2402, the user can easily grasp the water leakage situation intuitively.
- the whole map 2401 graphically displays a water leak estimation area 2403 estimated from the water leak likelihood.
- the detection result detail screen 2202 includes a water leakage potential display 2404 of the water leakage estimation area 2403.
- the water leakage potential display 2404 can intuitively tell the user where to start the investigation in the estimated area by changing the color according to the magnitude of the value of the water leakage potential.
- the detection result detail screen 2202 includes a water leakage amount display 2405 for displaying the water leakage amount.
- the leakage amount display 2405 displays the leakage amount graphically, for example, so that the user can easily grasp the approximate leakage amount.
- the information integration unit 107 creates information for creating an efficient repair plan based on the information described above, and transmits the information to the information terminal 109.
- the information terminal 109 outputs the information to the detection result detail screen 2202 and presents it to the user.
- the detection result detail screen 2202 displays a countermeasure 2406 based on, for example, the trouble countermeasure flow manual and GIS held in the area information database 111, and the water leakage detection history database 112 and the repair history database 114.
- the countermeasure 2406 includes, for example, a coping method based on geographic information and a coping method based on work history, in addition to a specific coping method, necessary number of people, and assumed repair time.
- the coping method of “preferentially surveying along the national road because there is a national road near the estimated leakage location and there is a lot of traffic and the water distribution pipe is likely to deteriorate” is also an example of a coping method based on geographical information.
- the detection result detail screen 2202 shows, for example, whether there is a water-use facility such as a pool, or a facility that uses a large amount of water irregularly that may cause a false detection of leakage detection such as a fire hydrant.
- the area information 2407 including the information is displayed.
- the area information 2407 is created by the information integration unit 107 based on information in the area information database 111, for example.
- the facility may also be displayed on the entire map 2401. By displaying the facility on the entire map 2401, the user obtains a clue to determine the reliability of the leakage detection result. Since the amount of water used increases during an event such as a festival or on a holiday, the water leakage detection device 102 may make an erroneous determination. Event information 2410, which is information including a reason that can cause the erroneous determination and a place related to the reason, is displayed on the entire map 2401.
- the detection result detail screen 2202 displays the asset information 2408 created by the information integration unit 107 referring to the asset information included in the regional information database 111, and also on the entire map 2401 displaying the asset information 2408. Display the relevant part.
- the asset information 2408 includes contents such as preferentially investigating an old water pipe or a low-strength water pipe.
- the information integration unit 107 determines the priority 2411 corresponding to the target water leakage by integrating the above information.
- the information terminal 109 receives the determined priority order 2411 and displays it on the detection result detail screen 2202.
- the information integration unit 107 outputs, to the information terminal 109, the area information 2407, the asset information 2409, and the like of the estimated water leak location estimated by the leak location estimating unit 104.
- the detection result detail screen 2202 displays these pieces of information, it becomes easier for the user to identify the cause of the water leakage detection and thus to consider a countermeasure.
- FIG. 25 shows an example of the sensor arrangement screen 2203.
- the user wants to optimize the arrangement of the sensors 204, for example, when the water leak is generated in the parameter setting 2501, for example, the initial value or maximum value of the number of sensors, the threshold value of the water leakage likelihood ratio, or the region to be monitored.
- the range of the number of sensors in which the likelihood ratio of leaked water is equal to or greater than a threshold is input.
- the optimization result of the sensor arrangement within the set parameter range is displayed on the entire map 2506.
- the leak detection detectable water distribution pipe 2502 that allows the water leak detection unit 103 to detect water leak and the water leak detection impossible water distribution pipe 2503 that cannot detect water leak can be visually distinguished by the user. Is displayed.
- the water leak detection possible water distribution pipe 2502 is indicated by a solid line
- the water leak detection impossible water distribution pipe 2503 is indicated by a dotted line.
- a water leakage likelihood ratio 2505 when water leakage occurs in the water distribution pipe is displayed on the overall map 2506. That is, the user can interactively exchange information with the information terminal 109.
- FIG. 26 shows an example of a report creation screen 2604.
- the report creation screen 2604 includes a response result 2601, a place 2602 where water has actually leaked, and a report 2603.
- the user inputs necessary items in the report creation screen 2604 and presses the “Submit” button.
- FIG. 27 shows an example of a report display screen 2605.
- the report display screen 2605 displays the report submitted by the responder on the report creation screen 2604 for water leakage that has already been repaired.
- this invention is not limited to the above-mentioned Example, Various modifications are included.
- the above-described embodiments are described in detail for easy understanding of the present invention, and are not necessarily limited to those having all the configurations described.
- a part of the configuration of one embodiment can be replaced with the configuration of another embodiment, and the configuration of another embodiment can be added to the configuration of one embodiment.
- each of the above-described configurations, functions, processing units, processing means, and the like may be realized by hardware by designing a part or all of them with, for example, an integrated circuit.
- Each of the above-described configurations, functions, and the like may be realized by software by interpreting and executing a program that realizes each function by the processor.
- Information such as programs, tables, and files that realize each function can be stored in a memory, a hard disk, a recording device such as an SSD (Solid State Drive), or a recording medium such as an IC card, an SD card, or a DVD.
Landscapes
- Physics & Mathematics (AREA)
- General Physics & Mathematics (AREA)
- Health & Medical Sciences (AREA)
- Life Sciences & Earth Sciences (AREA)
- Engineering & Computer Science (AREA)
- Hydrology & Water Resources (AREA)
- Public Health (AREA)
- Water Supply & Treatment (AREA)
- Examining Or Testing Airtightness (AREA)
Abstract
L'invention concerne un système de détection de fuite d'eau qui comprend un processeur et un dispositif de stockage et qui détecte des fuites d'eau dans des conduites. Le dispositif de stockage stocke une base de données de mesure de capteur qui contient des données d'historique de mesure, pour un premier capteur qui obtient des valeurs qui reflètent le débit à l'intérieur d'une conduite. À partir de ladite base de données de mesure de capteur, le processeur sélectionne des mesures dans une première période. Le processeur utilise lesdites mesures pour calculer une distribution de probabilité pour une variable prescrite, sélectionne une mesure de critère de détermination dans la base de données de mesure de capteur, utilise ladite mesure de critère de détermination pour calculer une valeur pour la variable susmentionnée, utilise ladite valeur conjointement avec la distribution de probabilité susmentionnée pour calculer une probabilité de fuite d'eau, et utilise ladite probabilité de fuite d'eau pour déterminer si une nouvelle fuite d'eau s'est produite dans la conduite susmentionnée.
Priority Applications (1)
| Application Number | Priority Date | Filing Date | Title |
|---|---|---|---|
| PCT/JP2014/055098 WO2015129031A1 (fr) | 2014-02-28 | 2014-02-28 | Système et procédé de détection de fuite d'eau |
Applications Claiming Priority (1)
| Application Number | Priority Date | Filing Date | Title |
|---|---|---|---|
| PCT/JP2014/055098 WO2015129031A1 (fr) | 2014-02-28 | 2014-02-28 | Système et procédé de détection de fuite d'eau |
Publications (1)
| Publication Number | Publication Date |
|---|---|
| WO2015129031A1 true WO2015129031A1 (fr) | 2015-09-03 |
Family
ID=54008396
Family Applications (1)
| Application Number | Title | Priority Date | Filing Date |
|---|---|---|---|
| PCT/JP2014/055098 Ceased WO2015129031A1 (fr) | 2014-02-28 | 2014-02-28 | Système et procédé de détection de fuite d'eau |
Country Status (1)
| Country | Link |
|---|---|
| WO (1) | WO2015129031A1 (fr) |
Cited By (16)
| Publication number | Priority date | Publication date | Assignee | Title |
|---|---|---|---|---|
| JP2017156818A (ja) * | 2016-02-29 | 2017-09-07 | 株式会社日立製作所 | 異常検知装置、異常検知システムおよびその方法 |
| JP2017180598A (ja) * | 2016-03-29 | 2017-10-05 | 公立大学法人首都大学東京 | センサ配置方法およびセンサ配置プログラム |
| GB2553833A (en) * | 2016-09-16 | 2018-03-21 | Univ Cape Town | Pipe condition assessment device and system |
| WO2018164102A1 (fr) * | 2017-03-10 | 2018-09-13 | 日本電気株式会社 | Dispositif de sortie de coût de diagnostic, procédé de sortie de coût de diagnostic, et support d'enregistrement lisible par ordinateur |
| JP2019100729A (ja) * | 2017-11-29 | 2019-06-24 | 日本電気株式会社 | 情報提示システム、情報提示方法およびプログラムに関する |
| JP2019144182A (ja) * | 2018-02-23 | 2019-08-29 | 株式会社日立製作所 | 水圧計配置支援システムおよび方法 |
| JP2020016527A (ja) * | 2018-07-25 | 2020-01-30 | コニカミノルタ株式会社 | 定置式ガス検知装置の設置箇所の調査方法 |
| WO2020035694A1 (fr) * | 2018-08-16 | 2020-02-20 | Centrica Plc | Détection d'un écoulement de fluide |
| JP2021519433A (ja) * | 2018-03-28 | 2021-08-10 | フラクタFracta | 配管損傷予測 |
| US20220163958A1 (en) * | 2021-02-04 | 2022-05-26 | Chengdu Qinchuan Iot Technology Co., Ltd. | Methods and systems for managing a pipe network of natural gas |
| JP2022090864A (ja) * | 2020-12-08 | 2022-06-20 | 株式会社東芝 | データ処理装置、データ処理方法、及びプログラム |
| CN116467551A (zh) * | 2023-06-20 | 2023-07-21 | 成都同飞科技有限责任公司 | 一种基于相关系数的供水管网漏损定位方法及系统 |
| JP7396602B1 (ja) | 2023-04-28 | 2023-12-12 | フジ地中情報株式会社 | Ai管路劣化予測システム、ai管路劣化予測方法及びai管路劣化予測プログラム |
| EP4150310A4 (fr) * | 2020-05-15 | 2024-06-12 | Phyn LLC | Traitement d'écoulement de liquide pour systèmes de plomberie |
| CN118670448A (zh) * | 2024-06-05 | 2024-09-20 | 成都建工第三建筑工程有限公司 | 一种地下室逆作法施工安全监测系统 |
| WO2025069458A1 (fr) * | 2023-09-26 | 2025-04-03 | 株式会社日立製作所 | Système d'estimation du débit d'une fuite d'eau et procédé d'estimation du débit d'une fuite d'eau |
Citations (3)
| Publication number | Priority date | Publication date | Assignee | Title |
|---|---|---|---|---|
| JPS56162029A (en) * | 1980-05-19 | 1981-12-12 | Hitachi Ltd | Water leakage detecting method |
| JP3344742B2 (ja) * | 1991-11-06 | 2002-11-18 | シエル・インターナシヨナル・リサーチ・マートスハツペイ・ベー・ヴエー | 管からの流体漏れを検出する方法及び装置 |
| JP4612696B2 (ja) * | 2008-02-13 | 2011-01-12 | 株式会社東芝 | 配水管路の漏水診断装置及び漏水診断方法 |
-
2014
- 2014-02-28 WO PCT/JP2014/055098 patent/WO2015129031A1/fr not_active Ceased
Patent Citations (3)
| Publication number | Priority date | Publication date | Assignee | Title |
|---|---|---|---|---|
| JPS56162029A (en) * | 1980-05-19 | 1981-12-12 | Hitachi Ltd | Water leakage detecting method |
| JP3344742B2 (ja) * | 1991-11-06 | 2002-11-18 | シエル・インターナシヨナル・リサーチ・マートスハツペイ・ベー・ヴエー | 管からの流体漏れを検出する方法及び装置 |
| JP4612696B2 (ja) * | 2008-02-13 | 2011-01-12 | 株式会社東芝 | 配水管路の漏水診断装置及び漏水診断方法 |
Cited By (29)
| Publication number | Priority date | Publication date | Assignee | Title |
|---|---|---|---|---|
| JP2017156818A (ja) * | 2016-02-29 | 2017-09-07 | 株式会社日立製作所 | 異常検知装置、異常検知システムおよびその方法 |
| JP2017180598A (ja) * | 2016-03-29 | 2017-10-05 | 公立大学法人首都大学東京 | センサ配置方法およびセンサ配置プログラム |
| GB2553833A (en) * | 2016-09-16 | 2018-03-21 | Univ Cape Town | Pipe condition assessment device and system |
| GB2553833B (en) * | 2016-09-16 | 2019-10-23 | Univ Cape Town | Pipe condition assessment device and system |
| WO2018164102A1 (fr) * | 2017-03-10 | 2018-09-13 | 日本電気株式会社 | Dispositif de sortie de coût de diagnostic, procédé de sortie de coût de diagnostic, et support d'enregistrement lisible par ordinateur |
| JPWO2018164102A1 (ja) * | 2017-03-10 | 2020-01-09 | 日本電気株式会社 | 診断コスト出力装置、診断コスト出力方法及びコンピュータ読み取り可能記録媒体 |
| JP2019100729A (ja) * | 2017-11-29 | 2019-06-24 | 日本電気株式会社 | 情報提示システム、情報提示方法およびプログラムに関する |
| JP2019144182A (ja) * | 2018-02-23 | 2019-08-29 | 株式会社日立製作所 | 水圧計配置支援システムおよび方法 |
| JP2021519433A (ja) * | 2018-03-28 | 2021-08-10 | フラクタFracta | 配管損傷予測 |
| US12223396B2 (en) | 2018-03-28 | 2025-02-11 | Fracta | Processing data for predicting pipe failure |
| JP7585041B2 (ja) | 2018-03-28 | 2024-11-18 | フラクタ | 配管損傷予測 |
| JP2020016527A (ja) * | 2018-07-25 | 2020-01-30 | コニカミノルタ株式会社 | 定置式ガス検知装置の設置箇所の調査方法 |
| WO2020035694A1 (fr) * | 2018-08-16 | 2020-02-20 | Centrica Plc | Détection d'un écoulement de fluide |
| GB2576501A (en) * | 2018-08-16 | 2020-02-26 | Centrica Plc | Sensing fluid flow |
| GB2576501B (en) * | 2018-08-16 | 2021-03-10 | Centrica Plc | Sensing fluid flow |
| EP4150310A4 (fr) * | 2020-05-15 | 2024-06-12 | Phyn LLC | Traitement d'écoulement de liquide pour systèmes de plomberie |
| US12595643B2 (en) | 2020-05-15 | 2026-04-07 | Phyn Llc | Liquid flow processing for plumbing systems |
| JP2022090864A (ja) * | 2020-12-08 | 2022-06-20 | 株式会社東芝 | データ処理装置、データ処理方法、及びプログラム |
| JP7451387B2 (ja) | 2020-12-08 | 2024-03-18 | 株式会社東芝 | データ処理装置、データ処理方法、及びプログラム |
| US11822325B2 (en) * | 2021-02-04 | 2023-11-21 | Chengdu Qinchuan Iot Technology Co., Ltd. | Methods and systems for managing a pipe network of natural gas |
| US20220163958A1 (en) * | 2021-02-04 | 2022-05-26 | Chengdu Qinchuan Iot Technology Co., Ltd. | Methods and systems for managing a pipe network of natural gas |
| JP7396602B1 (ja) | 2023-04-28 | 2023-12-12 | フジ地中情報株式会社 | Ai管路劣化予測システム、ai管路劣化予測方法及びai管路劣化予測プログラム |
| JP2024159031A (ja) * | 2023-04-28 | 2024-11-08 | フジ地中情報株式会社 | Ai管路劣化予測システム、ai管路劣化予測方法及びai管路劣化予測プログラム |
| CN116467551B (zh) * | 2023-06-20 | 2023-08-25 | 成都同飞科技有限责任公司 | 一种基于相关系数的供水管网漏损定位方法及系统 |
| CN116467551A (zh) * | 2023-06-20 | 2023-07-21 | 成都同飞科技有限责任公司 | 一种基于相关系数的供水管网漏损定位方法及系统 |
| WO2025069458A1 (fr) * | 2023-09-26 | 2025-04-03 | 株式会社日立製作所 | Système d'estimation du débit d'une fuite d'eau et procédé d'estimation du débit d'une fuite d'eau |
| JP2025053897A (ja) * | 2023-09-26 | 2025-04-07 | 株式会社日立製作所 | 漏水流量推定システム、及び漏水流量推定方法 |
| JP7817974B2 (ja) | 2023-09-26 | 2026-02-19 | 株式会社日立製作所 | 漏水流量推定システム、及び漏水流量推定方法 |
| CN118670448A (zh) * | 2024-06-05 | 2024-09-20 | 成都建工第三建筑工程有限公司 | 一种地下室逆作法施工安全监测系统 |
Similar Documents
| Publication | Publication Date | Title |
|---|---|---|
| WO2015129031A1 (fr) | Système et procédé de détection de fuite d'eau | |
| US9053519B2 (en) | System and method for analyzing GIS data to improve operation and monitoring of water distribution networks | |
| EP2472467B1 (fr) | Système et procédé pour surveiller des ressources dans un réseau de services d'eau | |
| Wu et al. | Water loss detection via genetic algorithm optimization-based model calibration | |
| US7359931B2 (en) | System to facilitate pipeline management, software, and related methods | |
| KR101283828B1 (ko) | 상수관망 진단 시스템 | |
| WO2015063931A1 (fr) | Détecteur de fuite d'eau, système de détection de fuite d'eau et procédé de détection de fuite d'eau | |
| Marzola et al. | Leakage detection and localization in a water distribution network through comparison of observed and simulated pressure data | |
| JP2014510261A (ja) | 水道施設ネットワークで異常の可能性がある地理的場所を識別するためのシステム及び方法 | |
| JP2024058780A (ja) | 予測装置、予測方法およびコンピュータプログラム | |
| López et al. | Methodology to optimally place pressure sensors for leak detection in water distribution systems using value of information | |
| CN120256976A (zh) | 一种基于液体泄漏检测的数据处理方法及系统 | |
| CN119309566A (zh) | 一种基于资源整合的高精度地图测试方法及系统 | |
| KR100893424B1 (ko) | 상수도관망 노후도 성능평가 및 정비개량계획수립 시스템과그 방법 | |
| Kutyłowska | Application of MARSplines method for failure rate prediction | |
| US11372399B2 (en) | System section data management device and method thereof | |
| JP7103374B2 (ja) | 資産管理装置、資産管理方法およびプログラム | |
| Ferreira et al. | Leak detection and location in a real water distribution network using a model-based technique | |
| JP5503361B2 (ja) | 導管網の故障原因予測システム | |
| Nemeth | A Comparison of Risk Assessment Models for Pipe Replacement and Rehabilitation in a Water Distribution System | |
| JP7531246B1 (ja) | 資産価値算出システム、資産価値算出方法及び資産価値算出プログラム | |
| CN116932933B (zh) | 一种服务网点搜索推荐方法、装置及存储介质 | |
| JP7545509B1 (ja) | 劣化評価装置、劣化評価方法及びプログラム | |
| Kim et al. | Multi-Leakage Detection Using Graph Attention Networks and Restoration Prioritization in Water Distribution Systems | |
| JP2026050275A (ja) | 管路維持管理情報システム |
Legal Events
| Date | Code | Title | Description |
|---|---|---|---|
| 121 | Ep: the epo has been informed by wipo that ep was designated in this application |
Ref document number: 14884169 Country of ref document: EP Kind code of ref document: A1 |
|
| NENP | Non-entry into the national phase |
Ref country code: DE |
|
| 122 | Ep: pct application non-entry in european phase |
Ref document number: 14884169 Country of ref document: EP Kind code of ref document: A1 |
|
| NENP | Non-entry into the national phase |
Ref country code: JP |