WO2016006101A1 - Dispositif de simulation et procédé de simulation - Google Patents
Dispositif de simulation et procédé de simulation Download PDFInfo
- Publication number
- WO2016006101A1 WO2016006101A1 PCT/JP2014/068584 JP2014068584W WO2016006101A1 WO 2016006101 A1 WO2016006101 A1 WO 2016006101A1 JP 2014068584 W JP2014068584 W JP 2014068584W WO 2016006101 A1 WO2016006101 A1 WO 2016006101A1
- Authority
- WO
- WIPO (PCT)
- Prior art keywords
- simulation
- value
- parameter
- evaluation
- values
- Prior art date
- Legal status (The legal status is an assumption and is not a legal conclusion. Google has not performed a legal analysis and makes no representation as to the accuracy of the status listed.)
- Ceased
Links
Images




Classifications
-
- G—PHYSICS
- G06—COMPUTING OR CALCULATING; COUNTING
- G06F—ELECTRIC DIGITAL DATA PROCESSING
- G06F30/00—Computer-aided design [CAD]
- G06F30/20—Design optimisation, verification or simulation
-
- G—PHYSICS
- G06—COMPUTING OR CALCULATING; COUNTING
- G06F—ELECTRIC DIGITAL DATA PROCESSING
- G06F17/00—Digital computing or data processing equipment or methods, specially adapted for specific functions
- G06F17/10—Complex mathematical operations
- G06F17/11—Complex mathematical operations for solving equations, e.g. nonlinear equations, general mathematical optimization problems
-
- G—PHYSICS
- G06—COMPUTING OR CALCULATING; COUNTING
- G06F—ELECTRIC DIGITAL DATA PROCESSING
- G06F17/00—Digital computing or data processing equipment or methods, specially adapted for specific functions
- G06F17/10—Complex mathematical operations
- G06F17/18—Complex mathematical operations for evaluating statistical data, e.g. average values, frequency distributions, probability functions, regression analysis
-
- G—PHYSICS
- G06—COMPUTING OR CALCULATING; COUNTING
- G06F—ELECTRIC DIGITAL DATA PROCESSING
- G06F2111/00—Details relating to CAD techniques
- G06F2111/10—Numerical modelling
-
- G—PHYSICS
- G16—INFORMATION AND COMMUNICATION TECHNOLOGY [ICT] SPECIALLY ADAPTED FOR SPECIFIC APPLICATION FIELDS
- G16H—HEALTHCARE INFORMATICS, i.e. INFORMATION AND COMMUNICATION TECHNOLOGY [ICT] SPECIALLY ADAPTED FOR THE HANDLING OR PROCESSING OF MEDICAL OR HEALTHCARE DATA
- G16H50/00—ICT specially adapted for medical diagnosis, medical simulation or medical data mining; ICT specially adapted for detecting, monitoring or modelling epidemics or pandemics
- G16H50/50—ICT specially adapted for medical diagnosis, medical simulation or medical data mining; ICT specially adapted for detecting, monitoring or modelling epidemics or pandemics for simulation or modelling of medical disorders
Definitions
- the present invention relates to a simulation system.
- Computer simulations are widely used to simulate system behavior. In order to execute the simulation, it is common to convert the behavior of the system into a mathematical model and fine-tune the operation of the model using parameters. When the simulation is actually executed, the simulation is executed a plurality of times while changing the initial value and the parameter, and the result is often compared or statistically processed.
- the simulation background art described above is a technique for improving the accuracy of the simulation based on actual results, and does not support the user's positive additional analysis of the simulation results.
- the present invention has been made in view of the above-described problems, and an object of the present invention is to provide a simulation method that supports an efficient additional simulation analysis by a user when a remarkable phenomenon occurs in the simulation.
- the present invention is a simulation system that performs simulation using a plurality of parameters, including a processor and a memory, wherein the memory includes a first parameter including a plurality of values, and a plurality of parameters. Holding a first evaluation function for performing a simulation by calculating an evaluation value using at least one second parameter including a value of: a plurality of values of the first parameter; Information for specifying a plurality of values of the second parameter is received, and a plurality of values of the first parameter are obtained using the plurality of values of the second parameter and the first evaluation function. A first simulation is executed by calculating a plurality of corresponding evaluation values, and a plurality of evaluations calculated by the first simulation are calculated.
- the second simulation is executed by calculating the evaluation value of the plurality of values calculated by the second simulation so as to be continuous with the evaluation value of the acquired result group corresponding to the acquired start value.
- a simulation system is provided that outputs data for displaying an evaluation value.
- the user can support efficient additional simulation analysis.
- FIG. 1 is a functional block diagram illustrating a simulation system according to a first embodiment.
- 2 is a block diagram illustrating a hardware configuration of a host processing device and a terminal device according to the first embodiment.
- 3 is a flowchart illustrating processing of the simulation system according to the first embodiment.
- FIG. 6 is an explanatory diagram illustrating initial setting information according to the first embodiment.
- FIG. 6 is an explanatory diagram showing a time-series graph displaying a plurality of evaluation values of the first simulation of Example 1. It is explanatory drawing which shows the reset information of Example 1.
- FIG. It is a flowchart which shows the 2nd simulation of Example 1, and the visualization process of a result. It is explanatory drawing which shows the screen output by the result presentation part of Example 1.
- FIG. 6 is an explanatory diagram illustrating initial setting information according to the first embodiment.
- FIG. 6 is an explanatory diagram showing a time-series graph displaying a plurality of evaluation values of the first simulation of Example 1. It is ex
- 10 is an explanatory diagram showing a time-series graph displaying a plurality of results of the first simulation of Example 2.
- 10 is a flowchart illustrating processing of a resetting unit according to the fifth embodiment.
- FIG. 1 is a functional block diagram illustrating a simulation system according to the first embodiment.
- the simulation system includes a host processing device 101 and a terminal device 102.
- the terminal device 102 includes a user input unit 103, an interface unit 104, and a result presentation unit 109 as functional units.
- the host processing apparatus 101 includes, as function units, an interface unit 105, an initial setting unit 106, a simulation unit 107, a visualization unit 108, a resetting unit 110, a sensitivity analysis unit 111, and a result analysis unit 112.
- the host processing apparatus 101 includes a storage unit for initial setting information 300 and reset information 310.
- the terminal device 102 is a device for accepting input by the user and outputting data to the user.
- the user in the present embodiment is a person who executes a simulation and acquires the result of the simulation.
- the administrator according to this embodiment is a person who manages or operates the simulation system.
- the user input unit 103 is a functional unit that receives parameters input by the user and a simulation start request instructed by the user.
- the result presentation unit 109 is a functional unit that outputs the result of the simulation.
- the interface unit 104 is an interface for communicating with the host processing apparatus 101.
- the host processing device 101 is a device that executes a simulation.
- the interface unit 105 is an interface for communicating with the terminal device 102.
- the initial setting unit 106 receives parameters in a simulation for verifying whether a remarkable phenomenon occurs.
- the resetting unit 110 accepts parameters in a simulation for analyzing a phenomenon that deserves attention.
- the simulation unit 107 has a function of performing a simulation using the parameters set from the initial setting unit 106 or the resetting unit 110 and a simulation method (for example, a mathematical expression) stored in advance.
- the result analysis unit 112 has a function of determining whether or not the simulation result is included in a predetermined reference range.
- the sensitivity analysis unit 111 has a function of analyzing parameters that greatly affect the simulation result.
- the visualization unit 108 has a function of generating data for presenting the result of the simulation by the simulation unit 107, the analysis result by the result analysis unit 112, and the analysis result by the sensitivity analysis unit 111 to the user.
- the initial setting information 300 holds parameter information used in a simulation for verifying whether a remarkable phenomenon occurs.
- the resetting information 310 holds parameter information used in a simulation for analyzing a phenomenon that is worthy of attention.
- the functional unit shown in FIG. 1 may be implemented by a program, or may be implemented by different physical devices.
- the plurality of functional units may be implemented in one program or one physical device, and the one functional unit may be implemented in a plurality of programs or a plurality of physical devices.
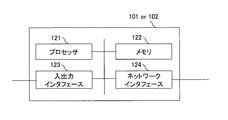
- FIG. 2 is a block diagram illustrating a hardware configuration of the host processing apparatus 101 and the terminal apparatus 102 according to the first embodiment.
- the host processing device 101 and the terminal device 102 are computers, each having a processor 121, a memory 122, and a network interface 124.
- the terminal device 102 has an input / output interface 123.
- the host processing apparatus 101 also has an input / output interface 123 when connected to an output device such as a display and a printer.
- the processor 121 is, for example, a CPU, and is an arithmetic device and a control device.
- the memory 122 is a storage device that holds data.
- the processor 121 implements the functions of the terminal device 102 and the host processing device 101 by executing a program using the memory 122.
- the network interface 124 is a network interface for transmitting and receiving data.
- the input / output interface 123 is an interface for connecting to an output device such as a display and a printer, a keyboard, a mouse, and a touch panel.
- the host processing apparatus 101 and the terminal apparatus 102 are implemented by physically different apparatuses, but may be implemented by one physical apparatus. Further, the host processing apparatus 101 and the terminal apparatus 102 may be implemented by three or more different apparatuses as long as each function can be executed.
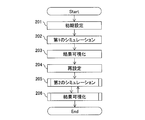
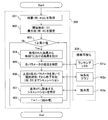
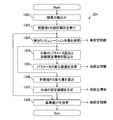
- FIG. 3 is a flowchart showing the processing of the simulation system of the first embodiment.
- the initial setting unit 106 receives initial values such as parameters used in the simulation and sets them in the host processing apparatus 101 (201). Specifically, in step 201, the user input unit 103 receives initial setting information including an initial value.
- the user input unit 103 transmits the received initial setting information to the initial setting unit 106 via the interface unit 104 and the interface unit 105. Further, in step 201, the initial setting unit 106 stores the received initial setting information as initial setting information 300 necessary for the simulation in a storage device such as the memory 122 of the host processing apparatus 101.
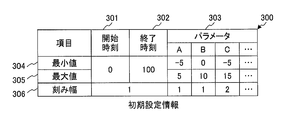
- FIG. 4 is an explanatory diagram illustrating the initial setting information 300 according to the first embodiment.
- the initial setting information 300 shown in FIG. 4 is an example.
- the initial setting information 300 includes an argument of an evaluation function used by the simulation unit 107 for simulation.
- the initial setting information 300 shown in FIG. 4 includes a start time 301, an end time 302, and a parameter 303 as items.
- the initial setting information 300 includes a minimum value 304, a maximum value 305, and a step size 306 as values of the start time 301, the end time 302, and the parameter 303.
- the start time 301 is the first time that elapses in the simulation, and is the initial time in the simulation.
- the end time 302 is the end time of the time that elapses in the simulation.
- the parameter 303 indicates the range of the argument value of the evaluation function, and indicates a plurality of values of at least one argument.
- the minimum value 304 and the maximum value 305 indicate the minimum value and the maximum value of the items of the start time 301, the end time 302, and the parameter 303, and indicate the range of values that each item can take.
- the step size 306 indicates the amount of change in the value of each item in the combination of the value of each item.
- the simulation unit 107 simulates from time 0 to time 100 for each time 1.
- the evaluation function used in the simulation is a function for calculating sales in the retail industry
- the parameters are weather, date, day of the week, and advertisement fee.
- the initial setting information 300 may include any item as long as it can hold the value of an argument used for the simulation.
- the initial setting information 300 may include a start value and an end value instead of the start time 301 and the end time 302.
- the simulation unit 107 acquires the initial setting information 300 from a storage device such as the memory 122, and generates a combination of values of the parameter 303. Then, the simulation unit 107 simulates using the start time 301, the end time 302, the generated combination, and the evaluation function stored in advance (202).
- the simulation unit 107 calculates the evaluation function using a combination generated at a plurality of times indicated by the step sizes 306 of the start time 301 and the end time 302 between the start time 301 and the end time 302. By simulating.
- the simulation executed in step 202 is hereinafter referred to as a first simulation.
- the first simulation is a simulation for verifying whether a remarkable phenomenon occurs.
- the first simulation includes at least one simulation with at least one combination of parameter values.
- the phenomenon worth noting in the first embodiment is a phenomenon in which the simulation result, that is, the evaluation value output in the simulation is different from the evaluation value expected or expected by the user.
- the user may determine that a simulation that does not output an average evaluation value at the end time 302 is a remarkable phenomenon, or a time that is not the end time 302 even if an average evaluation value is output at the end time 302.
- a simulation that outputs a unique evaluation value may be determined as a remarkable phenomenon.
- step 202 the simulation unit 107 outputs a plurality of evaluation values for each simulation. Since the simulation is performed using a plurality of combinations of the values of the parameter 303, a plurality of evaluation values of a plurality of groups are output by a plurality of simulations.
- the group generated by dividing the plurality of evaluation values output when the simulation is executed for each combination of the values of the parameter 303 used is described as a result group below.
- the simulation unit 107 connects the generated plurality of result groups and combinations of the values of the parameters 303 corresponding to the result groups to the storage device included in the host processing apparatus 101 such as the memory 122 and the host processing apparatus 101. Store in at least one of the external storage devices.
- the visualization unit 108 acquires a plurality of evaluation values of the first simulation via a storage device such as the memory 122, and an image output from the result presentation unit 109 based on the acquired plurality of evaluation values. Data is generated (203).
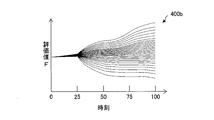
- FIG. 5 is an explanatory diagram showing a time series graph 400a displaying a plurality of evaluation values of the first simulation of the first embodiment.
- the time series graph 400a illustrated in FIG. A time-series graph 400a shown in FIG. 5 shows a plurality of result groups (result group # 10 to result group # 24) generated by the first simulation.
- step 203 the visualization unit 108 generates image data that displays the evaluation value F of one simulation executed using one combination of the parameters 303 and the evaluation function as the time series graph 400a.
- the result presentation unit 109 receives the image data from the visualization unit 108 via the interface units 105 and 104, and outputs the received image data to the user.
- the result presentation unit 109 displays a pop-up with the identifier of the result group instructed by the cursor or the value of the parameter 303 used. May be.
- the result group # 10 to the result group # 20 have a constant increasing tendency, but the result group # 21 to the result group # 24 increase remarkably after the time “25”. Further, the evaluation value F at the end time “100” of the result group # 21 to the result group # 24 is significantly different from the evaluation value F at the end time “100” of the result group # 10 to the result group # 20.
- step 203 referring to the evaluation value of the first simulation shown in FIG. 5, and the user has predicted or expected result group # 10 to result group # 20 as the evaluation value of the first simulation The user is likely to determine that a phenomenon that is worthy of attention has occurred in a part of the first simulation.
- the user input unit 103 receives reset information input from the user.
- the re-simulation for analyzing a remarkable phenomenon is referred to as a second simulation.
- the user selects a result group of the first simulation to be analyzed by the second simulation from the result group # 10 to the result group # 24 shown in FIG.
- the first simulation of the selected result group is referred to as an analysis simulation.
- the user inputs the identifier of the selected result group (that is, the identifier of the analysis simulation), the parameters used in the second simulation, and the like to the user input unit 103 as reset information.
- the user input unit 103 transmits the received reset information to the reset unit 110 via the interface units 104 and 105.
- the resetting unit 110 stores the received resetting information in the storage device such as the memory 122 as resetting information 310a necessary for the second simulation (204).
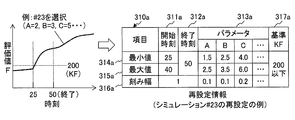
- FIG. 6 is an explanatory diagram illustrating the resetting information 310a according to the first embodiment.
- the resetting information 310a shown in FIG. 4 indicates the combination of parameter values after the change when changing the parameter values used in the analysis simulation of the result group # 23 during the analysis simulation of the result group # 23. Show.
- the user designates a combination of the values of the parameters 303 used in the simulation in which a remarkable phenomenon occurs.
- the user inputs the analysis simulation identifier (that is, the identifier of the combination of the values of the parameter 303), and the values of the start time 311a, the end time 312a, the parameter 313a, and the reference 317a shown in FIG. To do.
- a minimum value 314a, a maximum value 315a, and a step size 316a are designated as the start time 311a, end time 312a, and parameter 313a.
- the end time 312a indicates a time at which the second simulation is ended.
- the reference 317a is a predicted value or an expected value range of the evaluation value of the second simulation at the end time 312a.
- controllable simulation in the first embodiment refers to a simulation in which an evaluation value included in the range of the reference 317a is output at the end time 312a.
- the simulation whose simulation evaluation value is 200 or less is a controllable simulation.
- the simulation unit 107 when an evaluation value satisfying the standard 317a is obtained at the end time 312a, the simulation unit 107 can control the phenomenon in the simulation.
- the start time 311a is designated as a time at which the simulation can be controlled by changing the parameter value to the start time 311a. For this reason, the user may designate the time before and after the occurrence of a remarkable phenomenon as the start time 311a.
- a time between the minimum value 314a and the maximum value 315a (time between time “25” and time “40”) is designated. This indicates that the second simulation using a plurality of combinations of parameter values is started from a plurality of times between the minimum value and the maximum value.
- the parameter 313a indicates the range of the argument value of the evaluation function in the second simulation.
- the value of the parameter 313a may be set again in step 204, or may be the same as the parameter 303 set in step 201.
- the reason why the minimum value 314a and the maximum value 315a are specified as the start time of the second simulation is that the simulation unit 107 sets a start time at which the evaluation value F can be controlled by simulating a plurality of times from a plurality of start times. This is to provide information for identification.
- the range of the evaluation value F that is expected to be reached at the end time 312a when no remarkable phenomenon occurs may be designated.
- the reset information 310a may include any item as long as it can hold the value of the argument used for the simulation, like the initial setting information 300.
- the reset information 310a may include a start value and an end value instead of the start time 311a and the end time 312.
- the simulation unit 107 acquires the reset information 310a via a storage device such as the memory 122, the evaluation value F at the analysis simulation start time 311a, the evaluation function held in advance, and the reset information 310a. (205).
- the simulation in step 205 is the second simulation. Details of the second simulation are shown below.
- FIG. 7 is a flowchart showing the second simulation of Example 1 and the result visualization process.
- step 205 the simulation unit 107, based on the identifier of the analysis simulation indicated by the reset information 310a, the combination of the value of the parameter 303 of the analysis simulation and the evaluation value output in the analysis simulation are stored in the memory 122 or the like. Obtained from the storage device (601).
- the simulation unit 107 acquires the value of the maximum value 315a of the start time 311a from the reset information 310a, and sets the value of the acquired maximum value 315a as the start time T of the second simulation ( 602). Since the maximum value 315a shown in FIG. 6 is the time “40”, “40” is set as the start time T of the second simulation.
- the simulation unit 107 determines whether the start time T is greater than or equal to the minimum value 314a of the start time 311a in the reset information 310a (603). This is because the simulation unit 107 starts the second simulation from a plurality of times included between the maximum value 315a and the minimum value 314a of the start time 311a.
- the simulation unit 107 When the start time T is equal to or greater than the minimum value 314a of the start time 311a, the simulation unit 107 continues the second simulation. Then, the simulation unit 107 extracts the evaluation value F at the start time T of the analysis simulation from the evaluation values acquired in Step 601 (604).
- the simulation unit 107 executes the second simulation using a plurality of combinations of the values of the parameter 313a from the start time T in the simulation selected by the user. And the simulation part 107 is for extracting the initial value of the evaluation function in a 2nd simulation.
- the sensitivity analysis unit 111 and the simulation unit 107 analyze the sensitivity of each of the plurality of parameters by using the evaluation value extracted by the simulation unit 107 as an initial value (605).
- the sensitivity is the ratio of the change in the evaluation value of the simulation to the change in the parameter.
- the high sensitivity means that the amount by which the evaluation value of the simulation changes with respect to the change in the parameter It means big.
- the simulation unit 107 determines that one parameter whose value is slightly changed from the start time T. The simulation is performed using other parameters whose values do not change and the evaluation function.
- changing slightly means a value that is sufficiently smaller than the range of values between the minimum value 314a and the maximum value 315a of each parameter, for example, increasing it by a step size 316a.
- the administrator of the simulation system according to the first embodiment may instruct the sensitivity analysis unit 111 in advance of a method for changing parameters when analyzing sensitivity.
- the sensitivity analysis unit 111 analyzes the sensitivity by obtaining the change amount of the evaluation value F after the simulation by changing the parameter value for every parameter.
- the sensitivity analysis unit 111 holds a method of adding the value of the step size 316a ⁇ 1 to the parameter as a method for analyzing the sensitivity.
- the parameter A corresponding to the result group # 23 in the analysis simulation is 2.
- the sensitivity analysis unit 111 calculates sensitivity for the other parameters by the same process.
- the sensitivity analysis unit 111 notifies the calculated sensitivity to the visualization unit 108, and the visualization unit 108 generates image data for displaying the ranking list 401a based on the notified sensitivity (206). For example, the visualization unit 108 generates image data of a ranking list 401a that lists parameters in descending order of sensitivity.
- the visualization unit 108 transmits the image data of the ranking list 401a to the result presentation unit 109 via the interface unit 104 and the interface unit 105, and the result presentation unit 109 at the start time T based on the received image data.
- the ranking list 401a is presented to the user.
- the visualization unit 108 transfers the ranking list 401 a to the resetting unit 110.
- the subsequent processing is processing for searching conditions such as parameters for controlling the simulation.
- the resetting unit 110 extracts the top N parameters with the highest sensitivity based on the result of the ranking list 401a, and uses the extracted parameters as information necessary for the second simulation to be executed next, such as the memory 122. Stored in the storage device.
- the reason why the resetting unit 110 extracts N parameters based on the sensitivity is that if the second simulation is performed using the parameter with higher sensitivity, the condition under which the simulation can be controlled is less. This is because the amount can be efficiently obtained.
- the controllable conditions are a parameter value and a start time T value that can control the simulation.
- the resetting unit 110 does not have to perform parameter extraction based on sensitivity when it is desired to perform an accurate analysis even when the amount of calculation increases.
- the value of N is a natural number, and may be arbitrarily determined by an administrator or user in advance, such as two. Further, as a result of referring to the ranking list 401 a, the user may designate a value of N to the resetting unit 110 through the user input unit 103.
- the function unit such as the resetting unit 110 may determine the value of N depending on the result of the sensitivity analysis and the total number of parameters. For example, the functional unit such as the resetting unit 110 may determine one third of the total number of parameters as the value of N, and the number of parameters whose sensitivity analysis result is higher than the average value or the median value. It may be determined.
- the simulation unit 107 acquires the N parameters described above from a storage device such as the memory 122.
- the simulation unit 107 changes only the values of the N parameters described above, and generates a plurality of combinations in which the values of the other parameters are the same as the parameters corresponding to the analysis simulation based on the reset information 310 To do.
- the simulation unit 107 simulates a plurality of times from the start time T in the analysis simulation to the end time 312a using the generated combination and the evaluation function (606).
- the simulation executed in step 606 is the second simulation.
- the simulation unit 107 performs the second simulation from the start time T to the end time 312 using the evaluation values calculated in the analysis simulation and the generated combinations and evaluation functions. Run until.
- the simulation unit 107 may use the parameter 313 in the analysis simulation in the second simulation as necessary.
- the simulation unit 107 calculates an evaluation value in the second simulation using the initial value calculated at the start time T at the start time T as an initial value. Specifically, the simulation unit 107 uses the evaluation value used in the simulation so that the evaluation value calculated at the start time T in the second simulation becomes the same value as the evaluation value calculated at the start time T in the analysis simulation. You may convert functions.
- the simulation unit 107 can change the parameter 313 to be used and execute a plurality of simulations from the middle of the time in the analysis simulation.
- step 206 the simulation unit 107 sends the plurality of result groups output by the second simulation to the visualization unit 108 after execution of the second simulation, and the visualization unit 108 displays the plurality of result groups in the same manner as in step 203.
- the screen data of the time series graph 402a is generated.
- the visualization unit 108 generates image data of a time series graph 402a that displays a result group of the analysis simulation and a plurality of result groups in the second simulation so as to be continuous. This allows the user to compare the result of the first simulation and the result of the second simulation.
- the visualization unit 108 transmits the image data of the time series graph 402a to the result presentation unit 109 via the interface units 104 and 105.
- the result presentation unit 109 outputs the time series graph 402a at the start time T based on the transmitted image data.
- the visualization unit 108 transfers the plurality of result groups output by the second simulation to the result analysis unit 112.
- the result analysis unit 112 When a plurality of result groups are transferred from the visualization unit 108, the result analysis unit 112 identifies a result group whose evaluation value F at the end time 312a corresponds to the reference 317a from among the plurality of result groups of the second simulation. To do. Then, the result analysis unit 112 acquires a combination of parameter values used for executing the simulation of the identified result group (607).
- the result analysis unit 112 specifies a result group in which the evaluation value F at the end time 312a “50” is 200 or less set as the reference 317a from the execution results of the second simulation, and the specified result Get the combination of parameter values used to perform group simulation.
- step 607 the result analysis unit 112 notifies the visualization unit 108 of the acquired combination of parameter values.
- the result analysis unit 112 notifies the visualization unit 108 that the combination could not be acquired.
- the visualization unit 108 When the result analysis unit 112 is notified of the parameter value combination in the second simulation, the visualization unit 108 generates image data that displays the notified parameter value combination as a scatter diagram 403a (206). The visualization unit 108 transmits the image data of the scatter diagram 403a to the result presentation unit 109 via the interface units 104 and 105. The result presentation unit 109 outputs a scatter diagram 403a at the start time T to the user based on the transmitted image data.
- the result presentation unit 109 can allow the user to recognize a combination of parameter values that can control a simulation in which a remarkable phenomenon has occurred.
- the simulation unit 107 subtracts the value of the step size 316a at the start time 311a from the value of the start time T (608). Then, the simulation unit 107 executes Step 603. Accordingly, the host processing apparatus 101 repeats steps 603 to 608 until the start time T becomes smaller than the minimum value 314a of the start time 311a.
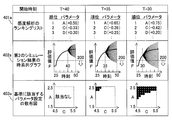
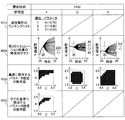
- FIG. 8 is an explanatory diagram illustrating a screen output by the result presentation unit 109 according to the first embodiment.
- the result presentation unit 109 outputs a plurality of ranking lists 401a, a plurality of time series graphs 402a, and a plurality of scatter diagrams 403a at a plurality of start times T.
- the result presentation unit 109 may output the ranking list 401a, the time series graph 402a, and the scatter diagram 403a so as to be displayed on one screen, or may display each in order.
- FIG. 8 shows a ranking list 401a, a time series graph 402a, and a scatter diagram 403a when the start time T is “40”, “35”, and “30”.
- the second simulation is executed using the reset information 310a shown in FIG. 6, since the start time T takes 16 values from 25 to 40, the ranking list 401a, the time series graph 402a, Sixteen scatter diagrams 403a are generated.
- the parameters with high sensitivity are the parameters A, C, and D at all the start times T.
- the time-series graph 402a and the scatter diagram 403a illustrated in FIG. 8 are screens generated by a simulation executed by a combination in which only the parameters A and C are changed.
- the time series graph 402a shown in FIG. 8 shows the result of the second simulation when the values of the parameters A and C are changed. Further, the scatter diagram 403a shown in FIG. 8 shows the values of the parameters A and C of the simulation that outputs the evaluation value corresponding to the reference 317a by plotting with black circles.
- the simulation unit 107 cannot output an evaluation value corresponding to the reference 317a in the second simulation. However, when the start time T is “35” and “30”, the simulation unit 107 can output an evaluation value corresponding to the reference 317a in the second simulation in some combinations of parameters.
- the user can acquire the combination of parameter values and the start time of the simulation that outputs the evaluation value corresponding to the standard 317a by referring to the screen shown in FIG.
- the user can acquire a combination of parameter values and a start time that can control the simulation so that the simulation is output to the range of the reference 317a when a remarkable phenomenon occurs.
- the user can analyze the phenomenon that is worthy of attention in more detail.
- the simulation is strongly influenced during the occurrence of the remarkable phenomenon.
- Parameters can be provided to the user as analysis results.
- time series graph 402a and the scatter diagram 403a it is possible to indicate whether or not a remarkable phenomenon can be controlled. Further, in the time series graph 402a and the scatter diagram 403a, a start time at which a remarkable phenomenon can be controlled by displaying a combination of simulation parameters for outputting an evaluation value corresponding to the reference 317a and a start time T, The parameter and the value of the parameter can be provided to the user as an analysis result.
- the simulation system of the first embodiment provides information for the user to efficiently perform additional analysis of the simulation result. Can be provided to the user.
- the parameter setting range in the simulation is determined by the minimum value, the maximum value, and the step size, but is not limited thereto.
- a random variable using an assumed average value and variance value is used. May be determined by
- the minimum value 314a of the start time T of the second simulation is set to the time “25” at which the evaluation value F changes abruptly (a remarkable phenomenon occurs). Instead, it may be determined before or after the time when a remarkable phenomenon occurs.
- the visualization unit 108 sets a parameter with high sensitivity. Alternatively, it may be extracted as a parameter that causes a remarkable phenomenon to occur. Then, the visualization unit 108 may generate image data for displaying a parameter that is a cause of occurrence of a remarkable phenomenon.
- the end time 312a of the second simulation may be any time as long as the user desires to obtain the value of the reference 317a by simulation.
- the scatter diagram 403a displays two axes of parameters A and C, but is not limited thereto, and one or more axes may be displayed.
- the user can specify a simulation parameter that outputs an evaluation value corresponding to the reference 317a from among the parameters to be changed.
- the visualization unit 108 and the result presentation unit 109 output the simulation results according to the format and the output method of the ranking list 401a, the time series graph 402a, and the scatter diagram 403a illustrated in FIG. If the simulation analysis can be performed, the output may be performed in any format and output method such as a list, a graph, and a table. Further, for example, the result presentation unit 109 may display the time series graph 402a and the scatter diagram 403a by animation according to the change of the start time T.
- the parameter step size 316a in the second simulation may be any value. However, if the step size 316a of the parameter 313a in the second simulation is smaller than the step size 306 of the parameter 303 in the first simulation, the comprehensiveness of the simulation can be improved efficiently, and further, a remarkable phenomenon. It is possible to increase the probability of discovering a phenomenon different from the above.
- time is used as one of the parameters.
- the simulation of the first embodiment may use any parameter as long as it is defined as a parameter of the evaluation function.
- the user directly selects a simulation for analyzing a remarkable phenomenon and designates the reference 317a.
- a remarkable phenomenon as shown in FIG. 5 occurs, the user can easily recognize and select the remarkable phenomenon, and can select and specify these relatively easily.
- FIG. 9 is an explanatory diagram showing a time-series graph 400b that displays a plurality of evaluation values of the first simulation of the second embodiment.
- the functional unit, storage unit, hardware configuration, and the like in the second embodiment are the same as those in the first embodiment.
- the difference between the second embodiment and the first embodiment is the content of step 203.
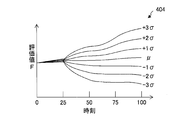
- the visualization unit 108 performs statistical processing on a plurality of simulation results in step 202. Specifically, the visualization unit 108 obtains an average ⁇ and a standard deviation ⁇ with respect to the distribution of a plurality of evaluation values at each time when a simulation result is obtained. Then, the visualization unit 108 generates image data for displaying the result of the average ⁇ and the standard deviation ⁇ as a time series graph 404 as shown in FIG.
- the visualization unit 108 displays the average ⁇ and the standard deviation ⁇ calculated at the end time 312a as the time series graph 404. May be generated. Further, image data that displays the average value of the average ⁇ and the standard deviation ⁇ calculated at a predetermined time before the end time 312a as the time series graph 404 may be generated.
- FIG. 10 is an explanatory diagram showing a time series graph 404 displaying the standard deviation of the second embodiment.
- the visualization unit 108 transmits the image data for displaying the time series graph 400b and the image data for displaying the time series graph 404 to the result presentation unit 109.
- the result presentation unit 109 overlays and displays the time series graph 400b and the time series graph 404, for example.
- the result presentation unit 109 makes the user compare the time-series graph 400b and the time-series graph 404 so as to make it easier to grasp the distribution of the result group.
- the user selects a result group closest to a predetermined standard deviation, such as 2 ⁇ or 3 ⁇ , as a notable result, or determines an evaluation value F close to the average ⁇ as a reference. can do.
- a predetermined standard deviation such as 2 ⁇ or 3 ⁇
- Example 1 and Example 2 there was one evaluation function used for the simulation, and there was one type of evaluation value F output by the simulation.
- the simulation system according to the third embodiment uses the same parameters, but performs a plurality of simulations using a plurality of evaluation functions, and changes the parameters in the middle of the simulation to generate attention in each of the plurality of simulations. Providing users with information to analyze the phenomena they deserve.
- Example 1 and Example 2 when the combination of the parameter values that control one simulation is used in the simulation of another evaluation function, the user must grasp the simulation change by the other evaluation function. I can't. Therefore, the third embodiment provides a result of simulation using a plurality of evaluation functions when analyzing a parameter condition that can control simulation of one evaluation function.
- the configuration of functional units and hardware in the third embodiment is the same as that in the first embodiment.
- the difference between the third embodiment and the first embodiment is a partial process in each of steps 204 to 206.
- the simulation unit 107 holds an evaluation function F for evaluating the sales of the store and an evaluation function G for evaluating the power consumption cost in the store.
- the evaluation function F and the evaluation function G use the same types of parameters such as the number of visitors, the weather of the day, and the temperature.
- the simulation unit 107 executes a plurality of first simulations using a plurality of evaluation functions.
- the simulation unit 107 generates a plurality of result groups in the plurality of first simulations.
- the visualization unit 108 may generate image data of a time series graph 402 for displaying a plurality of result groups of a plurality of first simulations, or one first simulation.
- the image data of the time series graph 402 for displaying a plurality of results may be generated.
- the resetting unit 110 receives the resetting information 310b including a plurality of criteria corresponding to a plurality of evaluation functions.
- the reset information 310b includes an identifier of the result selected by the user (for example, result group # 23).
- the start time 311b, end time 312b, and parameter 313b of the third embodiment are the same as the start time 311a, end time 312a, and parameter 313a of the first embodiment.
- the reference 317b of the third embodiment includes a reference KF, a reference KG, and a reference KH.
- the standard KF indicates the range of the evaluation value F predicted or expected in the simulation using the evaluation function F.
- the reference KG indicates the range of the evaluation value G that is predicted or expected in the simulation using the evaluation function G.
- the reference KH indicates the range of the evaluation value H predicted or expected in the simulation using the evaluation function H.
- step 205 the simulation unit 107 executes the second simulation using a plurality of evaluation functions. As a result, a plurality of evaluation values (evaluation value F, evaluation value G, and evaluation value H) are output.
- the simulation unit 107 is the same as the parameter selected by the user in Step 203 from among the plurality of first simulation result groups executed by the plurality of evaluation functions in Step 601 of the third embodiment.
- a result group generated using the parameters is extracted for each evaluation function.
- the simulation part 107 acquires the content of the extracted result group from memory
- step 604 of the third embodiment the simulation unit 107 extracts an evaluation value at the start time T from the result acquired in step 601.
- a plurality of evaluation functions are three evaluation functions, three results are extracted.
- the simulation unit 107 and the sensitivity analysis unit 111 analyze the sensitivity of the parameters as in the first embodiment.
- the evaluation function used here may be an evaluation function used to generate the result group selected in step 203 or another evaluation function.
- step 606 of the third embodiment the simulation unit 107 executes the second simulation by using each evaluation function by changing the combination of the top N parameter values from the start time T.
- the simulation unit 107 specifies, for each evaluation function, a result group corresponding to the criterion indicated by the criterion 317b from the second simulation result group based on the plurality of evaluation functions.
- the visualization part 108 produces
- the visualization unit 108 generates image data of the ranking list 401b, the time series graph 402b, and the scatter diagram 403b for displaying a plurality of results by a plurality of evaluation functions.
- the visualization unit 108 generates image data of the scatter diagram 405b after step 607.
- the scatter diagram 405b displays parameter combinations that have generated a result group corresponding to all the criteria indicated by the reference 317b among the combinations of the parameters 313b corresponding to the result group.
- the visualization unit 108 transmits the generated image data to the result presentation unit 109, and the result presentation unit 109 uses a ranking list 401b, a time series graph 402b, a scatter diagram 403b, and a scatter based on the transmitted image data.
- FIG. 405b is displayed.
- FIG. 12 is an explanatory diagram illustrating a screen output by the result presentation unit 109 according to the third embodiment.
- the sensitivity analysis unit 111 and the simulation unit 107 are re-generated ranking lists 401b obtained by analyzing the sensitivity using the evaluation function F.
- a time series graph 402b shown in FIG. 12 shows an evaluation value F, an evaluation value G, and an evaluation value H, which are the results of the simulation.
- a scatter diagram 403b shown in FIG. 12 shows combinations of values of the parameter 313b of the simulation that outputs the results corresponding to each of the reference KF, the reference KG, and the reference KH.
- a scatter diagram 405b shown in FIG. 12 shows simulation parameters 313b that output results corresponding to the reference KF, the reference KG, and the reference KH in all the simulations using the evaluation function F, the evaluation function G, and the evaluation function H. Indicates a combination of values.
- the screen shown in FIG. 12 is a screen when the start time T is 30.
- the start time T is 16 ways from 25 to 40, so the result presentation unit 109 may display all the screens in these 16 ways. A screen at some time may be displayed.
- the third embodiment in addition to the effects of the first and second embodiments, when the user changes the parameter, how the results of a plurality of simulations using a plurality of evaluation functions are obtained.
- the change behavior can be confirmed by the time-series graph 402b.
- the value of the parameter 313b that can output the result corresponding to the criterion 317b set for the plurality of evaluation functions can be confirmed by the scatter diagram 405b.
- the third embodiment provides a method and a system for enabling a user to efficiently analyze additional simulation results, which is the object of the present invention.
- the result presentation unit 109 displays the ranking list 401b with only the evaluation function F, but the present invention is not limited to this.
- the sensitivity analysis unit 111 and the simulation unit 107 of the third embodiment analyze the sensitivity of the parameter 313b using the evaluation functions G and H, and the result presentation unit 109 of the third embodiment ranks the results.
- the list 401b may be displayed.
- step 203 in the third embodiment as in step 203 in the second embodiment, the visualization unit 108 calculates the average ⁇ and the standard deviation ⁇ of the result of the first simulation, and the result presentation unit 109 A time series graph 404 displaying ⁇ and standard deviation ⁇ may be displayed for each of a plurality of evaluation functions.
- the parameters to be changed in the second simulation are determined by the sensitivity analysis unit 111 in the first to third embodiments analyzing the sensitivity at the start time T.
- the host processing apparatus 101 sets the start time T before the occurrence of a notable phenomenon (for example, before the time “25” shown in FIG. 6) and analyzes the sensitivity, the notable phenomenon
- the simulation unit 107 cannot correctly use an effective parameter for controlling a rapid change in the evaluation value F.
- the functional block configuration and hardware configuration in the fourth embodiment are the same as those in the first embodiment.
- the differences between the fourth embodiment and the first embodiment are the contents of the reset information 310 and part of the processing in step 204 and step 205.
- FIG. 13 is an explanatory diagram of reset information 310c according to the fourth embodiment.
- the reset information 310c includes a start time 311c, an end time 312c, a parameter 313c, and a reference 317c.
- the reset information 310c indicates the minimum value 314c, the maximum value 315c, and the step size 316c of the start time 311c, and indicates the minimum value 314c, the maximum value 315c, and the step size 316c of the parameter 313c.
- the reset information 310c of the fourth embodiment includes a sensitivity analysis time 318c.
- the sensitivity analysis time 318c indicates the start time of the simulation executed for analyzing the sensitivity in step 605.
- the time indicated by the sensitivity analysis time 318c may not coincide with the time indicated by the start time 311c.
- step 203 the user inputs the value of the sensitivity analysis time 318c to the user input unit 103.
- the user inputs a time after a remarkable phenomenon occurs as the value of the sensitivity analysis time 318c.
- the simulation analysis method of the fourth embodiment executes the simulation for sensitivity analysis from the time not related to the start time of the second simulation in addition to the effects of the first to third embodiments.
- the parameter whose value is changed in the simulation of 2 can be extracted with high accuracy. As a result, it is possible to correctly extract a parameter effective for controlling the evaluation value.
- the fourth embodiment provides a method and system for enabling the user to efficiently analyze the simulation result, which is the object of the present invention.
- the sensitivity analysis time 318c is configured to be input by the user.
- the visualization unit 108 or the result analysis unit 112 or the like
- the change amount of the value F per unit time may be calculated, and the result presentation unit 109 may display the result overlaid on the time series graph 400a.
- step 203 in the fourth embodiment as in step 203 in the second embodiment, the visualization unit 108 calculates the average ⁇ and the standard deviation ⁇ of the result of the first simulation, and the result presentation unit 109 You may display the time series graph 404 which displays (micro
- the simulation unit 107 according to the fourth embodiment may execute a plurality of first simulations using a plurality of evaluation functions, similarly to the simulation unit 107 according to the third embodiment.
- the user may input the sensitivity analysis time for one of the evaluation functions.
- the simulation system of the fifth embodiment combines the methods shown in the first, second and fourth embodiments, and the simulation system automatically determines the result of the second simulation by determining the value of the reset information 310. .
- FIG. 14 is a flowchart illustrating processing of the resetting unit 110 according to the fifth embodiment.
- step 204 of the fifth embodiment the user input unit 103 does not accept the reset information 310 from the user.
- the resetting unit 110 reads all the plurality of result groups of the first simulation in step 204 of the fifth embodiment (1301). After step 1301, the resetting unit 110 statistically processes the evaluation values F of the plurality of read result groups (1302).
- the resetting unit 110 determines a result group to be analyzed by the second simulation (that is, a combination of the simulation and the value of the parameter 303) (1303).
- the statistical processing in step 1302 may be the same as the statistical processing executed by the visualization unit 108 in the second embodiment. Specifically, the resetting unit 110 obtains an average ⁇ and a standard deviation ⁇ in step 1302 regarding the distribution of the plurality of evaluation values F at each time when the simulation result is obtained.
- step 1303 the resetting unit 110 analyzes the simulation that outputs a result group closest to a predetermined standard deviation such as 2 ⁇ or 3 ⁇ as a simulation in which a remarkable phenomenon has occurred, by the second simulation. Determine the simulation to be performed. Then, the resetting unit 110 stores the determined simulation identifier in the resetting information 310.
- the resetting unit 110 reads the combination of the parameter 303 values used in the determined simulation and the initial setting information 300 from the storage device such as the memory 122 (1304). After step 1304, the resetting unit 110 determines the range of the parameter 313 (1305).
- the resetting unit 110 determines, for example, the value of the parameter 303 in the simulation determined in step 1303 as the central value.
- the resetting unit 110 sets a predetermined coefficient A (for example, a value obtained by subtracting the minimum value 304 from the maximum value 305) in each parameter range indicated by the parameter 303 of the initial setting information 300. 1/10) to calculate the parameter range in the second simulation.
- the resetting unit 110 determines the minimum value 314 and the maximum value 315 based on the determined center value and the calculated range.
- step 1305 the resetting unit 110 obtains a result of multiplying the step size 306 of the parameter 303 by a predetermined coefficient B (for example, 1/10), so that the parameter in the second simulation is obtained.
- a step size 316 is calculated.
- the resetting unit 110 stores the range of the parameter 313 determined in step 1305 in the parameter 313 of the resetting information 310.
- the resetting unit 110 calculates the amount of change in the evaluation value F in the simulation determined in step 1303 (1306). Then, the resetting unit 110 determines a start time 311 and an end time 312 based on the analysis result (1307).
- the resetting unit 110 calculates the amount of change per unit time of the evaluation value F in the determined simulation.
- the resetting unit 110 extracts the time at which the calculated amount of change is the largest. Then, the resetting unit 110 sets the extracted time as the sensitivity analysis time 318 and sets the extracted time as the center value of the start time 311 and the end time 312.
- the resetting unit 110 multiplies the difference between the start time 301 and the end time 302 of the initial setting information 300 by a predetermined coefficient C (for example, 1/10).
- the resetting unit 110 determines the start time 311 and the end time 312 so that the value obtained thereby becomes the difference between the start time 311 and the end time 312. Further, the resetting unit 110 may set the same value as the step size 306 of the initial setting information 300 for the step size 316 of the start time 311 and the end time 312, for example.
- the resetting unit 110 determines the reference 317 (1308). Specifically, the resetting unit 110 uses the value of the average ⁇ calculated in step 1302 and the range of the standard deviation ⁇ at the same time as the end time 312 determined in step 1307, for example, and uses the standard 317. You may ask for.
- the resetting unit 110 stores the information determined in steps 1307 and 1308 in a storage device such as the memory 122 as resetting information 310. Thereby, the simulation part 107 can automatically perform a 2nd simulation after a 1st simulation, without receiving the reset information 310 input from the user.
- the user input unit 103 may accept the above-described coefficients A, B, and C from the user before or during the process shown in FIG.
- the reset information 310 can be set regardless of the input by the user. Thereby, after executing the first simulation, it is possible to provide information for quickly analyzing a phenomenon worthy of attention to the user.
- Examples 1 to 5 it is desirable that the sensitivity of the parameters used for the simulation is normalized as much as possible with respect to the evaluation value in the normal state.
- the normal state may be, for example, using the average value ⁇ shown in the second embodiment.
- the actual application of the embodiment of the present invention is not particularly limited as long as the simulation result can be presented in the time series graph 402, but interest rate simulation, chain bankruptcy simulation, evacuation guidance simulation, circuit simulation, etc. It may be.
- the present invention is not limited to the above-described embodiments, and includes various modifications.
- the above-described embodiments have been described in detail for easy understanding of the present invention, and are not necessarily limited to those having all the configurations described.
- a part of the configuration of one embodiment can be replaced with the configuration of another embodiment, and the configuration of another embodiment can be added to the configuration of one embodiment.
- control lines or information lines indicate what is considered necessary for the explanation, and not all control lines or information lines on the product are necessarily shown. In practice, it can be considered that almost all configurations are connected to each other.
Landscapes
- Engineering & Computer Science (AREA)
- Physics & Mathematics (AREA)
- General Physics & Mathematics (AREA)
- Theoretical Computer Science (AREA)
- Data Mining & Analysis (AREA)
- Mathematical Physics (AREA)
- Mathematical Optimization (AREA)
- Computational Mathematics (AREA)
- Pure & Applied Mathematics (AREA)
- Mathematical Analysis (AREA)
- General Engineering & Computer Science (AREA)
- Operations Research (AREA)
- Algebra (AREA)
- Software Systems (AREA)
- Databases & Information Systems (AREA)
- Evolutionary Computation (AREA)
- Computer Hardware Design (AREA)
- Geometry (AREA)
- Bioinformatics & Computational Biology (AREA)
- Life Sciences & Earth Sciences (AREA)
- Probability & Statistics with Applications (AREA)
- Bioinformatics & Cheminformatics (AREA)
- Evolutionary Biology (AREA)
- Management, Administration, Business Operations System, And Electronic Commerce (AREA)
- Debugging And Monitoring (AREA)
Abstract
Priority Applications (3)
| Application Number | Priority Date | Filing Date | Title |
|---|---|---|---|
| PCT/JP2014/068584 WO2016006101A1 (fr) | 2014-07-11 | 2014-07-11 | Dispositif de simulation et procédé de simulation |
| JP2016532386A JP6211194B2 (ja) | 2014-07-11 | 2014-07-11 | シミュレーションシステム、及び、シミュレーション方法 |
| US15/324,966 US10331818B2 (en) | 2014-07-11 | 2014-07-11 | Simulation system and simulation method |
Applications Claiming Priority (1)
| Application Number | Priority Date | Filing Date | Title |
|---|---|---|---|
| PCT/JP2014/068584 WO2016006101A1 (fr) | 2014-07-11 | 2014-07-11 | Dispositif de simulation et procédé de simulation |
Publications (1)
| Publication Number | Publication Date |
|---|---|
| WO2016006101A1 true WO2016006101A1 (fr) | 2016-01-14 |
Family
ID=55063772
Family Applications (1)
| Application Number | Title | Priority Date | Filing Date |
|---|---|---|---|
| PCT/JP2014/068584 Ceased WO2016006101A1 (fr) | 2014-07-11 | 2014-07-11 | Dispositif de simulation et procédé de simulation |
Country Status (3)
| Country | Link |
|---|---|
| US (1) | US10331818B2 (fr) |
| JP (1) | JP6211194B2 (fr) |
| WO (1) | WO2016006101A1 (fr) |
Cited By (1)
| Publication number | Priority date | Publication date | Assignee | Title |
|---|---|---|---|---|
| JP2020193885A (ja) * | 2019-05-29 | 2020-12-03 | 川崎重工業株式会社 | 水中物体捜索計画検討支援システムおよび水中物体捜索計画検討支援方法 |
Families Citing this family (2)
| Publication number | Priority date | Publication date | Assignee | Title |
|---|---|---|---|---|
| US10607105B1 (en) * | 2019-03-27 | 2020-03-31 | Disney Enterprises, Inc. | Perceptual data association |
| JP7225064B2 (ja) * | 2019-09-12 | 2023-02-20 | 株式会社日立ソリューションズ | シミュレーション方法およびシミュレーションプログラム |
Citations (3)
| Publication number | Priority date | Publication date | Assignee | Title |
|---|---|---|---|---|
| JPH07105177A (ja) * | 1993-09-30 | 1995-04-21 | Kawasaki Steel Corp | 信号処理方法 |
| JPH07121505A (ja) * | 1993-10-27 | 1995-05-12 | Kawasaki Steel Corp | シミュレーションモデルの最適化方法 |
| JP2005346714A (ja) * | 2005-05-30 | 2005-12-15 | Toshiba Corp | プロセスモデルのパラメータ調整支援装置及び方法 |
Family Cites Families (3)
| Publication number | Priority date | Publication date | Assignee | Title |
|---|---|---|---|---|
| US7949501B1 (en) * | 2002-05-17 | 2011-05-24 | Northwestern University | Systems and methods for a real time machine simulator to explore the effects of rules used in a modular manufacturing or assembly system |
| US7330279B2 (en) | 2002-07-25 | 2008-02-12 | Timbre Technologies, Inc. | Model and parameter selection for optical metrology |
| KR20130081354A (ko) * | 2012-01-09 | 2013-07-17 | 삼성전자주식회사 | 분산 병렬 시뮬레이션에서의 통신 방법 |
-
2014
- 2014-07-11 WO PCT/JP2014/068584 patent/WO2016006101A1/fr not_active Ceased
- 2014-07-11 JP JP2016532386A patent/JP6211194B2/ja active Active
- 2014-07-11 US US15/324,966 patent/US10331818B2/en active Active
Patent Citations (3)
| Publication number | Priority date | Publication date | Assignee | Title |
|---|---|---|---|---|
| JPH07105177A (ja) * | 1993-09-30 | 1995-04-21 | Kawasaki Steel Corp | 信号処理方法 |
| JPH07121505A (ja) * | 1993-10-27 | 1995-05-12 | Kawasaki Steel Corp | シミュレーションモデルの最適化方法 |
| JP2005346714A (ja) * | 2005-05-30 | 2005-12-15 | Toshiba Corp | プロセスモデルのパラメータ調整支援装置及び方法 |
Cited By (2)
| Publication number | Priority date | Publication date | Assignee | Title |
|---|---|---|---|---|
| JP2020193885A (ja) * | 2019-05-29 | 2020-12-03 | 川崎重工業株式会社 | 水中物体捜索計画検討支援システムおよび水中物体捜索計画検討支援方法 |
| JP7240256B2 (ja) | 2019-05-29 | 2023-03-15 | 川崎重工業株式会社 | 水中物体捜索計画検討支援システムおよび水中物体捜索計画検討支援方法 |
Also Published As
| Publication number | Publication date |
|---|---|
| JPWO2016006101A1 (ja) | 2017-05-25 |
| US20170206290A1 (en) | 2017-07-20 |
| JP6211194B2 (ja) | 2017-10-11 |
| US10331818B2 (en) | 2019-06-25 |
Similar Documents
| Publication | Publication Date | Title |
|---|---|---|
| US8285836B2 (en) | Policy creation support method, policy creation support system, and program therefor | |
| US20130080910A1 (en) | Dynamic visualization of page element access rates in a web application | |
| CN113065101A (zh) | 逻辑回归模型的可视化解释方法及装置 | |
| US9721291B1 (en) | Identifying effective images associated with items | |
| CN107316082A (zh) | 用于确定机器学习样本的特征重要性的方法及系统 | |
| AU2010247903A1 (en) | Methods for interacting with and manipulating information and systems thereof | |
| WO2023050680A1 (fr) | Procédé et appareil de traitement de données | |
| US10445920B2 (en) | Methods, apparatus and system for analytics replay utilizing random sampling | |
| JP2018147280A (ja) | データ分析装置及びデータ分析方法 | |
| JP2016528608A5 (fr) | ||
| JP6211194B2 (ja) | シミュレーションシステム、及び、シミュレーション方法 | |
| US20170140395A1 (en) | Selling status display method, selling status display apparatus, and recording medium | |
| JP6102575B2 (ja) | 性能測定方法、性能測定プログラム及び性能測定装置 | |
| US9792706B2 (en) | Graph processing system, graph processing method, and non-transitory computer readable medium | |
| JP7709933B2 (ja) | ソリューション提案支援方法及びソリューション提案支援システム | |
| JP2018506783A (ja) | 要素識別子の生成 | |
| JP7215318B2 (ja) | 情報処理プログラム、情報処理方法、及び情報処理装置 | |
| JP6676993B2 (ja) | 情報提供装置、情報提供方法、及び、プログラム | |
| JP2018010562A (ja) | コンピュータシステム、プログラムの応答時間の推定方法、計算機及びプログラム | |
| KR20210029006A (ko) | 제품 평가 마이닝 방법 및 이를 수행하는 장치 | |
| US20110280474A1 (en) | Auto classifying images as "image not available" images | |
| JP5668836B2 (ja) | 情報処理装置,情報取得方法及び情報取得プログラム | |
| KR20180080924A (ko) | 빅 데이터 처리 서버의 데이터 처리 결과를 모니터링 하기 위한 장치 및 방법 | |
| JP6670572B2 (ja) | 情報処理装置、情報処理方法、およびプログラム | |
| JP2019109758A (ja) | テキスト分析装置、テキスト分析方法、及び、テキスト分析プログラム |
Legal Events
| Date | Code | Title | Description |
|---|---|---|---|
| 121 | Ep: the epo has been informed by wipo that ep was designated in this application |
Ref document number: 14896963 Country of ref document: EP Kind code of ref document: A1 |
|
| ENP | Entry into the national phase |
Ref document number: 2016532386 Country of ref document: JP Kind code of ref document: A |
|
| WWE | Wipo information: entry into national phase |
Ref document number: 15324966 Country of ref document: US |
|
| NENP | Non-entry into the national phase |
Ref country code: DE |
|
| 122 | Ep: pct application non-entry in european phase |
Ref document number: 14896963 Country of ref document: EP Kind code of ref document: A1 |