WO2016104798A1 - Dispositif d'imagerie par résonance magnétique, procédé de génération d'images pondérées en diffusion, et dispositif de traitement d'image - Google Patents
Dispositif d'imagerie par résonance magnétique, procédé de génération d'images pondérées en diffusion, et dispositif de traitement d'image Download PDFInfo
- Publication number
- WO2016104798A1 WO2016104798A1 PCT/JP2015/086433 JP2015086433W WO2016104798A1 WO 2016104798 A1 WO2016104798 A1 WO 2016104798A1 JP 2015086433 W JP2015086433 W JP 2015086433W WO 2016104798 A1 WO2016104798 A1 WO 2016104798A1
- Authority
- WO
- WIPO (PCT)
- Prior art keywords
- diffusion
- value
- weighted
- image
- pulse
- Prior art date
- Legal status (The legal status is an assumption and is not a legal conclusion. Google has not performed a legal analysis and makes no representation as to the accuracy of the status listed.)
- Ceased
Links
Images








Classifications
-
- G—PHYSICS
- G01—MEASURING; TESTING
- G01R—MEASURING ELECTRIC VARIABLES; MEASURING MAGNETIC VARIABLES
- G01R33/00—Arrangements or instruments for measuring magnetic variables
- G01R33/20—Arrangements or instruments for measuring magnetic variables involving magnetic resonance
- G01R33/44—Arrangements or instruments for measuring magnetic variables involving magnetic resonance using nuclear magnetic resonance [NMR]
- G01R33/48—NMR imaging systems
- G01R33/54—Signal processing systems, e.g. using pulse sequences ; Generation or control of pulse sequences; Operator console
- G01R33/56—Image enhancement or correction, e.g. subtraction or averaging techniques, e.g. improvement of signal-to-noise ratio and resolution
- G01R33/563—Image enhancement or correction, e.g. subtraction or averaging techniques, e.g. improvement of signal-to-noise ratio and resolution of moving material, e.g. flow contrast angiography
- G01R33/56341—Diffusion imaging
-
- G—PHYSICS
- G01—MEASURING; TESTING
- G01R—MEASURING ELECTRIC VARIABLES; MEASURING MAGNETIC VARIABLES
- G01R33/00—Arrangements or instruments for measuring magnetic variables
- G01R33/20—Arrangements or instruments for measuring magnetic variables involving magnetic resonance
- G01R33/44—Arrangements or instruments for measuring magnetic variables involving magnetic resonance using nuclear magnetic resonance [NMR]
- G01R33/48—NMR imaging systems
- G01R33/54—Signal processing systems, e.g. using pulse sequences ; Generation or control of pulse sequences; Operator console
- G01R33/56—Image enhancement or correction, e.g. subtraction or averaging techniques, e.g. improvement of signal-to-noise ratio and resolution
- G01R33/5608—Data processing and visualization specially adapted for MR, e.g. for feature analysis and pattern recognition on the basis of measured MR data, segmentation of measured MR data, edge contour detection on the basis of measured MR data, for enhancing measured MR data in terms of signal-to-noise ratio by means of noise filtering or apodization, for enhancing measured MR data in terms of resolution by means for deblurring, windowing, zero filling, or generation of gray-scaled images, colour-coded images or images displaying vectors instead of pixels
-
- G—PHYSICS
- G01—MEASURING; TESTING
- G01R—MEASURING ELECTRIC VARIABLES; MEASURING MAGNETIC VARIABLES
- G01R33/00—Arrangements or instruments for measuring magnetic variables
- G01R33/20—Arrangements or instruments for measuring magnetic variables involving magnetic resonance
- G01R33/44—Arrangements or instruments for measuring magnetic variables involving magnetic resonance using nuclear magnetic resonance [NMR]
- G01R33/48—NMR imaging systems
- G01R33/54—Signal processing systems, e.g. using pulse sequences ; Generation or control of pulse sequences; Operator console
- G01R33/56—Image enhancement or correction, e.g. subtraction or averaging techniques, e.g. improvement of signal-to-noise ratio and resolution
- G01R33/561—Image enhancement or correction, e.g. subtraction or averaging techniques, e.g. improvement of signal-to-noise ratio and resolution by reduction of the scanning time, i.e. fast acquiring systems, e.g. using echo-planar pulse sequences
- G01R33/5615—Echo train techniques involving acquiring plural, differently encoded, echo signals after one RF excitation, e.g. using gradient refocusing in echo planar imaging [EPI], RF refocusing in rapid acquisition with relaxation enhancement [RARE] or using both RF and gradient refocusing in gradient and spin echo imaging [GRASE]
- G01R33/5616—Echo train techniques involving acquiring plural, differently encoded, echo signals after one RF excitation, e.g. using gradient refocusing in echo planar imaging [EPI], RF refocusing in rapid acquisition with relaxation enhancement [RARE] or using both RF and gradient refocusing in gradient and spin echo imaging [GRASE] using gradient refocusing, e.g. EPI
Definitions
- Embodiments described herein relate generally to a magnetic resonance imaging apparatus, a diffusion weighted image generation method, and an image processing apparatus.
- a magnetic resonance imaging apparatus excites a nuclear spin of a subject placed in a static magnetic field with a radio frequency (RF) signal of a Larmor frequency, and generates a magnetic resonance signal (MR (Magnetic)) generated from the subject upon excitation. (Resonance) signal) is reconstructed to generate an image.
- RF radio frequency
- MR Magnetic
- Resonance magnetic resonance signal
- diffusion weighted imaging In the field of magnetic resonance imaging, there is a technique called diffusion weighted imaging (DWI).
- DWI diffusion weighted imaging
- MPG motion probing gradient
- a difference is generated in the intensity of the MR signal according to the difference in diffusion coefficient in each tissue in the living body, and a diffusion weighted image in which the difference in diffusion coefficient is emphasized can be generated.
- ADC apparatus diffusion coefficient
- b value b-factor
- the b value In order to increase the contrast due to the difference in ADC, it is necessary to set the b value to be large to some extent, and a value of about 1000 is normally used as the b value. However, when trying to depict a malignant tumor, such a b value is insufficient, and a larger b value may be desired. On the other hand, it is not easy to set a larger b value due to hardware restrictions.
- the problem to be solved by the present invention is to provide a magnetic resonance imaging apparatus capable of calculating a diffusion weighted image corresponding to a parameter value different from the imaging parameter value used at the time of collection from the collected diffusion weighted image. is there.
- the magnetic resonance imaging apparatus of the present embodiment includes a collection unit that collects (N + 1) or more diffusion-weighted images by setting different values of the parameters for N types (N is a natural number of 2 or more); Calculation of an arbitrary value for the parameter based on the relationship between the value of the parameter set with different values between the (N + 1) or more diffusion-weighted images and the signal value of the collected diffusion-weighted image A generation unit that generates a diffusion weighted image.
- FIG. 1 is a configuration diagram showing an example of the overall configuration of a magnetic resonance imaging apparatus of an embodiment.
- the block diagram which shows the structure in connection with the diffusion weighted imaging of 1st Embodiment.
- the flowchart which shows the process example of 1st Embodiment.
- the figure which shows an example of the parameter setting screen at the time of a diffusion emphasis image collection. 1 is a block diagram illustrating a configuration example of an image processing apparatus.
- a b value of about 1000 has been conventionally used in both the calculated DWI and the normal DWI.
- the MPG pulse length must be increased to some extent.
- the time from the application of the excitation pulse to the acquisition of the main part of the MR signal, that is, the effective echo time TE becomes longer.
- the effective echo time TE is about 60 ms or more.
- the tumor tissue has a smaller ADC than the normal tissue, the tumor tissue is depicted as a high signal in the diffusion weighted image.
- diffusion-weighted imaging has been frequently used for tumor diagnosis not only for the brain but also for the whole body including abdominal systems such as the liver, kidney and prostate.
- abdominal tissues such as the liver, kidney and prostate generally have a short transverse relaxation time T2.
- the nerve tissue also has a small ADC, and the nerve tissue is depicted as a high signal in the diffusion weighted image, but the nerve tissue also has a short lateral relaxation time T2.
- the effective echo time TE becomes longer than the lateral relaxation time T2 of the tumor or nerve.
- the above-mentioned tumor and nerve signals are attenuated, and the signal strength relative to the tumor and nerve background is reduced. That is, a tumor or a nerve that should be originally rendered as a high signal by diffusion weighted imaging has a low signal because the effective echo time TE is longer than the lateral relaxation time T.
- the image becomes substantially T2-weighted. Therefore, the contrast due to the difference in ADC and the contrast due to the difference in T2 are mixed in the diffusion-weighted image. Become. For this reason, the contrast of the ADC is buried in the contrast due to the difference in T2, and it is difficult to extract the contrast of the ADC originally intended to be obtained.
- FIG. 1 is a block diagram showing an overall configuration of a magnetic resonance imaging apparatus 1 according to the first embodiment.
- the magnetic resonance imaging apparatus 1 of the embodiment includes a magnet stand 100, a bed 200, a control cabinet 300, a console 400, and the like.
- the magnet mount 100 includes a static magnetic field magnet 10, a gradient magnetic field coil 11, a WB (Whole Body) coil 12, and the like, and these components are housed in a cylindrical casing.
- the bed 200 includes a bed body 20 and a top plate 21. Moreover, it has the array coil 13 arrange
- the control cabinet 300 includes a static magnetic field power supply 30, a gradient magnetic field power supply 31 (X-axis 31x, Y-axis 31y, Z-axis 31z), an RF receiver 32, an RF transmitter 33, a sequence controller 34, and the like.
- the console 400 is configured as a computer having a processing circuit 40, a storage circuit 41, an input device 42, a display 43, and the like.
- the static magnetic field magnet 10 of the magnet mount 100 has a substantially cylindrical shape, and generates a static magnetic field in a bore (a space inside the cylinder of the static magnetic field magnet 10) that is an imaging region of a subject (patient).
- the static magnetic field magnet 10 incorporates a superconducting coil, and the superconducting coil is cooled to a very low temperature by liquid helium.
- the static magnetic field magnet 10 generates a static magnetic field by applying a current supplied from the static magnetic field power source 30 to the superconducting coil in the excitation mode, and then, when the permanent magnetic mode is entered, the static magnetic field power source 30 is disconnected. . Once in the permanent current mode, the static magnetic field magnet 10 continues to generate a large static magnetic field for a long time, for example, for one year or more.
- the static magnetic field magnet 10 may be configured as a permanent magnet.
- the gradient magnetic field coil 11 also has a substantially cylindrical shape and is fixed inside the static magnetic field magnet 10.
- the gradient magnetic field coil 11 applies a gradient magnetic field to the subject in the X-axis, Y-axis, and Z-axis directions by a current supplied from a gradient magnetic field power supply (31x, 31y, 31z).
- the bed main body 20 of the bed 200 can move the top plate 21 in the vertical direction, and moves the subject placed on the top plate 21 to a predetermined height before imaging. Thereafter, at the time of imaging, the top 21 is moved in the horizontal direction to move the subject into the bore.
- the WB coil 12 is fixed in a substantially cylindrical shape so as to surround the subject inside the gradient magnetic field coil 11.
- the WB coil 12 transmits an RF pulse transmitted from the RF transmitter 33 toward the subject, and receives a magnetic resonance signal emitted from the subject due to excitation of hydrogen nuclei.
- the array coil 13 is an RF coil, and receives a magnetic resonance signal emitted from the subject at a position close to the subject.
- the array coil 13 is composed of a plurality of element coils, for example.
- There are various types of array coils 13 such as for the head, for the chest, for the spine, for the lower limbs, and for the whole body depending on the imaging region of the subject.
- FIG. 1 illustrates the array coil 13 for the chest. ing.
- the RF transmitter 33 transmits an RF pulse to the WB coil 12 based on an instruction from the sequence controller 34.
- the RF receiver 32 detects a magnetic resonance signal received by the WB coil 12 or the array coil 13 and transmits raw data obtained by digitizing the detected magnetic resonance signal to the sequence controller 34.
- the sequence controller 34 scans the subject by driving the gradient magnetic field power supply 31, the RF transmitter 33, and the RF receiver 32 under the control of the console 400.
- the sequence controller 34 scans and receives raw data from the RF receiver 32, the sequence controller 34 transmits the raw data to the console 400.
- the console 400 includes a processing circuit 40, a storage circuit 41, an input device 42, and a display 43.
- the console 400 controls the entire magnetic resonance imaging apparatus 1. Specifically, imaging conditions and other various information and instructions are received by operating an input device 42 such as a mouse or keyboard such as a laboratory technician. Then, the processing circuit 40 causes the sequence controller 34 to perform scanning based on the input imaging conditions, and reconstructs an image based on the raw data transmitted from the sequence controller 34. The reconstructed image is displayed on the display 43 or stored in the storage circuit 41.
- FIG. 2 is a block diagram of the magnetic resonance imaging apparatus 1 of the first embodiment including a configuration related to diffusion-weighted imaging.
- the processing circuit 40 of the magnetic resonance imaging apparatus 1 includes an imaging condition setting function 401, a parameter storage function 402, a diffusion weighted image generation function 403, a diffusion weighted image calculation function 404, an ADC map generation function 405, T2. Each function of the map generation function 406 is realized.
- Each of these functions is realized by, for example, a processor included in the processing circuit 40 executing predetermined program code stored in the storage circuit 41.
- the processing circuit 40 includes hardware such as ASIC (application specific integrated circuit) or FPGA (field programmable gate array), and the above hardware processing using these hardware is used. These functions may be realized. Further, the above functions may be realized by combining software processing and hardware processing.
- the parameter storage function 402, the diffusion weighted image generation function 403, the diffusion weighted image calculation function 404, the ADC map generation function 405, and the T2 map generation function 406 constitute the calculation image generation function 408.
- the imaging condition setting function 401 and the diffusion weighted image generation function 403 that are realized by the processing circuit 40 of the console 400 and each component other than the console 400 (the components in the control cabinet 300, the magnet stand 100, and the bed 200) are realized.
- the collecting function 500 is composed of the functions to be performed. Further, the input device 42 and the display 43 in FIG. 2 are the same as those shown in FIG.
- the parameter storage function 402 stores the imaging conditions such as the type of the pulse sequence of diffusion weighted imaging and various parameters in the pulse sequence in the storage circuit 41. These imaging conditions are input by an operator via the input device 42, for example. Alternatively, the operator can change the imaging conditions already stored by an operation via the input device 42.
- b value As a parameter specific to the pulse sequence of diffusion weighted imaging, there is a b value (b-factor) as a parameter related to an MPG (motion probing gradient) pulse.
- This b value is input via the input device 42 and is stored in a parameter storage function.
- 402 is stored in the storage circuit 41.
- parameters such as the pulse repetition time TR and the effective echo time TE are also input via the input device 42 and stored in the storage circuit 41.
- the imaging condition setting function 401 reads parameters stored in the storage circuit 41 when diffusion-weighted imaging is executed, and sets the read parameters in the sequence controller 34 as imaging conditions for diffusion-weighted imaging.
- the sequence controller 34 performs diffusion weighted imaging according to the set imaging conditions.
- the diffusion weighted image generation function 403 reconstructs the magnetic resonance signals (MR signals) collected by the diffusion weighted imaging by processing such as inverse Fourier transform, and generates a diffusion weighted image.
- MR signals magnetic resonance signals
- three or more diffusion-weighted images are generated and collected by executing diffusion-weighted imaging with different pulse sequences.
- diffusion-weighted imaging is performed using the first to third three pulse sequences, and first to third diffusion-weighted images are generated corresponding to each pulse sequence.
- the b value or the effective echo time TE is set to three or more different values.
- a first b value and a first effective echo time TE are defined in the first pulse sequence
- a second b value and a second effective echo time TE are defined in the second pulse sequence
- a third In this pulse sequence the third b value and the third effective echo time TE are respectively defined, which will be described in detail later.
- the three diffusion weighted images generated or collected are temporarily stored in an appropriate memory.
- the calculation image generation function 408 includes the signal intensity for each pixel of the first to third diffusion weighted images, the first, second, and third b values, and the first, second, and third effective echoes.
- a calculation diffusion weighted image (computed DWI: computed diffusion weighted image) corresponding to an arbitrary effective echo time TE and an arbitrary b value is generated by calculation using the time TE.
- the ADC map generation function 405 of the calculation image generation function 408 calculates the subject from the signal intensity for each pixel of the first and second diffusion weighted images and the first and second b values, for example.
- the ADC (apparent diffusion coefficient) is calculated for each pixel to generate an ADC map.
- the ADC map is an array in which ADCs calculated for each pixel are arranged at corresponding pixel positions.
- the T2 map generation function 406 of the calculation image generation function 408, uses the signal intensity for each pixel of the first and third diffusion weighted images and the first and third effective echo times TE to determine the lateral direction of the subject.
- the relaxation time T2 is calculated for each pixel, and a T2 map is generated.
- the T2 map is obtained by arranging the lateral relaxation times T2 calculated for each pixel at corresponding pixel positions.
- the diffusion weighted image calculation function 404 of the calculation image generation function 408 is configured to generate an arbitrary effective echo time from the ADC map and the T2 map and the signal intensity for each pixel of any one of the first to third diffusion weighted images.
- a calculation diffusion weighted image corresponding to TE and an arbitrary b value is generated.
- the generated calculation diffusion extended image is displayed on the display 43, for example.
- the b values used in the first to third pulse sequences described above include a small b value (for example, a b value close to zero) and a case where the b value is zero. obtain.
- such an image having a small b value used for generating a calculated diffusion weighted image is also called a diffusion weighted image. This applies not only to the first embodiment but also to other embodiments.
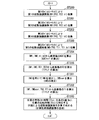
- FIG. 3 is a flowchart showing a processing example for generating a calculation expansion image of the magnetic resonance imaging apparatus 1 according to the first embodiment. The operation of the magnetic resonance imaging apparatus 1 will be described below according to this flowchart.
- step ST100 the collection function 500 collects the first diffusion weighted image IM1 (TE2, b1) by the first pulse sequence.
- step ST101 the acquisition function 500 acquires the second diffusion weighted image IM2 (TE2, b2) according to the second pulse sequence.
- step ST102 the collection function 500 collects the third diffusion weighted image IM3 (TE1, b1) by the third pulse sequence.
- FIG. 4 shows an example of a pulse sequence type commonly used for the first to third pulse sequences, in which an MPG pulse for diffusion enhancement is incorporated into an SE (spinsecho) type EPI (echo planar imaging) sequence.
- SE spinsecho
- EPI echo planar imaging
- the MPG pulse is a gradient magnetic field pulse applied to emphasize diffusion, and one MPG pulse is applied between the excitation pulse and the refocus pulse and between the refocus pulse and the data collection.
- the b-factor is usually used as an index representing the magnitude of the influence of the MPG pulse on the tissue ADC (apparent diffusion coefficient).
- the value of b is expressed by the following (Formula 1).
- b ⁇ G 2 ⁇ 2 (T ⁇ ( ⁇ / 3)) (Formula 1)
- G the magnitude of the gradient magnetic field of the MPG pulse
- ⁇ the pulse length of the MPG pulse
- T the leading edge of the first MPG pulse to the leading edge of the subsequent MPG pulse. Is the interval.
- Single shot SE-EPI collects all k-space data for one slice by collecting one data with one excitation pulse.
- k-space data for one slice is collected in a plurality of times.
- the pulse sequence shown in FIG. 4 is repeated at a repetition time TR.
- the signal intensity S (the signal intensity S at the center of the k space) after the effective echo time TE from the excitation pulse is expressed by the following (Expression 2).
- S S 0 * (1-exp [ ⁇ TR / T1]) * exp [ ⁇ TE / T2] * exp [ ⁇ b * ADC] (Formula 2)
- S 0 is a constant
- TR is a repetition time
- TE is an effective echo time
- b is a b value in (Equation 1).
- T1, T2, and ADC represent the longitudinal relaxation time T1, the lateral relaxation time T2, and the apparent diffusion coefficient ADC of each tissue of the subject, respectively.
- the repetition time TR, effective echo time TE, and b value are parameters that depend on the pulse sequence (hereinafter may be referred to as sequence parameters), and include longitudinal relaxation time T1, lateral relaxation.
- the time T2 and the ADC are parameters that depend on the tissue of the subject (hereinafter may be referred to as tissue parameters).
- the first to third pulse sequences in which two kinds of parameters of the effective echo time TE and the b value among the sequence parameters are changed are used in steps ST100 to ST102.
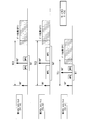
- FIG. 5 is a diagram showing examples of the first to third pulse sequences in the upper, middle, and lower stages, respectively.
- the effective echo time first effective echo time
- the b value first b value
- the effective echo time second effective echo time
- the b value second b value
- the effective echo time third effective echo time
- the effective echo time third effective echo time
- the b value third b value
- TE2 defined by the first and second pulse sequences is longer than TE1 defined by the third pulse sequence (TE1 ⁇ TE2).
- b2 defined by the second pulse sequence is larger than b1 defined by the first and third pulse sequences (b1 ⁇ b2).
- FIG. 5 shows a single-shot SE-EPI sequence, but in the case of multi-shot, the sequence shown in FIG. 5 is repeated at a repetition time TR.
- the repetition time TR is defined to be the same value in the first to third pulse sequences.
- step ST100 of FIG. 4 a first pulse sequence having TE2 and b1 is executed, and MR signals acquired along with this are reconstructed to acquire a first diffusion weighted image IM1 (TE2, b1).
- step ST101 a second pulse sequence having TE2 and b2 is executed, and MR signals acquired along with this are reconstructed to acquire a second diffusion weighted image IM2 (TE2, b2).
- step ST102 a third pulse sequence having TE1 and b1 is executed, and MR signals acquired along with this are reconstructed to acquire a third diffusion weighted image IM3 (TE1, b1).
- step ST103 an ADC for each pixel is calculated from the first diffusion weighted image IM1 and the second diffusion weighted image IM2, b1, b2.
- the signal intensity ratio shown in the following (Expression 6) is calculated from (Expression 3) and (Expression 4).
- S2 (TE2, b2) / S1 (TE2, b1) exp [-(b2-b1) * ADC] (Equation 6)
- T2 for each pixel is calculated from the first diffusion weighted image IM1, the third diffusion weighted image IM3, TE1, and TE2.
- the signal intensity ratio shown in the following (Expression 8) is calculated from (Expression 4) and (Expression 5).
- S1 (TE2, b1) / S3 (TE1, b1) exp [-(TE2-TE1) / T2] (Formula 8)
- T2 -(TE2-TE1) / ln [S1 (TE2, b1) / S3 (TE1, b1)] (Formula 9)
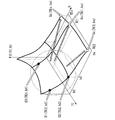
- FIG. 6 shows the three signal intensities S1 (TE2, b1), S2 (TE2, b2), and S3 (TE1, b1) collected by actual imaging in the signal space S (TE, b), and are calculated. It is a figure which shows typically the relationship with signal strength Sc (TEc, bc).
- the first horizontal axis is the effective echo time TE
- the second horizontal axis is the b value
- the vertical axis is the signal intensity S.
- the cited document 1 and the like calculate the signal intensity Sc (TE2, bc) (bc> b2> b1) having a large b value from the two signal intensities S1 (TE2, b1) and S2 (TE2, b2) in FIG.
- the technology required in This prior art corresponds to calculating a diffusion weighted image having a b value larger than the b2 value of the second pulse sequence using the first and second pulse sequences in FIG.
- the MPG pulse length needs to be increased to some extent, and the effective echo time TE2 becomes longer.
- the effective echo time TE2 is 60 milliseconds or longer.
- the lateral relaxation time T2 of the tumor or nerve is short, which is shorter than the relatively long effective echo time TE2 of the above-described prior art.
- the MR signal of the tumor or nerve is attenuated at the time of acquisition, and the signal strength relative to the background of the tumor or nerve is reduced. That is, a tumor or a nerve that should be rendered as a high signal by diffusion weighted imaging has a low signal because the effective echo time TE is longer than the lateral relaxation time T2.
- the image becomes substantially T2-weighted, so that the contrast due to the difference in ADC and the contrast due to the difference in T2 are mixed in the diffusion weighted image. Become. For this reason, the contrast of the ADC is buried in the contrast due to the difference in T2, and it is difficult to extract the contrast of the ADC originally intended to be obtained.
- a diffusion weighted image having a signal intensity Sc (TEc, bc) corresponding to an arbitrary b value (bc) and an arbitrary effective echo time TEc is obtained. It can be calculated.
- a diffusion weighted image corresponding to a large bc and a very short effective echo time TEc can be obtained by calculation.
- a diffusion weighted image having a signal intensity Sc (TEc, bc) corresponding to bc ⁇ 2000 and TEc ⁇ 10 milliseconds can be obtained by calculation.
- a diffusion weighted image corresponding to an effective echo time TEc of zero milliseconds can be obtained by calculation.
- the acquisition function 500 sets the b value of the first pulse sequence and the b value of the second pulse sequence to different values (b1 ⁇ b2, b1 ⁇ b2) and the first value
- the first and second diffusion weighted images are acquired by setting the TE of the pulse sequence and the TE of the second pulse sequence to the same value (TE2).
- the b value of the third pulse sequence is set to the smaller value (b1) of the b values of the first and second pulse sequences
- the TE of the third pulse sequence is set to the first and second values.
- the third diffusion weighted image is collected by setting a value (TE1: TE1 ⁇ TE2) shorter than the second effective echo time (TE2).
- the combinations of effective echo times TE and b values used in the first, second, and third pulse sequences are (TE1, b1), (TE2, b2), and (TE3, b3), respectively.
- each value may be arbitrary. That is, the three values TE1, TE2, and TE3 may all be different, or two values in any combination of the three values may be the same and the other one value may be different.
- each value may be arbitrary.
- the three values b1, b2, and b3 may all be different, or two values in any combination of the three values may be the same and the other one value may be different.
- the three values b1, b2, and b3 may all be different, or two values in any combination of the three values may be the same and the other one value may be different.
- the calculation image generation function 408 generates a dynamic calculation diffusion weighted image in which at least one of an arbitrary effective echo time TEc and an arbitrary bc is continuously changed.
- the display 43 continuously displays this dynamic calculation diffusion weighted image.
- the acquisition function 500 when generating a calculation diffusion weighted image of a nerve, the acquisition function 500 makes the application direction of the MPG pulse in the first to third pulse sequences orthogonal to the traveling direction of the nerve to be depicted. Set the direction. It is known that the nerve ADC is relatively large in the running direction, but smaller in the direction orthogonal to the running direction than the background water or the soft tissue ADC. Utilizing this feature, a technique has been reported in which MPG pulses are applied orthogonally to the nerve running direction in diffusion weighted imaging to emphasize nerves while attenuating water and soft tissue. However, nerves such as cranial nerves have a short lateral relaxation time T2, while CSF (water) behind the nerve has a long lateral relaxation time T2.
- the nerve signal is attenuated due to the long effective echo time TE, and the nerve is buried in a background tissue such as CSF.
- the first to third diffusion weighted images are collected with the MPG pulse set in the direction orthogonal to the traveling direction of the nerve, and then, from these diffusion weighted images, the length is very short.
- a calculated diffusion weighted image corresponding to the effective echo time TEc can be generated.
- the nerve signal can be clearly depicted from the background such as CSF without attenuating the nerve signal.
- the collection function 500 collects the first to third diffusion weighted images using the SE-EPI system diffusion weighted imaging pulse sequence (FIGS. 4 and 5).
- the type of pulse sequence is not limited to this.
- FIG. 7 is a diagram showing an example of a pulse sequence called Motion-sensitized Diffusion Equilibrium (MSDE) or Diffusion-sensitizes Diffusion Equilibrium (DSDE).
- MSDE Motion-sensitized Diffusion Equilibrium
- DSDE Diffusion-sensitizes Diffusion Equilibrium
- a diffusion weighted image may be collected.
- the pre-pulse portion is composed of a 90 ° excitation pulse, an MPG pulse, a 180 ° refocus pulse, an MPG pulse, and a 90 ° pulse.
- transverse magnetization that is diffusion-weighted by (90 ° excitation pulse ⁇ MPG pulse ⁇ 180 ° refocus pulse ⁇ MPG pulse) is generated, and the transverse magnetization is returned to longitudinal magnetization by the subsequent 90 ° pulse.
- the type of pulse sequence used by the collection function 500 to collect the first to third diffusion weighted images is not particularly limited.
- the pulse sequence can be formulated with the signal intensity S by the sequence parameters such as the effective echo time TE and b value and the tissue parameters of the subject tissue such as ADC and T2, the first to third diffusions It can be employed as the first to third pulse sequences used for collecting the enhanced images.
- the types of pulse sequences may be different between the first to third pulse sequences.
- the third pulse sequence is more than TE2.
- a pulse sequence having a short effective echo time TE1 is sufficient, and application of a b value, that is, an MPG pulse is not necessarily required. Therefore, as the third pulse sequence, a normal pulse sequence that does not involve application of an MPG pulse, such as an SE sequence, a high-speed SE sequence, or a GRE sequence, can be employed.
- a PDW (proton density weighted image) without MPG pulse application which is separately imaged for the same patient without executing the third pulse sequence to generate a calculated diffusion weighted image, is performed.
- normal image data of T1W (T1-weighted image) can be used. However, as necessary, it is assumed that the normal image data is aligned with the first and second diffusion weighted images and adjusted to match the matrix size.
- the diffusion coefficient is a combination of a plurality of components due to the influence of blood flow and body movement, or the diffusion itself is a mixture of components inside and outside the cell.
- Dd Dd + Dp.
- Dd Dd + Dp.
- FIG. 8A is a table showing model values of Dd and Dp, respectively, as models of the tumor site and the normal site.
- the table also shows model values of the volume ratio f of the tumor site and the normal site.
- FIG. 8B shows the relative value (S / S 0 ) of the signal intensity at the normal site based on the above model value, the thick broken line when the diffusion coefficient is only Dp, and the case where the diffusion coefficient is only Dd. A thin broken line and a case where the diffusion coefficient is a combined diffusion coefficient of Dp + Dd are indicated by a thick solid line.
- FIG. 8C shows the relative value (S / S 0 ) of each signal intensity at the tumor site based on the above model value.
- FIGS. 9A to 9D are diagrams for explaining the relationship between the b value selection range and the signal intensity calculation error.
- ADCs corresponding to these values are represented as single-exponential. It is calculated by the following (Formula 12) based on the model.
- S (b1) / S (b2) exp [-(b1-b2) * ADC] (Equation 12)
- ADC is calculated from (Equation 12) based on single-exponential
- b1 50 to 300 [s / mm 2 ] or a value less than this is excluded and set to 300 [s / mm 2 ] or more.
- the ADC is calculated from the following (Equation 13) and (Equation 14) based on the bi-exponential model obtained by adding two single-exponential models with a predetermined weight f. You may do it.
- a calculated diffusion weighted image having a large contrast between a tumor site and a normal site can be generated even when a plurality of diffusions and blood flows are mixed.
- the magnetic resonance imaging apparatus 1 further adds diffusion-weighted images with different repetition times TR, and uses four or more, for example, first to fourth four pulse sequences, for the first to the first.
- Four four diffusion weighted images are collected. Then, from these four diffusion weighted images, a diffusion weighted image corresponding to an arbitrary repetition time TRc, an arbitrary effective echo time TEc, and an arbitrary b value (bc) is obtained by calculation.
- FIG. 10 is a block diagram of the magnetic resonance imaging apparatus 1 of the second embodiment including a configuration related to diffusion-weighted imaging.
- the difference from the first embodiment (FIG. 2) is that a T1 map generation function 407 is further provided.
- FIG. 11 is a flowchart illustrating a processing example for generating a calculation expansion image of the magnetic resonance imaging apparatus 1 according to the second embodiment.
- the first diffusion weighted image IM1 (TR2, TE2, b1) is collected by the first pulse sequence.
- a calculated diffusion weighted image is generated using two types of sequence parameters (that is, effective echo time TE and b value).
- three types of sequence parameters are used. Is used. That is, the repetition time TR, effective echo time TE, and b value are used as sequence parameters. Therefore, the type of sequence parameter to be used is described as an argument such as diffusion weighted image IM (TR, TE, b).
- step ST201 the second diffusion weighted image IM2 (TR2, TE2, b2) is collected by the second pulse sequence
- step ST202 the third diffusion weighted image IM3 (TR2) by the third pulse sequence.
- step ST203 a fourth diffusion weighted image IM4 (TR1, TE1, b1) is collected by the fourth pulse sequence.
- the processing of steps ST200 to ST203 is performed by the collection function 500 as in the first embodiment.
- FIG. 12 is a diagram showing examples of first to fourth four pulse sequences used in the second embodiment.
- the first, second, and third pulse sequences are substantially the same as the first, second, and third pulse sequences (FIG. 5) used in the first embodiment. , It is explicitly shown that the repetition period is the same TR2.
- the effective echo time TE and b value use the same TE1 and b1 as in the third pulse sequence, but the repetition time TR is different from the first to third pulse sequences TE1. Is used. Specifically, in the fourth pulse sequence, a repetition time TR1 (TR1 ⁇ TR2) shorter than the repetition time TR2 of the first to third pulse sequences is used.
- diffusion weighted imaging is performed using the first to fourth pulse sequences.
- the diffusion weighted image generation function 403 reconstructs the first to fourth diffusion weighted images IM1, IM2, IM3, and IM4 corresponding to the four pulse sequences.
- the signal intensity for each pixel of the first to fourth diffusion weighted images IM1, IM2, IM3, IM4 is S1 (TR2, TE2, b1), S2 (TR2, TE2, b2), S3 (TR2, TE1, b1), respectively.
- S4 (TR1, TE1, b1) are expressed by the following (Expression 15) to (Expression 18) from (Expression 2).
- T2 for each pixel is calculated from the first diffusion weighted image IM1, the third diffusion weighted image IM3, TE1, and TE2.
- the signal intensity ratio shown in the following (Expression 21) is calculated from (Expression 15) and (Expression 17).
- S1 (TR2, TE2, b1) / S3 (TR2, TE1, b1) exp [-(TE2-TE1) / T2] (Formula 21)
- T2 for each pixel shown in the following (Equation 22), that is, a T2 map is calculated. This calculation is performed by the T2 map generation function 406.
- T2 -(TE2-TE1) / ln [S1 (TR2, TE2, b1) / S3 (TR2, TE1, b1)] (Formula 22)
- a vertical relaxation time T1 for each pixel is calculated from the third diffusion weighted image IM3 and the fourth diffusion weighted image IM4, TR1, TR2.
- the signal intensity ratio shown in the following (Expression 23) is calculated from (Expression 17) and (Expression 18).
- S4 (TR1, TE1, b1) / S3 (TR2, TE1, b1) (1-exp [-TR1 / T1]) / (1-exp [-TR2 / T1]) (Equation 23)
- the longitudinal relaxation time T1 is calculated from (Equation 23).
- the above equation cannot be solved analytically, but the longitudinal relaxation time T1 can be calculated by using a numerical solution of a known nonlinear equation.
- a T1 map is obtained by arranging longitudinal relaxation times T1 calculated for each pixel at corresponding pixel positions.
- the T1 map generation unit 407 calculates the vertical relaxation time T1 for each pixel.
- a calculation diffusion weighted image corresponding to an arbitrary repetition time TRc can be generated. Therefore, a diffusion weighted image corresponding to a short repetition time TRc that cannot be realized by an actual pulse sequence can be obtained by calculation. As a result, it is possible to generate a calculated diffusion weighted image that is more appropriately T1 weighted compared to conventional diffusion weighted imaging.
- the longitudinal relaxation time T1 and the lateral relaxation time T2 are obtained from the above (Formula 15), (Formula 17), and (Formula 18).
- a diffusion weighted image corresponding to an arbitrary value (arbitrary effective echo time TEc, arbitrary bc) of two parameter types is obtained by calculation from three points of measurement.
- a diffusion weighted image corresponding to an arbitrary value (arbitrary repetition time TRc, arbitrary effective echo time TEc, arbitrary bc) of three parameter types is calculated from four points of measurement. ing.
- a diffusion weighted image corresponding to an arbitrary value (arbitrary repetition time TRc, arbitrary effective echo time TEc) of two parameter types is obtained by calculation from three points of measurement.
- a diffusion weighted image corresponding to an arbitrary value (arbitrary effective echo time TEc) of one parameter type is obtained by calculation from two points of measurement.
- the measurement of two points means that the first and second diffusion weighted images are collected using the first and second pulse sequences.
- the effective echo time of the first pulse sequence is TE2
- the effective echo time of the second pulse sequence is TE1 (TE1 ⁇ TE2).
- the ratio of the signal intensity S1 (TR2, TE2, b1) of the first diffusion weighted image and the signal intensity S2 (TR2, TE1, b1) of the second diffusion weighted image is expressed by the following (Equation 28) It becomes.
- S1 (TR2, TE2, b1) / S2 (TR2, TE1, b1) exp [-(TE2-TE1) / T2] (Formula 28)
- the lateral relaxation time T2 is calculated as follows.
- T2 -(TE2-TE1) / ln [S1 (TR2, TE2, b1) / S2 (TR2, TE1, b1)] (Formula 29)
- the b value is the same as the value used for the measurement, but the effective echo time TEc can be arbitrarily set. Therefore, by setting TEc ⁇ TE1, a diffusion weighted image corresponding to a very short effective echo time TEc can be obtained by calculation. As a result, a diffusion-weighted image with little attenuation and high signal intensity can be obtained even for a tissue having a short lateral relaxation time T2.
- the repetition time TR uses a different value.
- the repetition time of the first pulse sequence is TR2
- the repetition time of the second pulse sequence is TR1 (TR1 ⁇ TR2).
- the longitudinal relaxation time T1 is obtained from the signal intensity S1 (TR2, TE2, b1) of the first pulse sequence and the signal intensity S2 (TR1, TE2, b1) of the second pulse sequence.
- N + 1 measurements may be performed. Therefore, even when there are unknown parameters other than T1, T2, and ADC, it can be easily expanded.
- N unknown parameters at least N + 1 measurement points are required, but more measurement points than N + 1 may be used.
- N unknown parameters can be obtained by applying the maximum likelihood estimation method to data at more measurement points than N + 1, and the calculation method is robust against measurement point errors.
- the effective echo time TE is limited in the pulse sequence of actual diffusion weighted imaging (the effective echo time TE is made very short due to the presence of MPG. Even if it is not possible, a diffusion weighted image corresponding to an arbitrary effective echo time TEc (for example, a very short effective echo time TEc) can be obtained by calculation. For this reason, even tissue having a short lateral relaxation time T2 such as a tumor or a nerve can be rendered with a high signal intensity with little attenuation due to lateral relaxation.
- a diffusion weighted image corresponding to an arbitrary repetition time TRc (for example, a very short repetition time TRc) can be obtained by calculation, a T1 weighted diffusion weighted image can be easily generated.
- the magnetic resonance imaging apparatus of the embodiment relates to N types of parameters (N is a natural number of 2 or more), for example, at least one of a diffusion enhancement factor b value, an effective echo time TE, and a repetition time TR.
- N is a natural number of 2 or more
- a diffusion enhancement factor b value for example, at least one of a diffusion enhancement factor b value, an effective echo time TE, and a repetition time TR.
- (N + 1) or more diffusion-weighted images are collected by setting different parameter values, and the parameter values set by varying values between the (N + 1) or more diffusion-weighted images are collected.
- a calculated diffusion weighted image having an arbitrary value is generated for the parameter.
- the calculation diffusion weighted image generation method based on the SE (Spin Echo) method has been mainly described.
- the longitudinal magnetization is reversed by a pulse for inversion recovery (IR) (hereinafter referred to as an IR pulse), and the longitudinal magnetization is restored by longitudinal relaxation.
- IR pulse for inversion recovery
- the generation of a calculated diffusion weighted image is applied to an imaging method in which MR signals are collected using the SE method.
- an imaging method without an IR pulse is simply referred to as an SE method
- the above imaging method with an IR pulse is referred to as an IR method.
- the time from the application of the IR pulse to the excitation pulse, ie, the application of the 90 ° pulse, is called the inversion time TI (Inversion Time).
- an imaging method that suppresses CSF signals by setting TI so that imaging is performed when the longitudinal magnetization of negatively cerebrospinal fluid (CSF: CerebroSpinalSpFluid) becomes zero.
- FLAIR FLuid Attenuation Inversion Recovery
- a diffusion weighted image using the FLAIR method is very useful because CSF is sufficiently suppressed even if the b value is zero.
- the SNR is lower than that of the diffusion weighted image using the SE method. This is because when the TI is set so that the longitudinal magnetization of the CSF becomes zero, the longitudinal magnetization of the brain parenchyma such as gray matter and white matter is in the process of recovery, and 70 to 80% of the longitudinal magnetization at the time of saturation. Depending on the degree. For this reason, when the FLAIR method is used for actual collection, the SNR is lower than that of the SE method having the same TE.
- the SNR further decreases.
- Actual collection by the FLAIR method has the advantage that CSF is suppressed regardless of the b value, but the SNR of the brain parenchyma also decreases.
- the longitudinal relaxation time T1 becomes longer and the SNR decreases more greatly. Therefore, diffusion-weighted imaging using the FLAIR method is not very popular in actual collection.
- a diffusion weighted image using the FLAIR method can be provided by calculation.
- a diffusion-weighted image using the FLAIR method having a higher SNR than actual collection can be provided by calculation.
- FIG. 13 is a flowchart showing a processing example for generating a calculation expansion image of the magnetic resonance imaging apparatus 1 according to the fourth embodiment.
- the fourth embodiment as in the second embodiment, four points are measured in order to obtain three unknown parameters (T1, T2, and ADC).
- T1, T2, and ADC three unknown parameters
- the calculation method of T1 is different between the fourth embodiment and the second embodiment.
- the fourth diffusion weighted image IM4 (TR1, TE1, b1) is collected by the fourth pulse sequence using the SE method to obtain T1, and the fourth diffusion weighted image IM4 and T1 (that is, T1 map) is calculated from the third diffusion weighted image IM3 (step ST206 in FIG. 11).
- the fifth diffusion weighted image IM5 (TR2, TI1, TE1, b1) is collected by the fifth pulse sequence using the IR method (FIG. 13). Step ST300). In FIG. 13, the processes of steps ST200 to 202 and steps ST204 to ST205 are the same as those of the second embodiment.
- FIG. 14 is a diagram illustrating examples of four pulse sequences used in the fourth embodiment.
- the first, second, and third pulse sequences used for the measurement from the first point to the third point are substantially the first, second, and second pulse sequences used in the second embodiment.
- 3 is the same as the pulse sequence of FIG. 3 (FIG. 12), and all are pulse sequences of the SE method without an IR pulse.
- the fifth pulse sequence (the lowermost stage in FIG. 14) used for the measurement at the fourth point is an IR method pulse sequence with an IR pulse, and here, the inversion time is TI1. .
- a fifth diffusion weighted image IM5 is acquired by the fifth pulse sequence.
- a signal for each pixel of IM5 is S5.
- S5 collected by the IR method needs to consider information on the sign due to the reversal of longitudinal magnetization. That is, since phase-sensitive IR (PSIR), that is, Realization is indispensable, phase correction is necessary.
- PSIR phase-sensitive IR
- This phase correction is performed by the following (Expression 32) using the complex signal of the third diffusion weighted image IM3 collected in parallel (step ST301 in FIG. 13).
- S5cor S5 * (conj [S3] /
- S3 and S5 are both complex signals, and conj [] means taking a complex conjugate.
- S5cor is a signal for each pixel of IM5 after phase correction (real part signal image value having a sign), and is represented by the following equation (33).
- S5cor S 0 * (1-2 * exp [-TI1 / T1]) * exp [-TE1 / T2] * exp [-b1 * ADC] (Formula 33)
- T1 is then expressed by (Expression 34).
- (1-2 * exp [-TI1 / T1]) / (1-exp [-TR2 / T1]) (Formula 34)
- (Equation 34) cannot be solved analytically with respect to T1, in general, it is necessary to obtain T1 using a numerical solution of a nonlinear equation such as the Marcart method. However, normally, TR2> 5 * T1, and TR2 can be considered to be sufficiently larger than T1.
- Equation 34 is simplified as the following (Equation 35).
- (1-2 * exp [-TI1 / T1]) (Formula 35)
- T1 (T1 map) can be approximately calculated by the following (Expression 36) (step ST302 in FIG. 13).
- T1 -TI1 / ln [(1-S5cor /
- FIG. 15 illustrates a point condition at the time of T1 measurement by the SE method (second embodiment) and a point condition at the time of T1 measurement by the IR method (fourth embodiment) in the case of imaging of the brain.
- TR2 is set to be sufficiently long so that the CSF having a long T1 is almost saturated when the third diffusion weighted image IM3 is acquired.
- the CNR of the brain parenchyma can be increased by setting TR1 so as to be close to T1 of the brain parenchyma such as gray matter or white matter.
- the IR method when the fifth diffusion weighted image IM5 is collected, TR2 is set sufficiently long so that the CSF having a long T1 is almost saturated as in the case of IM3.
- the CNR of the brain parenchyma is increased by setting TI1 so that it is close to T1 of the brain parenchyma such as gray matter or white matter. Can do.
- Sc (TI1, TE1, bc) S5cor * exp [-(bc-b1) * ADC] (Formula 39) In this case, calculation of T1 and T2 is unnecessary, and Sc (TI1, TE1, bc) can be obtained by calculation with a minimum of three measurements.
- the SNR is actually measured FLAIR if TR1 is set to the optimum condition for the brain parenchyma, that is, TR1 substantially matches T1 of the brain parenchyma.
- TR1 is set to the optimum condition for the brain parenchyma, that is, TR1 substantially matches T1 of the brain parenchyma.
- the T1 map is generated by the IR method, the effect of further improving the SNR of the T1 map to twice that of the SE method can be obtained.
- a new cDWI image having a b value different from that at the time of collection can be generated using FLAIR-DWI images collected using at least two different b values except for the b value. it can. Since the known cDWI technology is implicitly limited to the SE method and is not assumed to be combined with the FLAIR method, it is proposed as a 2-point method FLAIR-cDWI. TE cannot be shortened with the FLAIR-cDWI of the two-point method, but the CSF signal is close to zero. Compared to SE-cDWI, where the b value must be increased to suppress the T2 shine-through effect due to CSF. The b value can be reduced.
- the magnetic resonance imaging apparatus is the value of the parameter regarding N types (N is a natural number of 1 or more) of parameters in an imaging method involving IR pulses.
- N is a natural number of 1 or more
- (N + 1) or more diffusion-weighted images are collected with different settings, and the parameter values set with different values between the (N + 1) or more diffusion-weighted images and the collected diffusion-weighted images
- a calculated diffusion weighted image of an arbitrary value is generated for the parameter.
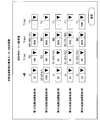
- FIG. 16 is a diagram showing an example of a parameter setting screen when collecting diffusion weighted images in the first to fourth embodiments described above.
- first to fourth four diffusion weighted images IM1, IM2, IM3, IM4
- b value, TE, TR are set as parameters at the time of collection.
- four diffusion weighted images IM1, IM2, IM3, IM5
- TI time-to-live
- the recommended values of these parameters are stored in advance in the storage circuit 41, and the recommended values are displayed on the display screen. By displaying the recommended value, the operation burden on the user is reduced.
- a button illustrated by a black triangle in FIG. 16
- a desired numerical value may be input directly from the keyboard.
- FIG. 17 is a diagram illustrating a configuration example of an image processing apparatus 600 according to the fifth embodiment.
- the first to fourth embodiments described so far are forms of the magnetic resonance imaging apparatus 1, and each embodiment includes a magnet stand 100 for collecting diffusion weighted images, a bed 200, a control cabinet 300, and the like. It has a configuration for collecting images.
- the image processing apparatus 600 of the fifth embodiment does not include these image collection configurations.
- the image processing apparatus 600 is configured as a computer such as a workstation, for example.
- the image processing apparatus 600 includes a processing circuit 640, a storage circuit 641, an input device 642, a display 643, and an input circuit 644.
- the processing circuit 640, the storage circuit 641, the input device 642, and the display 643 are substantially the same as the processing circuit 40, the storage circuit 41, the input device 42, and the display 43 described in the first embodiment. Description is omitted.
- the functions realized by the processing circuit 640 are the same as the functions realized by the processing circuit 40 except for the imaging condition setting function 401 and the diffusion weighted image generation function 403.
- the input circuit 644 inputs a diffusion weighted image captured by a magnetic resonance imaging apparatus separate from the image processing apparatus 600.
- the input circuit 644 When inputting a diffusion weighted image via a communication line such as a LAN or the Internet, the input circuit 644 is configured as a communication interface conforming to a corresponding communication standard. Further, when the diffusion weighted image is input via a recording medium such as an optical disk, the storage circuit 644 is configured as a recording medium reading device.
- the diffusion-weighted image input from the input circuit 644 is, for example, the first diffusion-weighted image IM1, the second diffusion-weighted image IM2, the third diffusion-weighted image IM3, the fourth diffusion-weighted image IM4, and the fifth.
- the fifth diffusion weighted image IM5 imaged by the IR method performs phase correction using the third diffusion weighted image IM3.
- the fifth diffusion weighted image IM5 and the third diffusion weighted image IM3 need to be complex images in which phase components are held.
- Each input diffusion-weighted image data includes parameter values such as b value, TR, TE, and TI as incidental information as imaging conditions when the image is collected in addition to the image itself.
- the processing circuit 644 performs processing corresponding to each of the above-described embodiments based on the input diffusion weighted image and its accompanying information, and generates a calculation diffusion weighted image (cDWI). For example, the processing of step ST103 to step ST105 of FIG. 3, the processing of step ST204 to step ST207 of FIG. 11, and the processing of step ST204 to step ST303 of FIG. 13 are performed to generate a calculated diffusion weighted image (cDWI).
- the calculated diffusion weighted image can be obtained by calculation for any b value, any TE, any TR, and any TI, but the user sets any value of these parameters prior to the calculation. There is a need.
- FIG. 18 is a diagram illustrating an example of a parameter setting screen when generating a calculation diffusion weighted image (cDWI).
- cDWI calculation diffusion weighted image
- each parameter for example, b value for calculation (ie, bc), TE for calculation (ie, TEc), TR for calculation (ie, TRc), and TI for calculation (ie, TIc).
- each slide bar is displayed.
- the user can set an arbitrary parameter value by moving a slider (illustrated by a white vertical ellipse) in each slider.
- FIG. 18 is merely an example, and for example, a method of directly inputting a numerical value from a keyboard may be used.
- one diffusion sequence image is acquired by setting one pulse sequence for one parameter set.
- data is collected while changing a plurality of parameter values by one pulse sequence, and then data is collected while changing a plurality of parameter values in the same manner by another pulse sequence. Then, a diffusion weighted image corresponding to each parameter value may be generated from the collected data.
- a first pulse sequence corresponding to two different b values (b1, b2) is executed for a first region segmented in k-space. Thereafter, the second pulse sequence corresponding to the above two different b values (b1, b2) is executed on the second region (the remaining region of the first region) segmented in the k space. To do. Then, a first diffusion weighted image IM1 and a second diffusion weighted image IM2 are generated from the two data sets collected in the first and second pulse sequences.
- the b value direction (that is, the MPG pulse application direction) is not particularly limited.
- a diffusion weighted image in which an MPG pulse is applied in any one of the X direction, the Y direction, and the Z direction may be collected to generate a calculated diffusion weighted image (cDWI) corresponding to that direction, Diffusion-weighted images obtained by applying MPG pulses in any two of the X, Y, and Z directions or all three directions are collected, and a calculated diffusion-weighted image (cDWI) corresponding to those directions is generated. May be.
- cDWI diffusion weighted image
- a diffusion weighted image corresponding to a parameter value different from the imaging parameter value used at the time of collection can be calculated from the collected diffusion weighted image.
- the collection function 500 of the embodiment is an example of a collection unit in the claims.
- the calculation image generation function 408 of the embodiment is an example of a generation unit of claims.
- the repetition time TR, the effective echo time TE, b value, and the inversion time TI in the embodiment are examples of parameters in the claims.
Landscapes
- Physics & Mathematics (AREA)
- Nuclear Medicine, Radiotherapy & Molecular Imaging (AREA)
- Health & Medical Sciences (AREA)
- Engineering & Computer Science (AREA)
- Signal Processing (AREA)
- Radiology & Medical Imaging (AREA)
- General Health & Medical Sciences (AREA)
- High Energy & Nuclear Physics (AREA)
- Condensed Matter Physics & Semiconductors (AREA)
- General Physics & Mathematics (AREA)
- Vascular Medicine (AREA)
- Artificial Intelligence (AREA)
- Computer Vision & Pattern Recognition (AREA)
- Magnetic Resonance Imaging Apparatus (AREA)
Abstract
Un dispositif d'imagerie par résonance magnétique selon un mode de réalisation de l'invention est équipé de : une unité de collecte qui collecte, par rapport à N types (où N est un nombre naturel de 2 ou plus) de paramètres, (N +1) ou plus images pondérées en diffusion conformément à des configurations avec des valeurs de paramètres différenciées ; et une unité de génération qui génère une image pondérée en diffusion calculée de valeurs définies arbitrairement pour les paramètres, sur la base de la relation entre les valeurs pour des paramètres définies de manière à différer entre les (N +1) ou plus images pondérées en diffusion mentionnées ci-dessus, et les valeurs de signal pour les images pondérées en diffusion collectées.
Priority Applications (2)
| Application Number | Priority Date | Filing Date | Title |
|---|---|---|---|
| CN201580002375.4A CN107949325B (zh) | 2014-12-26 | 2015-12-25 | 磁共振成像装置、扩散加权图像的生成方法以及图像处理装置 |
| US15/074,058 US10684342B2 (en) | 2014-12-26 | 2016-03-18 | MRI apparatus, image processing device, and generation method of diffusion-weighted image |
Applications Claiming Priority (2)
| Application Number | Priority Date | Filing Date | Title |
|---|---|---|---|
| JP2014264752 | 2014-12-26 | ||
| JP2014-264752 | 2014-12-26 |
Related Child Applications (1)
| Application Number | Title | Priority Date | Filing Date |
|---|---|---|---|
| US15/074,058 Continuation US10684342B2 (en) | 2014-12-26 | 2016-03-18 | MRI apparatus, image processing device, and generation method of diffusion-weighted image |
Publications (1)
| Publication Number | Publication Date |
|---|---|
| WO2016104798A1 true WO2016104798A1 (fr) | 2016-06-30 |
Family
ID=56150808
Family Applications (1)
| Application Number | Title | Priority Date | Filing Date |
|---|---|---|---|
| PCT/JP2015/086433 Ceased WO2016104798A1 (fr) | 2014-12-26 | 2015-12-25 | Dispositif d'imagerie par résonance magnétique, procédé de génération d'images pondérées en diffusion, et dispositif de traitement d'image |
Country Status (4)
| Country | Link |
|---|---|
| US (1) | US10684342B2 (fr) |
| JP (1) | JP6697261B2 (fr) |
| CN (1) | CN107949325B (fr) |
| WO (1) | WO2016104798A1 (fr) |
Families Citing this family (22)
| Publication number | Priority date | Publication date | Assignee | Title |
|---|---|---|---|---|
| JP6697261B2 (ja) * | 2014-12-26 | 2020-05-20 | キヤノンメディカルシステムズ株式会社 | 磁気共鳴イメージング装置、拡散強調画像の生成方法及び画像処理装置 |
| US10620286B2 (en) * | 2015-11-09 | 2020-04-14 | Canon Medical Systems Corporation | Magnetic resonance imaging apparatus and magnetic resonance imaging method |
| DE102016200975A1 (de) * | 2016-01-25 | 2017-07-27 | Siemens Healthcare Gmbh | Diffusionsgewichtete Magnetresonanz-Bildgebung |
| DE102016213062A1 (de) * | 2016-07-18 | 2018-01-18 | Siemens Healthcare Gmbh | Bestimmung von diffusionsgewichteten Bilddaten mit einem Magnetresonanzgerät |
| JP6815136B2 (ja) * | 2016-09-02 | 2021-01-20 | キヤノンメディカルシステムズ株式会社 | 画像処理装置 |
| KR101844514B1 (ko) * | 2016-09-02 | 2018-04-02 | 삼성전자주식회사 | 자기 공명 영상 장치 및 자기 공명 영상 획득 방법 |
| JP6734173B2 (ja) * | 2016-10-03 | 2020-08-05 | キヤノンメディカルシステムズ株式会社 | 磁気共鳴イメージング装置 |
| EP3299836B1 (fr) * | 2017-05-31 | 2024-09-25 | Siemens Healthineers AG | Correction locale de non-linéarités de gradients dans l'irm pondérée par la diffusion |
| JP7023640B2 (ja) | 2017-08-24 | 2022-02-22 | キヤノンメディカルシステムズ株式会社 | 画像処理装置及び磁気共鳴イメージング装置 |
| US20210196184A1 (en) * | 2017-09-26 | 2021-07-01 | Koninklijke Philips N.V. | Non-invasive estimation of prostate tissue composition based on multi-parametric mri data |
| DE102017219682A1 (de) * | 2017-11-06 | 2019-05-09 | Siemens Healthcare Gmbh | Erzeugung diffusionsgewichteter Bilddaten mittels eines Magnetresonanzgerätes |
| CN110313925B (zh) * | 2018-03-30 | 2023-07-04 | 萨摩亚商亚茂医疗科技有限公司 | 应用于脑部造影的显影系统及其显影方法 |
| US10712412B2 (en) * | 2018-04-23 | 2020-07-14 | Wisconsin Alumni Research Foundation | System and method for stimulated echo based mapping (STEM) using magnetic resonance imaging (MRI) |
| CN109342981B (zh) * | 2018-09-20 | 2021-10-12 | 上海东软医疗科技有限公司 | 一种基于epi序列的动态成像方法和装置 |
| CN110458834B (zh) * | 2019-02-25 | 2021-02-09 | 腾讯科技(深圳)有限公司 | 一种乳腺肿瘤图像处理系统、方法及装置 |
| JP7366575B2 (ja) * | 2019-04-11 | 2023-10-23 | キヤノンメディカルシステムズ株式会社 | 磁気共鳴イメージング装置、磁気共鳴イメージング方法及び画像処理装置 |
| CN111366600B (zh) | 2019-11-08 | 2022-02-08 | 宁波诺丁汉大学 | 一种检测水果甜度的方法、装置、系统及存储介质 |
| WO2021225444A1 (fr) * | 2020-05-08 | 2021-11-11 | Stichting Katholieke Universiteit | Imagerie irmf |
| CN112462311B (zh) * | 2020-11-09 | 2021-06-15 | 无锡鸣石峻致医疗科技有限公司 | 一种横向磁化矢量衰减时间常数的校正测量方法、装置、计算机设备及非均匀场磁共振系统 |
| JP7648390B2 (ja) | 2021-01-22 | 2025-03-18 | キヤノンメディカルシステムズ株式会社 | 磁気共鳴イメージング装置 |
| JP7706269B2 (ja) * | 2021-06-11 | 2025-07-11 | キヤノンメディカルシステムズ株式会社 | 磁気共鳴イメージング装置 |
| CN117233676B (zh) * | 2023-11-15 | 2024-03-26 | 之江实验室 | 一种回波时间依赖的磁共振扩散成像信号生成方法和装置 |
Citations (1)
| Publication number | Priority date | Publication date | Assignee | Title |
|---|---|---|---|---|
| JP2011024926A (ja) * | 2009-07-29 | 2011-02-10 | Hitachi Medical Corp | 磁気共鳴イメージング装置 |
Family Cites Families (19)
| Publication number | Priority date | Publication date | Assignee | Title |
|---|---|---|---|---|
| JPH09173315A (ja) | 1995-12-26 | 1997-07-08 | Hitachi Medical Corp | 磁気共鳴イメージング方法 |
| DE10250922B4 (de) * | 2002-10-31 | 2008-01-31 | Siemens Ag | Verfahren zur Ermittlung des ADC-Koeffizienten in der Diffusionsgewichteten Magnetresonanz-Bildgebung bei Verwendung von Steady-State-Sequenzen |
| WO2004088345A1 (fr) | 2003-03-31 | 2004-10-14 | Koninklijke Philips Electronics N.V. | Procede de visualisation de perfusion par resonance magnetique |
| US7049815B2 (en) * | 2004-01-27 | 2006-05-23 | Baker Hughes Incorporated | Method and apparatus for multi-frequency NMR diffusion measurements in the presence of internal magnetic field gradients |
| JP5127276B2 (ja) * | 2006-05-26 | 2013-01-23 | 株式会社東芝 | 画像処理装置および磁気共鳴イメージング装置 |
| US7355407B1 (en) * | 2006-12-03 | 2008-04-08 | Toshiba Medical Systems Corp. | Methods and apparatus for single-shot magnetic resonance imaging with optimized isotropic diffusion weighting |
| GB0708655D0 (en) * | 2007-05-04 | 2007-06-13 | Imp Innovations Ltd | Imaging of moving objects |
| JP5591493B2 (ja) * | 2008-07-17 | 2014-09-17 | 株式会社東芝 | 磁気共鳴イメージング装置 |
| JP5481117B2 (ja) | 2008-09-29 | 2014-04-23 | 株式会社東芝 | 磁気共鳴診断装置およびその制御方法 |
| WO2010116782A1 (fr) * | 2009-03-30 | 2010-10-14 | 株式会社 日立製作所 | Dispositif de résonance magnétique |
| JP2012040362A (ja) | 2010-07-23 | 2012-03-01 | Toshiba Corp | 磁気共鳴イメージング方法、磁気共鳴イメージング装置およびその制御装置 |
| JP6552789B2 (ja) * | 2013-04-04 | 2019-07-31 | キヤノンメディカルシステムズ株式会社 | 磁気共鳴イメージング装置 |
| US9606210B2 (en) * | 2013-09-04 | 2017-03-28 | Toshiba Medical Systems Corporation | Magnetic resonance imaging apparatus and magnetic resonance imaging method |
| WO2015033725A1 (fr) * | 2013-09-09 | 2015-03-12 | 株式会社日立メディコ | Appareil d'imagerie par résonance magnétique et procédé de mesure d'informations de température |
| JP6523730B2 (ja) * | 2014-04-24 | 2019-06-05 | キヤノンメディカルシステムズ株式会社 | 磁気共鳴イメージング装置 |
| US10234528B2 (en) * | 2014-09-18 | 2019-03-19 | Siemens Aktiengesellschaft | Method and apparatus to correct noise effects in quantitative techniques in magnetic resonance imaging |
| JP6697261B2 (ja) * | 2014-12-26 | 2020-05-20 | キヤノンメディカルシステムズ株式会社 | 磁気共鳴イメージング装置、拡散強調画像の生成方法及び画像処理装置 |
| JP6280881B2 (ja) * | 2015-02-17 | 2018-02-14 | ジーイー・メディカル・システムズ・グローバル・テクノロジー・カンパニー・エルエルシー | スキャン条件決定装置、磁気共鳴装置、スキャン条件決定方法、およびプログラム |
| US10620286B2 (en) * | 2015-11-09 | 2020-04-14 | Canon Medical Systems Corporation | Magnetic resonance imaging apparatus and magnetic resonance imaging method |
-
2015
- 2015-12-25 JP JP2015254507A patent/JP6697261B2/ja active Active
- 2015-12-25 CN CN201580002375.4A patent/CN107949325B/zh active Active
- 2015-12-25 WO PCT/JP2015/086433 patent/WO2016104798A1/fr not_active Ceased
-
2016
- 2016-03-18 US US15/074,058 patent/US10684342B2/en active Active
Patent Citations (1)
| Publication number | Priority date | Publication date | Assignee | Title |
|---|---|---|---|---|
| JP2011024926A (ja) * | 2009-07-29 | 2011-02-10 | Hitachi Medical Corp | 磁気共鳴イメージング装置 |
Non-Patent Citations (4)
| Title |
|---|
| JE SIMON ET AL.: "Diffusion-weighted Imaging (DWI) and Fluid-inversion Prepared Diffusion Imaging (FLIPD) in Acute Stroke", PROC. INTL. SOC. MAG. RESON. MED., vol. 10, no. 1103, May 2002 (2002-05-01) * |
| M. BLACKLEDGE ET AL.: "Computed diffusion weighted imaging (cDWI) for improving imaging contrast", PROC. INTL. SOC. MAG. RESON. MED., vol. 17, no. 4005, April 2009 (2009-04-01) * |
| TOKUNORI KIMURA ET AL.: "Computed diffusion weighted imaging under rician noise distribution", PROC. INTL. SOC. MAG. RESON. MED., vol. 20, no. 3574, May 2012 (2012-05-01) * |
| XIU-ZHONG YAO ET AL.: "Comparison of diffusion- weighted MRI acquisition techniques for normal pancreas at 3.0 Tesla", DIAGNOSTIC AND INTERVENTIONAL RADIOLOGY, vol. 20, no. 5, 19 June 2014 (2014-06-19), pages 368 - 373 * |
Also Published As
| Publication number | Publication date |
|---|---|
| JP6697261B2 (ja) | 2020-05-20 |
| US20160202338A1 (en) | 2016-07-14 |
| JP2016123865A (ja) | 2016-07-11 |
| US10684342B2 (en) | 2020-06-16 |
| CN107949325B (zh) | 2022-02-15 |
| CN107949325A (zh) | 2018-04-20 |
Similar Documents
| Publication | Publication Date | Title |
|---|---|---|
| JP6697261B2 (ja) | 磁気共鳴イメージング装置、拡散強調画像の生成方法及び画像処理装置 | |
| JP6809819B2 (ja) | 磁気共鳴イメージング装置及び画像処理装置 | |
| CN106019190B (zh) | 速度补偿的扩散敏感化的扩散成像 | |
| US8228063B2 (en) | Magnetic resonance imaging apparatus and magnetic resonance imaging method | |
| CN103969611B (zh) | 用于运行磁共振系统的方法和控制装置 | |
| US9687172B2 (en) | System for motion corrected MR diffusion imaging | |
| CN102772210B (zh) | 弥散加权磁共振成像 | |
| US8797031B2 (en) | MR imaging system for discriminating between imaged tissue types | |
| EP1975638A2 (fr) | IRM utilisant SSFP avec préparation de la magnétisation | |
| US20080071167A1 (en) | Magnetic-resonance image diagnostic apparatus and method of controlling the same | |
| Pipe | Pulse sequences for diffusion-weighted MRI | |
| CN102217935B (zh) | 用于产生血管造影的磁共振图像的方法 | |
| JP6045793B2 (ja) | 磁気共鳴撮像装置 | |
| JP2008136871A (ja) | 最適化された等方性拡散強調を伴うシングルショット磁気共鳴イメージングのための装置および方法 | |
| CN113544527A (zh) | 具有失真校正的epi mr成像 | |
| WO2002053031A1 (fr) | Appareil et procede d'imagerie par resonance magnetique | |
| US6586933B1 (en) | Method and system for MRI with lipid suppression | |
| US9772390B2 (en) | Magnetic resonance imaging device and method for generating image using same | |
| JP6333898B2 (ja) | 磁気共鳴撮像装置 | |
| JP7706269B2 (ja) | 磁気共鳴イメージング装置 | |
| WO2020212294A1 (fr) | Pondération de susceptibilité à partir d'une imagerie par résonance magnétique à contraste de phase | |
| JPH09238912A (ja) | 磁気共鳴イメージング装置 | |
| JP2022016312A (ja) | 磁気共鳴イメージング装置及び磁気共鳴イメージング方法 | |
| von Mengershausen et al. | 3D Diffusion Tenosr Imaging with 2D Navigated and Online Motion Corrected RARE |
Legal Events
| Date | Code | Title | Description |
|---|---|---|---|
| 121 | Ep: the epo has been informed by wipo that ep was designated in this application |
Ref document number: 15873366 Country of ref document: EP Kind code of ref document: A1 |
|
| NENP | Non-entry into the national phase |
Ref country code: DE |
|
| 122 | Ep: pct application non-entry in european phase |
Ref document number: 15873366 Country of ref document: EP Kind code of ref document: A1 |