WO2016157624A1 - Appareil d'observation par ultrasons, procédé de fonctionnement de l'appareil d'observation par ultrasons et programme de fonctionnement pour l'appareil d'observation par ultrasons - Google Patents
Appareil d'observation par ultrasons, procédé de fonctionnement de l'appareil d'observation par ultrasons et programme de fonctionnement pour l'appareil d'observation par ultrasons Download PDFInfo
- Publication number
- WO2016157624A1 WO2016157624A1 PCT/JP2015/083938 JP2015083938W WO2016157624A1 WO 2016157624 A1 WO2016157624 A1 WO 2016157624A1 JP 2015083938 W JP2015083938 W JP 2015083938W WO 2016157624 A1 WO2016157624 A1 WO 2016157624A1
- Authority
- WO
- WIPO (PCT)
- Prior art keywords
- feature amount
- attenuation rate
- ultrasonic
- frequency
- attenuation
- Prior art date
- Legal status (The legal status is an assumption and is not a legal conclusion. Google has not performed a legal analysis and makes no representation as to the accuracy of the status listed.)
- Ceased
Links
Images


Classifications
-
- A—HUMAN NECESSITIES
- A61—MEDICAL OR VETERINARY SCIENCE; HYGIENE
- A61B—DIAGNOSIS; SURGERY; IDENTIFICATION
- A61B8/00—Diagnosis using ultrasonic, sonic or infrasonic waves
- A61B8/52—Devices using data or image processing specially adapted for diagnosis using ultrasonic, sonic or infrasonic waves
- A61B8/5269—Devices using data or image processing specially adapted for diagnosis using ultrasonic, sonic or infrasonic waves involving detection or reduction of artifacts
-
- A—HUMAN NECESSITIES
- A61—MEDICAL OR VETERINARY SCIENCE; HYGIENE
- A61B—DIAGNOSIS; SURGERY; IDENTIFICATION
- A61B8/00—Diagnosis using ultrasonic, sonic or infrasonic waves
- A61B8/52—Devices using data or image processing specially adapted for diagnosis using ultrasonic, sonic or infrasonic waves
- A61B8/5207—Devices using data or image processing specially adapted for diagnosis using ultrasonic, sonic or infrasonic waves involving processing of raw data to produce diagnostic data, e.g. for generating an image
-
- A—HUMAN NECESSITIES
- A61—MEDICAL OR VETERINARY SCIENCE; HYGIENE
- A61B—DIAGNOSIS; SURGERY; IDENTIFICATION
- A61B8/00—Diagnosis using ultrasonic, sonic or infrasonic waves
- A61B8/12—Diagnosis using ultrasonic, sonic or infrasonic waves in body cavities or body tracts, e.g. by using catheters
-
- A—HUMAN NECESSITIES
- A61—MEDICAL OR VETERINARY SCIENCE; HYGIENE
- A61B—DIAGNOSIS; SURGERY; IDENTIFICATION
- A61B8/00—Diagnosis using ultrasonic, sonic or infrasonic waves
- A61B8/13—Tomography
- A61B8/14—Echo-tomography
-
- A—HUMAN NECESSITIES
- A61—MEDICAL OR VETERINARY SCIENCE; HYGIENE
- A61B—DIAGNOSIS; SURGERY; IDENTIFICATION
- A61B8/00—Diagnosis using ultrasonic, sonic or infrasonic waves
- A61B8/46—Ultrasonic, sonic or infrasonic diagnostic devices with special arrangements for interfacing with the operator or the patient
- A61B8/461—Displaying means of special interest
Definitions
- the present invention relates to an ultrasonic observation apparatus that observes a tissue to be observed using ultrasonic waves, an operation method of the ultrasonic observation apparatus, and an operation program of the ultrasonic observation apparatus.
- Ultrasound may be applied to observe the characteristics of the biological tissue or material that is the object of observation. Specifically, ultrasonic waves are transmitted to the observation target, and predetermined signal processing is performed on the ultrasonic echoes reflected by the observation target, thereby acquiring information related to the characteristics of the observation target.
- the intensity of ultrasonic waves is attenuated when propagating through the observation target.
- a technique for determining characteristics of a material to be observed using this attenuation is known (see, for example, Patent Document 1).
- an electrical signal corresponding to an ultrasonic echo is converted into an amplitude spectrum in the frequency domain, and the attenuation is calculated by comparing the amplitude spectrum with a predetermined reference amplitude spectrum.
- the material properties are determined by fitting with a dependent attenuation model.
- the reference amplitude spectrum is made of a material that has the same shape as the observation target and has an ultrasonic velocity equivalent to that of the observation target, but substantially does not attenuate the ultrasonic wave. It is set using a reference object (reference piece).
- the method for determining the characteristics of the observation target using the reference amplitude spectrum set in this way is effective in the case of a material having a regular structure, but is applied to a biological tissue in which the structure itself is irregular. Difficult to do.
- the present invention has been made in view of the above, and it is possible to obtain an attenuation characteristic of an ultrasonic wave suitable for an observation object by simple calculation and to perform an observation using the attenuation characteristic.
- An object is to provide an observation apparatus, an operation method of an ultrasonic observation apparatus, and an operation program of the ultrasonic observation apparatus.
- the ultrasonic observation apparatus converts an ultrasonic echo reflected by the observation target into an electrical signal.
- a frequency analysis unit that calculates a plurality of frequency spectra by analyzing the frequency of a signal generated based on an echo signal; and a feature amount of each of the plurality of frequency spectra is calculated, and the ultrasonic wave propagates through the observation target
- the at least three attenuation rate candidate values that give different attenuation characteristics when performing the attenuation correction for eliminating the influence of the attenuation of the ultrasonic wave on the feature amount of each frequency spectrum
- the ultrasonic observation apparatus is the ultrasonic observation apparatus according to the above aspect, wherein the feature amount calculation unit uses data having a dynamic range wider than a dynamic range of data used by the feature amount image data generation unit. It is characterized by setting.
- the feature amount calculation unit calculates the feature amount by performing a process of approximating each frequency spectrum by an n-order equation (n is a positive integer). It is characterized by that.
- the feature amount calculation unit approximates a predetermined frequency band in the frequency spectrum by a linear expression, an intercept and an inclination of the linear expression, and an intermediate between the frequency bands.
- One or more of the mid-band fits that are values of the linear expression at a frequency, including one of the slope and the mid-band fit, is calculated as the feature amount, and either the slope or the mid-band fit is calculated.
- the optimum attenuation rate is set based on one of the above.
- the optimum attenuation rate is set based on the inclination, and the midband fit is performed. Is calculated as the feature amount, the optimum attenuation rate is set based on the midband fit.
- the ultrasonic observation apparatus is characterized in that, in the above invention, the feature amount calculation unit sets the optimum attenuation rate in all frames of the ultrasonic image.
- the feature amount calculation unit sets the optimal attenuation rate for each predetermined number of frames larger than 1 of the ultrasonic image, and sets the optimal attenuation rate. For a frame that is not set, the feature amount of each frequency spectrum is calculated using the optimum attenuation rate that was set last before the frame.
- the feature amount calculation unit calculates an optimum attenuation rate equivalent value corresponding to the optimum attenuation rate in all frames of the ultrasound image, and is greater than 1.
- the optimum attenuation rate is set based on the value corresponding to the optimum attenuation rate calculated in a predetermined number of frames.
- the ultrasonic observation apparatus is characterized in that, in the above invention, the feature image data includes information on the optimum attenuation rate.
- the ultrasonic observation apparatus is characterized in that, in the above-mentioned invention, the ultrasonic observation apparatus further includes a display unit for displaying a feature image corresponding to the feature image data.
- the ultrasonic observation apparatus further includes an input unit that receives a setting input of a target region in which the frequency analysis unit calculates the frequency spectrum in the above invention, and the frequency analysis unit is reflected by the target region.
- the frequency spectrum is calculated based on the ultrasonic echo.
- the operation method of the ultrasonic observation apparatus includes a frequency of a signal generated on the basis of an echo signal obtained by converting an ultrasonic echo reflected by the observation target into an electric signal.
- the correction feature quantity of each frequency spectrum is calculated by performing attenuation correction that eliminates the influence of the attenuation of the ultrasonic wave on the feature quantity of each frequency spectrum.
- a secondary function based on the statistical variation is calculated.
- a feature amount calculating step for setting an attenuation rate candidate value having the smallest statistical variation in the quadratic function as an optimal attenuation rate, and a feature amount image data generation unit sets the optimal attenuation rate to A feature amount image data generating step of generating feature amount image data to be displayed together with the ultrasonic image generated from the echo signal in association with the corrected feature amount based on visual information.
- the operation program of the ultrasonic observation apparatus includes a frequency of a signal generated on the basis of an echo signal obtained by converting an ultrasonic echo reflected by the observation target into an electric signal.
- the frequency analysis procedure for calculating a plurality of frequency spectra by analyzing the frequency, and the feature amount calculation unit respectively calculate the feature amounts of the plurality of frequency spectra, and are different from each other when the ultrasonic wave propagates through the observation target.
- the correction feature quantity of each frequency spectrum is calculated by performing attenuation correction that eliminates the influence of the attenuation of the ultrasonic wave on the feature quantity of each frequency spectrum.
- the present invention it is possible to obtain the attenuation characteristic of the ultrasonic wave suitable for the observation target by simple calculation, and to perform the observation using the attenuation characteristic.
- FIG. 1 is a block diagram showing a configuration of an ultrasonic observation system provided with an ultrasonic observation apparatus according to an embodiment of the present invention.
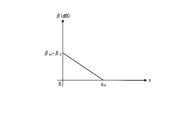
- FIG. 2 is a diagram illustrating a relationship between the reception depth and the amplification factor in the amplification processing performed by the signal amplification unit of the ultrasonic observation apparatus according to the embodiment of the present invention.
- FIG. 3 is a diagram illustrating a relationship between the reception depth and the amplification factor in the amplification correction process performed by the amplification correction unit of the ultrasonic observation apparatus according to the embodiment of the present invention.
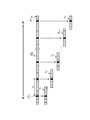
- FIG. 4 is a diagram schematically showing a data array in one sound ray of the ultrasonic signal.
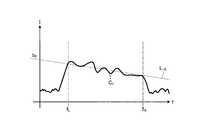
- FIG. 5 is a diagram illustrating an example of a frequency spectrum calculated by the frequency analysis unit of the ultrasonic observation apparatus according to the embodiment of the present invention.
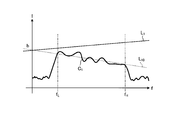
- FIG. 6 is a diagram showing a straight line having as a parameter the correction feature amount corrected by the attenuation correction unit of the ultrasonic observation apparatus according to the embodiment of the present invention.
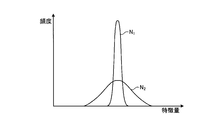
- FIG. 7 is a diagram schematically illustrating a distribution example of correction feature amounts that have been attenuation-corrected based on two different attenuation rate candidate values for the same observation target.
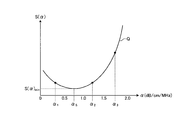
- FIG. 8 is a diagram schematically showing the relationship between the attenuation rate candidate value and the variance of the corrected feature amount that has been attenuation-corrected based on the attenuation rate candidate value.
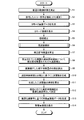
- FIG. 9 is a flowchart showing an outline of processing performed by the ultrasonic observation apparatus according to the embodiment of the present invention.
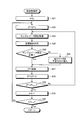
- FIG. 10 is a flowchart showing an outline of processing executed by the frequency analysis unit of the ultrasonic observation apparatus according to the embodiment of the present invention.
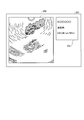
- FIG. 11 is a diagram schematically illustrating a display example of the feature amount image in the display device of the ultrasonic observation apparatus system according to the embodiment of the present invention.
- FIG. 1 is a block diagram showing a configuration of an ultrasonic observation system provided with an ultrasonic observation apparatus according to an embodiment of the present invention.
- An ultrasonic observation system 1 shown in FIG. 1 transmits an ultrasonic wave to a subject to be observed and receives an ultrasonic wave reflected by the subject, and an ultrasonic endoscope 2.
- an ultrasonic observation device 3 that generates an ultrasonic image based on the ultrasonic signal acquired by the, and a display device 4 that displays the ultrasonic image generated by the ultrasonic observation device 3.
- the ultrasonic endoscope 2 converts an electrical pulse signal received from the ultrasonic observation device 3 into an ultrasonic pulse (acoustic pulse) and irradiates the subject at the tip thereof, and is reflected by the subject.
- the ultrasonic transducer 21 converts the ultrasonic echo into an electrical echo signal expressed by a voltage change and outputs it.
- the ultrasonic endoscope 2 usually has an imaging optical system and an imaging device, and is inserted into a digestive tract (esophagus, stomach, duodenum, large intestine) or respiratory organ (trachea / bronchi) of a subject for digestion. It is possible to image a tube, respiratory organ, and surrounding organs (pancreas, gallbladder, bile duct, biliary tract, lymph node, mediastinal organ, blood vessel, etc.).
- the ultrasonic endoscope 2 has a light guide that guides illumination light to be irradiated onto the subject during imaging.
- the light guide has a distal end portion that reaches the distal end of the insertion portion of the ultrasonic endoscope 2 into the subject, and a proximal end portion that is connected to a light source device that generates illumination light.
- the ultrasonic observation device 3 is electrically connected to the ultrasonic endoscope 2 and transmits a transmission signal (pulse signal) including a high voltage pulse to the ultrasonic transducer 21 based on a predetermined waveform and transmission timing.
- a transmitter / receiver 31 that receives an echo signal that is an electrical reception signal from the ultrasonic transducer 21 and generates and outputs digital radio frequency (RF) data (hereinafter referred to as RF data);
- RF data digital radio frequency
- a signal processing unit 32 that generates digital B-mode reception data based on the RF data received from the unit 31; a calculation unit 33 that performs predetermined calculations on the RF data received from the transmission / reception unit 31;
- An image processing unit 34 that generates data, and an input unit that is implemented using a user interface such as a keyboard, a mouse, and a touch panel, and receives input of various types of information It includes a 5, a control unit 36 for controlling the entire ultrasound observation system 1, a storage unit 37 that stores various information
- the transmission / reception unit 31 includes a signal amplification unit 311 that amplifies the echo signal.
- the signal amplification unit 311 performs STC (Sensitivity Time Control) correction in which an echo signal having a larger reception depth is amplified with a higher amplification factor.
- FIG. 2 is a diagram illustrating the relationship between the reception depth and the amplification factor in the amplification process performed by the signal amplification unit 311.
- the reception depth z shown in FIG. 2 is an amount calculated based on the elapsed time from the reception start point of the ultrasonic wave. As shown in FIG.
- the amplification factor ⁇ (dB) increases linearly from ⁇ 0 to ⁇ th (> ⁇ 0 ) as the reception depth z increases.
- the amplification factor ⁇ (dB) takes a constant value ⁇ th when the reception depth z is equal to or greater than the threshold value z th .
- the value of the threshold value z th is such a value that the ultrasonic signal received from the observation target is almost attenuated and the noise becomes dominant. More generally, when the reception depth z is smaller than the threshold value z th , the amplification factor ⁇ may increase monotonously as the reception depth z increases.
- the relationship shown in FIG. 2 is stored in the storage unit 37 in advance.
- the transmission / reception unit 31 performs processing such as filtering on the echo signal amplified by the signal amplification unit 311 and then performs A / D conversion to generate time domain RF data, and the signal processing unit 32 and the calculation unit To 33.
- the transmission / reception unit 31 includes a plurality of beams for beam synthesis corresponding to the plurality of elements.
- a channel circuit is included.
- the frequency band of the pulse signal transmitted by the transmission / reception unit 31 may be a wide band that substantially covers the linear response frequency band of the electroacoustic conversion of the pulse signal to the ultrasonic pulse in the ultrasonic transducer 21.
- the various processing frequency bands of the echo signal in the signal amplifying unit 311 may be a wide band that substantially covers the linear response frequency band of the acoustoelectric conversion of the ultrasonic transducer 21 into the echo signal of the ultrasonic echo. Accordingly, it is possible to perform accurate approximation when performing frequency spectrum approximation processing, which will be described later.
- the transmission / reception unit 31 transmits various control signals output from the control unit 36 to the ultrasonic endoscope 2 and receives various types of information including an identification ID from the ultrasonic endoscope 2 and receives the control unit 36. It also has a function to transmit to.
- the signal processing unit 32 performs known processing such as band-pass filter, envelope detection, and logarithmic conversion on the RF data to generate digital B-mode reception data. In logarithmic conversion, the common logarithm of the amount obtained by dividing the RF data by the reference voltage V c is taken and expressed as a decibel value.
- the signal processing unit 32 outputs the generated B-mode reception data to the image processing unit 34.
- the signal processing unit 32 is realized using a CPU (Central Processing Unit), various arithmetic circuits, and the like.
- the calculation unit 33 performs amplification correction on the RF data generated by the transmission / reception unit 31 so as to make the amplification factor ⁇ constant regardless of the reception depth, and fast Fourier transform on the RF data subjected to the amplification correction.
- a frequency analysis unit 332 that calculates a frequency spectrum by performing frequency analysis by applying (FFT: Fast Fourier Transform), and a feature amount calculation unit 333 that calculates a feature amount of the frequency spectrum.
- the calculation unit 33 is realized using a CPU (Central Processing Unit), various calculation circuits, and the like.
- FIG. 3 is a diagram illustrating a relationship between the reception depth and the amplification factor in the amplification correction process performed by the amplification correction unit 331.
- the amplification rate ⁇ (dB) in the amplification process performed by the amplification correction unit 331 takes the maximum value ⁇ th ⁇ 0 when the reception depth z is zero, and the reception depth z is zero to the threshold value z th. Decreases linearly until reaching 0 and is zero when the reception depth z is greater than or equal to the threshold z th .
- the amplification correction unit 331 amplifies and corrects the digital RF signal with the amplification factor determined in this way, thereby canceling the influence of the STC correction in the signal processing unit 32 and outputting a signal with a constant amplification factor ⁇ th. .
- the relationship between the reception depth z and the amplification factor ⁇ performed by the amplification correction unit 331 differs depending on the relationship between the reception depth and the amplification factor in the signal processing unit 32.
- STC correction is a correction process that eliminates the influence of attenuation from the amplitude of the analog signal waveform by amplifying the amplitude of the analog signal waveform uniformly over the entire frequency band and with a gain that monotonously increases with respect to the depth. is there. For this reason, when generating a B-mode image to be displayed by converting the amplitude of the echo signal into luminance, and when scanning a uniform tissue, the luminance value is constant regardless of the depth by performing STC correction. become. That is, an effect of eliminating the influence of attenuation from the luminance value of the B-mode image can be obtained.
- the STC correction cannot accurately eliminate the influence of attenuation accompanying the propagation of the ultrasonic wave. This is because, although the attenuation amount generally varies depending on the frequency (see Equation (1) described later), the STC correction amplification factor changes only according to the distance and has no frequency dependence.
- the amplification correction unit 331 Correct the gain.
- the frequency analysis unit 332 samples the RF data (line data) of each sound ray amplified and corrected by the amplification correction unit 331 at a predetermined time interval to generate sample data.
- the frequency analysis unit 332 calculates a frequency spectrum at a plurality of locations (data positions) on the RF data by performing FFT processing on the sample data group.
- FIG. 4 is a diagram schematically showing a data array in one sound ray of the ultrasonic signal.
- a white or black rectangle means data at one sample point.
- the data located on the right side is sample data from a deeper location when measured along the sound ray SR k from the ultrasonic transducer 21.
- the sound ray SR k is discretized at a time interval corresponding to a sampling frequency (for example, 50 MHz) in A / D conversion performed by the transmission / reception unit 31.
- FIG. 1 a sampling frequency
- a sample data group needs to have a power number of 2 data.
- a process for generating a normal sample data group is performed by inserting zero data in an insufficient amount. This point will be described in detail when the processing of the frequency analysis unit 332 is described (see FIG. 9).
- FIG. 5 is a diagram illustrating an example of a frequency spectrum calculated by the frequency analysis unit 332.
- the “frequency spectrum” means “frequency distribution of intensity at a certain reception depth z” obtained by subjecting the sample data group to FFT processing.
- intensity refers to parameters such as the voltage of the echo signal, the power of the echo signal, the sound pressure of the ultrasonic echo, the acoustic energy of the ultrasonic echo, the amplitude and time integral value of these parameters, and combinations thereof. Points to either.
- the horizontal axis is the frequency f.
- the lower limit frequency f L and the upper limit frequency f H of the frequency band used for the subsequent calculation are the frequency band of the ultrasonic transducer 21 and the frequency band of the pulse signal transmitted by the transmitting / receiving unit 31. It is a parameter determined based on the above.
- the frequency band determined by the lower limit frequency f L and the upper limit frequency f H is referred to as “frequency band U”.
- the frequency spectrum shows a tendency that varies depending on the properties of the living tissue scanned with ultrasonic waves. This is because the frequency spectrum has a correlation with the size, number density, acoustic impedance, and the like of the scatterer that scatters ultrasonic waves.
- the “characteristics of the biological tissue” referred to here includes, for example, malignant tumor (cancer), benign tumor, endocrine tumor, mucinous tumor, normal tissue, cyst, vascular vessel and the like.
- the feature amount calculation unit 333 calculates the feature amounts of the plurality of frequency spectra, respectively.
- the feature amount calculation unit 333 A correction feature amount of each frequency spectrum is calculated by performing attenuation correction that eliminates the influence of ultrasonic attenuation on the amount (hereinafter referred to as a pre-correction feature amount), and a plurality of attenuation rates are calculated using the correction feature amount.
- the optimal attenuation rate is set for the observation target from the candidate values.
- the feature amount calculation unit 333 includes an approximation unit 333a that calculates a pre-correction feature amount of the frequency spectrum by approximating the frequency spectrum with a straight line, and a plurality of attenuation rate candidate values for the pre-correction feature amount calculated by the approximation unit 333a.
- Attenuation correction unit 333b that calculates a correction feature amount by performing attenuation correction based on each of the above, and a plurality of variations based on statistical variation of the correction feature amount calculated for all frequency spectra by attenuation correction unit 333b
- An optimum attenuation rate setting unit 333c for setting an optimum attenuation rate from among the attenuation rate candidate values.
- the approximating unit 333a performs a regression analysis of the frequency spectrum in a predetermined frequency band and approximates the frequency spectrum with a linear expression (regression line), thereby calculating a pre-correction feature quantity characterizing the approximated primary expression. For example, in the case of the frequency spectrum C 1 shown in FIG. 5, the approximating unit 333a obtains a regression line L 10 by performing regression analysis in the frequency band U and approximating the frequency spectrum C 1 with a linear expression.
- (Mid-band fit) c 0 a 0 f M + b 0 is calculated as a feature amount before correction.
- the slope a 0 has a correlation with the size of the ultrasonic scatterer, and it is generally considered that the larger the scatterer, the smaller the slope.
- the intercept b 0 has a correlation with the size of the scatterer, the difference in acoustic impedance, the number density (concentration) of the scatterer, and the like. Specifically, the intercept b 0 has a larger value as the scatterer is larger, has a larger value as the difference in acoustic impedance is larger, and has a larger value as the number density of the scatterers is larger.
- the mid-band fit c 0 is an indirect parameter derived from the slope a 0 and the intercept b 0 and gives the intensity of the spectrum at the center in the effective frequency band. Therefore, the midband fit c 0 is considered to have a certain degree of correlation with the brightness of the B-mode image in addition to the size of the scatterer, the difference in acoustic impedance, and the number density of the scatterers. Note that the feature amount calculation unit 333 may approximate the frequency spectrum with a second-order or higher polynomial by regression analysis.
- the ultrasonic attenuation A (f, z) is attenuation that occurs while the ultrasonic waves reciprocate between the reception depth 0 and the reception depth z, and the intensity change before and after the reciprocation (difference in decibel expression). ).
- the attenuation amount A (f, z) is empirically known to be proportional to the frequency in a uniform tissue, and is expressed by the following equation (1).
- a (f, z) 2 ⁇ zf (1)
- the proportionality constant ⁇ is an amount called an attenuation rate.
- Z is the ultrasonic reception depth
- f is the frequency.
- the attenuation correction unit 333b performs attenuation correction on each of a plurality of attenuation rate candidate values in order to set the most suitable attenuation rate (optimum attenuation rate). Details of the plurality of attenuation rate candidate values will be described later with reference to FIG.
- the attenuation correction unit 333b performs attenuation correction according to the following equations (2) to (4) with respect to the pre-correction feature values (slope a 0 , intercept b 0 , midband fit c 0 ) extracted by the approximation unit 333a. By doing so, the correction feature amounts a, b, and c are calculated.
- the attenuation correction unit 333b performs correction with a larger correction amount as the ultrasonic reception depth z is larger.
- the correction related to the intercept is an identity transformation. This is because the intercept is a frequency component corresponding to a frequency of 0 (Hz) and is not affected by attenuation.
- FIG. 6 is a diagram illustrating a straight line having the correction feature amounts a, b, and c corrected by the attenuation correction unit 333b as parameters.
- the optimum attenuation rate setting unit 333c sets, as the optimum attenuation rate, the attenuation rate candidate value with the smallest statistical variation of the correction feature amount calculated for each attenuation rate candidate value by the attenuation correction unit 333b with respect to all frequency spectra. Set. In this embodiment, dispersion is applied as an amount indicating statistical variation. In this case, the optimum attenuation rate setting unit 333c sets the attenuation rate candidate value that minimizes the variance as the optimum attenuation rate. Two of the three correction feature values a, b, and c described above are independent. In addition, the correction feature amount b does not depend on the attenuation rate. Therefore, when setting an optimum attenuation rate for the correction feature amounts a and c, the optimum attenuation rate setting unit 333c may calculate the variance of one of the correction feature amounts a and c.
- the correction feature amount used when the optimum attenuation rate setting unit 333c sets the optimum attenuation rate is the same type as the correction feature amount used when the feature amount image data generation unit 342 generates the feature amount image data. It is preferable. That is, when the feature amount image data generation unit 342 generates the feature amount image data using the inclination as the correction feature amount, the distribution of the correction feature amount a is applied, and the feature amount image data generation unit 342 applies the midpoint as the correction feature amount. When generating feature amount image data using band fitting, it is more preferable to apply the variance of the corrected feature amount c. This is because the equation (1) that gives the attenuation amount A (f, z) is merely ideal, and the following equation (6) is more appropriate in reality.
- the reason why the optimum attenuation rate can be set based on statistical variation will be described.
- the feature amount is converged to a value unique to the observation target regardless of the distance between the observation target and the ultrasonic transducer 21, and the statistical variation is considered to be small.
- the attenuation rate candidate value that does not match the observation target is set as the optimal attenuation rate, the attenuation correction is excessive or insufficient, and thus the feature amount is shifted depending on the distance from the ultrasonic transducer 21. It is considered that the statistical variation of the feature amount is increased. Therefore, it can be said that the attenuation rate candidate value having the smallest statistical variation is the optimum attenuation rate for the observation target.
- FIG. 7 is a diagram schematically illustrating a distribution example of correction feature amounts that have been attenuation-corrected based on two different attenuation rate candidate values for the same observation target.
- the horizontal axis is the correction feature amount
- the vertical axis is the frequency.
- the two distribution curves N 1 and N 2 shown in FIG. 7 have the same total frequency.
- the distribution curve N 1 has a smaller statistical variation in feature quantity (small variance) and a steep mountain compared to the distribution curve N 2 .
- the optimum attenuation rate setting unit 333c sets an optimum attenuation rate from the two attenuation rate candidate values corresponding to the two distribution curves N 1 and N 2 , the attenuation rate candidate value corresponding to the distribution curve N 1 is set. Is set as the optimum attenuation factor.
- the optimum attenuation rate setting unit 333c is generated based on the variance of the correction feature quantity c that has been attenuation-corrected based on a plurality (three in this embodiment) of attenuation rate candidate values. A minimum value (extreme value) in the next function is obtained, and an attenuation candidate value corresponding to the extreme value is set as an optimum attenuation rate.
- three attenuation candidate values are stored in advance in the storage unit 37, and the optimum attenuation rate setting unit 333c determines the three attenuation rate candidate values. Use to set the optimum attenuation factor.
- the attenuation rate candidate values ⁇ 1 , ⁇ 2 , and ⁇ 3 are values of 0.0 or more, and when the observation target is a biological tissue, the attenuation rate of the biological tissue is generally around 0.6. It is preferable that the smallest attenuation rate candidate value among the attenuation candidate values is 0.6 or less, and the largest value is 0.6 or more.
- FIG. 8 shows attenuation rate candidate values ⁇ 1 , ⁇ 2 , and ⁇ 3, and dispersions S ( ⁇ 1 ) and S of corrected feature values that are attenuated based on the attenuation rate candidate values ⁇ 1 , ⁇ 2 , and ⁇ 3 , respectively. It is a figure which shows typically the relationship with the quadratic function Q produced
- the optimum attenuation rate setting unit 333c includes variances S ( ⁇ 1 ), S ( ⁇ 2 ), and S ( ⁇ 2 ), correction feature amount c corrected for attenuation based on preset attenuation rate candidate values ⁇ 1 , ⁇ 2 , and ⁇ 3 .
- the optimum attenuation rate setting unit 333c obtains the extreme value of the generated quadratic function Q, and sets the attenuation rate candidate value ⁇ S corresponding to the extreme value as the optimum attenuation rate.
- V a ( ⁇ ) is a positive value. Therefore, V a ( ⁇ ) is also a downward convex quadratic function.
- the image processing unit 34 converts the amplitude of the echo signal into luminance and displays the B-mode image data generation unit 341 that generates B-mode image data that is an ultrasonic image to be displayed, and the optimum attenuation rate setting unit 333c. And a feature amount image data generation unit 342 that generates feature amount image data to be displayed together with the B-mode image in association with the feature amount based on the attenuation rate.
- the B-mode image data generation unit 341 performs signal processing using known techniques such as gain processing and contrast processing on the B-mode reception data received from the signal processing unit 32, and displays an image on the display device 4.
- B-mode image data is generated by thinning out data according to the data step width determined according to the range.
- the B-mode image is a grayscale image in which values of R (red), G (green), and B (blue), which are variables when the RGB color system is adopted as a color space, are matched.
- the B-mode image data generation unit 341 performs coordinate conversion for rearranging the B-mode reception data from the signal processing unit 32 so that the scanning range can be spatially represented correctly, and then performs interpolation processing between the B-mode reception data. As a result, the gaps between the B-mode reception data are filled, and B-mode image data is generated.
- the B-mode image data generation unit 341 outputs the generated B-mode image data to the feature amount image data generation unit 342.
- the feature amount image data generation unit 342 generates a feature amount image by associating a hue as visual information with any one of the above-described inclination, intercept, and midband fit, for example.
- the feature amount image data generation unit 342 generates the feature amount image data by associating the hue with one of the two feature amounts selected from the inclination, the intercept, and the midband fit, and by associating the light and dark with the other. May be.
- visual information related to the feature amount for example, variables in a color space constituting a predetermined color system such as hue, saturation, brightness, luminance value, R (red), G (green), and B (blue) are included. Can be mentioned.
- the control unit 36 is realized using a CPU (Central Processing Unit) having various calculation and control functions, various arithmetic circuits, and the like.
- the control unit 36 controls the ultrasonic observation apparatus 3 in an integrated manner by reading information stored and stored in the storage unit 37 from the storage unit 37 and executing various arithmetic processes related to the operation method of the ultrasonic observation apparatus 3. To do.
- the control unit 36 may be configured using a CPU or the like common to the signal processing unit 32 and the calculation unit 33.
- the storage unit 37 includes attenuation rate candidate values ⁇ 1 , ⁇ 2 , ⁇ 3 , a plurality of feature amounts calculated by the attenuation correction unit 333 b for each frequency spectrum in accordance with the attenuation rate candidate values, and statistical information on the plurality of feature amounts.
- a feature amount information storage unit 371 for storing a dispersion giving a large variation in association with an attenuation rate candidate value.
- the storage unit 37 has information necessary for amplification processing (relationship between the amplification factor and the reception depth shown in FIG. 2) and information necessary for amplification correction processing (the amplification factor and the reception depth shown in FIG. 3). ), Information necessary for the attenuation correction process (see equation (1)), information on window functions (Hamming, Hanning, Blackman, etc.) necessary for the frequency analysis process, and the like are stored.
- the storage unit 37 stores various programs including an operation program for executing the operation method of the ultrasonic observation apparatus 3.
- the operation program can be recorded on a computer-readable recording medium such as a hard disk, a flash memory, a CD-ROM, a DVD-ROM, or a flexible disk and widely distributed.
- the various programs described above can also be obtained by downloading via a communication network.
- the communication network here is realized by, for example, an existing public line network, LAN (Local Area Network), WAN (Wide Area Network), etc., and may be wired or wireless.
- the storage unit 37 having the above configuration is realized using a ROM (Read Only Memory) in which various programs are installed in advance, and a RAM (Random Access Memory) that stores calculation parameters and data of each process. .
- ROM Read Only Memory
- RAM Random Access Memory
- the dynamic range of the correction feature amount is preferably set according to a range that can be set by gain processing, contrast processing, and the like performed by the image processing unit 34.
- the attenuation rate candidate values ⁇ 1 , ⁇ 2 , and ⁇ 3 are dynamic ranges related to display according to a range in which the feature amount displayed as the feature amount image can be set by the above-described gain processing, contrast processing, and the like. There are three values set between 0.0 and 2.0 so as to be within. For example, if the attenuation candidate value is larger than 2.0, the calculated corrected feature value may exceed the dynamic range, and may not be held as the corrected feature value.
- the values of statistical variation are different, and for example, a function generated based on the variance does not become a quadratic function, and the attenuation rate cannot be set to an optimum value. That is, the attenuation rate candidate values ⁇ 1 , ⁇ 2 , and ⁇ 3 according to the present embodiment are values set in the range of 0.0 to 2.0, and are the smallest attenuation among the three attenuation candidate values. It is preferable that the rate candidate value is 0.6 or less and the largest value is 0.6 or more. In particular, when the observation target is a living tissue and the eigenpoint method is used, it is more preferable that the three attenuation candidate values are set to values near 0.6 in order to suppress a decrease in calculation accuracy due to clipping. .
- FIG. 9 is a flowchart showing an outline of processing performed by the ultrasonic observation apparatus 3 having the above configuration.
- the ultrasonic observation device 3 receives an echo signal as a measurement result of an observation target by the ultrasonic transducer 21 from the ultrasonic endoscope 2 (step S1).
- the signal amplifying unit 311 that has received the echo signal from the ultrasonic transducer 21 amplifies the echo signal (step S2).
- the signal amplifying unit 311 performs amplification (STC correction) of the echo signal based on the relationship between the amplification factor and the reception depth shown in FIG. 2, for example.
- the B-mode image data generation unit 341 generates B-mode image data using the echo signal amplified by the signal amplification unit 311 and outputs the B-mode image data to the display device 4 (step S3).
- the display device 4 that has received the B-mode image data displays a B-mode image corresponding to the B-mode image data (step S4).
- the amplification correction unit 331 performs amplification correction on the signal output from the transmission / reception unit 31 so that the amplification factor is constant regardless of the reception depth (step S5).
- the amplification correction unit 331 performs amplification correction so that, for example, the relationship between the amplification factor and the reception depth illustrated in FIG. 3 is established.
- the frequency analysis unit 332 calculates frequency spectra for all sample data groups in the region of interest, which is a region for generating feature amount image data, by performing frequency analysis by FFT calculation (step S6: frequency analysis). Step).
- FIG. 10 is a flowchart showing an outline of the processing executed by the frequency analysis unit 332 in step S6.
- the frequency analysis processing will be described in detail with reference to the flowchart shown in FIG.
- the frequency analysis unit 332 sets a counter k for identifying a sound ray to be analyzed as k 0 (step S21).
- the frequency analysis unit 332 sets an initial value Z (k) 0 of a data position (corresponding to a reception depth) Z (k) representing a series of data groups (sample data group) acquired for the FFT calculation.
- FIG. 4 shows a case where the eighth data position of the sound ray SR k is set as the initial value Z (k) 0 as described above.
- the frequency analysis unit 332 acquires a sample data group (step S23), and causes the window function stored in the storage unit 37 to act on the acquired sample data group (step S24).
- the window function By applying the window function to the sample data group in this way, it is possible to avoid the sample data group from becoming discontinuous at the boundary and to prevent the occurrence of artifacts.
- the frequency analysis unit 332 determines whether or not the sample data group at the data position Z (k) is a normal data group (step S25).
- the sample data group needs to have the number of powers of two.
- the number of data in the normal sample data group is 2 n (n is a positive integer).
- step S25 If the result of determination in step S25 is that the sample data group at data position Z (k) is normal (step S25: Yes), the frequency analysis unit 332 proceeds to step S27 described later.
- step S25 If the result of determination in step S25 is that the sample data group at the data position Z (k) is not normal (step S25: No), the frequency analysis unit 332 inserts zero data as much as the deficient amount into a normal sample data group. Generate (step S26). A window function is applied to the sample data group determined to be not normal in step S25 (for example, the sample data group F K in FIG. 4) before adding zero data. For this reason, even if zero data is inserted into the sample data group, data discontinuity does not occur. After step S26, the frequency analysis unit 332 proceeds to step S27 described later.
- step S27 the frequency analysis unit 332 obtains a frequency spectrum that is a frequency distribution of amplitude by performing an FFT operation using the sample data group (step S27).
- FIG frequency spectrum C 1 shown in 5 is an example of the resulting frequency spectrum as a result of step S27.
- the frequency analysis unit 332 changes the data position Z (k) by the step width D (step S28). It is assumed that the step width D is stored in advance in the storage unit 37.
- the step width D is desirably matched with the data step width used when the B-mode image data generation unit 341 generates B-mode image data.
- the step width D A value larger than the data step width may be set as the width D.
- the frequency analysis unit 332 determines whether or not the data position Z (k) is larger than the maximum value Z (k) max in the sound ray SR k (step S29).
- the frequency analysis unit 332 increases the counter k by 1 (step S30). This means that the processing is shifted to the next sound ray.
- the frequency analysis unit 332 returns to step S23.
- the frequency analysis unit 332 performs an FFT operation on [(Z (k) max ⁇ Z (k) 0 +1) / D + 1] sample data groups for the sound ray SR k .
- [X] represents the maximum integer not exceeding X.
- the frequency analysis unit 332 determines whether or not the counter k is greater than the maximum value k max (step S31). When the counter k is larger than the maximum value k max (step S31: Yes), the frequency analysis unit 332 ends the series of frequency analysis processing. On the other hand, when the counter k is equal to or less than the maximum value k max (step S31: No), the frequency analysis unit 332 returns to step S22.
- the maximum value k max is a value arbitrarily input by a user such as an operator through the input unit 35 or a value preset in the storage unit 37.
- the frequency analysis unit 332 performs the FFT operation a plurality of times for each of (k max ⁇ k 0 +1) sound rays in the analysis target region.
- the result of the FFT operation is stored in the storage unit 37 together with the reception depth and the reception direction.
- the frequency analysis process is performed only in the set region of interest.
- the frequency analysis unit 332 performs the frequency analysis process on all the regions that have received the ultrasonic signal. It is also possible.
- the feature amount calculation unit 333 calculates pre-correction feature amounts of a plurality of frequency spectra, and gives different attenuation characteristics when ultrasonic waves propagate through the observation target.
- the correction feature quantity of each frequency spectrum is calculated by performing attenuation correction that eliminates the influence of ultrasonic attenuation on the pre-correction feature quantity of each frequency spectrum, and the correction feature
- the optimal attenuation rate is set for the observation target by calculating the variance for each attenuation rate candidate value using the quantity, generating a quadratic function indicating the relationship between the attenuation rate candidate value and the variance, and obtaining the extreme value (Steps S7 to S12: feature amount calculation step).
- the processing of steps S7 to S12 will be described in detail.
- step S7 the approximating unit 333a performs a regression analysis on each of the plurality of frequency spectra calculated by the frequency analyzing unit 332, thereby calculating a pre-correction feature quantity corresponding to each frequency spectrum of the division region to be set for attenuation rate (Ste S7).
- the approximating unit 333a approximates each frequency spectrum with a linear expression by performing regression analysis, and calculates a slope a 0 , an intercept b 0 , and a midband fit c 0 as pre-correction feature values.
- the straight line L 10 shown in FIG. 5 the approximation unit 333a is the regression line approximated by the regression analysis for the frequency spectrum C 1 frequency band U.
- the optimum attenuation rate setting unit 333c sets the attenuation rate candidate values to be applied when performing attenuation correction, which will be described later, to predetermined setting values ⁇ 1 , ⁇ 2 , and ⁇ 3 .
- the set values ⁇ 1 , ⁇ 2 , and ⁇ 3 may be stored in advance in the feature amount information storage unit 371, and the optimum attenuation rate setting unit 333c may refer to the feature amount information storage unit 371.
- the attenuation correction unit 333b performs attenuation correction on the pre-correction feature values approximated by the approximation unit 333a for each frequency spectrum, using the set values ⁇ 1 , ⁇ 2 , and ⁇ 3 as attenuation rate candidate values. Then, the corrected feature amount is calculated and stored in the feature amount information storage unit 371 together with the set values ⁇ 1 , ⁇ 2 , and ⁇ 3 (step S8).
- a straight line L 1 illustrated in FIG. 6 is an example of a straight line obtained by the attenuation correction unit 333b performing the attenuation correction process.
- the correction feature amount is calculated by substituting Dn.
- f sp is the data sampling frequency
- v s is the sound velocity
- D is the data step width
- n is the number of data steps from the first data of the sound ray up to the data position of the sample data group to be processed.
- the data sampling frequency f sp is 50 MHz
- the sound velocity vs is 1530 m / sec
- the optimum attenuation rate setting unit 333c calculates a variance of representative correction feature amounts among a plurality of correction feature amounts obtained by the attenuation correction unit 333b performing attenuation correction on each frequency spectrum, and sets a set value ⁇ 1. , ⁇ 2 , ⁇ 3 and stored in the feature amount information storage unit 371 (step S9).
- the correction feature amount is the slope a and the midband fit c, as shown in FIG. 8 described above
- the optimum attenuation rate setting unit 333c calculates, for example, the variance of the correction feature amount c.
- step S19 the optimum attenuation rate setting unit 333c applies the variance of the corrected feature amount a when the feature amount image data generation unit 342 generates the feature amount image data using the inclination, and uses the midband fit.
- the optimum attenuation rate setting unit 333c generates a quadratic function based on the variance of the corrected feature quantity c that has been attenuation-corrected based on the set values ⁇ 1 , ⁇ 2 , and ⁇ 3 (step S10).
- the optimum attenuation rate setting unit 333c obtains the extreme value of the generated quadratic function (step S11), and sets the attenuation rate candidate value corresponding to the extreme value as the optimum attenuation rate (step S12).
- the feature amount image data generation unit 342 includes visual information associated with the corrected feature amount based on the optimum attenuation rate specified in step S12 for each pixel in the B mode image data generated by the B mode image data generation unit 341.
- the feature amount image data is generated by superimposing the hue) and adding information of the optimum attenuation rate (step S13: feature amount image data generation step).
- FIG. 11 is a diagram schematically illustrating a display example of the feature amount image on the display device 4.
- the feature amount image 201 shown in the figure includes a superimposed image display unit 202 that displays an image in which visual information related to a feature amount is superimposed on a B-mode image, an identification information of an observation target, and an attenuation rate set as an optimal attenuation rate.
- an information display unit 203 that displays information on candidate values.
- image information such as gain and contrast may be further displayed.
- a B-mode image corresponding to the feature amount image may be displayed side by side with the feature amount image.
- step S4 In the series of processes described above (steps S1 to S14), the process of step S4 and the processes of steps S5 to S12 may be performed in parallel.
- the correction feature amount is obtained by performing the attenuation correction using the three preset values (setting values ⁇ 1 , ⁇ 2 , ⁇ 3 ) as attenuation rate candidate values. Is calculated, the extremum of the quadratic function generated based on the variance of the corrected feature value is obtained, and the attenuation candidate value corresponding to the extremum is set as the optimum attenuation rate. It is possible to obtain a suitable attenuation characteristic of ultrasonic waves at high speed by simple calculation, and to perform observation using the attenuation characteristic.
- an optimum attenuation rate can be set even when the attenuation rate suitable for the observation target is unknown.
- the set values ⁇ 1 , ⁇ 2 , and ⁇ 3 as attenuation rate candidate values are values of 0.0 or more, and the smallest attenuation rate among the three attenuation candidate values.
- the attenuation rate corresponding to the extreme value of the quadratic function is set as the optimal attenuation rate, and therefore a numerical value having a number of digits larger than a preset attenuation rate candidate value. Can be set as the attenuation rate, and the calculation accuracy of the optimum attenuation rate can be improved.
- the attenuation rate candidate values ⁇ 1 , ⁇ 2 , and ⁇ 3 are displayed between 0.0 and 2.0 so that the feature amount displayed as the feature amount image is within the dynamic range.
- information on the quadratic function generated on the information display unit 203 based on the dispersion of the corrected feature values that are attenuation-corrected based on the set values ⁇ 1 , ⁇ 2 , and ⁇ 3 respectively.
- the user can confirm and grasp errors generated in the generation of the quadratic function.
- the optimum attenuation rate setting unit 333c sets an optimum attenuation rate with a dynamic range wider than the dynamic range used when displaying as a feature amount image.
- the feature amount calculation unit 333 performs an attenuation calculation with a dynamic range (for example, 100 dB) larger than the dynamic range (70 dB). Perform processing.
- a dynamic range for example, 100 dB
- the feature amount calculation unit 333 uses an 8-bit fixed-point method
- the feature amount calculation unit 333 uses a 32-bit floating point method to calculate a feature amount and set an optimum attenuation rate. Including attenuation calculation processing.
- the calculation accuracy can be improved as compared with the attenuation calculation process using the fixed-point method.
- the quadratic function based on the variance from the calculation of the feature amount before correction, the optimum attenuation rate can be calculated with high accuracy.
- the optimum attenuation rate setting unit 333c calculates an optimum attenuation rate equivalent value corresponding to the optimum attenuation rate in all frames of the ultrasonic image, and a predetermined number of optimum values including the optimum attenuation rate equivalent value in the latest frame.
- the average value, median value, or mode value of the attenuation rate equivalent values may be set as the optimal attenuation rate. In this case, compared with the case where the optimum attenuation rate is set in each frame, the change in the optimum attenuation rate is reduced, and the value can be stabilized.
- the optimum attenuation rate setting unit 333c may set an optimum attenuation rate at a predetermined frame interval of the ultrasonic image. Thereby, the amount of calculation can be reduced significantly. In this case, the most recently set optimum attenuation value may be used until the next optimum attenuation rate is set.
- the target area for calculating the statistical variation may be set for each sound ray, or the reception depth may be an area having a predetermined value or more. It is good also as a structure which the input part 35 can receive the setting of these area
- the input unit 35 may be configured to accept input of setting changes of the attenuation rate candidate value setting values ⁇ 1 , ⁇ 2 , and ⁇ 3 .
- an amount giving statistical variation for example, any one of standard deviation, a difference between the maximum value and minimum value of the feature amount in the population, and a half-value width of the distribution of the feature amount can be applied. It is also possible to apply the reciprocal of variance as an amount that gives statistical variation, but in this case, the quadratic function is convex upward, and the attenuation rate candidate value corresponding to the extreme value is optimal. It goes without saying that the attenuation rate is obtained.
- the optimum attenuation rate setting unit 333c calculates statistical variations of a plurality of types of correction feature amounts, respectively, and optimizes attenuation rate candidate values according to the extreme values of the quadratic function generated based on the statistical variations. It is also possible to set as a partial attenuation rate.
- Ultrasonic miniature probes are usually inserted into the biliary tract, bile duct, pancreatic duct, trachea, bronchi, urethra, ureter, and used to observe surrounding organs (pancreas, lung, prostate, bladder, lymph nodes, etc.).
- an external ultrasonic probe that irradiates ultrasonic waves from the body surface of the subject may be applied.
- the extracorporeal ultrasonic probe is usually used for observing an abdominal organ (liver, gallbladder, bladder), breast (particularly mammary gland), and thyroid gland.
- the ultrasonic vibrator may be a linear vibrator, a radial vibrator, or a convex vibrator.
- the scanning area is rectangular (rectangular, square), and when the ultrasonic transducer is a radial or convex transducer, the scanning area is fan-shaped or annular.
- the ultrasonic endoscope may be one that mechanically scans the ultrasonic transducer, or a plurality of elements are arranged in an array as the ultrasonic transducer, and the elements involved in transmission and reception are switched electronically. Alternatively, electronic scanning may be performed by delaying transmission / reception of each element.
- the ultrasonic observation apparatus, the operation method of the ultrasonic observation apparatus, and the operation program of the ultrasonic observation apparatus according to the present invention obtain the ultrasonic attenuation characteristics suitable for the observation target by simple calculation, and This is useful for observations using attenuation characteristics.
Landscapes
- Health & Medical Sciences (AREA)
- Life Sciences & Earth Sciences (AREA)
- Engineering & Computer Science (AREA)
- Radiology & Medical Imaging (AREA)
- Heart & Thoracic Surgery (AREA)
- Biophysics (AREA)
- Nuclear Medicine, Radiotherapy & Molecular Imaging (AREA)
- Pathology (AREA)
- Veterinary Medicine (AREA)
- Biomedical Technology (AREA)
- Physics & Mathematics (AREA)
- Medical Informatics (AREA)
- Molecular Biology (AREA)
- Surgery (AREA)
- Animal Behavior & Ethology (AREA)
- General Health & Medical Sciences (AREA)
- Public Health (AREA)
- Computer Vision & Pattern Recognition (AREA)
- Ultra Sonic Daignosis Equipment (AREA)
Abstract
La présente invention concerne un appareil d'observation par ultrasons comprenant: une unité d'analyse de fréquence qui calcule une pluralité de spectres de fréquence par analyse de fréquences des signaux générés sur la base des signaux d'écho; une unité de calcul de caractéristique qui calcule les caractéristiques individuelles de la pluralité des spectres de fréquences, qui calcule les caractéristiques corrigées des spectres de fréquences avec chacun de trois facteurs d'atténuation candidats, qui calcule les variations statistiques des caractéristiques corrigées pour chacun des facteurs d'atténuation candidats, qui génère ensuite une fonction quadratique sur la base des variations, et qui définit, en tant que facteur d'atténuation optimal, le facteur d'atténuation candidat avec lequel les variations statistiques sont minimisées dans la fonction quadratique; et une unité de génération de données d'images caractéristiques qui génère les données d'image caractéristique dans laquelle une caractéristique corrigée sur la base du facteur d'atténuation optimal est affichée conjointement avec une image par ultrasons.
Priority Applications (4)
| Application Number | Priority Date | Filing Date | Title |
|---|---|---|---|
| EP15887766.2A EP3278737A4 (fr) | 2015-03-31 | 2015-12-02 | Appareil d'observation par ultrasons, procédé de fonctionnement de l'appareil d'observation par ultrasons et programme de fonctionnement pour l'appareil d'observation par ultrasons |
| CN201580078561.6A CN107405136A (zh) | 2015-03-31 | 2015-12-02 | 超声波观测装置、超声波观测装置的工作方法以及超声波观测装置的工作程序 |
| JP2017509164A JP6138402B2 (ja) | 2015-03-31 | 2015-12-02 | 超音波観測装置、超音波観測装置の作動方法および超音波観測装置の作動プログラム |
| US15/716,679 US20180028158A1 (en) | 2015-03-31 | 2017-09-27 | Ultrasound observation apparatus, method for operating ultrasound observation apparatus, and computer-readable recording medium |
Applications Claiming Priority (2)
| Application Number | Priority Date | Filing Date | Title |
|---|---|---|---|
| JP2015072726 | 2015-03-31 | ||
| JP2015-072726 | 2015-03-31 |
Related Child Applications (1)
| Application Number | Title | Priority Date | Filing Date |
|---|---|---|---|
| US15/716,679 Continuation US20180028158A1 (en) | 2015-03-31 | 2017-09-27 | Ultrasound observation apparatus, method for operating ultrasound observation apparatus, and computer-readable recording medium |
Publications (1)
| Publication Number | Publication Date |
|---|---|
| WO2016157624A1 true WO2016157624A1 (fr) | 2016-10-06 |
Family
ID=57004084
Family Applications (1)
| Application Number | Title | Priority Date | Filing Date |
|---|---|---|---|
| PCT/JP2015/083938 Ceased WO2016157624A1 (fr) | 2015-03-31 | 2015-12-02 | Appareil d'observation par ultrasons, procédé de fonctionnement de l'appareil d'observation par ultrasons et programme de fonctionnement pour l'appareil d'observation par ultrasons |
Country Status (5)
| Country | Link |
|---|---|
| US (1) | US20180028158A1 (fr) |
| EP (1) | EP3278737A4 (fr) |
| JP (1) | JP6138402B2 (fr) |
| CN (1) | CN107405136A (fr) |
| WO (1) | WO2016157624A1 (fr) |
Cited By (2)
| Publication number | Priority date | Publication date | Assignee | Title |
|---|---|---|---|---|
| JP2020000354A (ja) * | 2018-06-26 | 2020-01-09 | ゼネラル・エレクトリック・カンパニイ | 超音波装置及びその制御プログラム |
| CN113491535A (zh) * | 2020-04-01 | 2021-10-12 | 株式会社日立制作所 | 超声波诊断装置、信号处理装置以及信号处理程序 |
Citations (2)
| Publication number | Priority date | Publication date | Assignee | Title |
|---|---|---|---|---|
| JPS62117536A (ja) * | 1985-11-18 | 1987-05-29 | 株式会社島津製作所 | 超音波診断装置における組織性状の判定方法 |
| WO2012063929A1 (fr) * | 2010-11-11 | 2012-05-18 | オリンパスメディカルシステムズ株式会社 | Dispositif d'observation à ultrasons, procédé de fonctionnement de dispositif d'observation à ultrasons, et programme de fonctionnement de dispositif d'observation à ultrasons |
Family Cites Families (8)
| Publication number | Priority date | Publication date | Assignee | Title |
|---|---|---|---|---|
| JPH02193651A (ja) * | 1989-01-20 | 1990-07-31 | Fujitsu Ltd | 超音波減衰係数の推定方法 |
| EP2554124B1 (fr) * | 2010-11-11 | 2014-01-01 | Olympus Medical Systems Corp. | Dispositif d'observation échografique ainsi que les procédé et programme associés |
| CN102858251B (zh) * | 2010-11-11 | 2014-12-17 | 奥林巴斯医疗株式会社 | 超声波观测装置及超声波观测方法 |
| CN102802536B (zh) * | 2010-11-11 | 2015-01-07 | 奥林巴斯医疗株式会社 | 超声波诊断装置、超声波诊断装置的动作方法以及超声波诊断装置的动作程序 |
| CN102958447B (zh) * | 2011-03-31 | 2016-04-27 | 奥林巴斯株式会社 | 超声波观测装置、超声波观测装置的动作方法 |
| CN103717146B (zh) * | 2012-05-30 | 2016-01-13 | 奥林巴斯株式会社 | 超声波观测装置、超声波观测装置的动作方法 |
| WO2014017255A1 (fr) * | 2012-07-27 | 2014-01-30 | オリンパスメディカルシステムズ株式会社 | Appareil d'observation à ultrasons, procédé d'actionnement d'un appareil d'observation à ultrasons et programme d'actionnement d'un appareil d'observation à ultrasons |
| EP3167809A4 (fr) * | 2014-07-11 | 2018-04-04 | Olympus Corporation | Dispositif d'observation ultrasonore, procédé de fonctionnement de dispositif d'observation ultrasonore, et programme de fonctionnement de dispositif d'observation ultrasonore |
-
2015
- 2015-12-02 WO PCT/JP2015/083938 patent/WO2016157624A1/fr not_active Ceased
- 2015-12-02 CN CN201580078561.6A patent/CN107405136A/zh active Pending
- 2015-12-02 JP JP2017509164A patent/JP6138402B2/ja active Active
- 2015-12-02 EP EP15887766.2A patent/EP3278737A4/fr not_active Withdrawn
-
2017
- 2017-09-27 US US15/716,679 patent/US20180028158A1/en not_active Abandoned
Patent Citations (2)
| Publication number | Priority date | Publication date | Assignee | Title |
|---|---|---|---|---|
| JPS62117536A (ja) * | 1985-11-18 | 1987-05-29 | 株式会社島津製作所 | 超音波診断装置における組織性状の判定方法 |
| WO2012063929A1 (fr) * | 2010-11-11 | 2012-05-18 | オリンパスメディカルシステムズ株式会社 | Dispositif d'observation à ultrasons, procédé de fonctionnement de dispositif d'observation à ultrasons, et programme de fonctionnement de dispositif d'observation à ultrasons |
Non-Patent Citations (1)
| Title |
|---|
| See also references of EP3278737A4 * |
Cited By (3)
| Publication number | Priority date | Publication date | Assignee | Title |
|---|---|---|---|---|
| JP2020000354A (ja) * | 2018-06-26 | 2020-01-09 | ゼネラル・エレクトリック・カンパニイ | 超音波装置及びその制御プログラム |
| CN113491535A (zh) * | 2020-04-01 | 2021-10-12 | 株式会社日立制作所 | 超声波诊断装置、信号处理装置以及信号处理程序 |
| CN113491535B (zh) * | 2020-04-01 | 2024-04-26 | 富士胶片医疗健康株式会社 | 超声波诊断装置、信号处理装置以及记录介质 |
Also Published As
| Publication number | Publication date |
|---|---|
| CN107405136A (zh) | 2017-11-28 |
| EP3278737A1 (fr) | 2018-02-07 |
| US20180028158A1 (en) | 2018-02-01 |
| EP3278737A4 (fr) | 2019-01-02 |
| JPWO2016157624A1 (ja) | 2017-06-08 |
| JP6138402B2 (ja) | 2017-05-31 |
Similar Documents
| Publication | Publication Date | Title |
|---|---|---|
| JP5948527B1 (ja) | 超音波観測装置、超音波観測装置の作動方法および超音波観測装置の作動プログラム | |
| JP5974210B2 (ja) | 超音波観測装置、超音波観測装置の作動方法および超音波観測装置の作動プログラム | |
| JP5953457B1 (ja) | 超音波観測装置、超音波観測装置の作動方法および超音波観測装置の作動プログラム | |
| JP6289772B2 (ja) | 超音波観測装置、超音波観測装置の作動方法および超音波観測装置の作動プログラム | |
| JPWO2017110756A1 (ja) | 超音波観測装置、超音波観測装置の作動方法および超音波観測装置の作動プログラム | |
| JP6022135B1 (ja) | 超音波診断装置、超音波診断装置の作動方法および超音波診断装置の作動プログラム | |
| JP5927367B1 (ja) | 超音波観測装置、超音波観測装置の作動方法および超音波観測装置の作動プログラム | |
| JP6010274B1 (ja) | 超音波観測装置、超音波観測装置の作動方法および超音波観測装置の作動プログラム | |
| JP6138402B2 (ja) | 超音波観測装置、超音波観測装置の作動方法および超音波観測装置の作動プログラム | |
| JP2016202567A (ja) | 超音波観測装置、超音波観測装置の作動方法および超音波観測装置の作動プログラム | |
| JP5981072B1 (ja) | 超音波観測装置、超音波観測装置の作動方法および超音波観測装置の作動プログラム | |
| JP6157790B1 (ja) | 超音波観測装置、超音波観測装置の作動方法および超音波観測装置の作動プログラム | |
| JP6253572B2 (ja) | 超音波観測装置、超音波観測装置の作動方法および超音波観測装置の作動プログラム | |
| WO2016103848A1 (fr) | Dispositif d'observation ultrasonore, procédé de fonctionnement pour dispositif d'observation ultrasonore, et programme de fonctionnement pour dispositif d'observation ultrasonore | |
| JPWO2020157931A1 (ja) | 超音波観測装置、超音波観測装置の作動方法および超音波観測装置の作動プログラム | |
| JP2017217313A (ja) | 超音波観測装置、超音波観測装置の作動方法および超音波観測装置の作動プログラム |
Legal Events
| Date | Code | Title | Description |
|---|---|---|---|
| 121 | Ep: the epo has been informed by wipo that ep was designated in this application |
Ref document number: 15887766 Country of ref document: EP Kind code of ref document: A1 |
|
| ENP | Entry into the national phase |
Ref document number: 2017509164 Country of ref document: JP Kind code of ref document: A |
|
| NENP | Non-entry into the national phase |
Ref country code: DE |