WO2017126420A1 - Dispositif et programme de traitement d'image - Google Patents
Dispositif et programme de traitement d'image Download PDFInfo
- Publication number
- WO2017126420A1 WO2017126420A1 PCT/JP2017/000965 JP2017000965W WO2017126420A1 WO 2017126420 A1 WO2017126420 A1 WO 2017126420A1 JP 2017000965 W JP2017000965 W JP 2017000965W WO 2017126420 A1 WO2017126420 A1 WO 2017126420A1
- Authority
- WO
- WIPO (PCT)
- Prior art keywords
- fluorescent
- image
- types
- image processing
- processing apparatus
- Prior art date
- Legal status (The legal status is an assumption and is not a legal conclusion. Google has not performed a legal analysis and makes no representation as to the accuracy of the status listed.)
- Ceased
Links
Images

Classifications
-
- G—PHYSICS
- G01—MEASURING; TESTING
- G01N—INVESTIGATING OR ANALYSING MATERIALS BY DETERMINING THEIR CHEMICAL OR PHYSICAL PROPERTIES
- G01N21/00—Investigating or analysing materials by the use of optical means, i.e. using sub-millimetre waves, infrared, visible or ultraviolet light
- G01N21/62—Systems in which the material investigated is excited whereby it emits light or causes a change in wavelength of the incident light
- G01N21/63—Systems in which the material investigated is excited whereby it emits light or causes a change in wavelength of the incident light optically excited
- G01N21/64—Fluorescence; Phosphorescence
- G01N21/645—Specially adapted constructive features of fluorimeters
- G01N21/6456—Spatial resolved fluorescence measurements; Imaging
- G01N21/6458—Fluorescence microscopy
-
- G—PHYSICS
- G01—MEASURING; TESTING
- G01N—INVESTIGATING OR ANALYSING MATERIALS BY DETERMINING THEIR CHEMICAL OR PHYSICAL PROPERTIES
- G01N21/00—Investigating or analysing materials by the use of optical means, i.e. using sub-millimetre waves, infrared, visible or ultraviolet light
- G01N21/62—Systems in which the material investigated is excited whereby it emits light or causes a change in wavelength of the incident light
- G01N21/63—Systems in which the material investigated is excited whereby it emits light or causes a change in wavelength of the incident light optically excited
- G01N21/64—Fluorescence; Phosphorescence
- G01N21/6428—Measuring fluorescence of fluorescent products of reactions or of fluorochrome labelled reactive substances, e.g. measuring quenching effects, using measuring "optrodes"
-
- G—PHYSICS
- G01—MEASURING; TESTING
- G01N—INVESTIGATING OR ANALYSING MATERIALS BY DETERMINING THEIR CHEMICAL OR PHYSICAL PROPERTIES
- G01N33/00—Investigating or analysing materials by specific methods not covered by groups G01N1/00 - G01N31/00
- G01N33/48—Biological material, e.g. blood, urine; Haemocytometers
-
- G—PHYSICS
- G01—MEASURING; TESTING
- G01N—INVESTIGATING OR ANALYSING MATERIALS BY DETERMINING THEIR CHEMICAL OR PHYSICAL PROPERTIES
- G01N33/00—Investigating or analysing materials by specific methods not covered by groups G01N1/00 - G01N31/00
- G01N33/48—Biological material, e.g. blood, urine; Haemocytometers
- G01N33/50—Chemical analysis of biological material, e.g. blood, urine; Testing involving biospecific ligand binding methods; Immunological testing
- G01N33/53—Immunoassay; Biospecific binding assay; Materials therefor
- G01N33/531—Production of immunochemical test materials
- G01N33/532—Production of labelled immunochemicals
- G01N33/533—Production of labelled immunochemicals with fluorescent label
-
- G—PHYSICS
- G06—COMPUTING OR CALCULATING; COUNTING
- G06F—ELECTRIC DIGITAL DATA PROCESSING
- G06F18/00—Pattern recognition
- G06F18/20—Analysing
- G06F18/22—Matching criteria, e.g. proximity measures
-
- G—PHYSICS
- G06—COMPUTING OR CALCULATING; COUNTING
- G06T—IMAGE DATA PROCESSING OR GENERATION, IN GENERAL
- G06T7/00—Image analysis
- G06T7/0002—Inspection of images, e.g. flaw detection
- G06T7/0012—Biomedical image inspection
-
- G—PHYSICS
- G06—COMPUTING OR CALCULATING; COUNTING
- G06T—IMAGE DATA PROCESSING OR GENERATION, IN GENERAL
- G06T7/00—Image analysis
- G06T7/10—Segmentation; Edge detection
- G06T7/11—Region-based segmentation
-
- G—PHYSICS
- G06—COMPUTING OR CALCULATING; COUNTING
- G06T—IMAGE DATA PROCESSING OR GENERATION, IN GENERAL
- G06T7/00—Image analysis
- G06T7/10—Segmentation; Edge detection
- G06T7/136—Segmentation; Edge detection involving thresholding
-
- G—PHYSICS
- G06—COMPUTING OR CALCULATING; COUNTING
- G06T—IMAGE DATA PROCESSING OR GENERATION, IN GENERAL
- G06T7/00—Image analysis
- G06T7/10—Segmentation; Edge detection
- G06T7/155—Segmentation; Edge detection involving morphological operators
-
- G—PHYSICS
- G06—COMPUTING OR CALCULATING; COUNTING
- G06V—IMAGE OR VIDEO RECOGNITION OR UNDERSTANDING
- G06V10/00—Arrangements for image or video recognition or understanding
- G06V10/70—Arrangements for image or video recognition or understanding using pattern recognition or machine learning
- G06V10/74—Image or video pattern matching; Proximity measures in feature spaces
- G06V10/761—Proximity, similarity or dissimilarity measures
-
- G—PHYSICS
- G06—COMPUTING OR CALCULATING; COUNTING
- G06V—IMAGE OR VIDEO RECOGNITION OR UNDERSTANDING
- G06V20/00—Scenes; Scene-specific elements
- G06V20/60—Type of objects
- G06V20/69—Microscopic objects, e.g. biological cells or cellular parts
- G06V20/698—Matching; Classification
-
- G—PHYSICS
- G01—MEASURING; TESTING
- G01N—INVESTIGATING OR ANALYSING MATERIALS BY DETERMINING THEIR CHEMICAL OR PHYSICAL PROPERTIES
- G01N1/00—Sampling; Preparing specimens for investigation
- G01N1/28—Preparing specimens for investigation including physical details of (bio-)chemical methods covered elsewhere, e.g. G01N33/50, C12Q
- G01N1/30—Staining; Impregnating ; Fixation; Dehydration; Multistep processes for preparing samples of tissue, cell or nucleic acid material and the like for analysis
-
- G—PHYSICS
- G01—MEASURING; TESTING
- G01N—INVESTIGATING OR ANALYSING MATERIALS BY DETERMINING THEIR CHEMICAL OR PHYSICAL PROPERTIES
- G01N21/00—Investigating or analysing materials by the use of optical means, i.e. using sub-millimetre waves, infrared, visible or ultraviolet light
- G01N21/62—Systems in which the material investigated is excited whereby it emits light or causes a change in wavelength of the incident light
- G01N21/63—Systems in which the material investigated is excited whereby it emits light or causes a change in wavelength of the incident light optically excited
- G01N21/64—Fluorescence; Phosphorescence
- G01N21/6428—Measuring fluorescence of fluorescent products of reactions or of fluorochrome labelled reactive substances, e.g. measuring quenching effects, using measuring "optrodes"
- G01N2021/6439—Measuring fluorescence of fluorescent products of reactions or of fluorochrome labelled reactive substances, e.g. measuring quenching effects, using measuring "optrodes" with indicators, stains, dyes, tags, labels, marks
-
- G—PHYSICS
- G06—COMPUTING OR CALCULATING; COUNTING
- G06T—IMAGE DATA PROCESSING OR GENERATION, IN GENERAL
- G06T2207/00—Indexing scheme for image analysis or image enhancement
- G06T2207/10—Image acquisition modality
- G06T2207/10056—Microscopic image
-
- G—PHYSICS
- G06—COMPUTING OR CALCULATING; COUNTING
- G06T—IMAGE DATA PROCESSING OR GENERATION, IN GENERAL
- G06T2207/00—Indexing scheme for image analysis or image enhancement
- G06T2207/10—Image acquisition modality
- G06T2207/10064—Fluorescence image
-
- G—PHYSICS
- G06—COMPUTING OR CALCULATING; COUNTING
- G06T—IMAGE DATA PROCESSING OR GENERATION, IN GENERAL
- G06T2207/00—Indexing scheme for image analysis or image enhancement
- G06T2207/30—Subject of image; Context of image processing
- G06T2207/30004—Biomedical image processing
- G06T2207/30024—Cell structures in vitro; Tissue sections in vitro
Definitions
- the present invention relates to an image processing apparatus and a program.
- pathological diagnosis it is widely performed to determine the malignancy of a lesion based on the expression of a specific biological material in a tissue specimen.
- the presence or absence of expression of a specific biological substance for each cell is determined from a microscopic image obtained by photographing a tissue specimen stained by an immunohistochemical method using an enzyme (DAB or the like) or a fluorescent substance. Used for diagnosis.
- breast cancer is classified into five subtypes based on the combination of the presence or absence of expression of hormone receptors (estrogen receptor (ER) and progesterone receptor (PgR)), HER2, and Ki67. Since the properties of cancer cells differ depending on the subtype, it is necessary to select a suitable drug therapy (for example, chemotherapy, hormone therapy, anti-HER2 therapy). Conventionally, such pathological diagnosis has been performed by a pathologist looking at a microscopic image. However, there are problems in that there are individual differences in the diagnostic results, and quantitative determination is difficult.
- cells expressing target molecules are extracted and displayed based on images of tissue specimens stained with cells and target molecules.
- tissue specimens stained with pigments of different colors are used as target substances for multiple biological substances, the pattern of the presence or absence of the expression of multiple types of biological substances on cells is grasped, and the combination of cancer Types can be classified.
- the system described in Patent Document 1 can only grasp the pattern of the presence or absence of expression of the target molecule in the specimen, and cannot quantitatively evaluate the expression.
- the expression level can be evaluated to some extent based on the luminance value of light emission.
- multiple types of biological material can be used based on simple comparison results of the brightness values of multiple types of fluorescent material.
- the expression level of can not be evaluated. Therefore, in the system described in Patent Document 1, although the type of lesion can be grasped based on the expression of a plurality of types of biological substances, the degree of lesion cannot be grasped.
- a main object of the present invention is to provide an image processing apparatus and program capable of quantifying the expression levels of a plurality of types of biological substances in a tissue specimen and calculating a statistical value obtained by analyzing the quantification result.
- a fluorescence image representing the expression of the biological material in a tissue specimen stained with a plurality of types of biological materials by a fluorescent bright spot and a morphology image representing the morphology of cells in the tissue specimen and including the same range as the fluorescence image are input.
- Input means Region extraction means for extracting an observation target region from the morphological image;
- a bright spot extracting means for extracting the fluorescent bright spot from the fluorescent image;
- a calculating means for calculating a statistical value from the number of the plurality of types of biological materials in which the fluorescent luminescent spots represent expression;
- the image processing apparatus according to claim 3, wherein the first display unit displays a graph indicating the statistical value.
- the image processing apparatus further comprising a classifying unit that classifies the observation target region based on the statistical value.
- the image processing apparatus according to claim 5 or 6, further comprising second display means for identifying and displaying the observation target region for each classification.
- the image processing apparatus further comprising a specifying unit that specifies a type of biological material represented by the fluorescent luminescent spot based on an emission wavelength of the fluorescent luminescent spot.
- Computer Input for inputting a fluorescence image representing the expression of the biological material in a tissue specimen stained with a plurality of types of biological materials with a fluorescent bright spot and a morphology image representing the morphology of cells in the tissue specimen and including the same range as the fluorescence image means, Area extraction means for extracting an observation target area from the morphological image; A bright spot extracting means for extracting the fluorescent bright spot from the fluorescent image; A calculating means for calculating a statistical value from the number of the plurality of types of biological substances in which the fluorescent luminescent spots represent expression; Program to function as.
- the image processing apparatus and program of the present invention it is possible to quantify the expression levels of a plurality of types of biological substances in a tissue specimen, and further calculate a statistical value obtained by analyzing the quantitative results.
- FIG. 1 It is a figure which shows the system configuration
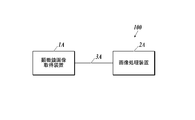
- FIG. 1 shows an example of the overall configuration of the pathological diagnosis support system 100.
- the pathological diagnosis support system 100 acquires a microscopic image of a tissue section of a human body stained with a predetermined staining reagent, and analyzes the acquired microscopic image, thereby expressing the expression of a specific biological material in the tissue section to be observed. This is a system that outputs feature quantities quantitatively.
- the pathological diagnosis support system 100 is configured by connecting a microscope image acquisition apparatus 1A and an image processing apparatus 2A so that data can be transmitted and received via an interface such as a cable 3A.
- the connection method between the microscope image acquisition apparatus 1A and the image processing apparatus 2A is not particularly limited.
- the microscope image acquisition apparatus 1A and the image processing apparatus 2A may be connected via a LAN (Local Area Network) or may be connected wirelessly.
- LAN Local Area Network
- the microscope image acquisition apparatus 1A is a known camera-equipped microscope, which acquires a microscope image of a tissue section on a slide placed on a slide fixing stage and transmits it to the image processing apparatus 2A.
- the microscope image acquisition apparatus 1A includes an irradiation unit, an imaging unit, an imaging unit, a communication I / F, and the like.
- the irradiating means is composed of a light source, a filter, and the like, and irradiates the tissue section on the slide placed on the slide fixing stage with light.
- the imaging means is composed of an eyepiece lens, an objective lens, and the like, and forms an image of transmitted light, reflected light, or fluorescence emitted from the tissue section on the slide by the irradiated light.
- the image pickup means is a microscope-installed camera that includes a CCD (Charge Coupled Device) sensor and the like, picks up an image formed on the image forming surface by the image forming means, and generates digital image data of the microscope image.
- the communication I / F transmits image data of the generated microscope image to the image processing apparatus 2A.
- the microscope image acquisition apparatus 1A includes a bright field unit that combines an irradiation unit and an imaging unit suitable for bright field observation, and a fluorescence unit that combines an irradiation unit and an imaging unit suitable for fluorescence observation. It is possible to switch between bright field / fluorescence by switching.
- what installed the camera in arbitrary well-known microscopes for example, a phase-contrast microscope, a differential interference microscope, an electron microscope, etc.
- 1 A of microscope image acquisition apparatuses for example, a phase-contrast microscope, a differential interference microscope, an electron microscope, etc.
- the microscope image acquisition apparatus 1A is not limited to a microscope with a camera.
- a virtual microscope slide creation apparatus for example, a special microscope scan apparatus that acquires a microscope image of an entire tissue section by scanning a slide on a microscope slide fixing stage). Table 2002-514319
- the virtual microscope slide creation device it is possible to acquire image data that allows a display unit to view a whole tissue section on a slide at a time.
- the image processing apparatus 2A calculates the expression distribution of a specific biological material in the tissue section to be observed by analyzing the microscope image transmitted from the microscope image acquisition apparatus 1A.
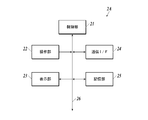
- FIG. 2 shows a functional configuration example of the image processing apparatus 2A.
- the image processing apparatus 2 ⁇ / b> A includes a control unit 21, an operation unit 22, a display unit 23, a communication I / F 24, a storage unit 25, and the like, and each unit is connected via a bus 26. Yes.
- the control unit 21 includes a CPU (Central Processing Unit), a RAM (Random Access Memory), and the like, executes various processes in cooperation with various programs stored in the storage unit 25, and performs image processing 2A. Overall control of the operation. For example, the control unit 21 executes image analysis processing in cooperation with the image processing program stored in the storage unit 25, and functions as a region extraction unit, a bright spot extraction unit, a calculation unit, a classification unit, and a specification unit. Is realized.
- a CPU Central Processing Unit
- RAM Random Access Memory
- the operation unit 22 includes a keyboard having character input keys, numeric input keys, various function keys, and the like, and a pointing device such as a mouse, and includes a key press signal pressed by the keyboard and an operation signal by the mouse. Is output to the control unit 21 as an input signal.
- the display unit 23 includes a monitor such as a CRT (Cathode Ray Tube) or an LCD (Liquid Crystal Display), for example, and displays various screens according to instructions of display signals input from the control unit 21. Functions as the first display unit and the second display unit are realized.
- a monitor such as a CRT (Cathode Ray Tube) or an LCD (Liquid Crystal Display), for example, and displays various screens according to instructions of display signals input from the control unit 21. Functions as the first display unit and the second display unit are realized.
- the communication I / F 24 is an interface for transmitting and receiving data to and from external devices such as the microscope image acquisition device 1A.
- the communication I / F 24 realizes a function as an input unit for fluorescent images and morphological images.
- the storage unit 25 includes, for example, an HDD (Hard Disk Drive), a semiconductor nonvolatile memory, or the like. As described above, the storage unit 25 stores various programs and various data.
- the image processing apparatus 2A may include a LAN adapter, a router, and the like, and be connected to an external device via a communication network such as a LAN.
- the image processing device 2A represents, for example, a fluorescence image transmitted from the microscope image acquisition device 1A and expressing the expression of a specific biological material in a cell as a fluorescent luminescent spot, and a predetermined structure of the cell. Analysis is preferably performed using a morphological image (for example, a bright-field image representing the morphology of cell nuclei, cell membranes, etc.).
- a morphological image for example, a bright-field image representing the morphology of cell nuclei, cell membranes, etc.
- the “bright field image” refers to, for example, a tissue section stained with a hematoxylin staining reagent (H staining reagent) or a hematoxylin-eosin staining reagent (HE staining reagent) and magnified in bright field in the microscope image acquisition apparatus 1A. It is a microscope image obtained by image and imaging
- Hematoxylin (H) is a blue-violet pigment that stains cell nuclei, bone tissue, part of cartilage tissue, serous components, etc. (basophilic tissue, etc.).
- Eodine (E) is a red to pink pigment that stains cytoplasm, connective tissue of soft tissues, erythrocytes, fibrin, endocrine granules (acidophilic tissues, etc.).
- tissue sections are stained with a fluorescent staining reagent that can specifically stain the structure to be diagnosed of cells, and the fluorescence emitted by the fluorescent staining reagent used is photographed. Fluorescent images may be used.
- Examples of the fluorescent staining reagent that can be used for obtaining a morphological image include DAPI staining capable of staining cell nuclei, Papalonic Nicorou staining capable of staining cytoplasm, and the like.
- a “fluorescence image” that expresses the expression of a specific biological substance in a cell as a fluorescent bright spot is a fluorescence obtained by irradiating a tissue section stained with a fluorescent staining reagent with excitation light having a predetermined wavelength in the microscope image acquisition apparatus 1A. It is a microscope image obtained by emitting a substance and enlarging and photographing this fluorescence.
- the fluorescent staining reagent is, for example, a reagent containing fluorescent nanoparticles that specifically bind to and / or react with a specific biological material, but is not limited thereto, and specifically binds to and binds to a specific biological material.
- a reagent containing any fluorescent substance that reacts can be used.
- the “fluorescent nanoparticle” is a nano-sized particle that emits fluorescence when irradiated with excitation light, as will be described in detail later, and has sufficient intensity to represent the target biological substance as a bright spot for each molecule. It is a particle that can emit the fluorescence of.
- the fluorescent nanoparticles preferably, quantum dots (semiconductor nanoparticles) or fluorescent substance-containing nanoparticles are used.
- nanoparticles having an emission wavelength within the sensitivity range of the imaging device 20 of the fluorescence microscope 10 are used. Specifically, nanoparticles having an emission wavelength of 400 to 700 nm are used.
- a fluorescent staining reagent for obtaining a fluorescent image in which the expression of a specific biological substance specifically expressed in cells is expressed by a fluorescent luminescent spot and a staining method of a tissue section using the fluorescent staining reagent will be described.
- Fluorescent substance examples include fluorescent organic dyes and quantum dots (semiconductor particles). When excited by ultraviolet to near infrared light having a wavelength in the range of 200 to 700 nm, it preferably emits visible to near infrared light having a wavelength in the range of 400 to 1100 nm.
- Fluorescent organic dyes include fluorescein dye molecules, rhodamine dye molecules, Alexa Fluor (Invitrogen) dye molecules, BODIPY (Invitrogen) dye molecules, cascade dye molecules, coumarin dye molecules, and eosin dyes. Examples include molecules, NBD dye molecules, pyrene dye molecules, Texas Red dye molecules, and cyanine dye molecules.
- quantum dots quantum dots containing II-VI group compounds, III-V group compounds, or group IV elements as components ("II-VI group quantum dots”, "III-V group quantum dots”, “ Or “Group IV quantum dots”). These quantum dots may be used alone or in combination of a plurality of types. Specific examples include, but are not limited to, CdSe, CdS, CdTe, ZnSe, ZnS, ZnTe, InP, InN, InAs, InGaP, GaP, GaAs, Si, and Ge.
- a quantum dot having the above quantum dot as a core and a shell provided thereon.
- the core is CdSe and the shell is ZnS
- CdSe / ZnS when the core is CdSe and the shell is ZnS, it is expressed as CdSe / ZnS.
- CdSe / ZnS, CdS / ZnS, InP / ZnS, InGaP / ZnS, Si / SiO 2 , Si / ZnS, Ge / GeO 2 , Ge / ZnS, and the like can be used, but are not limited thereto.
- Quantum dots may be subjected to surface treatment with an organic polymer or the like as necessary.
- organic polymer or the like as necessary. Examples thereof include CdSe / ZnS having a surface carboxy group (manufactured by Invitrogen), CdSe / ZnS having a surface amino group (manufactured by Invitrogen), and the like.
- Fluorescent substance-encapsulated nanoparticles are nanoparticles encapsulating the fluorescent substance as described above, and more specifically, those in which the fluorescent substance is dispersed inside the nanoparticles, The fluorescent substance and the nanoparticles themselves may be chemically bonded or may not be bonded.
- the material constituting the nanoparticles is not particularly limited, and examples thereof include silica, polystyrene, polylactic acid, and melamine.
- the fluorescent substance-containing nanoparticles can be produced by a known method.
- silica nanoparticles encapsulating a fluorescent organic dye can be synthesized with reference to the synthesis of FITC-encapsulated silica particles described in Langmuir 8, Vol. 2921 (1992).
- Various fluorescent organic dye-containing silica nanoparticles can be synthesized by using a desired fluorescent organic dye in place of FITC.
- Silica nanoparticles encapsulating quantum dots can be synthesized with reference to the synthesis of CdTe-encapsulated silica nanoparticles described in New Journal of Chemistry, Vol. 33, p. 561 (2009).
- Polystyrene nanoparticles encapsulating a fluorescent organic dye may be copolymerized using an organic dye having a polymerizable functional group described in US Pat. No. 4,326,008 (1982) or polystyrene described in US Pat. No. 5,326,692 (1992). It can be produced using a method of impregnating nanoparticles with a fluorescent organic dye.
- the polymer nanoparticles encapsulating the quantum dots can be prepared by using the method of impregnating the quantum nanoparticles into polystyrene nanoparticles described in Nature Biotechnology, Vol. 19, page 631 (2001).
- the average particle diameter is obtained by taking an electron micrograph using a scanning electron microscope (SEM), measuring the cross-sectional area of a sufficient number of particles, and taking each measured value as the area of the circle. It is the value calculated as. In this embodiment, the arithmetic average of the particle diameters of 1000 particles is defined as the average particle diameter.
- the coefficient of variation is also a value calculated from the particle size distribution of 1000 particles.
- fluorescent nanoparticle and biological material recognition site are directly bonded in advance as a fluorescent staining reagent that specifically binds and / or reacts with a specific biological material.
- a “biological substance recognition site” is a site that specifically binds and / or reacts with a specific biological material.
- the specific biological substance is not particularly limited as long as a substance that specifically binds to the specific biological substance exists, but typically includes proteins (peptides) and nucleic acids (oligonucleotides, polynucleotides). It is done.
- examples of the biological substance recognition site include an antibody that recognizes the protein as an antigen, another protein that specifically binds to the protein, and a nucleic acid having a base sequence that hybridizes to the nucleic acid.
- Specific biological substance recognition sites include anti-HER2 antibody that specifically binds to HER2, which is a protein present on the cell surface, anti-ER antibody that specifically binds to estrogen receptor (ER) present in the cell nucleus, cells An anti-actin antibody that specifically binds to actin forming the skeleton is exemplified.
- anti-HER2 antibody and anti-ER antibody combined with fluorescent nanoparticles are preferable because they can be used for breast cancer medication selection.
- the mode of binding between the biological substance recognition site and the fluorescent nanoparticle is not particularly limited, and examples thereof include covalent bonding, ionic bonding, hydrogen bonding, coordination bonding, physical adsorption, and chemical adsorption.
- a bond having a strong bonding force such as a covalent bond is preferable from the viewpoint of bond stability.
- an organic molecule that connects the biological substance recognition site and the fluorescent nanoparticle.
- a polyethylene glycol chain can be used, and SM (PEG) 12 manufactured by Thermo Scientific can be used.
- a silane coupling agent that is a compound widely used for bonding an inorganic substance and an organic substance can be used.
- This silane coupling agent is a compound having an alkoxysilyl group that gives a silanol group by hydrolysis at one end of the molecule and a functional group such as a carboxyl group, an amino group, an epoxy group, an aldehyde group at the other end, Bonding with an inorganic substance through an oxygen atom of the silanol group.
- silane coupling agent having a polyethylene glycol chain (for example, PEG-silane no.SIM6492.7 manufactured by Gelest), etc. Is mentioned.
- silane coupling agent you may use 2 or more types together.
- a known procedure can be used for the reaction procedure of the fluorescent organic dye-encapsulated silica nanoparticles and the silane coupling agent.
- the obtained fluorescent organic dye-encapsulated silica nanoparticles are dispersed in pure water, aminopropyltriethoxysilane is added, and the mixture is reacted at room temperature for 12 hours.
- fluorescent organic dye-encapsulated silica nanoparticles whose surface is modified with an aminopropyl group can be obtained by centrifugation or filtration.
- the antibody can be bound to the fluorescent organic dye-encapsulated silica nanoparticles via an amide bond.
- a condensing agent such as EDC (1-Ethyl-3- [3-Dimethylaminopropyl] carbodiimide Hydrochloride: manufactured by Pierce (registered trademark)
- EDC 1-Ethyl-3- [3-Dimethylaminopropyl] carbodiimide Hydrochloride: manufactured by Pierce (registered trademark)
- a linker compound having a site that can be directly bonded to the fluorescent organic dye-encapsulated silica nanoparticles modified with organic molecules and a site that can be bonded to the molecular target substance can be used.
- sulfo-SMCC Sulfosuccinimidyl 4 [N-maleimidomethyl] -cyclohexane-1-carboxylate: manufactured by Pierce
- sulfo-SMCC Sulfosuccinimidyl 4 [N-maleimidomethyl] -cyclohexane-1-carboxylate: manufactured by Pierce
- fluorescent substance-encapsulated polystyrene nanoparticles When binding a biological material recognition site to fluorescent substance-encapsulated polystyrene nanoparticles, the same procedure can be applied regardless of whether the fluorescent substance is a fluorescent organic dye or a quantum dot. That is, by impregnating a fluorescent nanopigment or quantum dot into polystyrene nanoparticles having a functional group such as an amino group, fluorescent substance-containing polystyrene nanoparticles having a functional group can be obtained, and thereafter using EDC or sulfo-SMCC. Thus, antibody-bound fluorescent substance-encapsulated polystyrene nanoparticles can be produced.
- biological substance recognition sites include M. actin, MS actin, SM actin, ACTH, Alk-1, ⁇ 1-antichymotrypsin, ⁇ 1-antitrypsin, AFP, bcl-2, bcl-6, ⁇ -catenin, BCA 225 , CA19-9, CA125, calcitonin, calretinin, CD1a, CD3, CD4, CD5, CD8, CD10, CD15, CD20, CD21, CD23, CD30, CD31, CD34, CD43, CD45, CD45R, CD56, CD57, CD61, CD68 , CD79a, "CD99, MIC2", CD138, chromogranin, c-KIT, c-MET, collagen type IV, Cox-2, cyclin D1, keratin, cytokeratin (high molecular weight), pankeratin, pankeratin, cytokeratin 5 / 6, Cytokeratin 7, Cytokeratin 8, Cytokeratin 8
- the fluorescent nanoparticles may be used by directly binding to the biological material recognition site in advance as described above, or may be indirectly bound to the biological material recognition site in the staining step as in a known indirect method in immunostaining. good. Specifically, for example, a tissue specimen is reacted with a biotinylated primary antibody having a specific biological substance as an antigen, and then further reacted with a staining reagent to which fluorescent nanoparticles modified with streptavidin are bound. Alternatively, staining may be performed using the fact that streptavidin and biotin specifically bind to form a complex.
- a fluorescent nanoparticle modified with streptavidin after reacting a tissue specimen with a primary antibody having a specific protein as an antigen and further reacting with a biotinylated secondary antibody having the primary antibody as an antigen. You may make it react and dye
- the method for preparing tissue sections is not particularly limited, and those prepared by known methods can be used.
- the following staining method is not limited to a pathological tissue section, but can also be applied to cultured cells.
- a tissue section is immersed in a container containing xylene to remove paraffin.
- the temperature is not particularly limited, but can be performed at room temperature.
- the immersion time is preferably 3 minutes or longer and 30 minutes or shorter. If necessary, xylene may be exchanged during the immersion.
- the tissue section is immersed in a container containing ethanol to remove xylene.
- the temperature is not particularly limited, but can be performed at room temperature.
- the immersion time is preferably 3 minutes or longer and 30 minutes or shorter. If necessary, ethanol may be exchanged during the immersion.
- the tissue section is immersed in a container containing water to remove ethanol.
- the temperature is not particularly limited, but can be performed at room temperature.
- the immersion time is preferably 3 minutes or longer and 30 minutes or shorter. If necessary, water may be exchanged during the immersion.
- the activation process of the biological material of a tissue section is performed according to a known method.
- the activation conditions are not particularly defined, but as the activation liquid, 0.01 M citrate buffer (pH 6.0), 1 mM EDTA solution (pH 8.0), 5% urea, 0.1 M Tris-HCl buffer, etc. Can be used.
- An autoclave, a microwave, a pressure cooker, a water bath, etc. can be used for a heating apparatus.
- the temperature is not particularly limited, but can be performed at room temperature. The temperature can be 50 to 130 ° C. and the time can be 5 to 30 minutes.
- the tissue section after the activation treatment is immersed in a container containing PBS (Phosphate Buffered Saline) and washed.
- PBS Phosphate Buffered Saline
- the temperature is not particularly limited, but can be performed at room temperature.
- the immersion time is preferably 3 minutes or longer and 30 minutes or shorter. If necessary, PBS may be exchanged during immersion.
- each fluorescent nanoparticle PBS dispersion may be mixed in advance or separately placed on the tissue section separately. May be.
- the temperature is not particularly limited, but can be performed at room temperature.
- the reaction time is preferably 30 minutes or more and 24 hours or less.
- a known blocking agent such as BSA-containing PBS
- a fluorescent staining reagent it is preferable to drop a known blocking agent such as BSA-containing PBS before staining with a fluorescent staining reagent.
- the stained tissue section is immersed in a container containing PBS to remove unreacted fluorescent nanoparticles.
- the temperature is not particularly limited, but can be performed at room temperature.
- the immersion time is preferably 3 minutes or longer and 30 minutes or shorter. If necessary, PBS may be exchanged during immersion.
- a cover glass is placed on the tissue section and sealed. A commercially available encapsulant may be used as necessary.
- a microscope image (fluorescence image) is acquired from the stained tissue section using the microscope image acquisition device 1A.
- the excitation light source and the optical filter for fluorescence detection those corresponding to the absorption maximum wavelength and the fluorescence wavelength of the fluorescent material used in the fluorescent staining reagent are appropriately selected.
- diagnosis support information generation system 100 a specific embodiment of the operation of acquiring a morphological image representing the morphology of a cell and a fluorescence image representing the expression of a plurality of types of biological substances in the cell and calculating a statistical value is described.
- the present invention is not limited to the following embodiments.
- a case where a statistical value for classifying a subtype of breast cancer is calculated from an image obtained by imaging a tissue section based on the expression levels of a plurality of biological substances will be described as an example.
- Various subtypes are known for breast cancer cells, and it is preferable to perform appropriate treatment depending on the subtype. As shown in Table 1, breast cancer subtypes can be classified into five types depending on whether the expression of hormone receptors (ER and PgR), HER2 and Ki67 is positive (+) or negative (-). It is common.
- an operator performs HE staining of a tissue section collected from breast cancer tissue, and then performs fluorescent staining of a plurality of types of biological substances (ER, PgR, HER2, and Ki67) using fluorescent nanoparticles. It is preferable that the plurality of types of biological substances are stained using fluorescent nanoparticles having different light emission characteristics.
- a bright-field image is acquired as a morphological image representing the morphology of the cell nucleus. Thereafter, a bright-field image and a fluorescence image are acquired using the microscope image acquisition apparatus 1A according to the following procedures (a1) to (a5).
- (A1) The operator places the tissue section on a slide and places the slide on the slide fixing stage of the microscope image acquisition apparatus 1A.
- the unit is set as a bright field unit, the imaging magnification and the focus are adjusted, and the region to be observed on the tissue section is placed in the field of view.
- A3 Shooting is performed by an imaging unit to generate image data of a bright field image (morphological image), and the image data is transmitted to the image processing apparatus 2A.
- A4) Change the unit to a fluorescent unit.
- A5) Shooting is performed by the imaging means without changing the field of view and the shooting magnification, image data of a fluorescent image is generated, and the image data is transmitted to the image processing apparatus 2A.
- the above step (a5) is repeated according to the type of fluorescent nanoparticles used for staining.
- the process of (a5) is performed four times, and four fluorescent images representing the emission of the fluorescent nanoparticles used for staining ER, PgR, HER2, and Ki67, respectively, are acquired. To do.
- the excitation light and the filter used for acquiring each fluorescent image a combination suitable for the emission characteristics is appropriately selected.
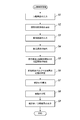
- FIG. 3 shows a flowchart of the image analysis process.
- the image analysis processing of the present invention is executed in cooperation with the control unit 21 and an image processing program stored in the storage unit 25, and the control unit 21 performs processing described in the following embodiments according to the image processing program. Execute.
- step S1 when a morphological image is input from the microscope image acquisition device 1A through the communication I / F 24 (step S1: input process), the control unit 21 is stained in blue-violet by HE staining as an observation target region from the morphological image. A cell nucleus region is extracted (step S2: region extraction step).
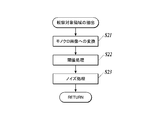
- step S2 for example, as shown in FIG. 4, the morphological image is converted into a monochrome image (step S21), and the monochrome image is subjected to threshold processing with a predetermined threshold to binarize the value of each pixel (step S22). ) Noise processing is executed on the binary image (step S23).
- the noise process can be performed by performing a closing process on the binary image.
- the closing process is a process in which the contraction process is performed the same number of times after the expansion process is performed.
- the expansion process is a process of replacing a target pixel with white when at least one pixel in the range of n ⁇ n pixels (n is an integer of 2 or more) from the target pixel is white.
- the contraction process is a process of replacing a target pixel with black when at least one pixel in the range of n ⁇ n pixels from the target pixel contains black.
- step S3 when a plurality of fluorescent images acquired by the microscope image acquisition device 1A are input by the communication I / F 24 (step S3: input process), the control unit 21 extracts fluorescent luminescent spots from the respective fluorescent images (step S3).
- step S4 Bright spot extraction step), “Coordinate information”, “Color information”, etc. of the fluorescent bright spot are extracted.
- the “coordinate information” of the fluorescent luminescent spot is, for example, the position of the fluorescent luminescent spot in the fluorescent image indicated on two-dimensional coordinates.
- the “color information” of the fluorescent luminescent spot is, for example, the peak value of the emission wavelength of the fluorescent luminescent spot, and is extracted based on which fluorescent image the fluorescent luminescent spot is extracted from.
- the process of step S4 can be performed by any known method using, for example, public analysis software ImageJ, all bright spot automatic measurement software G-Count manufactured by G.ANG.
- the information related to the positional relationship between the fluorescent luminescent spot and the cell nucleus region is, for example, information such as whether or not the fluorescent luminescent spot is in the cell nucleus region, the distance from the fluorescent luminescent spot to the nearest cell nucleus region, and the like. Furthermore, a cell nucleus region belonging to the same cell as the fluorescent luminescent spot may be determined based on information on the positional relationship, and the result may be included in “information on the positional relationship between the fluorescent luminescent spot and the cell nuclear region”.
- Step S6 specific process.
- processing for removing fluorescent bright spots derived from background noise may be further performed. Specifically, for example, when the distance from the fluorescent luminescent spot to the nearest cell nucleus region is larger than a predetermined value, the fluorescent luminescent spot is determined as noise outside the cell and excluded.
- a statistical value is calculated from the number of a plurality of types of biological materials in which the fluorescent luminescent spots indicate expression (step S7: calculation step).
- the statistical value is, for example, a value related to the sum of the number of expression for each biological material, the number of expression of each biological material per cell, and is useful for diagnosis depending on the type of tissue specimen, lesion, stained biological material, etc. An appropriate value is calculated as appropriate.
- subtype classification is generally performed based on the expression numbers of ER, PgR, HER2, and Ki67. Therefore, in the present embodiment, first, “type of biological material represented by fluorescent bright spot” and fluorescence Using the information of the cell nucleus region belonging to the same cell as the bright spot, the number of expression of a plurality of types of biological materials is calculated for each type of biological material. A statistical value related to the expression level of a plurality of types of biological substances per cell is calculated.
- the closest one of the second biological materials belonging to the same cell is selected for one first biological material, Is calculated and averaged for each cell.
- a value obtained by weighting the expression number of a plurality of types of biological substances per cell using the average value of the distance is used as a statistical value.
- step S8 classification step.
- a classification index data (for example, a table) indicating the relationship between classification items such as cancer subtypes and malignancy and expression levels of a plurality of types of biological substances is prepared in advance and stored in the storage unit 25. It is preferable. Different indices are prepared depending on the type of tissue specimen, lesion, stained biological material, and the like.
- Table 2 is an example of a table showing the relationship between the breast cancer subtype classification and the level of malignancy and the expression level of the biological material.
- the expression level of the biological material whose expression level per cell is less than the threshold value is indicated by a score of “ ⁇ ”.
- the expression level of the biological substance evaluated as positive when the expression level per cell is equal to or higher than the threshold value is indicated by a 5-level score of “+”, “++”, “++++”, “++++”, and “++++++++”. (The more “+”, the higher the expression level).
- Luminal B HER2 (+)
- HER2-enriched and Basal-like TN: Triple Negative
- the expression level of each biological material for each cell is determined according to the statistical value calculated from the expression level of each biological material per cell in step S7. Score in 6 grades: +++++. Then, the subtype and level of the cell are classified by searching the subtype and level corresponding to the score of each biological material to find out which subtype and level correspond. For example, according to the statistical value, when the number of HER2 biological substances expressed per cell is within the range of 0 to 180 in the cells in the image, 0 to 180 is scored in 6 stages. When a cell has an ER score of “++++++”, a PgR score of “++”, and a HER2 score of “++++++”, from Table 2, the cell is found to be Level 3 Luminal B (HER2 (+) ).
- FIG. 5 is an example of a two-dimensional histogram displaying the number of HER2 and ER expression per cell in the entire region of the morphological image as a statistical value.
- the subtype of cells with high expression of HER2 and ER is Luminal B (HER2 (+)).
- Luminal B HER2 (+)
- FIG. 5 cells close to the maximum number of expression per cell of HER2 and ER. It is easy to grasp that the number of Luminal B (HER2 (+)) cells at the highest level 3 is the highest.
- the items displayed in the display of the statistical values are not limited to the number of ER and HER2 expression in FIG. 5, but are preferably selected and switched by the operator.
- step S9 the classification result in step S8 may be further displayed (second display step).
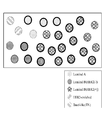
- FIG. 6 shows an image of a cell nucleus region extracted from a morphological image, color-coded according to the subtype of the cell as a classification result, and the thickness of the contour line changed according to the level of malignancy. It is an example. The image and the morphological image in FIG. Thereby, it is possible to easily grasp what subtypes and levels of cancer cells are distributed.
- the expression levels of a plurality of biological materials in a tissue specimen can be quantified, and further, statistical values obtained by analyzing the expression levels of the plurality of biological materials can be calculated. Based on the expression level, the type and degree of lesion can be classified in detail. Thereby, the precision of pathological diagnosis can be improved and a more detailed treatment plan can be made.
- a plurality of types of biological materials are stained with fluorescent nanoparticles having different emission characteristics, and fluorescence images are acquired by using excitation light and filters according to the emission characteristics.
- the type of biological material is determined based on the emission wavelength of the nanoparticles
- fluorescent nanoparticles having the same luminescence characteristics can be used depending on the combination of biological materials to be stained. For example, when analyzing the expression of multiple types of biological materials with different expression positions, such as HER2 expressed in the cell membrane and Ki67 expressed in the cell nucleus, the cell nucleus region extracted from the morphological image and the fluorescence image are extracted.
- the type of biological material represented by the fluorescent luminescent spots can be determined. Specifically, in step S6, when the fluorescent bright spot is present in the cell nucleus, Ki67, outside the cell nucleus region and within the predetermined range, HER2, cell nucleus region If it is more than a predetermined distance away from it, it is judged as noise.
- observation target region extracted from the morphological image in addition to the cell nucleus region, a cell membrane and other regions having an arbitrary structure in the cell can be extracted and used.
- a plurality of types of structures such as cell nuclei and cell membranes may be extracted as observation target areas.
- an HDD, a semiconductor nonvolatile memory, or the like is used as a computer-readable medium for the program according to the present invention, but the present invention is not limited to this example.
- a portable recording medium such as a CD-ROM can be applied.
- a carrier wave carrier wave
- the detailed configuration and detailed operation of each device constituting the diagnosis support information generating system 100 can be changed as appropriate without departing from the spirit of the invention.
- the present invention is suitable for providing an image processing apparatus and program capable of quantifying the expression levels of a plurality of types of biological materials in a tissue specimen and further calculating a statistical value obtained by analyzing the quantification result. .
Landscapes
- Engineering & Computer Science (AREA)
- Health & Medical Sciences (AREA)
- Physics & Mathematics (AREA)
- General Physics & Mathematics (AREA)
- Life Sciences & Earth Sciences (AREA)
- Theoretical Computer Science (AREA)
- Computer Vision & Pattern Recognition (AREA)
- Immunology (AREA)
- General Health & Medical Sciences (AREA)
- Chemical & Material Sciences (AREA)
- Pathology (AREA)
- Analytical Chemistry (AREA)
- Biochemistry (AREA)
- Molecular Biology (AREA)
- Biomedical Technology (AREA)
- Nuclear Medicine, Radiotherapy & Molecular Imaging (AREA)
- Urology & Nephrology (AREA)
- Hematology (AREA)
- Medical Informatics (AREA)
- Data Mining & Analysis (AREA)
- Artificial Intelligence (AREA)
- Evolutionary Computation (AREA)
- Multimedia (AREA)
- Food Science & Technology (AREA)
- Medicinal Chemistry (AREA)
- Radiology & Medical Imaging (AREA)
- Quality & Reliability (AREA)
- Databases & Information Systems (AREA)
- General Engineering & Computer Science (AREA)
- Evolutionary Biology (AREA)
- Computing Systems (AREA)
- Bioinformatics & Computational Biology (AREA)
- Bioinformatics & Cheminformatics (AREA)
- Software Systems (AREA)
- Biotechnology (AREA)
- Cell Biology (AREA)
- Microbiology (AREA)
- Chemical Kinetics & Catalysis (AREA)
- Optics & Photonics (AREA)
- Investigating Or Analysing Biological Materials (AREA)
Abstract
Priority Applications (3)
| Application Number | Priority Date | Filing Date | Title |
|---|---|---|---|
| EP17741300.2A EP3407063A4 (fr) | 2016-01-19 | 2017-01-13 | Dispositif et programme de traitement d'image |
| US16/069,640 US10761027B2 (en) | 2016-01-19 | 2017-01-13 | Image processing apparatus and computer-readable recording medium storing program |
| JP2017562541A JP6763407B2 (ja) | 2016-01-19 | 2017-01-13 | 画像処理装置及びプログラム |
Applications Claiming Priority (2)
| Application Number | Priority Date | Filing Date | Title |
|---|---|---|---|
| JP2016-007778 | 2016-01-19 | ||
| JP2016007778 | 2016-01-19 |
Publications (1)
| Publication Number | Publication Date |
|---|---|
| WO2017126420A1 true WO2017126420A1 (fr) | 2017-07-27 |
Family
ID=59361676
Family Applications (1)
| Application Number | Title | Priority Date | Filing Date |
|---|---|---|---|
| PCT/JP2017/000965 Ceased WO2017126420A1 (fr) | 2016-01-19 | 2017-01-13 | Dispositif et programme de traitement d'image |
Country Status (4)
| Country | Link |
|---|---|
| US (1) | US10761027B2 (fr) |
| EP (1) | EP3407063A4 (fr) |
| JP (1) | JP6763407B2 (fr) |
| WO (1) | WO2017126420A1 (fr) |
Cited By (5)
| Publication number | Priority date | Publication date | Assignee | Title |
|---|---|---|---|---|
| WO2019221062A1 (fr) * | 2018-05-17 | 2019-11-21 | コニカミノルタ株式会社 | Procédé d'évaluation d'un médicament |
| JP2020042165A (ja) * | 2018-09-11 | 2020-03-19 | 浜松ホトニクス株式会社 | 測定装置および測定方法 |
| CN111476754A (zh) * | 2020-02-28 | 2020-07-31 | 中国人民解放军陆军军医大学第二附属医院 | 一种骨髓细胞影像人工智能辅助分级诊断系统及方法 |
| WO2020166469A1 (fr) * | 2019-02-15 | 2020-08-20 | コニカミノルタ株式会社 | Méthode de fourniture d'informations, dispositif de fourniture d'informations et programme |
| WO2022059300A1 (fr) * | 2020-09-15 | 2022-03-24 | コニカミノルタ株式会社 | Procédé de traitement d'image, dispositif de traitement d'image et programme de traitement d'image |
Families Citing this family (2)
| Publication number | Priority date | Publication date | Assignee | Title |
|---|---|---|---|---|
| JP2021535484A (ja) * | 2018-08-30 | 2021-12-16 | アプライド マテリアルズ インコーポレイテッドApplied Materials, Incorporated | 自動的な腫瘍検出及び分類のためのシステム |
| EP4403902A4 (fr) * | 2021-09-16 | 2025-08-13 | Korea Advanced Inst Sci & Tech | Appareil et procédé de traitement d'image |
Citations (7)
| Publication number | Priority date | Publication date | Assignee | Title |
|---|---|---|---|---|
| US4326008A (en) | 1976-08-27 | 1982-04-20 | California Institute Of Technology | Protein specific fluorescent microspheres for labelling a protein |
| US5326692A (en) | 1992-05-13 | 1994-07-05 | Molecular Probes, Inc. | Fluorescent microparticles with controllable enhanced stokes shift |
| JP2002514319A (ja) | 1997-03-03 | 2002-05-14 | バクス リサーチ ラボラトリーズ インコーポレイテッド | バーチャル顕微鏡スライドを作成する方法および装置 |
| JP2011179924A (ja) | 2010-02-26 | 2011-09-15 | Olympus Corp | 顕微鏡システム、標本観察方法およびプログラム |
| JP2012503180A (ja) * | 2008-09-16 | 2012-02-02 | ヒストロックス,インコーポレイテッド. | バイオマーカー発現の再現性のある定量 |
| JP2012037432A (ja) * | 2010-08-09 | 2012-02-23 | Olympus Corp | 顕微鏡システム、標本観察方法およびプログラム |
| JP5835536B1 (ja) * | 2014-03-26 | 2015-12-24 | コニカミノルタ株式会社 | 組織評価方法、画像処理装置、病理診断支援システム及びプログラム |
Family Cites Families (12)
| Publication number | Priority date | Publication date | Assignee | Title |
|---|---|---|---|---|
| JPS5835536B2 (ja) | 1978-05-22 | 1983-08-03 | 大日本インキ化学工業株式会社 | 樹脂組成物 |
| US20050037406A1 (en) * | 2002-06-12 | 2005-02-17 | De La Torre-Bueno Jose | Methods and apparatus for analysis of a biological specimen |
| US7272252B2 (en) * | 2002-06-12 | 2007-09-18 | Clarient, Inc. | Automated system for combining bright field and fluorescent microscopy |
| US20060178833A1 (en) * | 2005-02-04 | 2006-08-10 | Bauer Kenneth D | System for and method of providing diagnostic information through microscopic imaging |
| US8244021B2 (en) * | 2006-12-20 | 2012-08-14 | Ventana Medical Systems, Inc. | Quantitative, multispectral image analysis of tissue specimens stained with quantum dots |
| JP5407015B2 (ja) * | 2008-07-10 | 2014-02-05 | 国立大学法人徳島大学 | 画像処理装置、画像処理方法、コンピュータ実行可能な画像処理プログラム、及び顕微鏡システム |
| AU2010307140B2 (en) * | 2009-10-12 | 2014-05-15 | Ventana Medical Systems, Inc. | Multi-modality contrast and brightfield context rendering for enhanced pathology determination and multi-analyte detection in tissue |
| EP3466335B1 (fr) * | 2011-12-21 | 2024-07-31 | Catherine M. Shachaf | Méthode pour l'imagerie de fluorecence avec autofocus |
| EP2833123A4 (fr) * | 2012-03-30 | 2015-12-09 | Konica Minolta Inc | Processeur d'image médical et programme |
| US9964489B2 (en) * | 2014-09-16 | 2018-05-08 | Lawrence Livermore National Security, Llc | System and method for controlling depth of imaging in tissues using fluorescence microscopy under ultraviolet excitation following staining with fluorescing agents |
| EP3306306A1 (fr) * | 2015-06-04 | 2018-04-11 | Panasonic Corporation | Procédé de traitement d'image et dispositif de traitement d'image |
| JP6231709B1 (ja) * | 2016-05-31 | 2017-11-15 | シスメックス株式会社 | 蛍光画像分析装置および分析方法 |
-
2017
- 2017-01-13 WO PCT/JP2017/000965 patent/WO2017126420A1/fr not_active Ceased
- 2017-01-13 JP JP2017562541A patent/JP6763407B2/ja active Active
- 2017-01-13 US US16/069,640 patent/US10761027B2/en active Active
- 2017-01-13 EP EP17741300.2A patent/EP3407063A4/fr not_active Withdrawn
Patent Citations (8)
| Publication number | Priority date | Publication date | Assignee | Title |
|---|---|---|---|---|
| US4326008A (en) | 1976-08-27 | 1982-04-20 | California Institute Of Technology | Protein specific fluorescent microspheres for labelling a protein |
| US5326692A (en) | 1992-05-13 | 1994-07-05 | Molecular Probes, Inc. | Fluorescent microparticles with controllable enhanced stokes shift |
| US5326692B1 (en) | 1992-05-13 | 1996-04-30 | Molecular Probes Inc | Fluorescent microparticles with controllable enhanced stokes shift |
| JP2002514319A (ja) | 1997-03-03 | 2002-05-14 | バクス リサーチ ラボラトリーズ インコーポレイテッド | バーチャル顕微鏡スライドを作成する方法および装置 |
| JP2012503180A (ja) * | 2008-09-16 | 2012-02-02 | ヒストロックス,インコーポレイテッド. | バイオマーカー発現の再現性のある定量 |
| JP2011179924A (ja) | 2010-02-26 | 2011-09-15 | Olympus Corp | 顕微鏡システム、標本観察方法およびプログラム |
| JP2012037432A (ja) * | 2010-08-09 | 2012-02-23 | Olympus Corp | 顕微鏡システム、標本観察方法およびプログラム |
| JP5835536B1 (ja) * | 2014-03-26 | 2015-12-24 | コニカミノルタ株式会社 | 組織評価方法、画像処理装置、病理診断支援システム及びプログラム |
Non-Patent Citations (4)
| Title |
|---|
| LANGMUIR, vol. 8, 1992, pages 2921 |
| NATURE BIOTECHNOLOGY, vol. 19, 2001, pages 631 |
| NEW JOURNAL OF CHEMISTRY, vol. 33, 2009, pages 561 |
| See also references of EP3407063A4 |
Cited By (12)
| Publication number | Priority date | Publication date | Assignee | Title |
|---|---|---|---|---|
| WO2019221062A1 (fr) * | 2018-05-17 | 2019-11-21 | コニカミノルタ株式会社 | Procédé d'évaluation d'un médicament |
| JP2020042165A (ja) * | 2018-09-11 | 2020-03-19 | 浜松ホトニクス株式会社 | 測定装置および測定方法 |
| JP7158220B2 (ja) | 2018-09-11 | 2022-10-21 | 浜松ホトニクス株式会社 | 測定装置および測定方法 |
| WO2020166469A1 (fr) * | 2019-02-15 | 2020-08-20 | コニカミノルタ株式会社 | Méthode de fourniture d'informations, dispositif de fourniture d'informations et programme |
| JPWO2020166469A1 (ja) * | 2019-02-15 | 2021-12-16 | コニカミノルタ株式会社 | 情報提供方法、情報提供装置及びプログラム |
| JP7593112B2 (ja) | 2019-02-15 | 2024-12-03 | コニカミノルタ株式会社 | 情報提供方法、情報提供装置及びプログラム |
| US12175660B2 (en) | 2019-02-15 | 2024-12-24 | Konica Minolta, Inc. | Method, device, and program for obtaining information from tissue sections for pathological diagnosis support |
| CN111476754A (zh) * | 2020-02-28 | 2020-07-31 | 中国人民解放军陆军军医大学第二附属医院 | 一种骨髓细胞影像人工智能辅助分级诊断系统及方法 |
| CN111476754B (zh) * | 2020-02-28 | 2022-12-09 | 中国人民解放军陆军军医大学第二附属医院 | 一种骨髓细胞影像人工智能辅助分级诊断系统及方法 |
| WO2022059300A1 (fr) * | 2020-09-15 | 2022-03-24 | コニカミノルタ株式会社 | Procédé de traitement d'image, dispositif de traitement d'image et programme de traitement d'image |
| JPWO2022059300A1 (fr) * | 2020-09-15 | 2022-03-24 | ||
| JP7803278B2 (ja) | 2020-09-15 | 2026-01-21 | コニカミノルタ株式会社 | 画像処理方法、画像処理装置、および画像処理プログラム |
Also Published As
| Publication number | Publication date |
|---|---|
| US20180372642A1 (en) | 2018-12-27 |
| JP6763407B2 (ja) | 2020-09-30 |
| US10761027B2 (en) | 2020-09-01 |
| JPWO2017126420A1 (ja) | 2018-11-08 |
| EP3407063A1 (fr) | 2018-11-28 |
| EP3407063A4 (fr) | 2018-11-28 |
Similar Documents
| Publication | Publication Date | Title |
|---|---|---|
| US11035844B2 (en) | Image processing device, pathological diagnosis support system, storage medium for image processing, and image processing method | |
| JP6350527B2 (ja) | 画像処理装置、病理診断支援システム、画像処理プログラム及び病理診断支援方法 | |
| JP6443450B2 (ja) | 画像処理装置、画像処理方法、及びプログラム | |
| JP6763407B2 (ja) | 画像処理装置及びプログラム | |
| JP6597316B2 (ja) | 画像処理装置及びプログラム | |
| WO2016093090A1 (fr) | Appareil de traitement d'image et programme de traitement d'image | |
| JP6635108B2 (ja) | 画像処理装置、画像処理方法、及び画像処理プログラム | |
| JP7173034B2 (ja) | 画像処理装置、合焦位置特定方法及び合焦位置特定プログラム | |
| JP5768948B1 (ja) | 画像処理装置および画像処理プログラム | |
| JP7235036B2 (ja) | 画像処理方法、画像処理装置及びプログラム | |
| WO2018143406A1 (fr) | Dispositif et programme de traitement d'images | |
| JP6493398B2 (ja) | 診断支援情報生成方法、画像処理装置、診断支援情報生成システム及び画像処理プログラム | |
| JP5835536B1 (ja) | 組織評価方法、画像処理装置、病理診断支援システム及びプログラム | |
| WO2016080187A1 (fr) | Procédé de traitement d'image, dispositif de traitement d'image et programme | |
| JP6702339B2 (ja) | 画像処理装置及びプログラム | |
| JP6405985B2 (ja) | 画像処理装置、画像処理システム、画像処理プログラム及び画像処理方法 | |
| JP6337629B2 (ja) | 診断支援情報生成方法、画像処理装置、診断支援情報生成システム及び画像処理プログラム | |
| JP6375925B2 (ja) | 画像処理装置、画像処理システム、画像処理プログラム及び画像処理方法 |
Legal Events
| Date | Code | Title | Description |
|---|---|---|---|
| 121 | Ep: the epo has been informed by wipo that ep was designated in this application |
Ref document number: 17741300 Country of ref document: EP Kind code of ref document: A1 |
|
| ENP | Entry into the national phase |
Ref document number: 2017562541 Country of ref document: JP Kind code of ref document: A |
|
| NENP | Non-entry into the national phase |
Ref country code: DE |
|
| WWE | Wipo information: entry into national phase |
Ref document number: 2017741300 Country of ref document: EP |
|
| ENP | Entry into the national phase |
Ref document number: 2017741300 Country of ref document: EP Effective date: 20180820 |