WO2017145529A1 - Système de calcul - Google Patents
Système de calcul Download PDFInfo
- Publication number
- WO2017145529A1 WO2017145529A1 PCT/JP2017/000397 JP2017000397W WO2017145529A1 WO 2017145529 A1 WO2017145529 A1 WO 2017145529A1 JP 2017000397 W JP2017000397 W JP 2017000397W WO 2017145529 A1 WO2017145529 A1 WO 2017145529A1
- Authority
- WO
- WIPO (PCT)
- Prior art keywords
- light
- filter
- wavelength
- wavelength range
- calculation system
- Prior art date
- Legal status (The legal status is an assumption and is not a legal conclusion. Google has not performed a legal analysis and makes no representation as to the accuracy of the status listed.)
- Ceased
Links
Images




Classifications
-
- A—HUMAN NECESSITIES
- A61—MEDICAL OR VETERINARY SCIENCE; HYGIENE
- A61B—DIAGNOSIS; SURGERY; IDENTIFICATION
- A61B5/00—Measuring for diagnostic purposes; Identification of persons
- A61B5/145—Measuring characteristics of blood in vivo, e.g. gas concentration or pH-value ; Measuring characteristics of body fluids or tissues, e.g. interstitial fluid or cerebral tissue
- A61B5/1455—Measuring characteristics of blood in vivo, e.g. gas concentration or pH-value ; Measuring characteristics of body fluids or tissues, e.g. interstitial fluid or cerebral tissue using optical sensors, e.g. spectral photometrical oximeters
-
- A—HUMAN NECESSITIES
- A61—MEDICAL OR VETERINARY SCIENCE; HYGIENE
- A61B—DIAGNOSIS; SURGERY; IDENTIFICATION
- A61B1/00—Instruments for performing medical examinations of the interior of cavities or tubes of the body by visual or photographical inspection, e.g. endoscopes; Illuminating arrangements therefor
- A61B1/06—Instruments for performing medical examinations of the interior of cavities or tubes of the body by visual or photographical inspection, e.g. endoscopes; Illuminating arrangements therefor with illuminating arrangements
- A61B1/0638—Instruments for performing medical examinations of the interior of cavities or tubes of the body by visual or photographical inspection, e.g. endoscopes; Illuminating arrangements therefor with illuminating arrangements providing two or more wavelengths
-
- A—HUMAN NECESSITIES
- A61—MEDICAL OR VETERINARY SCIENCE; HYGIENE
- A61B—DIAGNOSIS; SURGERY; IDENTIFICATION
- A61B1/00—Instruments for performing medical examinations of the interior of cavities or tubes of the body by visual or photographical inspection, e.g. endoscopes; Illuminating arrangements therefor
-
- A—HUMAN NECESSITIES
- A61—MEDICAL OR VETERINARY SCIENCE; HYGIENE
- A61B—DIAGNOSIS; SURGERY; IDENTIFICATION
- A61B1/00—Instruments for performing medical examinations of the interior of cavities or tubes of the body by visual or photographical inspection, e.g. endoscopes; Illuminating arrangements therefor
- A61B1/00002—Operational features of endoscopes
- A61B1/00004—Operational features of endoscopes characterised by electronic signal processing
- A61B1/00009—Operational features of endoscopes characterised by electronic signal processing of image signals during a use of endoscope
- A61B1/000094—Operational features of endoscopes characterised by electronic signal processing of image signals during a use of endoscope extracting biological structures
-
- A—HUMAN NECESSITIES
- A61—MEDICAL OR VETERINARY SCIENCE; HYGIENE
- A61B—DIAGNOSIS; SURGERY; IDENTIFICATION
- A61B1/00—Instruments for performing medical examinations of the interior of cavities or tubes of the body by visual or photographical inspection, e.g. endoscopes; Illuminating arrangements therefor
- A61B1/00163—Optical arrangements
- A61B1/00186—Optical arrangements with imaging filters
-
- A—HUMAN NECESSITIES
- A61—MEDICAL OR VETERINARY SCIENCE; HYGIENE
- A61B—DIAGNOSIS; SURGERY; IDENTIFICATION
- A61B1/00—Instruments for performing medical examinations of the interior of cavities or tubes of the body by visual or photographical inspection, e.g. endoscopes; Illuminating arrangements therefor
- A61B1/04—Instruments for performing medical examinations of the interior of cavities or tubes of the body by visual or photographical inspection, e.g. endoscopes; Illuminating arrangements therefor combined with photographic or television appliances
- A61B1/042—Instruments for performing medical examinations of the interior of cavities or tubes of the body by visual or photographical inspection, e.g. endoscopes; Illuminating arrangements therefor combined with photographic or television appliances characterised by a proximal camera, e.g. a CCD camera
-
- A—HUMAN NECESSITIES
- A61—MEDICAL OR VETERINARY SCIENCE; HYGIENE
- A61B—DIAGNOSIS; SURGERY; IDENTIFICATION
- A61B5/00—Measuring for diagnostic purposes; Identification of persons
- A61B5/0059—Measuring for diagnostic purposes; Identification of persons using light, e.g. diagnosis by transillumination, diascopy, fluorescence
- A61B5/0075—Measuring for diagnostic purposes; Identification of persons using light, e.g. diagnosis by transillumination, diascopy, fluorescence by spectroscopy, i.e. measuring spectra, e.g. Raman spectroscopy, infrared absorption spectroscopy
-
- A—HUMAN NECESSITIES
- A61—MEDICAL OR VETERINARY SCIENCE; HYGIENE
- A61B—DIAGNOSIS; SURGERY; IDENTIFICATION
- A61B5/00—Measuring for diagnostic purposes; Identification of persons
- A61B5/0059—Measuring for diagnostic purposes; Identification of persons using light, e.g. diagnosis by transillumination, diascopy, fluorescence
- A61B5/0082—Measuring for diagnostic purposes; Identification of persons using light, e.g. diagnosis by transillumination, diascopy, fluorescence adapted for particular medical purposes
- A61B5/0084—Measuring for diagnostic purposes; Identification of persons using light, e.g. diagnosis by transillumination, diascopy, fluorescence adapted for particular medical purposes for introduction into the body, e.g. by catheters
-
- A—HUMAN NECESSITIES
- A61—MEDICAL OR VETERINARY SCIENCE; HYGIENE
- A61B—DIAGNOSIS; SURGERY; IDENTIFICATION
- A61B5/00—Measuring for diagnostic purposes; Identification of persons
- A61B5/145—Measuring characteristics of blood in vivo, e.g. gas concentration or pH-value ; Measuring characteristics of body fluids or tissues, e.g. interstitial fluid or cerebral tissue
- A61B5/14546—Measuring characteristics of blood in vivo, e.g. gas concentration or pH-value ; Measuring characteristics of body fluids or tissues, e.g. interstitial fluid or cerebral tissue for measuring analytes not otherwise provided for, e.g. ions, cytochromes
-
- A—HUMAN NECESSITIES
- A61—MEDICAL OR VETERINARY SCIENCE; HYGIENE
- A61B—DIAGNOSIS; SURGERY; IDENTIFICATION
- A61B5/00—Measuring for diagnostic purposes; Identification of persons
- A61B5/145—Measuring characteristics of blood in vivo, e.g. gas concentration or pH-value ; Measuring characteristics of body fluids or tissues, e.g. interstitial fluid or cerebral tissue
- A61B5/1455—Measuring characteristics of blood in vivo, e.g. gas concentration or pH-value ; Measuring characteristics of body fluids or tissues, e.g. interstitial fluid or cerebral tissue using optical sensors, e.g. spectral photometrical oximeters
- A61B5/14551—Measuring characteristics of blood in vivo, e.g. gas concentration or pH-value ; Measuring characteristics of body fluids or tissues, e.g. interstitial fluid or cerebral tissue using optical sensors, e.g. spectral photometrical oximeters for measuring blood gases
-
- A—HUMAN NECESSITIES
- A61—MEDICAL OR VETERINARY SCIENCE; HYGIENE
- A61B—DIAGNOSIS; SURGERY; IDENTIFICATION
- A61B5/00—Measuring for diagnostic purposes; Identification of persons
- A61B5/145—Measuring characteristics of blood in vivo, e.g. gas concentration or pH-value ; Measuring characteristics of body fluids or tissues, e.g. interstitial fluid or cerebral tissue
- A61B5/1455—Measuring characteristics of blood in vivo, e.g. gas concentration or pH-value ; Measuring characteristics of body fluids or tissues, e.g. interstitial fluid or cerebral tissue using optical sensors, e.g. spectral photometrical oximeters
- A61B5/1459—Measuring characteristics of blood in vivo, e.g. gas concentration or pH-value ; Measuring characteristics of body fluids or tissues, e.g. interstitial fluid or cerebral tissue using optical sensors, e.g. spectral photometrical oximeters invasive, e.g. introduced into the body by a catheter
-
- G—PHYSICS
- G01—MEASURING; TESTING
- G01N—INVESTIGATING OR ANALYSING MATERIALS BY DETERMINING THEIR CHEMICAL OR PHYSICAL PROPERTIES
- G01N21/00—Investigating or analysing materials by the use of optical means, i.e. using sub-millimetre waves, infrared, visible or ultraviolet light
- G01N21/17—Systems in which incident light is modified in accordance with the properties of the material investigated
- G01N21/25—Colour; Spectral properties, i.e. comparison of effect of material on the light at two or more different wavelengths or wavelength bands
- G01N21/31—Investigating relative effect of material at wavelengths characteristic of specific elements or molecules, e.g. atomic absorption spectrometry
- G01N21/314—Investigating relative effect of material at wavelengths characteristic of specific elements or molecules, e.g. atomic absorption spectrometry with comparison of measurements at specific and non-specific wavelengths
-
- G—PHYSICS
- G02—OPTICS
- G02B—OPTICAL ELEMENTS, SYSTEMS OR APPARATUS
- G02B23/00—Telescopes, e.g. binoculars; Periscopes; Instruments for viewing the inside of hollow bodies; Viewfinders; Optical aiming or sighting devices
- G02B23/24—Instruments or systems for viewing the inside of hollow bodies, e.g. fibrescopes
Definitions
- the present invention relates to a calculation system.
- an endoscope apparatus having a spectral image capturing function
- a spectroscopic endoscope apparatus it is possible to obtain information (for example, a reflection spectrum) regarding spectral characteristics of a living tissue such as a digestive organ mucous membrane.
- the reflection spectrum of this biological tissue reflects information on the type and concentration of substances contained in the vicinity of the surface layer of the biological tissue to be measured.
- the absorption calculated from the reflection spectrum of the living tissue is a linear superposition of the absorption of a plurality of substances constituting the living tissue.
- the biological tissue of the lesioned part differs from the biological tissue of the healthy part in the composition and the amount of components.
- abnormalities in lesions typified by cancer and the like are deeply related to blood conditions, particularly the total blood volume and oxygen saturation.
- qualitative and quantitative analysis of two biological tissues of interest by using the spectroscopic feature quantities in the visible range of them is a technique often used in the field of spectroscopic chemistry. Therefore, it is possible to estimate whether or not a certain lesioned part is included in the living tissue by comparing the spectral characteristic of blood of the living tissue including the lesioned part with that of the living tissue including only the healthy part.
- a spectral image is composed of a plurality of pieces of image information captured with light of different wavelengths, but the more wavelength information (the number of wavelengths from which image information is acquired) included in the spectral image, the more detailed biological tissue information. Can be obtained from the spectral image.
- Patent Document 1 discloses a configuration example of a spectroscopic endoscope apparatus that acquires spectral images at a wavelength interval of 5 nm in a wavelength range of 400 to 800 nm. Yes.
- Patent Document 2 discloses an endoscope system including two light source devices that emit illumination lights having different wavelength bands. These two illumination lights are alternately irradiated onto the subject every frame.
- the oxygen saturation is calculated using an image signal when the subject is illuminated with the first illumination light and an image signal when the subject is illuminated with the second illumination light. Is done.
- the spectroscopic endoscope apparatus disclosed in Patent Document 1 has a problem that it takes a long time to obtain information useful for diagnosis in order to perform image analysis by acquiring a large number of spectral images at a wavelength interval of 5 nm. is there.
- the endoscope system described in Patent Document 2 two light source devices are necessary, and in order to calculate oxygen saturation, it is necessary to perform imaging while switching between the two light source devices for each frame. There is a problem that the frame rate of the captured image is lowered.
- the present invention has been made in view of the above circumstances, and provides a calculation system capable of calculating biological information such as oxygen saturation of hemoglobin contained in living tissue without causing a decrease in the frame rate of the captured image.
- the purpose is to do.
- the calculation system is one light source device that emits illumination light, a wavelength selection unit that selects light in at least two specific wavelength ranges included in the illumination light, and a subject.
- An image sensor that receives light from a living tissue and outputs a pixel signal corresponding to the received light, and a signal processing unit that performs predetermined signal processing on the pixel signal output from the image sensor.
- the signal processing unit calculates an index indicating the concentration of a predetermined biological material contained in the biological tissue based on the pixel signal output from the image sensor in accordance with light in at least two specific wavelength ranges.
- light in at least two wavelength ranges is extracted from the illumination light emitted from the light source device by the wavelength selection means.
- An index indicating the concentration of a predetermined biological material contained in the biological tissue is calculated using the light in the at least two wavelength ranges. Therefore, unlike the prior art, there is no need to switch the illumination light (light source) in order to calculate the index, and it is possible to prevent a decrease in the frame rate caused by the switching of the illumination light when shooting the subject.
- the imaging device has, for example, three color filters for color photographing on the light receiving surface of each pixel, and wavelength regions of two of the three colors. Each includes two specific wavelength ranges.
- the color filter includes, for example, an R filter, a G filter, and a B filter having different wavelength ranges of transmitted light.
- the one specific wavelength range that the G filter transmits includes a wavelength range that is partitioned by two predetermined isosbestic points of hemoglobin
- the other specific wavelength range that the B filter transmits is that of hemoglobin, It includes a wavelength range defined by two isosbestic points in a combination different from the predetermined two isosbestic points.
- the wavelength range of light transmitted by the R filter includes a first wavelength range of 600 nm or more, and the wavelength range of light transmitted by the G filter is 528 nm or more and 584 nm.
- the wavelength range of light that the B filter transmits includes a third wavelength range of 452 nm or more and 502 nm or less.
- the wavelength selection unit selects, for example, light in the first wavelength range, the second wavelength range, and the third wavelength range included in the illumination light.
- the wavelength selection unit is, for example, a single optical filter that selectively transmits or reflects light in at least two specific wavelength ranges.
- the wavelength selection unit includes, for example, at least two bandpass filters respectively corresponding to at least two specific wavelength ranges.
- the calculation system further includes a filter driving unit that selectively inserts at least two band-pass filters into the optical path of the illumination light.
- the wavelength selection unit includes, for example, a first bandpass filter, a second bandpass filter, and a third bandpass filter.
- the first bandpass filter selectively transmits light in the wavelength range of 600 nm or more
- the second bandpass filter selectively transmits light in the second wavelength range of 528 nm or more and 584 nm or less
- the third band pass filter selectively transmits light in a third wavelength range of 452 nm or more and 502 nm or less.
- the wavelength selection unit is disposed, for example, between the light source device and the biological tissue.
- the living tissue is illuminated with the illumination light selected as the light in the specific wavelength range by the wavelength selection unit.
- the wavelength selection unit is disposed between, for example, a living tissue and an imaging device, and selects light having a specific wavelength from reflected light reflected by the living tissue.
- the imaging device receives the reflected light selected as the light in the specific wavelength range by the wavelength selection unit.
- a calculation system capable of calculating biological information of a living tissue without causing a decrease in the frame rate of a captured image is provided.
- (A) is an endoscopic image
- (b) is an oxygen saturation distribution image.
- It is a block diagram which shows the structure of the electronic endoscope system of 2nd Embodiment of this invention. It is a front view of the rotary turret which concerns on 2nd Embodiment of this invention. It is a block diagram which shows the structure of the imaging system of 3rd Embodiment of this invention.
- the calculation system of the present invention can be applied to an electronic endoscope system including an electronic endoscope and an imaging system including an imaging device such as a digital video camera.
- the first embodiment is an example in which the present invention is applied to an electronic endoscope system.
- the electronic endoscope system according to the first embodiment is an image picked up by independent band lights having different wavelength ranges (in the first embodiment, images of three wavelength ranges of R, G, and B constituting one color image). )
- the biological information for example, oxygen saturation and blood volume
- the analysis result is imaged and displayed.
- the spectral characteristics of blood in the visible range that is, the spectral characteristics of hemoglobin
- the changing nature is used.
- Hemoglobin includes oxygenated hemoglobin (HbO 2 ) and reduced hemoglobin (Hb), and the proportion of oxygenated hemoglobin is called oxygen saturation.
- the spectral characteristics of hemoglobin vary with oxygen saturation.
- Fig. 1 shows the transmission spectrum of hemoglobin.
- the horizontal axis in FIG. 1 indicates the wavelength of light, and the vertical axis indicates the light transmittance T.
- the solid line waveform in FIG. 1 is a transmission spectrum when the oxygen saturation is 100% (ie, oxygenated hemoglobin), and the long dashed waveform is when the oxygen saturation is 0% (ie, reduced hemoglobin). It is a transmission spectrum.
- the short dashed line is a transmission spectrum of hemoglobin (a mixture of oxygenated hemoglobin and reduced hemoglobin) at an intermediate oxygen saturation (10, 20, 30,... 90%).
- the transmission spectrum of hemoglobin has isoabsorption points E1 (424 nm), E2 (452 nm), E3 (where the light transmittance T (that is, absorption A) is constant regardless of the oxygen saturation). 502 nm), E4 (528 nm), E5 (546 nm), E6 (570 nm) and E7 (584 nm) appear.
- the wavelength region from the equal absorption points E1 to E2 is the wavelength region W1
- the wavelength region from the equal absorption points E2 to E3 is the wavelength region W2
- the wavelength region from the equal absorption points E3 to E4 is the wavelength region W3.
- the wavelength region from the equal absorption points E4 to E5 is defined as the wavelength region W4
- the wavelength region from the equal absorption points E5 to E6 is defined as the wavelength region W5
- the wavelength region from the equal absorption points E6 to E7 is defined as the wavelength region W6.
- FIG. 2 is a graph plotting the relationship between the oxygen saturation (horizontal axis) in the wavelength region W2 and the amount of light transmitted through hemoglobin (vertical axis).
- the transmitted light amount on the vertical axis is a value obtained by integrating the transmitted light amount in the wavelength region W2. From the graph of FIG. 2, it can be seen that the amount of transmitted light monotonously decreases with respect to the oxygen saturation in the wavelength region W2. In the wavelength range W1 adjacent to the wavelength range W2, the amount of transmitted light monotonously increases with respect to the oxygen saturation.
- the wavelength region W7 When attention is paid to the wavelength region from the isosbestic points E4 to E7 (that is, the continuous wavelength region of the wavelength regions W4 to W6, defined in this specification as the wavelength region W7), as shown in FIG.
- the amount of transmitted light monotonously decreases as the oxygen saturation increases.
- the wavelength region W5 the amount of transmitted light monotonously increases as the oxygen saturation increases.
- the inventor has found that the amount of decrease in the amount of transmitted light accompanying an increase in oxygen saturation in the wavelength region W5 is substantially equal to the sum of the amount of increase in the amount of transmitted light accompanying an increase in oxygen saturation in the wavelength regions W4 and W6. It was found that the amount of transmitted light in the region W7 as a whole is substantially constant regardless of the oxygen saturation. In other words, the absorption A of hemoglobin in the entire wavelength region W7 is substantially constant regardless of the oxygen saturation.
- FIG. 3 is a graph plotting the relationship between the oxygen saturation (horizontal axis) in the wavelength region W7 and the amount of light transmitted through hemoglobin (vertical axis).
- the transmitted light amount on the vertical axis is a value obtained by integrating the transmitted light amount in the wavelength region W7.
- the average value of the amount of transmitted light was 0.267 (arbitrary unit), and the standard deviation was 1.86 ⁇ 10 ⁇ 5 . From the graph of FIG. 3, it is understood that the transmitted light amount is substantially constant regardless of the oxygen saturation in the entire wavelength region W7.
- a wavelength region of 600 nm or more (for example, a wavelength region of 600 to 660 nm or 620 to 660 nm) is a transparent region that is not absorbed by hemoglobin.
- a reference wavelength range of transmitted light amount T (or absorption A).
- a wavelength region from a wavelength of 620 nm to a wavelength of 660 nm is defined as a wavelength region WR.
- the amount of light transmitted through hemoglobin in the wavelength region W2 monotonously decreases with an increase in oxygen saturation
- the amount of light transmitted through hemoglobin in the wavelength region W7 is oxygen. Regardless of the degree of saturation, it can be regarded as a constant value. Therefore, based on the transmitted light amount in the wavelength region W2 and the transmitted light amount in the wavelength region W7, an index indicating the amount of hemoglobin (that is, blood) in the subject (living tissue) and an index indicating the oxygen saturation level of blood are obtained. be able to. Therefore, if the relationship between the blood volume and the index indicating it and the relationship between the oxygen saturation and the index indicating it are obtained in advance experimentally or by calculation, the blood volume and oxygen saturation are calculated from the values of the respective indexes. Can be estimated.
- the greater the absorbance of the living tissue derived from hemoglobin the smaller the light transmittance
- the reflectance of the illumination light by the living tissue becomes small.
- the smaller the absorbance of hemoglobin the greater the light transmittance
- FIG. 4 is a block diagram showing a configuration of the electronic endoscope system 1 according to the first embodiment of the present invention.
- the electronic endoscope system 1 includes an electronic scope 100, a processor 200, and a monitor 300.
- the processor 200 includes a system controller 202, a timing controller 204, an image processing circuit 220, a lamp 208, and an optical filter device 260 which is an example of a wavelength selection unit.
- the system controller 202 executes various programs stored in the memory 212 and controls the entire electronic endoscope system 1 in an integrated manner.
- the system controller 202 is connected to the operation panel 214.
- the system controller 202 changes each operation of the electronic endoscope system 1 and parameters for each operation in accordance with a user instruction input from the operation panel 214.
- the timing controller 204 outputs a clock pulse for adjusting the operation timing of each unit to each circuit in the electronic endoscope system 1.
- the lamp power igniter 206 and the lamp 208 constitute an example of a light source device.
- the lamp 208 emits the illumination light L after being started by the lamp power igniter 206.
- the lamp 208 is, for example, a high-intensity lamp such as a xenon lamp, a halogen lamp, a mercury lamp, or a metal halide lamp, or a white LED (Light Emitting Diode).
- the illumination light L is light (or white light including at least the visible region) having a spectrum that extends mainly from the visible region (or near ultraviolet region) to the invisible infrared region.
- An optical filter device 260 is disposed between the lamp 208 and the condenser lens 210.
- the optical filter device 260 includes a filter driving unit 264 and an optical filter 262 attached to the filter driving unit 264.
- the filter driving unit 264 is configured to be able to slide the optical filter 262 in a direction orthogonal to the optical path between a position on the optical path of the illumination light L (solid line) and a position retracted from the optical path (broken line).
- the configuration of the filter driving unit 264 is not limited to the above-described one.
- optical filter 262 may be inserted into and removed from the optical path of the illumination light L. Details of the optical filter 262 will be described later.
- the electronic endoscope system 1 uses white light emitted from the lamp 208 as it is (or by removing infrared components and / or ultraviolet components) as illumination light (normal light Ln).
- Normal observation mode for performing endoscopic observation and filtered light Lf obtained by passing white light through the optical filter 262 (or further removing the infrared component and / or ultraviolet component) as the illumination light. It is configured to be operable in three operation modes: a special observation mode for performing mirror observation and a baseline measurement mode for acquiring a correction value used in the special observation mode.
- the optical filter 262 is disposed at a position retracted from the optical path in the normal observation mode, and is disposed on the optical path in the special observation mode.
- the illumination light L (filter light Lf or normal light Ln) that has passed through the optical filter device 260 is condensed on the incident end face of an LCB (Light Carrying Bundle) 102 by the condenser lens 210 and introduced into the LCB 102.
- LCB Light Carrying Bundle
- the illumination light L introduced into the LCB 102 propagates through the LCB 102, is emitted from the exit end face of the LCB 102 disposed at the tip of the electronic scope 100, and is irradiated onto the subject via the light distribution lens 104.
- the return light from the subject irradiated with the illumination light L forms an optical image on the light receiving surface of the solid-state image sensor 108 via the objective lens 106.
- the solid-state image sensor 108 is a single-plate color CCD (Charge Coupled Device) image sensor having a Bayer pixel arrangement.
- the solid-state image sensor 108 accumulates an optical image formed by each pixel on the light receiving surface as a charge corresponding to the amount of light, and generates and outputs a pixel signal.
- the solid-state imaging device 108 is a so-called on-chip configuration of an R filter that transmits red light directly formed on each pixel of the solid-state imaging device 108, a G filter that transmits green light, and a B filter that transmits blue light. A color filter is provided.
- the pixel signal generated by the solid-state image sensor 108 is the pixel signal R output from the pixel mounted with the R filter, the pixel signal output from the pixel mounted with the G filter, and the pixel mounted with the B filter.
- the output pixel signal B is included.
- FIG. 5 shows transmission spectra of the R filter, G filter, and B filter of the solid-state image sensor 108.
- the horizontal axis of FIG. 5 indicates the wavelength, and the vertical axis indicates the light transmittance of each filter.
- the R filter is a filter that transmits light in a wavelength region of approximately 600 nm or more including the wavelength region WR.
- the G filter is a filter that transmits light in a wavelength region of approximately 510 to 630 nm including the wavelength region W7.
- the B filter is a filter that transmits light in a wavelength region of approximately 510 nm or less including the wavelength regions W1 and W2.
- the optical filter 262 has an optical characteristic of selectively transmitting only light in the three wavelength regions of the wavelength regions WR, W7, and W2.
- the images of the light in the wavelength regions WR, W7, and W2 that have passed through the optical filter 262 are captured by the pixels to which the R filter, G filter, and B filter of the solid-state image sensor 108 are attached, and as pixel signals R, G, and B, respectively. Each is output.
- the solid-state image sensor 108 is not limited to a CCD image sensor, and may be replaced with a CMOS (Complementary Metal Oxide Semiconductor) image sensor or other types of image pickup devices.
- CMOS Complementary Metal Oxide Semiconductor
- a driver signal processing circuit 110 is provided in the connection portion of the electronic scope 100.
- a pixel signal is input to the driver signal processing circuit 110 from the solid-state imaging device 108 in a field cycle.
- the driver signal processing circuit 110 performs predetermined processing on the pixel signal input from the solid-state image sensor 108 and then outputs the processed signal to the image processing circuit 220 of the processor 200.
- the driver signal processing circuit 110 also accesses the memory 112 and reads the unique information of the electronic scope 100.
- the unique information of the electronic scope 100 recorded in the memory 112 includes, for example, the number and sensitivity of the solid-state image sensor 108, the operable field rate, the model number, and the like.
- the driver signal processing circuit 110 outputs the unique information read from the memory 112 to the system controller 202.
- the system controller 202 performs various calculations based on the unique information of the electronic scope 100 and generates a control signal.
- the system controller 202 controls the operation and timing of various circuits in the processor 200 using the generated control signal so that processing suitable for the electronic scope connected to the processor 200 is performed.
- the timing controller 204 supplies clock pulses to the driver signal processing circuit 110 according to the timing control by the system controller 202.
- the driver signal processing circuit 110 drives and controls the solid-state imaging device 108 at a timing synchronized with the field rate of the video processed on the processor 200 side in accordance with the clock pulse supplied from the timing controller 204.
- the image processing circuit 220 which is an example of a signal processing unit, performs predetermined signal processing such as color interpolation, matrix calculation, and Y / C separation on the pixel signal input from the driver signal processing circuit 110 in one field cycle. Thereafter, screen data for monitor display is generated, and the generated screen data for monitor display is converted into a predetermined video format signal. The converted video format signal is output to the monitor 300. Thereby, the image of the subject is displayed on the display screen of the monitor 300.
- predetermined signal processing such as color interpolation, matrix calculation, and Y / C separation
- the image processing circuit 220 includes an analysis processing circuit 230.
- the analysis processing circuit 230 performs spectroscopic analysis processing (signal processing) based on the acquired pixel signal in the special observation mode, and has an index having a correlation with biological information of biological tissue such as blood volume and oxygen saturation. Is calculated, and image data for visually displaying the calculation result is generated.
- the electronic endoscope system 1 does not use the optical filter 262, and the normal observation mode in which white light (normal light Ln) emitted from the lamp 208 is used as illumination light.
- the special observation mode for performing spectroscopic analysis using the filter light Lf obtained by passing the white light through the optical filter 262 as illumination light, and the baseline measurement mode for obtaining a correction value for special observation It is configured to operate in three modes. Switching between the modes is performed by a user operation on the operation unit of the electronic scope 100 or the operation panel 214 of the processor 200.
- the system controller 202 controls the optical filter device 260 to retract the optical filter 262 from the optical path, and performs imaging by irradiating the subject with the normal light Ln. Then, the image data captured using the solid-state image sensor 108 is subjected to image processing as necessary, and then converted into a video signal and displayed on the monitor 300.
- the system controller 202 controls the optical filter device 260 to place the optical filter 262 on the optical path, and performs imaging by irradiating the subject with the filter light Lf.
- analysis processing to be described later is performed based on image data captured using the solid-state image sensor 108.
- a color reference plate such as an achromatic diffuser or a standard reflector is used as an object for imaging under illumination with the filter light Lf, and special observation described later.
- data used for mode normalization processing is acquired.
- the image data R (x, y), G (x, y), and B (x, y) of the three primary colors captured using the filter light Lf in the baseline measurement mode are the baseline image data BL R (x, y, y), BL G (x, y), and BL B (x, y) are stored in the internal memory of the analysis processing circuit 230.
- R (x, y), G (x, y), B (x, y), BL R (x, y), BL G (x, y), and BL B (x, y) are pixels, respectively. This is the value of the image data (x, y) and the baseline image data.
- the pixel (x, y) is specified by the horizontal coordinate x and the vertical coordinate y of the imaging surface of the solid-state imaging device 108.
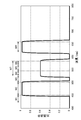
- FIG. 6 is a transmission spectrum of the optical filter 262.
- the optical filter 262 is a single dielectric multilayer filter having optical characteristics that selectively transmits only light in the three wavelength regions of the wavelength regions W2, W7, and WR at least in the visible region.
- the optical filter 262 has a flat transmission characteristic in each of the wavelength ranges W2, W7, and WR, but the transmittance in the wavelength range W7 is adjusted to be lower than that in the other wavelength ranges W2 and WR. This is because the emission spectrum of the lamp 207 used in the present embodiment has a peak in the wavelength band W7, so that each wavelength band after passing through the optical filter 262 is reduced by reducing the transmittance in the wavelength band W7.
- the optical filter 262 is not limited to a transmission type optical filter that transmits the illumination light L.
- the optical filter 262 may be a reflective optical filter that selectively reflects only light in three wavelength regions of the wavelength regions W2, W7, and WR.
- the optical filter 262 may be an absorption type optical filter that absorbs light outside the three wavelength regions of the wavelength regions W2, W7, and WR.
- analysis processing performed by the analysis processing circuit 230 in the special observation mode.
- the biological information of the biological tissue that is the subject is analyzed. Specifically, an index indicating the content of blood (hemoglobin) in a living tissue and an index indicating oxygen saturation (a ratio of hemoglobin to oxyhemoglobin) are calculated.
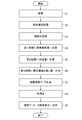
- FIG. 7 is a flowchart illustrating the analysis process.
- the subject is imaged using the solid-state image sensor 108, and the image data R (x, y), G (x, y), and B (x, y) of the three primary colors are analyzed. Is input.
- the following analysis processing is performed using the image data R (x, y), G (x, y), and B (x, y) input by the analysis processing circuit 230.
- the pixel selection process for selecting the pixel (x, y) that is the target of () is performed.
- Image data of a portion of the biological tissue that is the subject that does not contain blood or a portion where the color of the biological tissue is dominantly influenced by a substance other than hemoglobin is based on color information obtained from the image data. Even if the blood volume or oxygen saturation is calculated, a meaningful value cannot be obtained, so that it is merely noise. If such noise is calculated and provided to the doctor, it not only hinders an appropriate diagnosis, but also causes an adverse effect of reducing the processing speed by applying an unnecessary load to the analysis processing circuit 230. Therefore, in this embodiment, a pixel suitable for analysis processing (that is, a pixel in which the spectroscopic characteristics of blood are recorded) is selected, and the analysis processing is performed only on the selected pixel. Yes.
- the above three conditional expressions are set based on the magnitude relationship of the values of “G component ⁇ B component ⁇ R component” in the blood transmission spectrum. It should be noted that pixel selection processing S2 using only one or two of the above three conditional expressions (for example, using only Expression 3 and / or Expression 4 focusing on the red color peculiar to blood). May be performed.
- processing step S3 normalization processing is performed on the image data of the pixels selected in the pixel selection processing S2.
- the normalization process S3 of the present embodiment corrects the optical characteristics of the electronic endoscope system 1 itself (for example, the transmittance of the optical filter 262 and the light receiving sensitivity of the solid-state imaging device 108), and enables quantitative analysis. It is a process to do.
- the analysis processing circuit 230 calculates the following from the image data R (x, y) and the baseline image data BL R (x, y) acquired using the filter light Lf that has passed through the optical filter 262.
- Gs (x, y) and Bs (x, y) are calculated by the following formulas 6 and 7.
- Gs (x, y) G (x, y) / BL G (x, y)
- Bs (x, y) B (x, y) / BL B (x, y)
- standardized image data Rs (x, y), Gs (x, y), and Bs (x, y) are used, but the standardized image data Rs ( Index calculation using image data R (x, y), G (x, y), B (x, y) instead of x, y), Gs (x, y), Bs (x, y) May be performed.
- Image data Gs (x, y) represents an optical image formed by light in the wavelength region W7 that has passed through the optical filter 262.
- the image data Bs (x, y) represents an optical image formed by light in the wavelength region W2 that has passed through the optical filter 262.
- the emissivity of light in the anti-wavelength region W2 by the living tissue that is, the value of the image data Bs (x, y)
- the reflectance of light in the wavelength region W7 by the living tissue that is, the value of the image data Gs (x, y)
- the first index X is an index with good oxygen saturation.
- the normalized reflectance Gs (x, y) is a value that does not depend on the oxygen saturation but depends on the blood volume.
- the normalized reflectance Rs (that is, the value of the image data Rs (x, y)) is the reflectance by the living tissue of the light in the wavelength region WR that is hardly absorbed by blood, and therefore, the oxygen saturation is reduced. It does not depend on blood volume. Therefore, by dividing the normalized reflectance Gs by the normalized reflectance Rs, the contribution of the surface state of the living tissue and the contribution of the incident angle of the illumination light (filter light Lf) to the living tissue are offset. An index having only blood volume contribution can be obtained. Therefore, the second index Y is a good index for blood volume.
- a third index Z representing the logical operation result of oxygen saturation and blood volume is calculated.
- the analysis processing circuit 230 has a second index indicating the blood volume calculated by Expression 9 and the first index X indicating the oxygen saturation calculated by Expression 8 is smaller than a predetermined reference value (first reference value).
- first reference value a predetermined reference value
- second reference value a predetermined reference value
- the first index X, the second index Y, and the third index Z are each a binary index
- the third index Z is calculated as a logical product or logical sum of the first index X and the second index Y.
- X 1 (the oxygen saturation is lower than the normal value) when the value on the right side of Formula 8 is less than the first reference value
- X 0 (the oxygen saturation is greater than the first reference value).
- Y 1 (the blood volume is greater than the normal value) when the value on the right side of Equation 9 is greater than or equal to the second reference value
- Y 0 (the blood volume is less than the second reference value).
- the third index Z is a binary index, but the third index Z may be a multi-value (or continuous value such as a real number) indicating the degree of suspicion of malignant tumor.
- the third index Z (x, y) indicating the degree of suspicion of malignant tumor may be calculated.
- the third index Z (x, y) can be calculated, for example, as the sum (or weighted average) or product of the deviation of the first index X (x, y) and the deviation of the second reference value.
- a pixel value (luminance) that is designated in advance by the user among the first index X (x, y), the second index Y (x, y), or the third index Z (x, y) is used.
- Index image data to be generated is generated.
- processing step S8 color correction processing is performed on the image data R (x, y), G (x, y), and B (x, y). Since the filter light Lf that has passed through the optical filter 262 includes spectral components of the three primary colors of R (wavelength band WR), G (wavelength band W7), and B (wavelength band W2), the filter light Lf is used in the color. An endoscopic image can be taken. However, since the spectrum of the filter light Lf has a limited band, an image captured using the filter light Lf may be unnatural in color compared to an image captured using the normal light Ln. is there.
- this processing step S8 when the normal light Ln is used for the image data R (x, y), G (x, y), and B (x, y) imaged using the filter light Lf Color correction processing is performed to bring the hue close to the obtained image. Thereby, it is possible to obtain an image (pseudo normal observation image) picked up using the normal light Ln in a pseudo manner.
- the color correction processing S8 adds or multiplies correction values C R , C G , and C B acquired in advance to, for example, image data R (x, y), G (x, y), and B (x, y). Is done by doing.
- a color matrix Mf may be prepared and color correction may be performed by color matrix calculation.
- the correction values C R , C G , C B and the color matrix Mf are set in advance based on image data obtained by imaging the color reference plate illuminated with the filter light Lf by the electronic endoscope system 1, for example, and analyzed. It is stored in the internal memory of the circuit 230. It is also possible to set so that the color correction process S8 is not performed.
- screen data to be displayed on the monitor 300 is generated based on the image data subjected to the color correction process S8, the index image data generated in process S7, and the like.
- the screen data generation processing S9 for example, an endoscope image (pseudo normal observation image) and one or more types of index images are displayed side by side on a single screen, or an endoscope that displays only an endoscope image.
- Various screen data such as an image display and an index image display that displays only one or more types of index images specified by the user can be generated.
- the type of screen data to be generated is selected by a user operation on the operation unit of the electronic scope 100 or the operation panel 214 of the processor 200.
- FIG. 8 is an example of a screen displayed on the monitor 300.
- FIG. 8A is an endoscopic image
- FIG. 6B is an index image of the first index X (x, y) indicating oxygen saturation.
- the image in FIG. 8 is an observation of the right hand in a state where the vicinity of the proximal interphalangeal joint of the middle finger is pressed with a rubber band.
- FIG. 8B shows that the oxygen saturation is lowered due to the blood flow being blocked by the compression on the distal side of the compression part of the right middle finger. Further, it can be seen that arterial blood stays in the immediate vicinity of the compressed portion, and the oxygen saturation is locally high.
- the electronic scope 100 is operated to quickly switch from the special observation mode to the normal observation mode, and the normal observation image with higher color reproducibility is displayed on the full screen. Can be diagnosed.
- the electronic endoscope system 1 according to the present embodiment can be operated in the normal observation mode and the special observation mode only by changing the image processing method by automatically inserting and removing the optical filter 262 on the optical path by operating the electronic scope 100. Is configured to be able to easily and quickly be switched.
- an optical filter 262 that separates the three wavelength ranges W2, W7, and WR is employed, and further, the three wavelength ranges W2, W7, and WR are included in the solid-state image sensor 108.
- a configuration that transmits each of the B filter, the G filter, and the R filter is employed. With these configurations, it is possible to generate an endoscopic image and an index image of one frame by imaging one frame (two fields). Therefore, unlike the endoscope system disclosed in Patent Document 2, a plurality of frames of image data are not used for calculation of oxygen saturation, which causes a problem that the frame rate of a captured image decreases in the special observation mode. An endoscopic image and an index image can be displayed at the same time.
- the optical filter 262 has a characteristic of transmitting light in the three wavelength ranges W2, W7, and WR. Therefore, in the special observation mode, there is no need to sequentially insert a plurality of optical filters having different transmission characteristics in the optical path of the illumination light. For example, an optical filter that transmits only light in the wavelength band W2, an optical filter that transmits only light in the wavelength band W7, and an optical filter that transmits only light in the wavelength band WR are alternatively selected from the three optical filters.
- a moving mechanism for moving the optical filter in synchronization with the frame rate is required.
- the processor 200 becomes relatively large and complicated, and the moving mechanism itself includes a movable part, so that the durability becomes relatively low. Furthermore, when a plurality of optical filters are sequentially inserted into the optical path of the illumination light, the amount of illumination light applied to the subject fluctuates each time the optical filter crosses the optical path, and image data with stable brightness cannot be obtained. There is. However, according to the present embodiment, it is not necessary to drive the optical filter 262 during the imaging process in the special observation mode, so that the processor 200 (light source device) is increased in size and durability, and the amount of illumination light is reduced. Variations can be suppressed.
- the transmission spectrum of the optical filter 262 in the present embodiment is not limited to that shown in FIG.
- the amount of light (specifically, maximum light transmittance) in the wavelength ranges W2, W7, and WR transmitted through the optical filter 262 is the transmission spectrum of the on-chip color filter (R filter, G filter, and B filter) of the solid-state image sensor 108. It can be changed according to. For example, the light transmittance of the G filter of the solid-state image sensor 108 can be lowered, while the light transmittance of the optical filter 262 in the wavelength region W7 can be increased.
- the oxygen saturation is calculated using the image data of two frames as in the endoscope system disclosed in Patent Document 2, when the subject moves with respect to the solid-state image sensor, the two frames are used.
- the position of the subject image in the captured image may change.
- the oxygen saturation cannot be correctly calculated using the images of two frames, or the edge of the subject image is emphasized.
- biological information such as oxygen saturation is calculated using the captured image of one frame. Therefore, even if the subject moves during the imaging process, the index indicating the biological information can be correctly calculated without enhancing the edge.
- Embodiments of the present invention are not limited to those described above, and various modifications are possible within the scope of the technical idea of the present invention.
- the embodiment of the present application also includes an embodiment that is exemplarily specified in the specification or a combination of obvious embodiments and the like as appropriate.
- the first embodiment is an example in which the wavelength region W2 is used as the blue wavelength region used in the special observation mode, but the wavelength region W1 can be used instead of the wavelength region W2.
- the wavelength region W1 has a larger difference in light transmittance T (that is, absorption) between oxygenated hemoglobin and reduced hemoglobin than the wavelength region W2. Therefore, by using the wavelength region W1, it is possible to detect a change in oxygen saturation with higher sensitivity.
- the above embodiment is an example in which the spectroscopic analysis result is displayed by a gray scale or monochrome index image, but the display method of the analysis result is not limited to this.
- the image data R (x, y), G (x, y), and B (x, y) may be changed according to the index value. For example, for a pixel whose index value exceeds the reference value, a process for increasing the brightness, a process for changing the hue (for example, a process for increasing the red component by increasing the R component, or rotating the hue by a predetermined angle) And a process of blinking the pixels (or changing the hue periodically).
- FIG. 9 is a block diagram illustrating a configuration of the electronic endoscope system 2 according to the second embodiment. As shown in FIG. 9, the electronic endoscope system 2 of the second embodiment includes an optical filter device 270.
- the optical filter device 270 includes a rotary turret 273, a motor 274 connected to the rotary turret 273, and a motor drive circuit 275 that drives and controls the motor 274.
- the motor 274 and the motor drive circuit 275 constitute an example of a filter drive unit.
- An optical filter 272 is attached to the rotary turret 270.
- the same reference numerals are used for components equivalent to those in the first embodiment.
- FIG. 10 is a front view of the rotary turret 273.
- the optical filter 272 includes a bandpass filter 272B that transmits only light in the wavelength band W2, a bandpass filter 272G that transmits only light in the wavelength band W7, and a bandpass filter 272R that transmits only light in the wavelength band WR.
- Bandpass filters 272B, 272G, and 272R are examples of first, second, and third bandpass filters, respectively.
- the band pass filters 272 ⁇ / b> B, 272 ⁇ / b> G, 272 ⁇ / b> R are arranged side by side in the circumferential direction of the rotary turret 273.
- Each band-pass filter 272B, 272G, 272R has a fan shape and is arranged at an angular pitch corresponding to the frame period (here, an angular pitch of about 120 °). In this embodiment, one rotation of the optical filter 272 corresponds to one frame.
- the motor drive circuit 275 drives the motor 274 under the control of the system controller 202.
- the three band pass filters 272B, 272G, and 272R are sequentially inserted into the optical path of the illumination light.
- three types of illumination light L having different spectra are extracted from the illumination light L emitted from the lamp 208 at a timing synchronized with imaging.
- the rotary turret 273 emits illumination light in the wavelength region W2 by the bandpass filter 272B, illumination light in the wavelength region W7 by the optical filter 272G, and illumination in the wavelength region WR by the bandpass filter 272R. Take out light alternatively.
- the extracted illumination light is sequentially applied to the subject.
- the rotational position and rotational phase of the rotary turret 273 are controlled by detecting an opening (not shown) formed near the outer periphery of the rotary turret 273 with a photo interrupter 276.
- the solid-state image sensor 108 ′ outputs, as a pixel signal B, a charge corresponding to the amount of light received while the subject is irradiated with illumination light in the wavelength region W2.
- the solid-state imaging device 108 ′ outputs, as a pixel signal G, a charge corresponding to the amount of light received while the object is irradiated with illumination light in the wavelength region W7.
- the solid-state imaging device 108 ′ outputs a charge corresponding to the amount of light received while the subject is irradiated with illumination light in the wavelength region WR as a pixel signal R.
- the pixel signals R, G, and B are used for both displaying a normal endoscopic image and displaying an index image representing an index of biological information. Therefore, in the electronic endoscope system 2 of the second embodiment, it is not necessary to newly use another optical filter or light source device in order to display the index image. Therefore, the endoscopic image and the index image can be displayed simultaneously without reducing the frame rate of the captured image. Further, in the electronic endoscope system 2 of the second embodiment, the solid-state imaging device 108 ′ for monochrome image capturing that does not have the on-chip color filter is used for subject imaging processing. A high-definition photographed image can be obtained as compared with the case of using the solid-state imaging device.
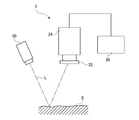
- FIG. 11 is a block diagram illustrating a configuration of the imaging system 3 according to the third embodiment.
- the imaging system 3 includes a light source device 30, an optical filter 32, a digital video camera (imaging device) 34, and a monitor 36.
- the light source device 30 emits illumination light L that illuminates the subject S.
- the illumination light L is light having a spectrum (or white light including at least the visible range) that mainly extends from the visible range to the invisible infrared range.
- the illumination light L (reflected light) reflected from the subject S enters the optical filter 32.
- the optical characteristics of the optical filter 32 are the same as the optical characteristics of the optical filter 262 of the first embodiment. That is, the optical filter 32 selectively transmits only light in the three wavelength regions of the wavelength regions W2, W7, and WR. The reflected light that has passed through the optical filter 32 enters the imaging device 34.
- the imaging device 34 includes a solid-state imaging device, a signal processing circuit that performs signal processing on a pixel signal output from the solid-state imaging device, and the like.
- the solid-state imaging device includes a so-called on-chip color filter such as an R filter, a G filter, and a B filter on each pixel.
- the solid-state image sensor outputs pixel signals R, G, and B according to the amount of received reflected light.
- the imaging device 34 generates a normal endoscopic image and an index image representing an index of biological information based on the pixel signals R, G, and B, similarly to the image processing circuit 220 of the first embodiment.
- the endoscopic image and the index image generated by the imaging device 34 are displayed on the monitor 36.
- the optical filter 32 is not in front of the emission direction of the illumination light L of the light source device 30 (between the light source device 30 and the subject S), but in front of the solid-state imaging device (with the solid-state imaging device). Between the subject S). Thus, both the endoscopic image and the index image can be displayed without changing the spectral characteristics of the illumination light L that illuminates the subject.
- the imaging device 34 can be arranged away from the subject S, analysis processing by the imaging system 3 and direct observation of the subject S by the surgeon can be performed simultaneously.
- the spectral characteristics of the illumination light L are not changed during the analysis process, the color of the subject S changes due to the illumination light L when viewed from an operator who directly observes the subject S. Can be prevented.
- the third embodiment it is possible to generate an endoscopic image and an index image by imaging one frame (two fields) as in the first embodiment. Therefore, since it is not necessary to switch the light source device for each frame as in Patent Document 2, it is possible to simultaneously display the endoscopic image and the index image without causing a decrease in the frame rate.
- the optical filters 262 and 272 are disposed in front of the light source device (lamp 208).
- the optical filter 32 is disposed in front of the solid-state imaging device.
- the optical filter can be disposed at any position on the optical path of the illumination light from the light source device to the solid-state imaging device.
- the optical filter 262 may be disposed in front of the light distribution lens 104, in front of the objective lens 106, or between the objective lens 106 and the solid-state image sensor 108.
- the optical filter 32 may be disposed in front of the light source device 30.
- the optical filter may be a wavelength selectable reflecting member, for example, a dichroic mirror.
- the dichroic mirror has a property of reflecting illumination light as the filter light Lf and transmitting light other than the filter light Lf.
Landscapes
- Health & Medical Sciences (AREA)
- Life Sciences & Earth Sciences (AREA)
- Physics & Mathematics (AREA)
- Surgery (AREA)
- General Health & Medical Sciences (AREA)
- Engineering & Computer Science (AREA)
- Pathology (AREA)
- Medical Informatics (AREA)
- Biomedical Technology (AREA)
- Heart & Thoracic Surgery (AREA)
- Veterinary Medicine (AREA)
- Molecular Biology (AREA)
- Animal Behavior & Ethology (AREA)
- Biophysics (AREA)
- Public Health (AREA)
- Optics & Photonics (AREA)
- Spectroscopy & Molecular Physics (AREA)
- Radiology & Medical Imaging (AREA)
- Nuclear Medicine, Radiotherapy & Molecular Imaging (AREA)
- General Physics & Mathematics (AREA)
- Astronomy & Astrophysics (AREA)
- Chemical & Material Sciences (AREA)
- Analytical Chemistry (AREA)
- Biochemistry (AREA)
- Immunology (AREA)
- Signal Processing (AREA)
- Endoscopes (AREA)
- Measurement Of The Respiration, Hearing Ability, Form, And Blood Characteristics Of Living Organisms (AREA)
- Instruments For Viewing The Inside Of Hollow Bodies (AREA)
Abstract
La présente invention concerne un système de calcul comportant : un dispositif de source de lumière unique servant à émettre une lumière d'éclairage ; un sélecteur de longueur d'onde servant à sélectionner la lumière d'au moins deux bandes de longueur d'onde spécifique comprises dans la lumière d'éclairage ; un élément d'imagerie qui reçoit une lumière provenant d'un tissu biologique, c'est-à-dire l'objet d'imagerie, et émet un signal de pixel correspondant à la lumière reçue ; et une unité de traitement de signal servant à effectuer un traitement de signal prescrit sur le signal de pixel émis par l'élément d'imagerie. Dans cette configuration, l'unité de traitement de signal calcule un indicateur de la concentration d'une substance biologique prescrite dans le tissu biologique, le calcul étant réalisé sur la base du signal de pixel émis, en réponse à la lumière d'au moins deux bandes de longueur d'onde spécifique, par l'élément d'imagerie.
Priority Applications (3)
| Application Number | Priority Date | Filing Date | Title |
|---|---|---|---|
| CN201780013504.9A CN108697307A (zh) | 2016-02-26 | 2017-01-10 | 计算系统 |
| US16/079,527 US20190069768A1 (en) | 2016-02-26 | 2017-01-10 | Calculation system |
| DE112017001021.7T DE112017001021T5 (de) | 2016-02-26 | 2017-01-10 | Berechnungssystem |
Applications Claiming Priority (2)
| Application Number | Priority Date | Filing Date | Title |
|---|---|---|---|
| JP2016-035684 | 2016-02-26 | ||
| JP2016035684A JP2017148392A (ja) | 2016-02-26 | 2016-02-26 | 計算システム |
Publications (1)
| Publication Number | Publication Date |
|---|---|
| WO2017145529A1 true WO2017145529A1 (fr) | 2017-08-31 |
Family
ID=59685048
Family Applications (1)
| Application Number | Title | Priority Date | Filing Date |
|---|---|---|---|
| PCT/JP2017/000397 Ceased WO2017145529A1 (fr) | 2016-02-26 | 2017-01-10 | Système de calcul |
Country Status (5)
| Country | Link |
|---|---|
| US (1) | US20190069768A1 (fr) |
| JP (1) | JP2017148392A (fr) |
| CN (1) | CN108697307A (fr) |
| DE (1) | DE112017001021T5 (fr) |
| WO (1) | WO2017145529A1 (fr) |
Cited By (1)
| Publication number | Priority date | Publication date | Assignee | Title |
|---|---|---|---|---|
| WO2019198293A1 (fr) * | 2018-04-11 | 2019-10-17 | ソニー株式会社 | Système de microscope et dispositif source de lumière médicale |
Families Citing this family (34)
| Publication number | Priority date | Publication date | Assignee | Title |
|---|---|---|---|---|
| JP6774550B2 (ja) * | 2017-03-03 | 2020-10-28 | 富士フイルム株式会社 | 内視鏡システム、プロセッサ装置、及び、内視鏡システムの作動方法 |
| DE112019004271T5 (de) * | 2018-08-31 | 2021-05-27 | Hoya Corporation | Endoskopsystem und Verfahren zum Bedienen des Endoskopsystems |
| CN112889350A (zh) * | 2018-09-18 | 2021-06-01 | Ai智者有限公司 | 用于人的解剖学部位以及这样的部位处的物品的识别和照亮的系统和处理 |
| US11587491B1 (en) | 2018-10-25 | 2023-02-21 | Baylor University | System and method for a multi-primary wide gamut color system |
| US11373575B2 (en) | 2018-10-25 | 2022-06-28 | Baylor University | System and method for a multi-primary wide gamut color system |
| US12475826B2 (en) | 2018-10-25 | 2025-11-18 | Baylor University | System and method for a multi-primary wide gamut color system |
| US11403987B2 (en) | 2018-10-25 | 2022-08-02 | Baylor University | System and method for a multi-primary wide gamut color system |
| US11289003B2 (en) | 2018-10-25 | 2022-03-29 | Baylor University | System and method for a multi-primary wide gamut color system |
| US10997896B2 (en) | 2018-10-25 | 2021-05-04 | Baylor University | System and method for a six-primary wide gamut color system |
| US10950162B2 (en) | 2018-10-25 | 2021-03-16 | Baylor University | System and method for a six-primary wide gamut color system |
| US11189210B2 (en) | 2018-10-25 | 2021-11-30 | Baylor University | System and method for a multi-primary wide gamut color system |
| US11410593B2 (en) | 2018-10-25 | 2022-08-09 | Baylor University | System and method for a multi-primary wide gamut color system |
| US11315467B1 (en) | 2018-10-25 | 2022-04-26 | Baylor University | System and method for a multi-primary wide gamut color system |
| US10607527B1 (en) | 2018-10-25 | 2020-03-31 | Baylor University | System and method for a six-primary wide gamut color system |
| US11532261B1 (en) | 2018-10-25 | 2022-12-20 | Baylor University | System and method for a multi-primary wide gamut color system |
| US12555507B2 (en) | 2018-10-25 | 2026-02-17 | Baylor University | System and method for a multi-primary wide gamut color system |
| US11030934B2 (en) | 2018-10-25 | 2021-06-08 | Baylor University | System and method for a multi-primary wide gamut color system |
| US11037481B1 (en) | 2018-10-25 | 2021-06-15 | Baylor University | System and method for a multi-primary wide gamut color system |
| US11341890B2 (en) | 2018-10-25 | 2022-05-24 | Baylor University | System and method for a multi-primary wide gamut color system |
| US10950161B2 (en) | 2018-10-25 | 2021-03-16 | Baylor University | System and method for a six-primary wide gamut color system |
| US11289000B2 (en) | 2018-10-25 | 2022-03-29 | Baylor University | System and method for a multi-primary wide gamut color system |
| US11069279B2 (en) | 2018-10-25 | 2021-07-20 | Baylor University | System and method for a multi-primary wide gamut color system |
| US11475819B2 (en) | 2018-10-25 | 2022-10-18 | Baylor University | System and method for a multi-primary wide gamut color system |
| US12444337B2 (en) | 2018-10-25 | 2025-10-14 | Baylor University | System and method for a multi-primary wide gamut color system |
| US11069280B2 (en) | 2018-10-25 | 2021-07-20 | Baylor University | System and method for a multi-primary wide gamut color system |
| US11062638B2 (en) | 2018-10-25 | 2021-07-13 | Baylor University | System and method for a multi-primary wide gamut color system |
| US11043157B2 (en) | 2018-10-25 | 2021-06-22 | Baylor University | System and method for a six-primary wide gamut color system |
| US12444334B2 (en) | 2018-10-25 | 2025-10-14 | Baylor University | System and method for a multi-primary wide gamut color system |
| US11488510B2 (en) | 2018-10-25 | 2022-11-01 | Baylor University | System and method for a multi-primary wide gamut color system |
| JP7301595B2 (ja) * | 2019-05-09 | 2023-07-03 | 富士フイルム株式会社 | 内視鏡システム、プロセッサ装置、及び内視鏡システムの作動方法 |
| WO2020235503A1 (fr) * | 2019-05-21 | 2020-11-26 | 富士フイルム株式会社 | Système endoscopique, procédé de fonctionnement d'un système endoscopique, dispositif de traitement d'images et programme pour dispositif de traitement d'images |
| CN114206249B (zh) | 2019-08-05 | 2024-08-13 | 捷锐士阿希迈公司(以奥林巴斯美国外科技术名义) | 具有照明控制的激光系统 |
| CN117136549B (zh) * | 2021-05-07 | 2026-01-23 | Oppo广东移动通信有限公司 | 相机系统、用于皮肤特性分析的方法和计算机可读介质 |
| US12462772B1 (en) | 2024-06-20 | 2025-11-04 | 6P Color, Inc. | System and method for conversion from XYZ to multiple primaries using pseudo white points |
Citations (3)
| Publication number | Priority date | Publication date | Assignee | Title |
|---|---|---|---|---|
| JP2003527916A (ja) * | 2000-03-28 | 2003-09-24 | ボード・オブ・リージェンツ,ザ・ユニヴァーシティ・オヴ・テキサス・システム | 診断用マルチスペクトルデジタル画像化のための方法および装置 |
| WO2012124227A1 (fr) * | 2011-03-15 | 2012-09-20 | オリンパスメディカルシステムズ株式会社 | Dispositif médical |
| JP2016022043A (ja) * | 2014-07-17 | 2016-02-08 | Hoya株式会社 | 生体組織中の生体物質の濃度分布を示す画像を生成する方法 |
Family Cites Families (3)
| Publication number | Priority date | Publication date | Assignee | Title |
|---|---|---|---|---|
| DE4330460C2 (de) * | 1993-09-08 | 1996-05-23 | Siemens Ag | Vorrichtung zur Untersuchung von Gewebe mit Licht unterschiedlicher Wellenlängen |
| JP2012245223A (ja) | 2011-05-30 | 2012-12-13 | Hoya Corp | 電子内視鏡装置及び分光画像最適化方法 |
| JP2013099464A (ja) | 2011-11-09 | 2013-05-23 | Fujifilm Corp | 内視鏡システム、内視鏡システムのプロセッサ装置、及び画像表示方法 |
-
2016
- 2016-02-26 JP JP2016035684A patent/JP2017148392A/ja active Pending
-
2017
- 2017-01-10 US US16/079,527 patent/US20190069768A1/en not_active Abandoned
- 2017-01-10 WO PCT/JP2017/000397 patent/WO2017145529A1/fr not_active Ceased
- 2017-01-10 CN CN201780013504.9A patent/CN108697307A/zh active Pending
- 2017-01-10 DE DE112017001021.7T patent/DE112017001021T5/de not_active Withdrawn
Patent Citations (3)
| Publication number | Priority date | Publication date | Assignee | Title |
|---|---|---|---|---|
| JP2003527916A (ja) * | 2000-03-28 | 2003-09-24 | ボード・オブ・リージェンツ,ザ・ユニヴァーシティ・オヴ・テキサス・システム | 診断用マルチスペクトルデジタル画像化のための方法および装置 |
| WO2012124227A1 (fr) * | 2011-03-15 | 2012-09-20 | オリンパスメディカルシステムズ株式会社 | Dispositif médical |
| JP2016022043A (ja) * | 2014-07-17 | 2016-02-08 | Hoya株式会社 | 生体組織中の生体物質の濃度分布を示す画像を生成する方法 |
Cited By (1)
| Publication number | Priority date | Publication date | Assignee | Title |
|---|---|---|---|---|
| WO2019198293A1 (fr) * | 2018-04-11 | 2019-10-17 | ソニー株式会社 | Système de microscope et dispositif source de lumière médicale |
Also Published As
| Publication number | Publication date |
|---|---|
| US20190069768A1 (en) | 2019-03-07 |
| CN108697307A (zh) | 2018-10-23 |
| JP2017148392A (ja) | 2017-08-31 |
| DE112017001021T5 (de) | 2018-11-29 |
Similar Documents
| Publication | Publication Date | Title |
|---|---|---|
| WO2017145529A1 (fr) | Système de calcul | |
| JP6204314B2 (ja) | 電子内視鏡システム | |
| CN103781395B (zh) | 内窥镜系统、用于所述内窥镜系统的处理设备和图像生成方法 | |
| JP6467562B2 (ja) | 内視鏡システム | |
| CN109310305B (zh) | 内窥镜系统及特征量计算方法 | |
| CN110087528A (zh) | 内窥镜系统以及图像显示装置 | |
| CN107427186B (zh) | 内窥镜装置 | |
| US10791973B2 (en) | Analysis device and method of analysis | |
| JP6783168B2 (ja) | 内視鏡システム及び分析装置 | |
| JP6284451B2 (ja) | 内視鏡装置 | |
| JP6615369B2 (ja) | 内視鏡システム | |
| JP7214886B2 (ja) | 画像処理装置及びその作動方法 | |
| WO2018070474A1 (fr) | Système endoscope |
Legal Events
| Date | Code | Title | Description |
|---|---|---|---|
| 121 | Ep: the epo has been informed by wipo that ep was designated in this application |
Ref document number: 17755971 Country of ref document: EP Kind code of ref document: A1 |
|
| 122 | Ep: pct application non-entry in european phase |
Ref document number: 17755971 Country of ref document: EP Kind code of ref document: A1 |