WO2017201400A1 - Determination of cell types in mixtures using targeted bisulfite sequencing - Google Patents
Determination of cell types in mixtures using targeted bisulfite sequencing Download PDFInfo
- Publication number
- WO2017201400A1 WO2017201400A1 PCT/US2017/033531 US2017033531W WO2017201400A1 WO 2017201400 A1 WO2017201400 A1 WO 2017201400A1 US 2017033531 W US2017033531 W US 2017033531W WO 2017201400 A1 WO2017201400 A1 WO 2017201400A1
- Authority
- WO
- WIPO (PCT)
- Prior art keywords
- cell types
- cell
- cells
- different
- genetic loci
- Prior art date
- Legal status (The legal status is an assumption and is not a legal conclusion. Google has not performed a legal analysis and makes no representation as to the accuracy of the status listed.)
- Ceased
Links
Classifications
-
- G—PHYSICS
- G16—INFORMATION AND COMMUNICATION TECHNOLOGY [ICT] SPECIALLY ADAPTED FOR SPECIFIC APPLICATION FIELDS
- G16B—BIOINFORMATICS, i.e. INFORMATION AND COMMUNICATION TECHNOLOGY [ICT] SPECIALLY ADAPTED FOR GENETIC OR PROTEIN-RELATED DATA PROCESSING IN COMPUTATIONAL MOLECULAR BIOLOGY
- G16B20/00—ICT specially adapted for functional genomics or proteomics, e.g. genotype-phenotype associations
-
- G—PHYSICS
- G16—INFORMATION AND COMMUNICATION TECHNOLOGY [ICT] SPECIALLY ADAPTED FOR SPECIFIC APPLICATION FIELDS
- G16H—HEALTHCARE INFORMATICS, i.e. INFORMATION AND COMMUNICATION TECHNOLOGY [ICT] SPECIALLY ADAPTED FOR THE HANDLING OR PROCESSING OF MEDICAL OR HEALTHCARE DATA
- G16H70/00—ICT specially adapted for the handling or processing of medical references
- G16H70/60—ICT specially adapted for the handling or processing of medical references relating to pathologies
-
- C—CHEMISTRY; METALLURGY
- C12—BIOCHEMISTRY; BEER; SPIRITS; WINE; VINEGAR; MICROBIOLOGY; ENZYMOLOGY; MUTATION OR GENETIC ENGINEERING
- C12Q—MEASURING OR TESTING PROCESSES INVOLVING ENZYMES, NUCLEIC ACIDS OR MICROORGANISMS; COMPOSITIONS OR TEST PAPERS THEREFOR; PROCESSES OF PREPARING SUCH COMPOSITIONS; CONDITION-RESPONSIVE CONTROL IN MICROBIOLOGICAL OR ENZYMOLOGICAL PROCESSES
- C12Q1/00—Measuring or testing processes involving enzymes, nucleic acids or microorganisms; Compositions therefor; Processes of preparing such compositions
- C12Q1/68—Measuring or testing processes involving enzymes, nucleic acids or microorganisms; Compositions therefor; Processes of preparing such compositions involving nucleic acids
- C12Q1/6806—Preparing nucleic acids for analysis, e.g. for polymerase chain reaction [PCR] assay
-
- C—CHEMISTRY; METALLURGY
- C12—BIOCHEMISTRY; BEER; SPIRITS; WINE; VINEGAR; MICROBIOLOGY; ENZYMOLOGY; MUTATION OR GENETIC ENGINEERING
- C12Q—MEASURING OR TESTING PROCESSES INVOLVING ENZYMES, NUCLEIC ACIDS OR MICROORGANISMS; COMPOSITIONS OR TEST PAPERS THEREFOR; PROCESSES OF PREPARING SUCH COMPOSITIONS; CONDITION-RESPONSIVE CONTROL IN MICROBIOLOGICAL OR ENZYMOLOGICAL PROCESSES
- C12Q1/00—Measuring or testing processes involving enzymes, nucleic acids or microorganisms; Compositions therefor; Processes of preparing such compositions
- C12Q1/68—Measuring or testing processes involving enzymes, nucleic acids or microorganisms; Compositions therefor; Processes of preparing such compositions involving nucleic acids
- C12Q1/6876—Nucleic acid products used in the analysis of nucleic acids, e.g. primers or probes
- C12Q1/6881—Nucleic acid products used in the analysis of nucleic acids, e.g. primers or probes for tissue or cell typing, e.g. human leukocyte antigen [HLA] probes
-
- C—CHEMISTRY; METALLURGY
- C12—BIOCHEMISTRY; BEER; SPIRITS; WINE; VINEGAR; MICROBIOLOGY; ENZYMOLOGY; MUTATION OR GENETIC ENGINEERING
- C12Q—MEASURING OR TESTING PROCESSES INVOLVING ENZYMES, NUCLEIC ACIDS OR MICROORGANISMS; COMPOSITIONS OR TEST PAPERS THEREFOR; PROCESSES OF PREPARING SUCH COMPOSITIONS; CONDITION-RESPONSIVE CONTROL IN MICROBIOLOGICAL OR ENZYMOLOGICAL PROCESSES
- C12Q2600/00—Oligonucleotides characterized by their use
- C12Q2600/154—Methylation markers
Definitions
- Methods for identifying a set of genetic loci having methylation states that distinguish between cell types comprise: receiving quantitative nucleotide sequencing data for a plurality of different cell types, where the data includes designations whether cytosines are methylated; and
- the cell types are mammalian immune cell types.
- the plurality of different cell types comprises at least two (e.g., 2, 3, 4, 5, 6, 7, 8, 9, 10 or more) cell types selected from hematopoietic stem cells, neutrophils, CD4+ naive T-cell, CD8+ naive T-cell, CD4+ Central Memory T-cell, CD8+ Central Memory T-cell, CD4+ Effector Memory T-cell, CD8+ Effector Memory T-cell, regulatory T-cells, natural killer cells, naive B-cells, memory B-cells, plasma cells, precursor B-cells, monocytes, dendritic cells, macrophages M0, macrophages Ml, macrophages M2, eosinophils, erythroblasts, or basophils.
- the cell types comprise one or more (e.g., two or more) T helper cell types, for example, one or more of Thl, Th2 or Thl7 cells.
- the tissue comprises stroma cells and at least two (e.g., 2, 3, 4, 5, 6, 7, 8, 9, 10 or more) cell types are selected from endothelial cells, fibroblasts, pericytes, smooth muscle cells, skeletal muscle cells, mast cells, adipocytes, mesenchymal stem cells, and epithelial cells.
- at least two (e.g., 2, 3, 4, 5, 6, 7, 8, 9, 10 or more) cell types are selected from melanocytes, hepatocytes, astrocytes, mesangial cells, and keratinocytes.
- the genetic loci are scored as "'methylated” when at least a majority of the CpG sequences are determined to be methylated and the genetic loci are scored as "unmethylated” when at least a majority of the CpG sequences are determined to be unmethylated.
- the methylation status signatures each have between 50-200 (e.g., 50-100, 30-100) different genetic loci.
- the set of genetic loci is between 500-10,000 (e.g., 500-5000, 500-7500, 200-5000, 200-3000) different loci.
- at least 70%, 80%, 90%, 95%, or 100% of the genetic loci are between 200-1000 (e.g., 200-500) nucleotides in length.
- the quantitatively nucleotide sequencing comprises bisulfite deep sequencing.
- one or more of the above-listed steps are computer implemented.
- nucleotide sequencing includes designations whether cytosines are methylated, to generate a set of determined sequencing reads having a determined methylation status at each genetic locus in the set of genetic loci;
- the cell types are mammalian immune cell types.
- the plurality of different cell types comprises at least two (e.g., 2, 3, 4, 5, 6, 7, 8, 9, 10 or more) cell types selected from hematopoietic stem cells, neutrophils, CD4+ naive T-cell, CD8+ naive T-cell, CD4+ Central Memory T-cell, CD8+ Central Memory T-cell, CD4+ Effector Memory T-cell, CD8+ Effector Memory T-cell, regulatory T-cells, natural killer cells, naive B-cells, memory B-cells, plasma cells, precursor B-cells, monocytes, dendritic cells, macrophages M0, macrophages Ml, macrophages M2, eosinophils, erythroblasts, or basophils.
- the cell types comprise one or more (e.g., two or more) T helper cell types, for example, one or more of Thl, Th2 or Thl7 cells.
- the tissue comprises stroma cells and at least two (e.g., 2, 3, 4, 5, 6, 7, 8, 9, 10 or more) cell types are selected from endothelial cells, fibroblasts, pericytes, smooth muscle cells, skeletal muscle cells, mast cells, adipocytes, mesenchymal stem cells, and epithelial cells.
- at least two (e.g., 2, 3, 4, 5, 6, 7, 8, 9, 10 or more) cell types are selected from melanocytes, hepatocytes, astrocytes, mesangial cells, and keratinocytes.
- the genetic loci are scored as "methylated” when at least a majority of the CpG sequences are determined to be methylated and the genetic loci are scored as "unmethylated” when at least a majority of the CpG sequences are determined to be unmethylated.
- the methylation status signatures each have between 50-200 (e.g., 50-100, 30-100) different genetic loci.
- the set of genetic loci is between 500-10,000 (e.g., 500-5000, 500-7500, 200-5000, 200-3000) different loci.
- At least 70%, 80%, 90%, 95%, or 100% of the genetic loci are between 200-1000 (e.g., 200-500) nucleotides in length.
- the quantitatively nucleotide sequencing comprises bisulfite deep sequencing.
- one or more of the above-listed steps are computer implemented.
- Also provided are computer products comprising a non-transitory computer readable medium storing a plurality of instructions that when executed determine the proportion and identity of different cell types in a sample.
- the instructions comprise:
- a set of determined sequencing reads from genomic DNA from a sample having a mixture of different cell types, the set of determined sequencing reads having a determined methylation status at each genetic locus in the set of genetic loci, the set of determined sequencing reads generated by quantitatively nucleotide sequencing a plurality of unique copies of the genomic DNA at the set of genetic loci having methylation states that distinguish between cell types of claim 1, wherein the nucleotide sequencing includes designations whether cytosines are methylated; comparing the set of determined sequencing reads to a reference set of a plurality of different methylation status signature that distinguishes between at least two different cell types in the sample; and
- the cell types are mammalian immune cell types.
- the plurality of different cell types comprises at least two (e.g., 2, 3, 4, 5, 6, 7, 8, 9, 10 or more) cell types selected from hematopoietic stem cells, neutrophils, CD4+ naive T-cell, CD8+ naive T-cell, CD4+ Central Memory T-cell, CD8+ Central Memory T-cell, CD4+ Effector Memory T-cell, CD8+ Effector Memory T-cell, regulatory T-cells, natural killer cells, naive B-cells, memory B-cells, plasma cells, precursor B-cells, monocytes, dendritic cells, macrophages M0, macrophages Ml, macrophages M2, eosinophils, erythroblasts, or basophils.
- the cell types comprise one or more (e.g., two or more) T helper cell types, for example, one or more of Thl, Th2 or Thl7 cells.
- the tissue comprises stroma cells and at least two (e.g., 2, 3, 4, S, 6, 7, 8, 9, 10 or more) cell types are selected from endothelial cells, fibroblasts, pericytes, smooth muscle cells, skeletal muscle cells, mast cells, adipocytes, mesenchymal stem cells, and epithelial cells.
- at least two (e.g., 2, 3, 4, 5, 6, 7, 8, 9, 10 or more) cell types are selected from melanocytes, hepatocytes, astrocytes, mesangial cells, and keratinocytes.
- the genetic loci are scored as "methylated” when at least a majority of the CpG sequences are determined to be methylated and the genetic loci are scored as "unmethylated” when at least a majority of the CpG sequences are determined to be unmethylated.
- the methylation status signatures each have between 50-200 (e.g., 50-100, 30-100) different genetic loci.
- the set of genetic loci is between 500-10,000 (e.g., 500-5000, 500-7500, 200-5000, 200-3000) different loci.
- at least 70%, 80%, 90%, 95%, or 100% of the genetic loci are between 200-1000 (e.g., 200-500) nucleotides in length.
- the quantitatively nucleotide sequencing comprises bisulfite deep sequencing.
- FIG. 1 A is an illustration of the problem of relying on single CpG to infer epistates.
- a third of the CpGs are methylated (black).
- the left reads set it is clear that there are two epistates, possibly from two different cell types, while the right reads set cannot be split to epistates.
- a method that will call methylation from independent CpGs will not be able to differentiate between the two sets.
- FIG. IB is a schematic of an overview of the design and validation of a method in accordance with an embodiment.
- FIG. 1C is a graph of an example of inferences of underlying abundance of an in- silico simulation based on the WGBS data.
- FIG. ID is a graph demonstrating inferring cell proportions in public WGBS samples.
- CD4+ T-cells of a centenarian are more specialized then newborn's, possibly explaining many differences found in the methylation profiles.
- a mislabeled macrophages sample was detected as 100% monocytes.
- FIG. 2A presents a series of graphs showing results from applying a method in accordance with an embodiment to in silico and in vitro mixtures.
- the reference dendritic cell is conventional (cDC), while we applied it on plasmacytoid (pDC), presumably explaining its prediction failure.
- cDC plasmacytoid
- pDC plasmacytoid
- FIG. 2B presents a series of graphs showing results from applying a method in accordance with an embodiment to 20 PBMCs, and comparing the inferences with abundances measured using CyTOF immunoprofiling on the same samples.
- FIG. 3A is a chart illustrating Pearson coefficients of correlations between targeted methylation calls and a reference matrix. Targeted bisulfite sequencing was performed on eight pure immune cell types. The percent of on-target reads was lower than expected, thus we were not able to use the full power of the methods.
- FIG. 3B is a series of graphs plotting methylation calls for each of the regions described in FIG. 3 A using the 20 reads threshold.
- the reference for pDCs is cDCs, which might explain the failure of the unmethylated regions.
- FIG. 3C is pair of graphs plotting the percent of discordance between the reference matrix and the targeted cells.
- FIG. 3D is a chart showing inferences on pure cell types using a method in accordance with an embodiment. The predictions fails in both Neutrophils and pDCs, and also lower success in CD8+ T-cells.
- FIG. 4 is a chart showing a comparison of results obtained using a method in accordance with an embodiment, to results obtained gene-expression based methods.
- FIG. 5 is a block diagram of a computer system in accordance with an embodiment.
- FIG. 6 is a table of genetic loci that can be used in methods in accordance with an embodiment.
- FIG. 7 is a table of results from deconvoluting publicly available whole genome bisulfite sequencing data. Methylation calls were downloaded from MethBase [Song, Q. et al., PLoS One, 8, (2013)]. The data was generated by [Heyn, H. et al., Epigenetics, 7, 542- 50 (2012); Sur, I. & Taipale, J., Nat Rev. Cancer, 28, 1045-1048 (2016); Heyn, H. et al.,
- the inventors have discovered a new and efficient way to determine the composition and proportion of different cell types in a sample using DNA methylation.
- the methods described herein can be used to classify a population of DNA reads to their cell of origin. Analyzing bisulfite treated DNA sequenced reads, each with multiple adjacent CpG sites, and comparing to a reference set, the methods can trace back the cell type from which the DNA sample was extracted. This is achieved, in part, by selecting loci having stable methylation status for each cell types of interest. Bisulfite treatment converts cytosine residues to uracil, but leaves 5-methylcytosine residues unaffected. In other words, in a DNA sequence that was treated with bisulfite it is possible to differentiate between methylated and unmethylated CpGs.
- Stability of methylation at a locus is defined by the concordance between the methylation status of the CpG sites in the locus, concordance between methylation status of the same CpG sites across reads from the sample, and concordance between different samples from different individuals.
- the stability score is highly concordant with the notion of epipolymorphism (Landan et al., Nature Genetics 44(11): 1207-14 (2012).
- the locus will be considered stable if the methylation status of all of CpG sites of the locus is high (close to 100% methylation) or low (close to 0% methylation).
- Thresholds can be set as discussed below depending on how close to 0% or 100% is needed or desired to formulate a set of useful loci.
- Methods of identifying methylation loci for distinguishing cell types involve bisulfite deep sequencing or other methods that are capable of determining the methylation status of DNA. As an initial step, one can be provided or can identify loci whose methylation status can be used to determine cell type identity. Accordingly, methods are provided for identifying loci whose methylation status can be used to distinguish cell types. [0047] To identify useful loci, quantitative nucleotide sequencing data for a plurality of different cell types can be generated, where the data includes designations whether cytosines are methylated. A variety of methods for sequencing DNA that also provides methylation status is available and can be used.
- bisulfite sequencing is used.
- Exemplary methods of bisulfite sequencing include but are not limited to those described in Li, et al. , Methods Mol Biol. 791 : 11-21 (2011).
- SMRT sequencing e.g., Flusberg, et al., Nature Methods 7, 461-465 (1 June 2010)
- Quantitative nucleotide sequencing refers to highly redundant sequencing of a nucleic acid sequence, for example such that the original number of copies of a sequence in a sample can be determined or estimated. Such techniques are often referred to as "deep sequencing" methods.
- Deep sequencing can be used to quantify the number of copies of a particular sequence in a sample and then also be used to determine the relative abundance of different sequences in a sample.
- the redundancy (i.e., depth) of the sequencing can be determined by the length of the sequence to be determined (X), the number of sequencing reads (N), and the average read length (L). The redundancy is then NxIJX.
- the sequencing depth can be, or be at least about 5, 6, 7, 8, 9, 10, 11, 12, 13, 14, 15, 16, 17, 18, 19, 20, 21, 22, 23, 24, 25, 26, 27, 28, 29, 30, 31, 32, 33, 34, 35, 36, 37, 38, 39, 40, 41, 42, 43, 44, 45, 46, 47, 48, 49, 50, 51, 52, 53, 54, 55 ,56, 57, 58, 59, 60, 70, 80, 90, 100, 110, 120, 130, 150, 200, 300, 500, 500, 700, 1000, 2000, 3000, 4000, 5000 or more. See, e.g., Mirebrahim, Hamid etai, Bioinformatics 31 (12): i9-il6 (2015).
- a cell type can be for example a classification used to distinguish between morphologically or phenotypically distinct cell forms within a species.
- Cell type as used herein can encompass general cell differences (e.g., T-cell vs. B-cell), or more specific differences (e.g., CD4+ T-cells vs. CD8+ Tcells, or for example, CD4+ memory T-cells and CD4+ effector T-cells).
- the number and identity of the different cell types assayed to identify loci will be determined based on need and interest. For example, in some embodiments, at least 2, 3, 4, 5, 6, 7, 8, 9, 10, or more (e.g., 2-20, 2-50, etc.) different cell types are quantitatively sequenced.
- 2-20, 2-50, etc. different cell types are quantitatively sequenced.
- At least 1, 2, 3, 4, 5, 6, 7, 8, 9, or 10 cell types are different immune cell types or are other cell types as described elsewhere herein.
- Quantitative nucleotide sequencing of the cell types can be whole-genome sequencing or otherwise targeted or random.
- the sequencing should present enough different sequencing reads to allow for identification of desired loci. Desired loci are those that have the following features:
- the read can be, for example, at least 50, 100, 150, 200, 500, or more nucleotides, e.g., 40-1000 nucleotides.
- All of the CpG sequences in a particular locus are either fully (per a predetermined threshold) methylated or are fully (per a prc-determined threshold) unmethylatcd. That is, each of the CpGs in the locus are methylated or each are unmethylated for any given cell type under consideration - no cell types show intermediate methylation or variable methylation between isolates of a particular cell type .
- “Stable” as used herein means that for every cell type assayed, the resulting methylation at the locus in question is always the same or at least above a certain threshold.
- the threshold is set as less man 0.05, 0.02, 0.01, 0.005, or 0.01, calculated as the difference of the methylation in each cell type from fully methylated or fully
- At least 1, 2, 3, 4, 5, 6, 7, 8, or more unique reference cells of particular cell type are used to establish stability of methylation locus for a particular cell type. If the stability of methylation at a certain locus is below the threshold, the locus should be discarded.
- Methylation status at the locus for at least one cell type must be different from the methylation status of at least one other cell type of interest. For example, if a locus is unmethylated in cell type A and is methylated in cell type B, then this criterion is met. In some embodiments, the methylation status at the locus for at least one cell type is different from the methylation status of all of the remaining cell types of interest.
- One can additionally or alternatively also select a stability threshold.
- stability can calculated by the difference of the methylation in each cell type from full or unmethylation, with a threshold of for example, ⁇ 0.01 or ⁇ 0.005.
- the differences can be squared or otherwise modified to increase the stability stringency.
- the same genetic loci in some embodiments, can be identified in more than one (e.g., 2, 3, 4, 5, or more) such pairs, and therefore the number of total genetic loci can be less than (# of pairs)*X. Optimally, one can select loci that distinguish multiple pairs of cell types, thereby reducing the total number of loci needed to accurately quantify different cell types in a mixture.
- a set of reference genetic loci can be determined. For each cell type of interest, a "signature" can thus be compiled that comprises the methylation status of the cell type at each reference genetic locus. These methylation status signatures can be used in distinguishing different cell types or quantifying the relative amounts of different cell types in a mixture, as discussed further below.
- a reference vector is generated to represent each signature that distinguishes one cell type from at least one other cell type.
- the total number of genetic loci can vary in a signature. In some embodiments, each signature can have less than 500 loci, e.g., 25-200 loci, e.g., 25-150 loci, e.g., 50-100 loci.
- the total number of loci across all signatures will depend on the number of signatures developed, which in turn will depend on the number of cell types to be distinguished. In some embodiments, the number of genetic loci will be between 500-10,000, e.g., 500-5,000 or 700-2,500.
- a signature a set of genetic loci identified for example as described above or otherwise generated
- the methods involve providing DNA extracted from a biological sample, wherein the sample has or is suspected of having one or more cell type and the genomic DNA comprises genomic DNA from the one or more cell type.
- Genomic DNA can be provided to the user of the method or can be obtained from an individual by the user.
- samples can be freshly obtained or can be from frozen or formalin-fixed and paraffin-embedded (FFPE).
- FFPE paraffin-embedded
- the genomic DNA can be obtained using routine techniques in the field of recombinant genetics. Basic texts disclosing the general methods of use in this invention include Sambrook and Russell, Molecular Cloning, A Laboratory Manual (3rd ed. 2001); Kriegler, Gene Transfer and Expression: A Laboratory Manual (1990); and Current Protocols in Molecular Biology (Ausubel et al., eds., 1994-1999).
- the biological sample can be any sample. Samples can be from, for example, an animal or plant. In some embodiments, the sample is from a mammal, e.g., a human. In some embodiments, the sample is all or part of a biopsy. For example, in some embodiments, the biopsy is from an individual who has a tumor and the biopsy is all or part of the tumor. In some embodiments, the sample is a blood sample. In some embodiments, the sample is from an individual having or thought to have an inflammatory disorder.
- nucleotide sequencing e.g., deep sequencing
- the nucleotide sequencing will allow for determination of methylation status of the loci.
- Methods for determining methylation status are described above, and for example can include bisulfite sequencing or next-generation sequencing methods (e.g., SMRT sequencing) that detect methylation as well as nucleotide identity.
- Bisulfite sequencing involves using bisulfite reagents to treat DNA to determine its pattern of methylation.
- the treatment of DNA with bisulfite converts cytosine residues to uracil but leaves 5-methylcytosine residues unaffected.
- Bisulfite treatment introduces specific changes in the DNA sequence that reflects the methylation status of the individual cytosine residues.
- Various analyses can be performed on the altered sequence to retrieve this information.
- Methods of targeted bisulfite sequencing that can be used in the methods described herein include, but are not limited to those described in e.g., Masser, et al, J Vis Exp. 96: (2015 Feb 24); Li, etal.,Nucl. Acids Res. (2015); Komori etal, Genome Research 21(10): 1738-1745 (2011).
- the number of genetic loci sequenced will depend in part on the number of cell types to be determined. In some embodiments, there are at least 10, 20, 30, 40, 50, 75, 100 or more loci to distinguish any two cell types and there are at least 2, 3, 4, 5, 6, 7, 8, 9, 10, 15, 2025 or more different cell types to distinguish.
- An advantage of the described methods is that one can avoid whole genome methods of sequencing and thereby allow for more sequencing depth given the same sequencing capacity. Allowing more sequencing depth given the same sequencing capacity (for example, from dozens of reads to thousands of reads) generates higher accuracy in distinguishing cell types, and identifying cell types with low abundance (improving sensitivity of the assay).
- each of the determined reads for loci can be aligned with the methylation status signatures.
- An exemplary algorithm suitable for determining sequence alignments of bisulfite -treated reads is the Bismark algorithm, which is described in Krueder, et al., Bioinfor mattes 27(11): 1571-1572 (2011), for example. One can discard sequencing reads that did not encompass all of the CpG sequences at the locus in question. Methylation status of each locus is then determined.
- the sequencing described above will result in a set of determined sequencing reads having a determined methylation status at each relevant base pair (e.g., in mammals, whether the cytosines in CpG subsequences are methylated, or not).
- Raw output reads (corresponding to the genetic loci) from the sequencing can be scored as "methylated” or "not methylated”.
- the average methylation of potential sites (e.g., cytosines in CpG subsequences) within a locus is determined and that score is assigned to that read. For example, if a locus has three potential methylation sites and two of them are methylated, the locus read could be scored as 0.66.
- each read methylation status can be "rounded” up or down depending on whether the average methylation is above or below 0.5.
- the read could be rounded to " ⁇ ' (mdicating ''methylated'') because 0.66 is greater than 0.5.
- a set of determined sequencing reads can be provided where each genetic locus in the set has a designated (i.e., determined) methylation status score, which is either a fraction indicating the actual fraction of potential (CG) sites that are methylated or a "1" or "0" (rounded values).
- sample signature that comprises the methylation status of the sample at each reference genetic locus.
- This sample signature can be compared to a reference set of different cell -type methylation status signatures, and the proportion of occurrences of cell-type signatures that correspond to the observed or measured sample signature can be determined. These occurrences of different cell-type signatures in the sample can then be used to determine the proportion and identity of different cell types in the sample.
- the methylation status of the methylation eligible sites is determined.
- the actual fraction of methylation out of the total number of eligible sites at the loci can be used or in some embodiments, the fraction of methylated sites can be rounded up to "1" (e.g., if a majority of the eligible sites are methylated) or down to "0".
- each read will have a methylation score assigned to it.
- the number of reads from the sample that align with each signature can be determined.
- the identity of the cell types in the sample can be determined using the signatures as the signatures distinguish between cell types based on methylation status.
- the proportion (e.g. percentage of total cells) of the cell types in the sample can be determined based on the number of reads corresponding to each signature.
- linear algebra can be applied to deconvolute the proportion (e.g., percent amount) of each cell type in the sample.
- A can be a matrix wherein each of the n columns represents the cell-type methylation status signature for a particular cell-type across all loci, and wherein each of the k rows represents the loci methylation status for particular loci across all cell types;
- x is a vector representing the proportion of each of the n cell types in the sample
- b is a vector representing the methylation measurements that correspond with (i.e., align with) the signatures that distinguish between at least two cell types.
- b can be a vector representing the sample methylation status signature across all loci
- ⁇ is a correction value
- the cell types identified and quantified in the sample will depend on what cell types are identified by the signatures used.
- one or more of the signatures distinguishes between mammalian (e.g., human) cell types.
- at least two (e.g., at least 3, 4, 5, 6, 7, 8, 9, 10, 15, 20, or more) signatures distinguish between different immune cell types.
- the signatures distinguish at least one of the following cell types from a second cell type (optionally the second cell type can also be selected from the following list): Hematopoietic stem cells, Neutrophils, CD4+ Naive T-cell, CD8+ Naive T-cell, CD4+ Central Memory T-cell, CD8+ Central Memory T-cell, CD4+ Effector Memory T-cell, CD8+ Effector Memory T-cell, Regulatory T-cells, natural killer cells, Naive B-cells, Memory B-cells, Plasma cells, Precursor B-cells, Monocytes, Dendritic cells, Macrophages MO, Macrophages Ml, Macrophages M2, Eosinophils, or erythroblasts, or basophils.
- the second cell type can also be selected from the following list
- the cell types comprise one or more (e.g., two or more) T helper cell types, for example, one or more of Thl, Th2 or Thl7 cells.
- the tissue comprises stroma cells and at least two (e.g., 2, 3, 4, 5, 6, 7, 8, 9, 10 or more) cell types are selected from endothelial cells, fibroblasts, pericytes, smooth muscle cells, skeletal muscle cells, mast cells, adipocytes, mesenchymal stem cells, and epithelial cells.
- at least two (e.g., 2, 3, 4, 5, 6, 7, 8, 9, 10 or more) cell types are selected from melanocytes, hepatocytes, astrocytes, mesangial cells, and keratinocytes.
- sequence reads of the various loci can be received by the computer system.
- the sequence reads can be aligned in the computer system with signatures that distinguish between two or more cell types.
- the computer system will determine the number or proportion of reads that align to different signature sequences.
- the identity of the sequence reads will be used by the computer system to provide the identity and proportion of cell type sin the sample. This can be achieved, for example, by the computer system applying linear algebra, for example as discussed above or elsewhere herein.
- CD8+ is associated with response to immune checkpoint blockade therapy.
- the methods allow for a deeper analysis of the response of an individual's tissue to therapy (including but not limited to immunotherapy).
- FIG. 5 shows a block diagram of an example computer system 700 usable with system and methods according to embodiments of the present invention.
- the computer system 700 can be used to run the program code for various method claims according to embodiments of the present invention.
- any of the computer systems mentioned herein may utilize any suitable number of subsystems. Examples of such subsystems are shown in FIG. 5 in computer apparatus 700.
- a computer system includes a single computer apparatus, where the subsystems can be the components of the computer apparatus.
- a computer system can include multiple computer apparatuses, each being a subsystem, with internal components.
- I/O controller 771 Peripherals and input/output (I/O) devices, which couple to I/O controller 771 , can be connected to the computer system by any number of means known in the art, such as serial port 777.
- serial port 777 or external interlace 781 can be used to connect computer system 700 to a wide area network such as the Internet, a mouse input device, or a scanner.
- the interconnection via system bus 775 allows the central processor 773 to communicate with each subsystem and to control the execution of instructions from system memory 772 or the fixed disk 779, as well as the exchange of information between subsystems.
- the system memory 772 and/or the fixed disk 779 may embody a computer readable medium. Any of the values mentioned herein can be output from one component to another component and can be output to the user.
- a computer system can include a plurality of the same components or subsystems, e.g., connected together by external interface 781 or by an internal interface.
- computer systems, subsystem, or apparatuses can communicate over a network.
- one computer can be considered a client and another computer a server, where each can be part of a same computer system.
- a client and a server can each include multiple systems, subsystems, or components.
- any of the embodiments of the present invention can be implemented in the form of control logic using hardware and/or using computer software in a modular or integrated manner. Based on the disclosure and teachings provided herein, a person of ordinary skill in the art will know and appreciate other ways and/or methods to implement embodiments of the present invention using hardware and a combination of hardware and software.
- any of the software components or functions described in this application may be implemented as software code to be executed by a processor using any suitable computer language such as, for example, Java, C++ or Perl using, for example, conventional or object- oriented techniques.
- the software code may be stored as a series of instructions or commands on a computer readable medium for storage and/or transmission, suitable media include random access memory (RAM), a read only memory (ROM), a magnetic medium such as a hard-drive or a floppy disk, or an optical medium such as a compact disk (CD) or DVD (digital versatile disk), flash memory, and the like.
- RAM random access memory
- ROM read only memory
- magnetic medium such as a hard-drive or a floppy disk
- an optical medium such as a compact disk (CD) or DVD (digital versatile disk), flash memory, and the like.
- CD compact disk
- DVD digital versatile disk
- flash memory and the like.
- the computer readable medium may be any combination of such storage or transmission devices.
- Such programs may also be encoded and transmitted using carrier signals adapted for transmission via wired, optical, and/or wireless networks conforming to a variety of protocols, including the Internet.
- a computer readable medium according to an embodiment of the present invention may be created using a data signal encoded with such programs.
- Computer readable media encoded with the program code may be packaged with a compatible device or provided separately from other devices (e.g., via Internet download). Any such computer readable medium may reside on or within a single computer program product (e.g. a hard drive, a CD, or an entire computer system), and may be present on or within different computer program products within a system or network.
- a computer system may include a monitor, printer, or other suitable display for providing any of the results mentioned herein to a user.
- any of the methods described herein may be totally or partially performed with a computer system including a processor, which can be configured to perform the steps.
- embodiments can be directed to computer systems configured to perform the steps of any of the methods described herein, potentially with different components performing a respective steps or a respective group of steps.
- steps of methods herein can be performed at a same time or in a different order. Additionally, portions of these steps may be used with portions of other steps from other methods. Also, all or portions of a step may be optional. Additionally, any of the steps of any of the methods can be performed with modules, circuits, or other means for performing these steps.
- DNA methylation profiles of 21 types of immune cell subsets were assembled. Based on these profiles genetic loci were determined that have at least three CpG sequences within a sequence read (in this example, within 200 bp) and for which all CpGs in the locus were either stably methylated or were unmethylated. For each of the 21 cell types we identified 50 genetic loci that distinguish one cell type from at least one other of the other 20 cell types, i.e., one has high methylation and the other low methylation. Genetic loci that were chosen were short regions that can be sequenced fully in one read, preferably with at least 3 CpGs.
- WGBS whole genome bisulfite sequencing
- the methylation levels of all CpGs in the genetic locus must distinguish one cell type from another, and be stable, methylated or unmethylated, in all other cell types.
- one genetic loci can distinguish between one cell type and several others. For example, a first cell type will be stably methylated whereas at least two (e.g., a second and a third cell type) other cell types will be stably unmethylated, thereby allowing one to distinguish the first cell type from the second cell type based on methylation at that genetic locus.
- Selection of genetic loci began by defining thresholds for the required methylation difference between cell types (starting with 95% difference) and stability threshold (starting with ⁇ 0.01), calculated as the difference of the determined methylation from fully methylated or fully unmethylated. We then gradually lowered these thresholds to allow more genetic loci to be included until we had the target number of loci per cell type pairs. In this analysis, we included 50 genetic loci for each pair of cell types.
- the number of chosen genetic loci in this analysis is not 50 times all pairs (10,500 in this case), but only 2,377 genetic loci.
- the average length of these genetic loci was 57.0 ⁇ 27.2bp and contains 4.4 ⁇ 1.7 CpGs. 85.1% of the genetic loci have methylation level > 80% (78.0% with methylation > 90%), and 13.3% have a methylation level ⁇ 20% (5.3% with methylation ⁇ 10%). Without intending to limit the scope of the present disclosure, we assume that most of this divergence from full methyl a tion or unmethylation is due to noise and non-perfect purification of the cell types.
- the cell A(ij) is 1 if genetic loci / ' is called as "methylated" in cell type j, and 0 otherwise.
- the exact methylation level - a continuous number between 0 and 1
- Each read is called “0” or "1” based on the majority of methylation sites.
- the output of this procedure was a vector, b, of 2,377 cells with a continuous number between 0 and 1 that represents the percentage of methylated reads in each genetic loci.
- Example 1 through Example 5 All the predictions presented in Example 1 through Example 5 are based on whole genome bisulfite sequencing, where the read depth is low ( ⁇ 10x). We also do not have access to the actual reads, but only to the processed whole genome bisulfite sequencing data which only contains the methylation level of the CpGs. Therefore, the mcthylation level of the genetic loci was inferred from the percent of methylation of each individual CpG site (combined together in each genetic loci), instead of from the actual reads which would have allowed much higher sensitivity to distinguish between cell types.
- targeted bisulfite sequencing will allow for increased read depth to lOOOx or more and by analyzing the reads directly, the accuracy and sensitivity of these analyses will be significantly improved, and will allow estimating the proportions of cell types that are at very low abundance.
- the table of FIG. 6 shows the genomic coordinates for the 2,377 genetic loci (in Human Genome version 19 (hgl9) coordinates) described in the Example 1 - Example 5. Because of size constraints, the values in the table below can wrap around to the location directly below. For example, the starting location for the first entry in chromosome 1 is at position 138063 and the 3 ⁇ 4SC" methylation score for that position is 0.97383.
- the 4th column is the number of CpGs in each genetic loci. In the analyses here each cell is rounded to 0 or 1 (>50% is 1 ) and lines with NA values are omitted.
- the methods disclosed herein use 10, 20, 30, 40, 50, 60, 70, 80, 90, 100, or more than 100 of the genetic loci listed in FIG. 6. It should be noted that the methods described herein are not limited to the loci listed in FIG. 6 and are only provided by way of example.
- DNA methylation Another genomic profiling measurement used for deconvolution is DNA methylation.
- DNA methylation like gene expression, is cell type specific, (Baron, U. et al., Epigenetics, 1, 55-60 (2006)) however its scales are fractions and its association with the mixture's composition is linear, and not continuous as in gene expression, making it a more potent measurement for portraying the tissue composition.
- a number of methods have employed DNA methylation arrays to predict the composition of handful of immune subsets. (Accomando, W. P. et al., Genome Biol., 15, R50 (2014); Houseman, E. A.
- WGBS whole genome bisulfite sequencing
- the methods disclosed herein use 10, 20, 30, 40, 50, 60, 70, 80, 90, 100, or more than 100 of the genetic loci listed in Table 5. It should be noted that the methods described herein are not limited to the loci listed in Table 5 and are only provided by way of example.
- EpiSort can serve as a potent tool for tissue composition analysis, and in particular for studying tumor microenvironment heterogeneity.
- the advantage of EpiSort over single-cell based technologies is clear: since no cell suspension is required, the analysis could be performed on solid tissues without additional destructive dissociation steps, and importantly, it could be performed on archived samples. In cancer studies, this is crucial. DNA methylation analysis from formalin-fixed paraffin -embedded (FFPE) tissues is possible, (Dumenil, T. D. et al., Genes. Chromosomes Cancer, 53, 537-548 (2014)) and thus EpiSort provides a compelling tool for reexamining archived cohorts.
- FFPE formalin-fixed paraffin -embedded
- EpiSort is more accurate than other bulk tissue-based methods. We expect that the accuracy can be further significantly improved with better optimization of the on-target reads.
- the reference matrix can be optimized as well by analyzing pure cell types with EpiSort, and removing inaccurate loci. However, since EpiSort relies on a reference matrix it is constrained by our current understanding of cell types annotations, and cannot detect continuums. It should be emphasized that EpiSort is only useful for enumerating cell types and not for any purpose beyond that.
- EpiSort is an accurate low cost method to enumerate cell populations in a bulk mixture. It can be performed with low quality and low amount of input DNA, and with high accuracy compared to other methods. We prospect that EpiSort will be a valuable tool for identifying predictive biomarkers that could lead to personalized cancer
- PBMCs of healthy volunteer were collected by the Stanford Blood Center, and were provided with courtesy from the Institute for Immunity, Transplantation and Infection (HIMC) at Stanford University.
- PBMCs were analyzed using the CyTOF immunoprofiling protocol described in Leipold & Maeker. (Leipold, M. & Maecker, H., BIO-PROTOCOL, 5, (2015)) Normalization of the mass cytometry data was performed according to Finck et al. (Finck, R. et al., Cytom. Part A, 83A, 483-494 (2013)) Next, normalization beads, debris, doublets, and dead cells were removed from the data before marker-based gating to determine the cell populations. The fractions presented are the number of cells in a particular gated subpopulation divided by the number of viable singlet cells.
- Extracted genomic DNA was sent to the University of California-Berkeley, Institute for Quantitative Biosciences (QB3), Functional Genomics Laboratory where it was prepared for Illumina short-read sequencing using a custom designed Nimblegen targeted capture probe panel.
- the DNAs were initially spiked with bisulfite conversion control, as indicated in the Nimblegen SeqCap Epi enrichment protocol (Roche Diagnostics Corp., Indianapolis, IN) and sheared to 200 base-pairs (bp) on a Covaris S220 Focused- Ultrasonicator (Covaris, Woburn, MA).
- Reference matrix - Based on the WGBS datasets we generated a 9,291x23 binary matrix for each of the UDMRs and cell types. Each cell in the matrix is 1 if the regions methylation > 0.5, and 0 otherwise.
- the reference matrix can be further refined using targeted bisulfite sequencing of pure cell types, which will yield higher reliability due to superior read depth.
- Targeting We used here the SeqCap Epi kit to target 9,291 regions, multiplexing 4 samples per reaction.
- Sequencing All 32 samples were multiplexed and sequenced together using one HiSeq 2500 lane. We used 150bp single-read sequences.
Landscapes
- Health & Medical Sciences (AREA)
- Engineering & Computer Science (AREA)
- General Health & Medical Sciences (AREA)
- Life Sciences & Earth Sciences (AREA)
- Medical Informatics (AREA)
- Physics & Mathematics (AREA)
- Bioinformatics & Cheminformatics (AREA)
- Analytical Chemistry (AREA)
- Biophysics (AREA)
- Molecular Biology (AREA)
- Proteomics, Peptides & Aminoacids (AREA)
- Bioinformatics & Computational Biology (AREA)
- Biotechnology (AREA)
- Evolutionary Biology (AREA)
- Genetics & Genomics (AREA)
- Chemical & Material Sciences (AREA)
- Spectroscopy & Molecular Physics (AREA)
- Theoretical Computer Science (AREA)
- Epidemiology (AREA)
- Primary Health Care (AREA)
- Public Health (AREA)
- Measuring Or Testing Involving Enzymes Or Micro-Organisms (AREA)
Abstract
Methods of determining proportions of cell types in a sample using methylation status are provided.
Description
DETERMINATION OF CELL TYPES IN MIXTURES USING TARGETED BISULFITE SEQUENCING
CROSS-REFERENCES TO RELATED APPLICATIONS
[0001] This application claims the benefit of U.S. Provisional Application No. 62/338,845, filed May 19, 2016, which is incorporated by reference in its entirety herein for all purposes.
STATEMENT AS TO RIGHTS TO INVENTIONS MADE UNDER FEDERALLY SPONSORED RESEARCH AND DEVELOPMENT
[0002] This invention was made with government support under grant no. U24 CA195858 awarded by the National Institutes of Health. The government has certain rights in the invention.
BACKGROUND OF THE INVENTION
[0003] Analysis of the composition of the different cell types constituting a tissue is useful to understanding of the pathogenesis of a broad range of human diseases. For example, tumor-infiltrating immune cells have long been thought to affect tumor growth, in recent years, large retrospective studies have shown that the nature and polarization of the immune cells found within the tumor microenvironment impact not only the growth of the primary tumor, but also disease progression and patient survival. See, e.g., Toh etai, Methods Mol Biol. 961:261-77 (2013). BRIEF SUMMARY OF THE INVENTION
[0004] Methods for identifying a set of genetic loci having methylation states that distinguish between cell types are provided. In some embodiments, the methods comprise: receiving quantitative nucleotide sequencing data for a plurality of different cell types, where the data includes designations whether cytosines are methylated; and
selecting genetic loci from the quantitative nucleotide sequencing data:
(i) that have at least three CpG sequences within 200 contiguous nucleotides,
(ii) for which all of the at least three CpG sequences are fully methylated or fully unmethylated for a particular cell type; and
(iii) wherein methylation status of the at least three CpG sequences is stably different between two different cell types,
thereby selecting a set of genetic loci having methylation states that distinguish between cell types.
[0005] In some embodiments, the cell types are mammalian immune cell types. In some embodiments, the plurality of different cell types comprises at least two (e.g., 2, 3, 4, 5, 6, 7, 8, 9, 10 or more) cell types selected from hematopoietic stem cells, neutrophils, CD4+ naive T-cell, CD8+ naive T-cell, CD4+ Central Memory T-cell, CD8+ Central Memory T-cell, CD4+ Effector Memory T-cell, CD8+ Effector Memory T-cell, regulatory T-cells, natural killer cells, naive B-cells, memory B-cells, plasma cells, precursor B-cells, monocytes, dendritic cells, macrophages M0, macrophages Ml, macrophages M2, eosinophils, erythroblasts, or basophils. In some embodiments, the cell types comprise one or more (e.g., two or more) T helper cell types, for example, one or more of Thl, Th2 or Thl7 cells. In some embodiments, the tissue comprises stroma cells and at least two (e.g., 2, 3, 4, 5, 6, 7, 8, 9, 10 or more) cell types are selected from endothelial cells, fibroblasts, pericytes, smooth muscle cells, skeletal muscle cells, mast cells, adipocytes, mesenchymal stem cells, and epithelial cells. In some embodiments, at least two (e.g., 2, 3, 4, 5, 6, 7, 8, 9, 10 or more) cell types are selected from melanocytes, hepatocytes, astrocytes, mesangial cells, and keratinocytes.
[0006] In some embodiments, the genetic loci are scored as "'methylated" when at least a majority of the CpG sequences are determined to be methylated and the genetic loci are scored as "unmethylated" when at least a majority of the CpG sequences are determined to be unmethylated.
[0007] In some embodiments, the methylation status signatures each have between 50-200 (e.g., 50-100, 30-100) different genetic loci.
[0008] In some embodiments, the set of genetic loci is between 500-10,000 (e.g., 500-5000, 500-7500, 200-5000, 200-3000) different loci. [0009] In some embodiments, at least 70%, 80%, 90%, 95%, or 100% of the genetic loci are between 200-1000 (e.g., 200-500) nucleotides in length.
[0010] In some embodiments, the quantitatively nucleotide sequencing comprises bisulfite deep sequencing.
[0011] In some embodiments, one or more of the above-listed steps are computer implemented. [0012] Also provided are methods for determining the proportion and identity of different cell types in a sample. In some embodiments, the methods comprise:
providing genomic DNA from a sample having a mixture of different cell types;
quantitatively nucleotide sequencing a plurality of unique copies of the genomic DNA at said set of genetic loci having methylation states that distinguish between cell types of claim 1 , wherein the nucleotide sequencing includes designations whether cytosines are methylated, to generate a set of determined sequencing reads having a determined methylation status at each genetic locus in the set of genetic loci;
comparing the set of determined sequencing reads to a reference set of a plurality of different methylation status signatures that distinguish between at least two different cell types in the sample; and
determining the proportion of occurrences of different methylation status signatures in the set of determined sequencing reads and determining the proportion and identity of different cell types in the sample by deconvoluting the occurrences of different methylation status signatures.
[0013] In some embodiments, the cell types are mammalian immune cell types. In some embodiments, the plurality of different cell types comprises at least two (e.g., 2, 3, 4, 5, 6, 7, 8, 9, 10 or more) cell types selected from hematopoietic stem cells, neutrophils, CD4+ naive T-cell, CD8+ naive T-cell, CD4+ Central Memory T-cell, CD8+ Central Memory T-cell, CD4+ Effector Memory T-cell, CD8+ Effector Memory T-cell, regulatory T-cells, natural killer cells, naive B-cells, memory B-cells, plasma cells, precursor B-cells, monocytes, dendritic cells, macrophages M0, macrophages Ml, macrophages M2, eosinophils, erythroblasts, or basophils. In some embodiments, the cell types comprise one or more (e.g., two or more) T helper cell types, for example, one or more of Thl, Th2 or Thl7 cells. In some embodiments, the tissue comprises stroma cells and at least two (e.g., 2, 3, 4, 5, 6, 7, 8, 9, 10 or more) cell types are selected from endothelial cells, fibroblasts, pericytes, smooth muscle cells, skeletal muscle cells, mast cells, adipocytes, mesenchymal stem cells, and
epithelial cells. In some embodiments, at least two (e.g., 2, 3, 4, 5, 6, 7, 8, 9, 10 or more) cell types are selected from melanocytes, hepatocytes, astrocytes, mesangial cells, and keratinocytes.
[0014] In some embodiments, the genetic loci are scored as "methylated" when at least a majority of the CpG sequences are determined to be methylated and the genetic loci are scored as "unmethylated" when at least a majority of the CpG sequences are determined to be unmethylated.
[0015] In some embodiments, the methylation status signatures each have between 50-200 (e.g., 50-100, 30-100) different genetic loci.
[0016] In some embodiments, the set of genetic loci is between 500-10,000 (e.g., 500-5000, 500-7500, 200-5000, 200-3000) different loci.
[0017] In some embodiments, at least 70%, 80%, 90%, 95%, or 100% of the genetic loci are between 200-1000 (e.g., 200-500) nucleotides in length.
[0018] In some embodiments, the quantitatively nucleotide sequencing comprises bisulfite deep sequencing.
[0019] In some embodiments, one or more of the above-listed steps are computer implemented.
[0020] Also provided are computer products comprising a non-transitory computer readable medium storing a plurality of instructions that when executed determine the proportion and identity of different cell types in a sample. In some embodiments, the instructions comprise:
receiving a set of determined sequencing reads from genomic DNA from a sample having a mixture of different cell types, the set of determined sequencing reads having a determined methylation status at each genetic locus in the set of genetic loci, the set of determined sequencing reads generated by quantitatively nucleotide sequencing a plurality of unique copies of the genomic DNA at the set of genetic loci having methylation states that distinguish between cell types of claim 1, wherein the nucleotide sequencing includes designations whether cytosines are methylated;
comparing the set of determined sequencing reads to a reference set of a plurality of different methylation status signature that distinguishes between at least two different cell types in the sample; and
determining the proportion of occurrences of different methylation status signatures in the set of determined sequencing reads and determining the proportion and identity of different cell types in the sample by deconvoluting the occurrences of different methylation status signatures.
[0021] In some embodiments, the cell types are mammalian immune cell types. In some embodiments, the plurality of different cell types comprises at least two (e.g., 2, 3, 4, 5, 6, 7, 8, 9, 10 or more) cell types selected from hematopoietic stem cells, neutrophils, CD4+ naive T-cell, CD8+ naive T-cell, CD4+ Central Memory T-cell, CD8+ Central Memory T-cell, CD4+ Effector Memory T-cell, CD8+ Effector Memory T-cell, regulatory T-cells, natural killer cells, naive B-cells, memory B-cells, plasma cells, precursor B-cells, monocytes, dendritic cells, macrophages M0, macrophages Ml, macrophages M2, eosinophils, erythroblasts, or basophils. In some embodiments, the cell types comprise one or more (e.g., two or more) T helper cell types, for example, one or more of Thl, Th2 or Thl7 cells. In some embodiments, the tissue comprises stroma cells and at least two (e.g., 2, 3, 4, S, 6, 7, 8, 9, 10 or more) cell types are selected from endothelial cells, fibroblasts, pericytes, smooth muscle cells, skeletal muscle cells, mast cells, adipocytes, mesenchymal stem cells, and epithelial cells. In some embodiments, at least two (e.g., 2, 3, 4, 5, 6, 7, 8, 9, 10 or more) cell types are selected from melanocytes, hepatocytes, astrocytes, mesangial cells, and keratinocytes.
[0022] In some embodiments, the genetic loci are scored as "methylated" when at least a majority of the CpG sequences are determined to be methylated and the genetic loci are scored as "unmethylated" when at least a majority of the CpG sequences are determined to be unmethylated.
[0023] In some embodiments, the methylation status signatures each have between 50-200 (e.g., 50-100, 30-100) different genetic loci.
[0024] In some embodiments, the set of genetic loci is between 500-10,000 (e.g., 500-5000, 500-7500, 200-5000, 200-3000) different loci.
[0025] In some embodiments, at least 70%, 80%, 90%, 95%, or 100% of the genetic loci are between 200-1000 (e.g., 200-500) nucleotides in length.
[0026] In some embodiments, wherein the quantitatively nucleotide sequencing comprises bisulfite deep sequencing. [0027] Also provided of using the computer products described above or elsewhere herein to determine the proportion and identity of different cell types in a sample.
BRIEF DESCRIPTION OF THE DRAWINGS
[0028] FIG. 1 A is an illustration of the problem of relying on single CpG to infer epistates. In both examples a third of the CpGs are methylated (black). In the left reads set it is clear that there are two epistates, possibly from two different cell types, while the right reads set cannot be split to epistates. However, a method that will call methylation from independent CpGs will not be able to differentiate between the two sets.
[0029] FIG. IB is a schematic of an overview of the design and validation of a method in accordance with an embodiment.
[0030] FIG. 1C is a graph of an example of inferences of underlying abundance of an in- silico simulation based on the WGBS data.
[0031] FIG. ID is a graph demonstrating inferring cell proportions in public WGBS samples. CD4+ T-cells of a centenarian are more specialized then newborn's, possibly explaining many differences found in the methylation profiles. A mislabeled macrophages sample was detected as 100% monocytes.
[0032] FIG. 2A presents a series of graphs showing results from applying a method in accordance with an embodiment to in silico and in vitro mixtures. The reference dendritic cell is conventional (cDC), while we applied it on plasmacytoid (pDC), presumably explaining its prediction failure. A linear function was used to shift and scale the associations.
[0033] FIG. 2B presents a series of graphs showing results from applying a method in accordance with an embodiment to 20 PBMCs, and comparing the inferences with abundances measured using CyTOF immunoprofiling on the same samples. In 14 of the 15 cell types the correlation is significant (p-value < 0.05), and in regulatory T-cells (Tregs) the significance is marginal (p=0.06).
[0034] FIG. 3A is a chart illustrating Pearson coefficients of correlations between targeted methylation calls and a reference matrix. Targeted bisulfite sequencing was performed on eight pure immune cell types. The percent of on-target reads was lower than expected, thus we were not able to use the full power of the methods. Only ~55% of the regions had at least 20 reads, and only 22% over 50 reads. We computed methylation calls for each of the regions, which is the fraction of reads with majority of CpGs methylated from all reads that have a majority. The top correlation for each of the targeted cells is the corresponding cell types.
[0035] FIG. 3B is a series of graphs plotting methylation calls for each of the regions described in FIG. 3 A using the 20 reads threshold. The reference for pDCs is cDCs, which might explain the failure of the unmethylated regions.
[0036] FIG. 3C is pair of graphs plotting the percent of discordance between the reference matrix and the targeted cells.
[0037] FIG. 3D is a chart showing inferences on pure cell types using a method in accordance with an embodiment. The predictions fails in both Neutrophils and pDCs, and also lower success in CD8+ T-cells.
[0038] FIG. 4 is a chart showing a comparison of results obtained using a method in accordance with an embodiment, to results obtained gene-expression based methods.
[0039] FIG. 5 is a block diagram of a computer system in accordance with an embodiment. [0040] FIG. 6 is a table of genetic loci that can be used in methods in accordance with an embodiment.
[0041] FIG. 7 is a table of results from deconvoluting publicly available whole genome bisulfite sequencing data. Methylation calls were downloaded from MethBase [Song, Q. et al., PLoS One, 8, (2013)]. The data was generated by [Heyn, H. et al., Epigenetics, 7, 542- 50 (2012); Sur, I. & Taipale, J., Nat Rev. Cancer, 28, 1045-1048 (2016); Heyn, H. et al.,
Proc. Natl. Acad. Sci. U. S. A., 109, 10522-7 (2012); Paris, A. et al., Genome Res., 25, 1801- 11 (2015); Lund, K. et al., Genome Biol., 15, 406 (2014); Li, Y. et al., PLoSBiol, 8, el 000533 (2010)]. Average methylation of the 9,291 regions was calculated for each sample (were data was available), and linear least square analysis was performed using the reference matrix we generated.
[0042] FIG. 8 is a table of results from a targeted bisulfite sequencing experiment on 32 samples: 8 pure cell types, 4 mixes of those cell types and 20 PBMCs which were also analyzed using CyTOF immunoprofiling. All captured pools were sequenced using one HiSeq 2000 single-end rapid lane. The table shows the amount of DNA per sample, number of reads, mapped reads using Bismark, on-target reads with at least 1 CpG intersecting targeted reads, and with at least 2 CpGs. Samples with as low as 42 nanograms of initial DNA performed equally as samples with lug initial DNA. The targeting was lower than expected, possibly due to using universal blocking oligos. DETAILED DESCRIPTION OF THE INVENTION
Introduction
[0043] The inventors have discovered a new and efficient way to determine the composition and proportion of different cell types in a sample using DNA methylation. As discussed further below, the methods described herein can be used to classify a population of DNA reads to their cell of origin. Analyzing bisulfite treated DNA sequenced reads, each with multiple adjacent CpG sites, and comparing to a reference set, the methods can trace back the cell type from which the DNA sample was extracted. This is achieved, in part, by selecting loci having stable methylation status for each cell types of interest. Bisulfite treatment converts cytosine residues to uracil, but leaves 5-methylcytosine residues unaffected. In other words, in a DNA sequence that was treated with bisulfite it is possible to differentiate between methylated and unmethylated CpGs.
[0044] Stability of methylation at a locus is defined by the concordance between the methylation status of the CpG sites in the locus, concordance between methylation status of the same CpG sites across reads from the sample, and concordance between different samples from different individuals. The stability score is highly concordant with the notion of epipolymorphism (Landan et al., Nature Genetics 44(11): 1207-14 (2012). The locus will be considered stable if the methylation status of all of CpG sites of the locus is high (close to 100% methylation) or low (close to 0% methylation). Thresholds can be set as discussed below depending on how close to 0% or 100% is needed or desired to formulate a set of useful loci.
[0045] By identifying loci with stable methylation statuses that differ from one cell type to another the inventors have discovered a way to select a subset of total available loci for targeted sequencing , thereby avoiding the need to sequence the whole genome. By narrowing the number of loci sequenced compared to whole genome sequencing, one can sequence with considerably more depth, thereby allowing for accurate quantification of loci and their methylation state. This in turn can be used to determine the proportion of different cell types in a sample by application of linear algebra. This and other aspects are described herein.
Methods of identifying methylation loci for distinguishing cell types [0046] Methods of determining proportions of cell types in a sample as described herein involve bisulfite deep sequencing or other methods that are capable of determining the methylation status of DNA. As an initial step, one can be provided or can identify loci whose methylation status can be used to determine cell type identity. Accordingly, methods are provided for identifying loci whose methylation status can be used to distinguish cell types. [0047] To identify useful loci, quantitative nucleotide sequencing data for a plurality of different cell types can be generated, where the data includes designations whether cytosines are methylated. A variety of methods for sequencing DNA that also provides methylation status is available and can be used. In some embodiments, bisulfite sequencing is used. Exemplary methods of bisulfite sequencing include but are not limited to those described in Li, et al. , Methods Mol Biol. 791 : 11-21 (2011). In other embodiments, SMRT sequencing (e.g., Flusberg, et al., Nature Methods 7, 461-465 (1 June 2010)) or other sequencing methods that detect methylation status is used. "Quantitative nucleotide sequencing" refers to highly redundant sequencing of a nucleic acid sequence, for example such that the original number of copies of a sequence in a sample can be determined or estimated. Such techniques are often referred to as "deep sequencing" methods. Deep sequencing can be used to quantify the number of copies of a particular sequence in a sample and then also be used to determine the relative abundance of different sequences in a sample. The redundancy (i.e., depth) of the sequencing can be determined by the length of the sequence to be determined (X), the number of sequencing reads (N), and the average read length (L). The redundancy is then NxIJX. The sequencing depth can be, or be at least about 5, 6, 7, 8, 9, 10, 11, 12, 13, 14, 15, 16, 17, 18, 19, 20, 21, 22, 23, 24, 25, 26, 27, 28, 29, 30, 31, 32, 33, 34, 35, 36, 37, 38, 39, 40, 41, 42, 43, 44, 45, 46, 47, 48, 49, 50, 51, 52, 53, 54, 55 ,56, 57, 58, 59, 60, 70, 80, 90, 100,
110, 120, 130, 150, 200, 300, 500, 500, 700, 1000, 2000, 3000, 4000, 5000 or more. See, e.g., Mirebrahim, Hamid etai, Bioinformatics 31 (12): i9-il6 (2015).
[0048] One can perform quantitative nucleotide sequencing (with methylation detection) on a plurality of different pure cell types, e.g., from pure cell cultures. A cell type can be for example a classification used to distinguish between morphologically or phenotypically distinct cell forms within a species. "Cell type" as used herein can encompass general cell differences (e.g., T-cell vs. B-cell), or more specific differences (e.g., CD4+ T-cells vs. CD8+ Tcells, or for example, CD4+ memory T-cells and CD4+ effector T-cells). The number and identity of the different cell types assayed to identify loci will be determined based on need and interest. For example, in some embodiments, at least 2, 3, 4, 5, 6, 7, 8, 9, 10, or more (e.g., 2-20, 2-50, etc.) different cell types are quantitatively sequenced. In some
embodiments, at least 1, 2, 3, 4, 5, 6, 7, 8, 9, or 10 cell types are different immune cell types or are other cell types as described elsewhere herein.
[0049] Quantitative nucleotide sequencing of the cell types can be whole-genome sequencing or otherwise targeted or random. The sequencing should present enough different sequencing reads to allow for identification of desired loci. Desired loci are those that have the following features:
[0050] 1) Having at least two (e.g., at least 3, 4, or more) CpG sequences with the read. In non-limiting embodiments, the read can be, for example, at least 50, 100, 150, 200, 500, or more nucleotides, e.g., 40-1000 nucleotides.
[0051] 2) All of the CpG sequences in a particular locus are either fully (per a predetermined threshold) methylated or are fully (per a prc-determined threshold) unmethylatcd. That is, each of the CpGs in the locus are methylated or each are unmethylated for any given cell type under consideration - no cell types show intermediate methylation or variable methylation between isolates of a particular cell type .
[0052] 3) Methylation at a desired locus must be stable for all cell types of interest.
"Stable" as used herein means that for every cell type assayed, the resulting methylation at the locus in question is always the same or at least above a certain threshold. In some embodiments, the threshold is set as less man 0.05, 0.02, 0.01, 0.005, or 0.01, calculated as the difference of the methylation in each cell type from fully methylated or fully
unmethylated. In some embodiments, at least 1, 2, 3, 4, 5, 6, 7, 8, or more unique reference cells of particular cell type are used to establish stability of methylation locus for a particular
cell type. If the stability of methylation at a certain locus is below the threshold, the locus should be discarded.
[0053] 4) Methylation status at the locus for at least one cell type must be different from the methylation status of at least one other cell type of interest. For example, if a locus is unmethylated in cell type A and is methylated in cell type B, then this criterion is met. In some embodiments, the methylation status at the locus for at least one cell type is different from the methylation status of all of the remaining cell types of interest. One can select a threshold for the required methylation difference between cell type pairs. For example, in some embodiments, the threshold is at least a 80%, 85%, 90%, or 95% difference in methylation between two cell types. One can additionally or alternatively also select a stability threshold. For example, stability can calculated by the difference of the methylation in each cell type from full or unmethylation, with a threshold of for example, < 0.01 or <0.005. In some embodiments, the differences can be squared or otherwise modified to increase the stability stringency. One can lower these thresholds to allow more genetic loci to be included if additional loci are desired.
[0054] In some embodiments, at least a certain number of loci distinguishing one cell type from another are identified for each cell pair. For example, in some embodiments, for each pair of cell types one can identify at least X number of genetic loci that distinguish one from the other (one has high methylation and the other low methylation), where in some embodiments, X= at least 10, 20, 30, 40, 50, 75, 100 or more, e.g., 10-100, 25-75, etc. In all the rest of the cell types the selected loci will have a methylation that is also high (i.e., fully methylated) or low (i.e., not methylated), that is their methylation is stable, not changing between isolates of the same cell type). The same genetic loci, in some embodiments, can be identified in more than one (e.g., 2, 3, 4, 5, or more) such pairs, and therefore the number of total genetic loci can be less than (# of pairs)*X. Optimally, one can select loci that distinguish multiple pairs of cell types, thereby reducing the total number of loci needed to accurately quantify different cell types in a mixture.
[0055] By following the above-described method, a set of reference genetic loci can be determined. For each cell type of interest, a "signature" can thus be compiled that comprises the methylation status of the cell type at each reference genetic locus. These methylation status signatures can be used in distinguishing different cell types or quantifying the relative amounts of different cell types in a mixture, as discussed further below. In some
embodiments, a reference vector is generated to represent each signature that distinguishes one cell type from at least one other cell type. The total number of genetic loci can vary in a signature. In some embodiments, each signature can have less than 500 loci, e.g., 25-200 loci, e.g., 25-150 loci, e.g., 50-100 loci. The total number of loci across all signatures will depend on the number of signatures developed, which in turn will depend on the number of cell types to be distinguished. In some embodiments, the number of genetic loci will be between 500-10,000, e.g., 500-5,000 or 700-2,500.
Methods of using methylation loci to determine proportions of cell types in a sample
[0056] Also provided are methods of using a signature (a set of genetic loci identified for example as described above or otherwise generated) to determine the proportion and identity of different cell types in a sample.
[0057] The methods involve providing DNA extracted from a biological sample, wherein the sample has or is suspected of having one or more cell type and the genomic DNA comprises genomic DNA from the one or more cell type. Genomic DNA can be provided to the user of the method or can be obtained from an individual by the user. In some embodiments, samples can be freshly obtained or can be from frozen or formalin-fixed and paraffin-embedded (FFPE). In any case, the genomic DNA can be obtained using routine techniques in the field of recombinant genetics. Basic texts disclosing the general methods of use in this invention include Sambrook and Russell, Molecular Cloning, A Laboratory Manual (3rd ed. 2001); Kriegler, Gene Transfer and Expression: A Laboratory Manual (1990); and Current Protocols in Molecular Biology (Ausubel et al., eds., 1994-1999).
[0058] The biological sample can be any sample. Samples can be from, for example, an animal or plant. In some embodiments, the sample is from a mammal, e.g., a human. In some embodiments, the sample is all or part of a biopsy. For example, in some embodiments, the biopsy is from an individual who has a tumor and the biopsy is all or part of the tumor. In some embodiments, the sample is a blood sample. In some embodiments, the sample is from an individual having or thought to have an inflammatory disorder.
[0059] Once genomic DNA is obtained from the sample, quantitative nucleotide sequencing (e.g., deep sequencing) of the DNA is performed at a set of genetic loci whose methylation status has previously been determined to distinguish between at least two different cell types. The nucleotide sequencing will allow for determination of methylation
status of the loci. Methods for determining methylation status are described above, and for example can include bisulfite sequencing or next-generation sequencing methods (e.g., SMRT sequencing) that detect methylation as well as nucleotide identity.
[0060] Bisulfite sequencing involves using bisulfite reagents to treat DNA to determine its pattern of methylation. The treatment of DNA with bisulfite converts cytosine residues to uracil but leaves 5-methylcytosine residues unaffected. Bisulfite treatment introduces specific changes in the DNA sequence that reflects the methylation status of the individual cytosine residues. Various analyses can be performed on the altered sequence to retrieve this information. Methods of targeted bisulfite sequencing that can be used in the methods described herein include, but are not limited to those described in e.g., Masser, et al, J Vis Exp. 96: (2015 Feb 24); Li, etal.,Nucl. Acids Res. (2015); Komori etal, Genome Research 21(10): 1738-1745 (2011).
[0061] The number of genetic loci sequenced will depend in part on the number of cell types to be determined. In some embodiments, there are at least 10, 20, 30, 40, 50, 75, 100 or more loci to distinguish any two cell types and there are at least 2, 3, 4, 5, 6, 7, 8, 9, 10, 15, 2025 or more different cell types to distinguish. An advantage of the described methods is that one can avoid whole genome methods of sequencing and thereby allow for more sequencing depth given the same sequencing capacity. Allowing more sequencing depth given the same sequencing capacity (for example, from dozens of reads to thousands of reads) generates higher accuracy in distinguishing cell types, and identifying cell types with low abundance (improving sensitivity of the assay).
[0062] Accordingly, each of the determined reads for loci can be aligned with the methylation status signatures. An exemplary algorithm suitable for determining sequence alignments of bisulfite -treated reads is the Bismark algorithm, which is described in Krueder, et al., Bioinfor mattes 27(11): 1571-1572 (2011), for example. One can discard sequencing reads that did not encompass all of the CpG sequences at the locus in question. Methylation status of each locus is then determined.
[0063] The sequencing described above will result in a set of determined sequencing reads having a determined methylation status at each relevant base pair (e.g., in mammals, whether the cytosines in CpG subsequences are methylated, or not). Raw output reads (corresponding to the genetic loci) from the sequencing can be scored as "methylated" or "not methylated". In some embodiments, the average methylation of potential sites (e.g., cytosines in CpG
subsequences) within a locus is determined and that score is assigned to that read. For example, if a locus has three potential methylation sites and two of them are methylated, the locus read could be scored as 0.66. In other embodiments, each read methylation status can be "rounded" up or down depending on whether the average methylation is above or below 0.5. Thus, in the example above, the read could be rounded to " Γ' (mdicating ''methylated'') because 0.66 is greater than 0.5. Accordingly, a set of determined sequencing reads can be provided where each genetic locus in the set has a designated (i.e., determined) methylation status score, which is either a fraction indicating the actual fraction of potential (CG) sites that are methylated or a "1" or "0" (rounded values).
[0064] The set of determined sequencing reads having a determined methylation status can then be compiled to generate a "sample signature" that comprises the methylation status of the sample at each reference genetic locus. This sample signature can be compared to a reference set of different cell -type methylation status signatures, and the proportion of occurrences of cell-type signatures that correspond to the observed or measured sample signature can be determined. These occurrences of different cell-type signatures in the sample can then be used to determine the proportion and identity of different cell types in the sample.
[0065] Further, the methylation status of the methylation eligible sites (e.g., in mammalian samples, CpG sites) in each sequence read is determined. As discussed above, the actual fraction of methylation out of the total number of eligible sites at the loci can be used or in some embodiments, the fraction of methylated sites can be rounded up to "1" (e.g., if a majority of the eligible sites are methylated) or down to "0". Thus, each read will have a methylation score assigned to it.
[0066] The number of reads from the sample that align with each signature can be determined. The identity of the cell types in the sample can be determined using the signatures as the signatures distinguish between cell types based on methylation status. The proportion (e.g. percentage of total cells) of the cell types in the sample can be determined based on the number of reads corresponding to each signature.
[0067] In some embodiments, linear algebra can be applied to deconvolute the proportion (e.g., percent amount) of each cell type in the sample. For example, in some embodiments, an array of linear equations can be generated in the format Αχ+ε=¾, where:
A is a k x n matrix where k is the number of loci and n is the number of cell types, wherein each value in the matrix represents the methylation score (a fraction or rounded to "1" or "0") of a particular locus within a particular cell type. Thus A can be a matrix wherein each of the n columns represents the cell-type methylation status signature for a particular cell-type across all loci, and wherein each of the k rows represents the loci methylation status for particular loci across all cell types;
x is a vector representing the proportion of each of the n cell types in the sample; b is a vector representing the methylation measurements that correspond with (i.e., align with) the signatures that distinguish between at least two cell types. Thus b can be a vector representing the sample methylation status signature across all loci; and
ε is a correction value.
Thus for example, this equation can be displayed as follows, with exemplary values inserted for A:

[0068] The system of k linear equations can then be solved for the n variables in vector x, thereby determining the proportion of cell types in the sample. For example, linear least squares, support vector regression, or other methods can be used to calculate the proportions.
[0069] As discussed above, the cell types identified and quantified in the sample will depend on what cell types are identified by the signatures used. In some embodiments, one or more of the signatures distinguishes between mammalian (e.g., human) cell types. In some embodiments, at least two (e.g., at least 3, 4, 5, 6, 7, 8, 9, 10, 15, 20, or more) signatures distinguish between different immune cell types. In some embodiments, the signatures distinguish at least one of the following cell types from a second cell type (optionally the second cell type can also be selected from the following list): Hematopoietic stem cells, Neutrophils, CD4+ Naive T-cell, CD8+ Naive T-cell, CD4+ Central Memory T-cell, CD8+ Central Memory T-cell, CD4+ Effector Memory T-cell, CD8+ Effector Memory T-cell, Regulatory T-cells, natural killer cells, Naive B-cells, Memory B-cells, Plasma cells,
Precursor B-cells, Monocytes, Dendritic cells, Macrophages MO, Macrophages Ml, Macrophages M2, Eosinophils, or erythroblasts, or basophils. In some embodiments, the cell types comprise one or more (e.g., two or more) T helper cell types, for example, one or more of Thl, Th2 or Thl7 cells. In some embodiments, the tissue comprises stroma cells and at least two (e.g., 2, 3, 4, 5, 6, 7, 8, 9, 10 or more) cell types are selected from endothelial cells, fibroblasts, pericytes, smooth muscle cells, skeletal muscle cells, mast cells, adipocytes, mesenchymal stem cells, and epithelial cells. In some embodiments, at least two (e.g., 2, 3, 4, 5, 6, 7, 8, 9, 10 or more) cell types are selected from melanocytes, hepatocytes, astrocytes, mesangial cells, and keratinocytes.
[0070] In some aspects, one or more of the above-described steps can be performed by a computer system. For example, in some embodiments, sequence reads of the various loci can be received by the computer system. In some embodiments, the sequence reads can be aligned in the computer system with signatures that distinguish between two or more cell types. In some embodiments, the computer system will determine the number or proportion of reads that align to different signature sequences. In some embodiments, the identity of the sequence reads will be used by the computer system to provide the identity and proportion of cell type sin the sample. This can be achieved, for example, by the computer system applying linear algebra, for example as discussed above or elsewhere herein.
[0071] The above described methods can be used, for example, to relate proportions of cell types to phenotypes. For example, CD8+ is associated with response to immune checkpoint blockade therapy. In some embodiments, the methods allow for a deeper analysis of the response of an individual's tissue to therapy (including but not limited to immunotherapy).
Computer systems
[0072] FIG. 5 shows a block diagram of an example computer system 700 usable with system and methods according to embodiments of the present invention. The computer system 700 can be used to run the program code for various method claims according to embodiments of the present invention.
[0073] Any of the computer systems mentioned herein may utilize any suitable number of subsystems. Examples of such subsystems are shown in FIG. 5 in computer apparatus 700. In some embodiments, a computer system includes a single computer apparatus, where the subsystems can be the components of the computer apparatus. In other embodiments, a
computer system can include multiple computer apparatuses, each being a subsystem, with internal components.
[0074] The subsystems shown in FIG. 5 are interconnected via a system bus 775.
Additional subsystems such as a printer 774, keyboard 778, fixed disk 779, monitor 776, which is coupled to display adapter 782, and others are shown. Peripherals and input/output (I/O) devices, which couple to I/O controller 771 , can be connected to the computer system by any number of means known in the art, such as serial port 777. For example, serial port 777 or external interlace 781 can be used to connect computer system 700 to a wide area network such as the Internet, a mouse input device, or a scanner. The interconnection via system bus 775 allows the central processor 773 to communicate with each subsystem and to control the execution of instructions from system memory 772 or the fixed disk 779, as well as the exchange of information between subsystems. The system memory 772 and/or the fixed disk 779 may embody a computer readable medium. Any of the values mentioned herein can be output from one component to another component and can be output to the user.
[0075] A computer system can include a plurality of the same components or subsystems, e.g., connected together by external interface 781 or by an internal interface. In some embodiments, computer systems, subsystem, or apparatuses can communicate over a network. In such instances, one computer can be considered a client and another computer a server, where each can be part of a same computer system. A client and a server can each include multiple systems, subsystems, or components.
[0076] It should be understood that any of the embodiments of the present invention can be implemented in the form of control logic using hardware and/or using computer software in a modular or integrated manner. Based on the disclosure and teachings provided herein, a person of ordinary skill in the art will know and appreciate other ways and/or methods to implement embodiments of the present invention using hardware and a combination of hardware and software.
[0077] Any of the software components or functions described in this application may be implemented as software code to be executed by a processor using any suitable computer language such as, for example, Java, C++ or Perl using, for example, conventional or object- oriented techniques. The software code may be stored as a series of instructions or commands on a computer readable medium for storage and/or transmission, suitable media
include random access memory (RAM), a read only memory (ROM), a magnetic medium such as a hard-drive or a floppy disk, or an optical medium such as a compact disk (CD) or DVD (digital versatile disk), flash memory, and the like. The computer readable medium may be any combination of such storage or transmission devices. [0078] Such programs may also be encoded and transmitted using carrier signals adapted for transmission via wired, optical, and/or wireless networks conforming to a variety of protocols, including the Internet. As such, a computer readable medium according to an embodiment of the present invention may be created using a data signal encoded with such programs. Computer readable media encoded with the program code may be packaged with a compatible device or provided separately from other devices (e.g., via Internet download). Any such computer readable medium may reside on or within a single computer program product (e.g. a hard drive, a CD, or an entire computer system), and may be present on or within different computer program products within a system or network. A computer system may include a monitor, printer, or other suitable display for providing any of the results mentioned herein to a user.
[0079] Any of the methods described herein may be totally or partially performed with a computer system including a processor, which can be configured to perform the steps. Thus, embodiments can be directed to computer systems configured to perform the steps of any of the methods described herein, potentially with different components performing a respective steps or a respective group of steps. Although presented as numbered steps, steps of methods herein can be performed at a same time or in a different order. Additionally, portions of these steps may be used with portions of other steps from other methods. Also, all or portions of a step may be optional. Additionally, any of the steps of any of the methods can be performed with modules, circuits, or other means for performing these steps.
EXAMPLES
[0080] The following examples are provided in order to better enable one of ordinary skill in the art to make and use the disclosed methods, and are not intended to limit the scope of the invention in any way.
Example 1, In silicp analysis u?ing >2300 ggntfiy lpci
[0081] Using publicly available whole genome bisulfite sequencing (WGBS) data from the Blueprint Epigenomics project, DNA methylation profiles of 21 types of immune cell subsets
(list in Table 1) were assembled. Based on these profiles genetic loci were determined that have at least three CpG sequences within a sequence read (in this example, within 200 bp) and for which all CpGs in the locus were either stably methylated or were unmethylated. For each of the 21 cell types we identified 50 genetic loci that distinguish one cell type from at least one other of the other 20 cell types, i.e., one has high methylation and the other low methylation. Genetic loci that were chosen were short regions that can be sequenced fully in one read, preferably with at least 3 CpGs. To be selected for further study, the methylation levels of all CpGs in the genetic locus must distinguish one cell type from another, and be stable, methylated or unmethylated, in all other cell types. In many cases, one genetic loci can distinguish between one cell type and several others. For example, a first cell type will be stably methylated whereas at least two (e.g., a second and a third cell type) other cell types will be stably unmethylated, thereby allowing one to distinguish the first cell type from the second cell type based on methylation at that genetic locus.
[0082] Stability for a CpG site in this analysis was defined using the following formula:

Full methylation or unmethylation in all cell types will result in Stability=0.
[0083] Selection of genetic loci began by defining thresholds for the required methylation difference between cell types (starting with 95% difference) and stability threshold (starting with < 0.01), calculated as the difference of the determined methylation from fully methylated or fully unmethylated. We then gradually lowered these thresholds to allow more genetic loci to be included until we had the target number of loci per cell type pairs. In this analysis, we included 50 genetic loci for each pair of cell types.
[0084] As noted above, one genetic loci can distinguish between one cell type and several others. Therefore, the number of chosen genetic loci in this analysis is not 50 times all pairs (10,500 in this case), but only 2,377 genetic loci. [0085] The average length of these genetic loci was 57.0 ± 27.2bp and contains 4.4 ± 1.7 CpGs. 85.1% of the genetic loci have methylation level > 80% (78.0% with methylation > 90%), and 13.3% have a methylation level<20% (5.3% with methylation < 10%). Without intending to limit the scope of the present disclosure, we assume that most of
this divergence from full methyl a tion or unmethylation is due to noise and non-perfect purification of the cell types. Thus, in the reference set, A, which is a matrix of 2,377 rows for each genetic locus and 21 columns for each cell types, the cell A(ij) is 1 if genetic loci /' is called as "methylated" in cell type j, and 0 otherwise. [0086] Using the methylation levels of each of the CpGs in a genetic locus (not the rounded 0 or 1 as in the reference set, but the exact methylation level - a continuous number between 0 and 1) we create 1000 in-silico (computationally-generated) reads for each of the cell types based on the methylation level of each CpG in the genetic loci. This procedure simulates the methylation reads expected by sequencing the genetic loci in each of the cell types. For example, for each cell type we knew that methylation was a certain level (e.g., 90%, 85%, 95%). Thus, for each cell type we created a matrix size of 1000, with 0 or 1 in the cells. The average of the columns corresponds with the methylation of the particular cell type (90%, 85%, 95% in the example of three provided above). We ran this procedure for each of the cell types. [0087] We chose a random abundance of each of the cell types. Together the sum of all the proportions was 100%. Based on the proportion of each cell type we randomly chose reads from the in-silico cell types-reads pool - for example, if cell type X has an abundance of 10%, we randomly chose 100 reads. We thus generated 1000 in-silico reads for each of the genetic loci according to the random abundance of cell types. To add more stochastic noise to the system, we randomly removed up to half of the reads in each genetic loci.
[0088] Each read is called "0" or "1" based on the majority of methylation sites. Thus, the output of this procedure was a vector, b, of 2,377 cells with a continuous number between 0 and 1 that represents the percentage of methylated reads in each genetic loci.
[0089] Thus we generated a set of multiple linear equations in the format of Ax^b.


[0090] Using constrained linear least square analysis we determined x - the hidden proportions that compose vector b.
[0091] Results: Pearson correlation - 0.92SS, RMSE: 0.0098

Running 100 different proportions:
Average error: 0.0103 (1% error rate)
Root mean square error between x and the hidden proportions: 0.0133
Pearson correlation between x and the hidden proportions: 0.9072
[0092] We also ran this analysis by choosing 3 cell types to constitute 50% of the mixture, and all the rest to constitute the other half. The same error rates were found.
[0093] It should be pointed out that in such an analysis the 'rounding' of the methylation calls in the reference set to 0 and 1 decreases the accuracy of the results. Using the 'exact' methylation from reads can improve the results, however, this was not done in the computational example above because doing so would have removed the bias that is created by the circular use of data to create both the reference set and the computationally-generated reads from the same source.
Example 2. Analysis of peripheral blood mononuclear cells
[0094] We downloaded whole genome bisulfite sequencing data from a peripheral blood mononuclear cells (PBMC) sample (LI et al. PLoSBio 2010). We performed the exact method explained above, but here we used a subset of the reference set described above, with 401 genetic loci that only distinguish between different major subsets of PBMC. Thus, genetic loci that are identical between these 6 cell types were omitted. We also removed genetic loci that distinguish between different types of CD4+, CD8+ and B-cells. The results as well as the expected proportions are shown below in Table 2.
Table 2

Example 3. Analysis of CD4+ T-cells from different individuals
[0095] We downloaded whole genome bisulfite sequencing data from CD4+ T-cells samples from two individuals - a newborn and a centenarian (Heyn et al. Proc. Natl Acad. Sci USA 109(26) (2012)). A reduced reference set of 306 genetic loci that distinguish
between different types of CD4+ T-cells were used (only genetic loci that distinguish between CD4+ cell types). Our analysis shows that the CD4+ composition significantly differed between newborns and centenarians. The majority of CD4+ cells in newborns are naive T-cells, while in centenarians most of the CD4+ T-cells are memory and regulatory cells, as expected.
Table 3

Example 4. Analysis of B-cell sample
[0096] We downloaded whole genome bisulfite sequencing data from a normal 4yr healthy B-cells sample (Heyn et al. Epigenetics 7(6):542-50 (2012)). Using the full reference set described above, we predicted 65.45% to be naive B-cells and 34.55% to be memory B-cells. No other cells were found in the mixture. This result is again as expected.
Example 5. Analysis of CD14+ monocytes
[0097] We downloaded whole genome bisulfite sequencing data for a CD 14+ monocytes sample from the Roadmap Epigenomics project (Kundaje et al. Nature 518:317-330 (2015)). The method predicted that 100% of the cells are monocytes.
[0098] All the predictions presented in Example 1 through Example 5 are based on whole genome bisulfite sequencing, where the read depth is low (~10x). We also do not have access to the actual reads, but only to the processed whole genome bisulfite sequencing data which only contains the methylation level of the CpGs. Therefore, the mcthylation level of the genetic loci was inferred from the percent of methylation of each individual CpG site (combined together in each genetic loci), instead of from the actual reads which would have allowed much higher sensitivity to distinguish between cell types. We anticipate that targeted bisulfite sequencing will allow for increased read depth to lOOOx or more and by analyzing the reads directly, the accuracy and sensitivity of these analyses will be significantly
improved, and will allow estimating the proportions of cell types that are at very low abundance.
[0099] The table of FIG. 6 shows the genomic coordinates for the 2,377 genetic loci (in Human Genome version 19 (hgl9) coordinates) described in the Example 1 - Example 5. Because of size constraints, the values in the table below can wrap around to the location directly below. For example, the starting location for the first entry in chromosome 1 is at position 138063 and the ¾SC" methylation score for that position is 0.97383. The 4th column is the number of CpGs in each genetic loci. In the analyses here each cell is rounded to 0 or 1 (>50% is 1 ) and lines with NA values are omitted. In some embodiments, the methods disclosed herein use 10, 20, 30, 40, 50, 60, 70, 80, 90, 100, or more than 100 of the genetic loci listed in FIG. 6. It should be noted that the methods described herein are not limited to the loci listed in FIG. 6 and are only provided by way of example.
Example 6. In silico analysis using >9200 genetic loci
[0100] The cellular composition of tumors is now recognized as an essential phenotype, with implications to diagnostic, progression and therapy efficacy. A tool for accurate profiling of the tumor microenvironment is lacking, as single-cell methods and computational approaches are not applicable or suffer from low accuracy. Here we present EpiSort, a novel strategy based on targeted bisulfite sequencing, which allows the accurate enumeration of 23 cell types and may be applicable to cancer studies. [0101] Recent years have seen a tremendous advancement in technologies that enable the investigation of cellular heterogeneity and composition of mixed tissues. While newer methods have been developed for single-cell profiling after tissue dissection, innovative computational deconvolution techniques have also been created that enable digital dissection of bulk tissues. The need for such technologies is now indisputable, and a growing body of evidence shows the importance of the cellular heterogeneity in diagnosis, prognosis, treatment efficacy, and for the development of novel treatment strategies in an array of common and complex diseases. (Klemm, F. & Joyce, J. A., Trends Cell Biol, 25, 198-213 (2015)) In the study of cancer, more and more evidence shows that the complex milieu of the tumor microenvironment is playing a major role in both promoting and inhibiting the tumor's growth, to invasion and to metastasize. (Hanahan, D. & Coussens, L. M, Cancer Cell, 21, 309-322 (2012)) It is thus clear that accurate portrayal of the cellular composition of the
tumor is an important phenotype crucial for improving existing treatments, for the discovery of predictive biomarkers, and for the development of novel therapeutic strategies.
[0102] While cellular composition can be profiled using single-cell technologies such as flow cytometry, it is a far more challenging task in solid tissues. Dissociation of solid tissues leads to destruction of the niche environment, thereby affecting cellular state and integrity. It is thus unclear if the relative proportion of cell types is maintained following the dissociation step. Another disadvantage of single-cell methods is the need to perform the analysis on fresh tissues, which requires a supporting operational system and may not be suitable for use in clinical settings. The emerging use of single-cell RNA sequencing may offer novel insights regarding internal cellular states, but for profiling the cellular composition it does not provide a suitable solution.
[0103] On the other hand, computational deconvolution techniques employ genomic profiling of the bulk tissue, and thus, in theory, can more reliably detect the actual, non- harmed, tissue composition. (Newman, A. M. & Alizadeh, A. A., Curr. Opin. Immunol., 41, 77-84 (2016)) However, the accuracy of these methods is questionable, specifically in tumors. Gene expression profiles are highly variable, and the large dynamic range is highly susceptible to batch effects and cell state changes that make it an impossible task to accurately predict the abundance of cell types.
[0104] Another genomic profiling measurement used for deconvolution is DNA methylation. (Accomando, W. P. et al., Genome Biol., 15, R50 (2014)) DNA methylation, like gene expression, is cell type specific, (Baron, U. et al., Epigenetics, 1, 55-60 (2006)) however its scales are fractions and its association with the mixture's composition is linear, and not continuous as in gene expression, making it a more potent measurement for portraying the tissue composition. A number of methods have employed DNA methylation arrays to predict the composition of handful of immune subsets. (Accomando, W. P. et al., Genome Biol., 15, R50 (2014); Houseman, E. A. et al., BMC Bioinformatics, 13, 86 (2012); Heiss, J. A. et al., Epigenomics, 9, 13-20 (2017)) However, only major immune subsets can be assessed since the limited breadth of methylation arrays is incapable of distinguishing closely related cell types. In addition, the accuracy of these methods is yet insufficient, predominantly due to the inability of individual CpGs to distinguish between stochastic and real bimodal epipolymorphism (FIG. 1A). (Landan, G. et al., Nat. Genet., 44, 1207-14 (2012)) Accurate bisection of genomic locus to epistates is possible with bisulfite
sequencing, and could therefore allow for reliable deconvolution of mixtures. Accordingly, whole genome bisulfite sequencing (WGBS) has been used for purity estimations of tumors,( Zheng, X. et al., Genome Biol., 15, 419 (2014)) however, it cannot be used for identifying cell types with low abundance due to the low read depth and its high cost. [0105] Here we present EpiSort, a novel method to accurately enumerate 23 cell types in mixed tissues, using massive deep bisulfite sequencing of targeted loci specifically chosen to (uscriminate between cell types (FIG. IB). EpiSort targets cell types specific loci with multiple CpGs that allow a clear distinction of epistates. To identify these loci, we collected 60 WGBS samples, corresponding to 21 immune cell types from the Blueprint epignome project (Blueprint Epigenome - Welcome to the Blueprint project at http://www.blueprint- epigenome.eu/) and two WGBS representing fibroblasts (IMR90) (Lister, R. et al., Nature, 462, 315-322 (2009)) and endothelial cells (HMEC) (Hon, G. C. et al., Genome Res., 22, 246-258 (2012)), totaling 23 cell types (Table 4). Using the methylation fraction per CpG, we then scanned the genome (in Human Genome version 38 (GRCh38) coordinates) to detect informative loci that will allow discriminating between cell types. Our search yielded 9,291 uniform differentially methylated regions (UDMRs) (Table 5). We first tested our UDMRs capability to predict cell types composition in simulated in silico mixtures. We performed simulations by generating a pool of in silico bisulfite reads based on the underlying mixture of the cell types, and randomly choosing 200 reads from the pool per region. Our analyses showed highly accurate inferences of underlying abundances, differentiating closely related cell types, and the capacity to identify extremely low abundant cell types (FIG. 1C).
[0106] In some embodiments, the methods disclosed herein use 10, 20, 30, 40, 50, 60, 70, 80, 90, 100, or more than 100 of the genetic loci listed in Table 5. It should be noted that the methods described herein are not limited to the loci listed in Table 5 and are only provided by way of example.


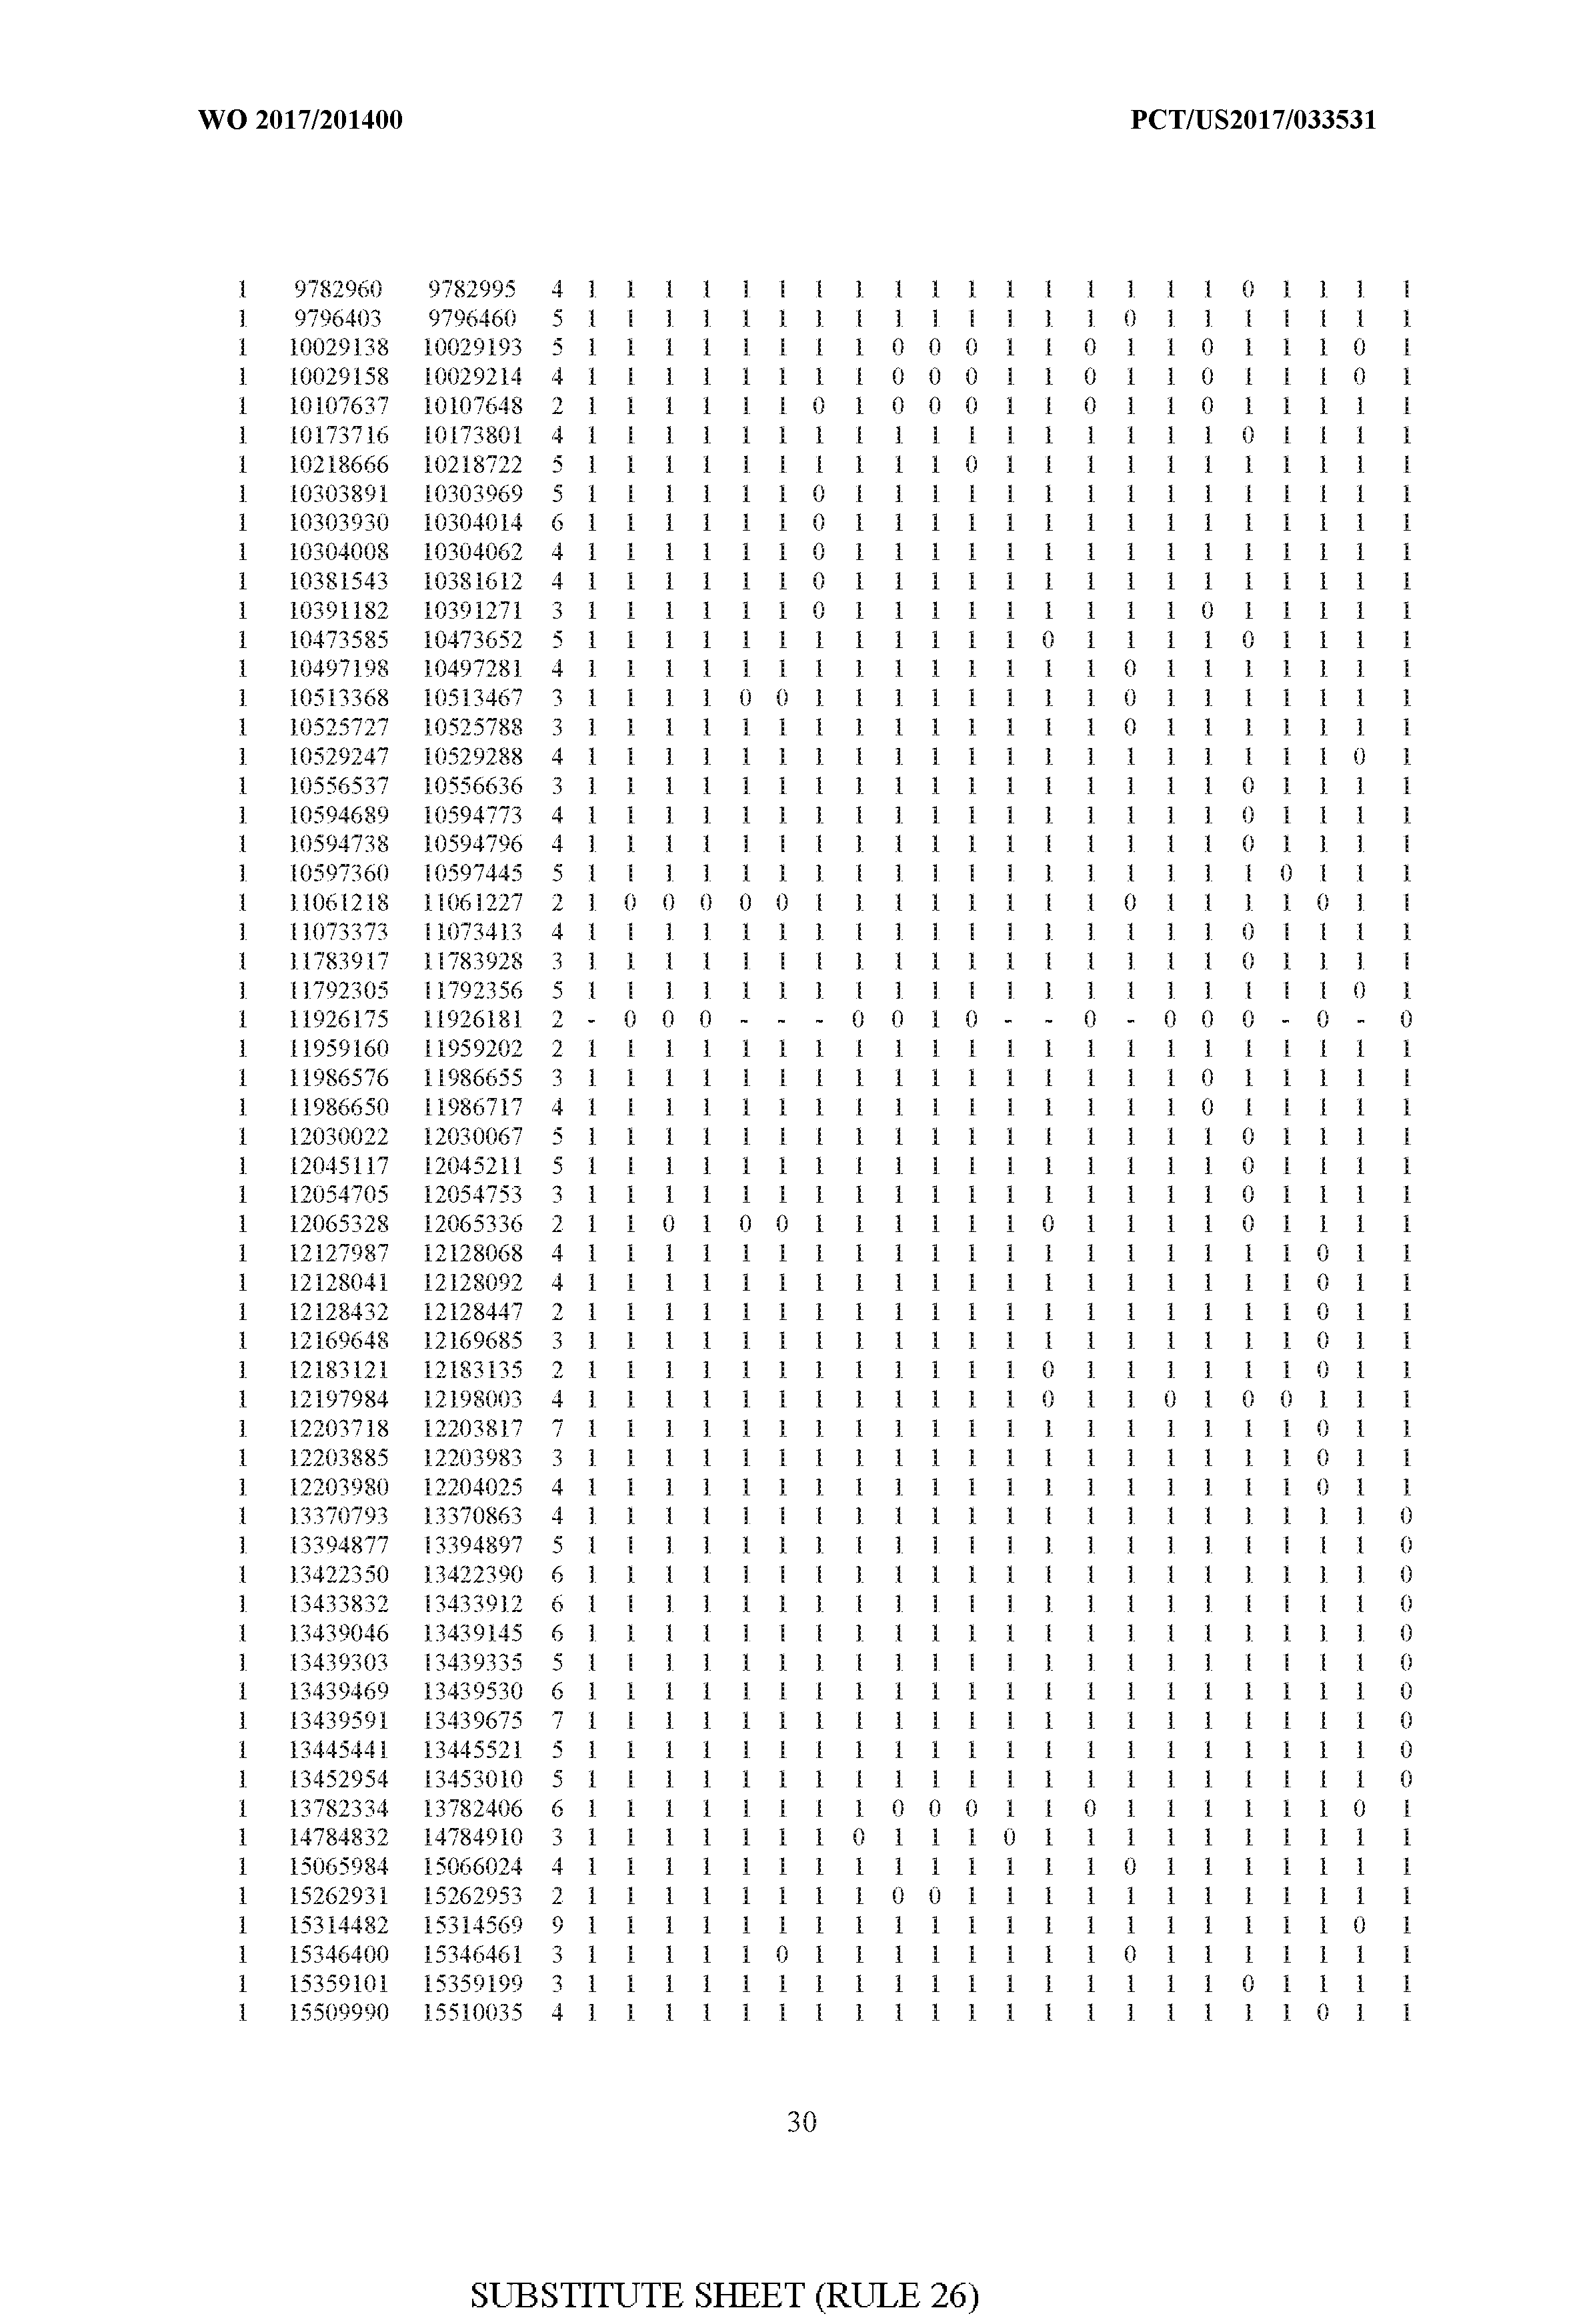


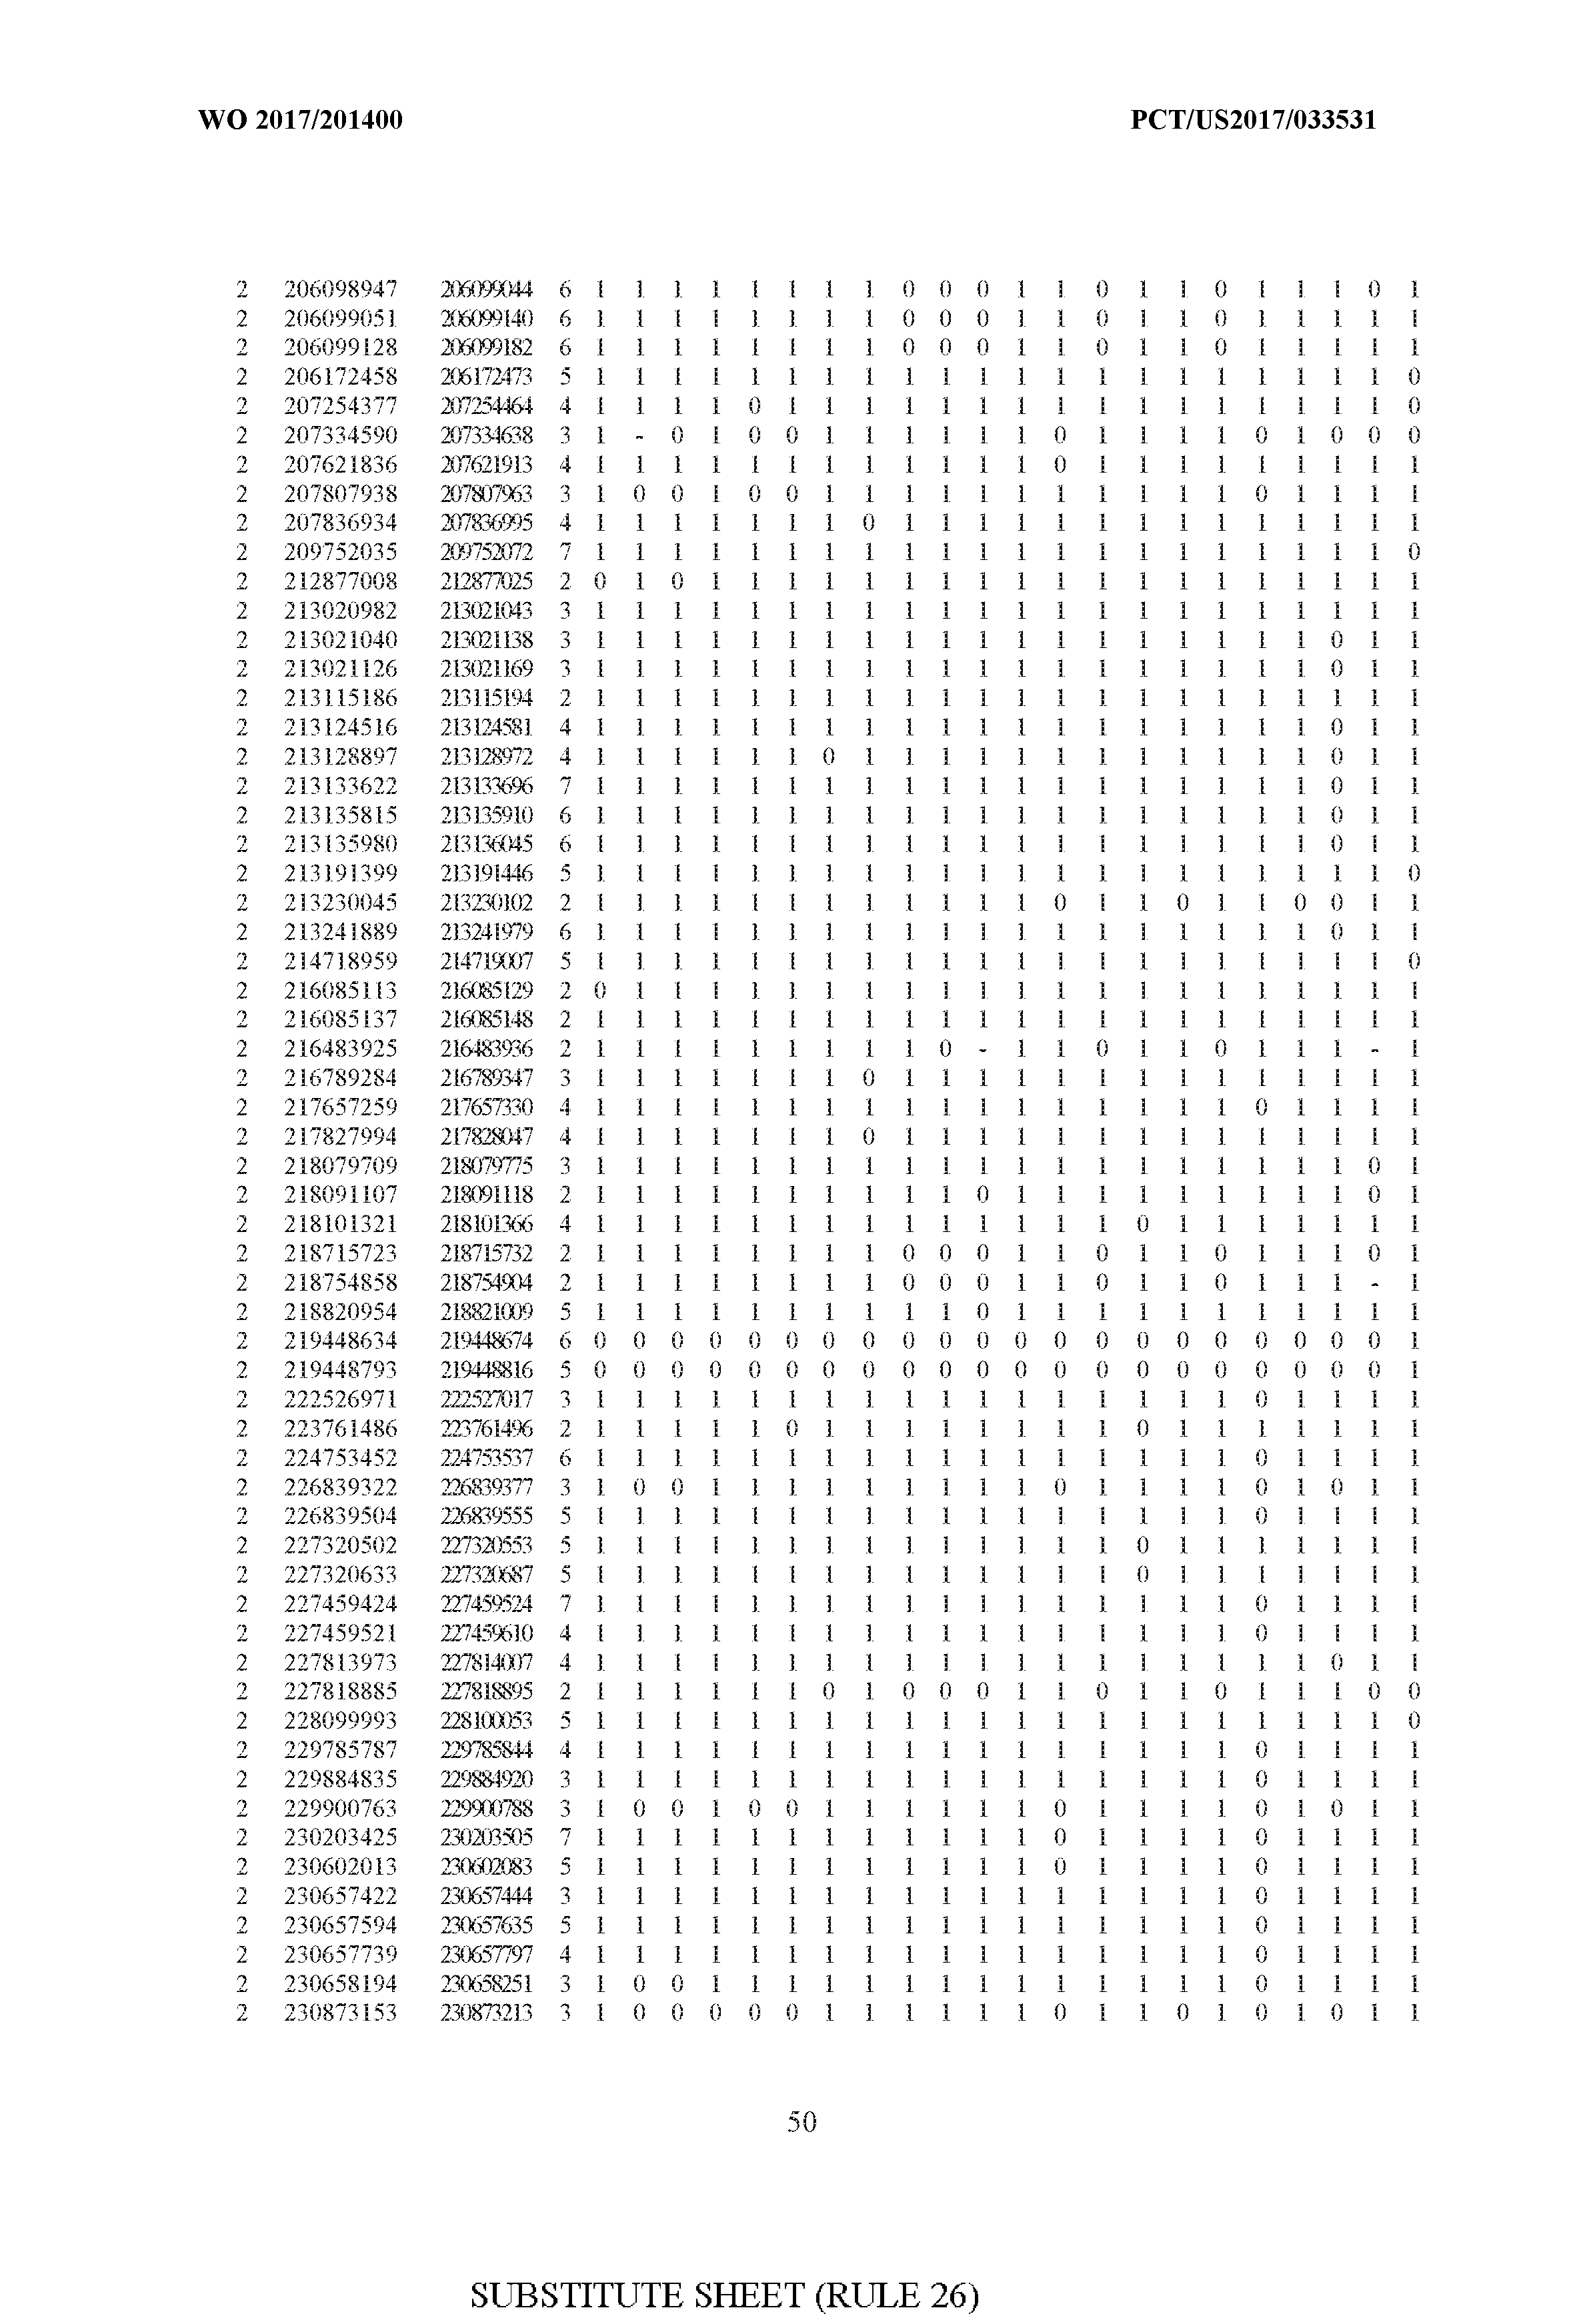

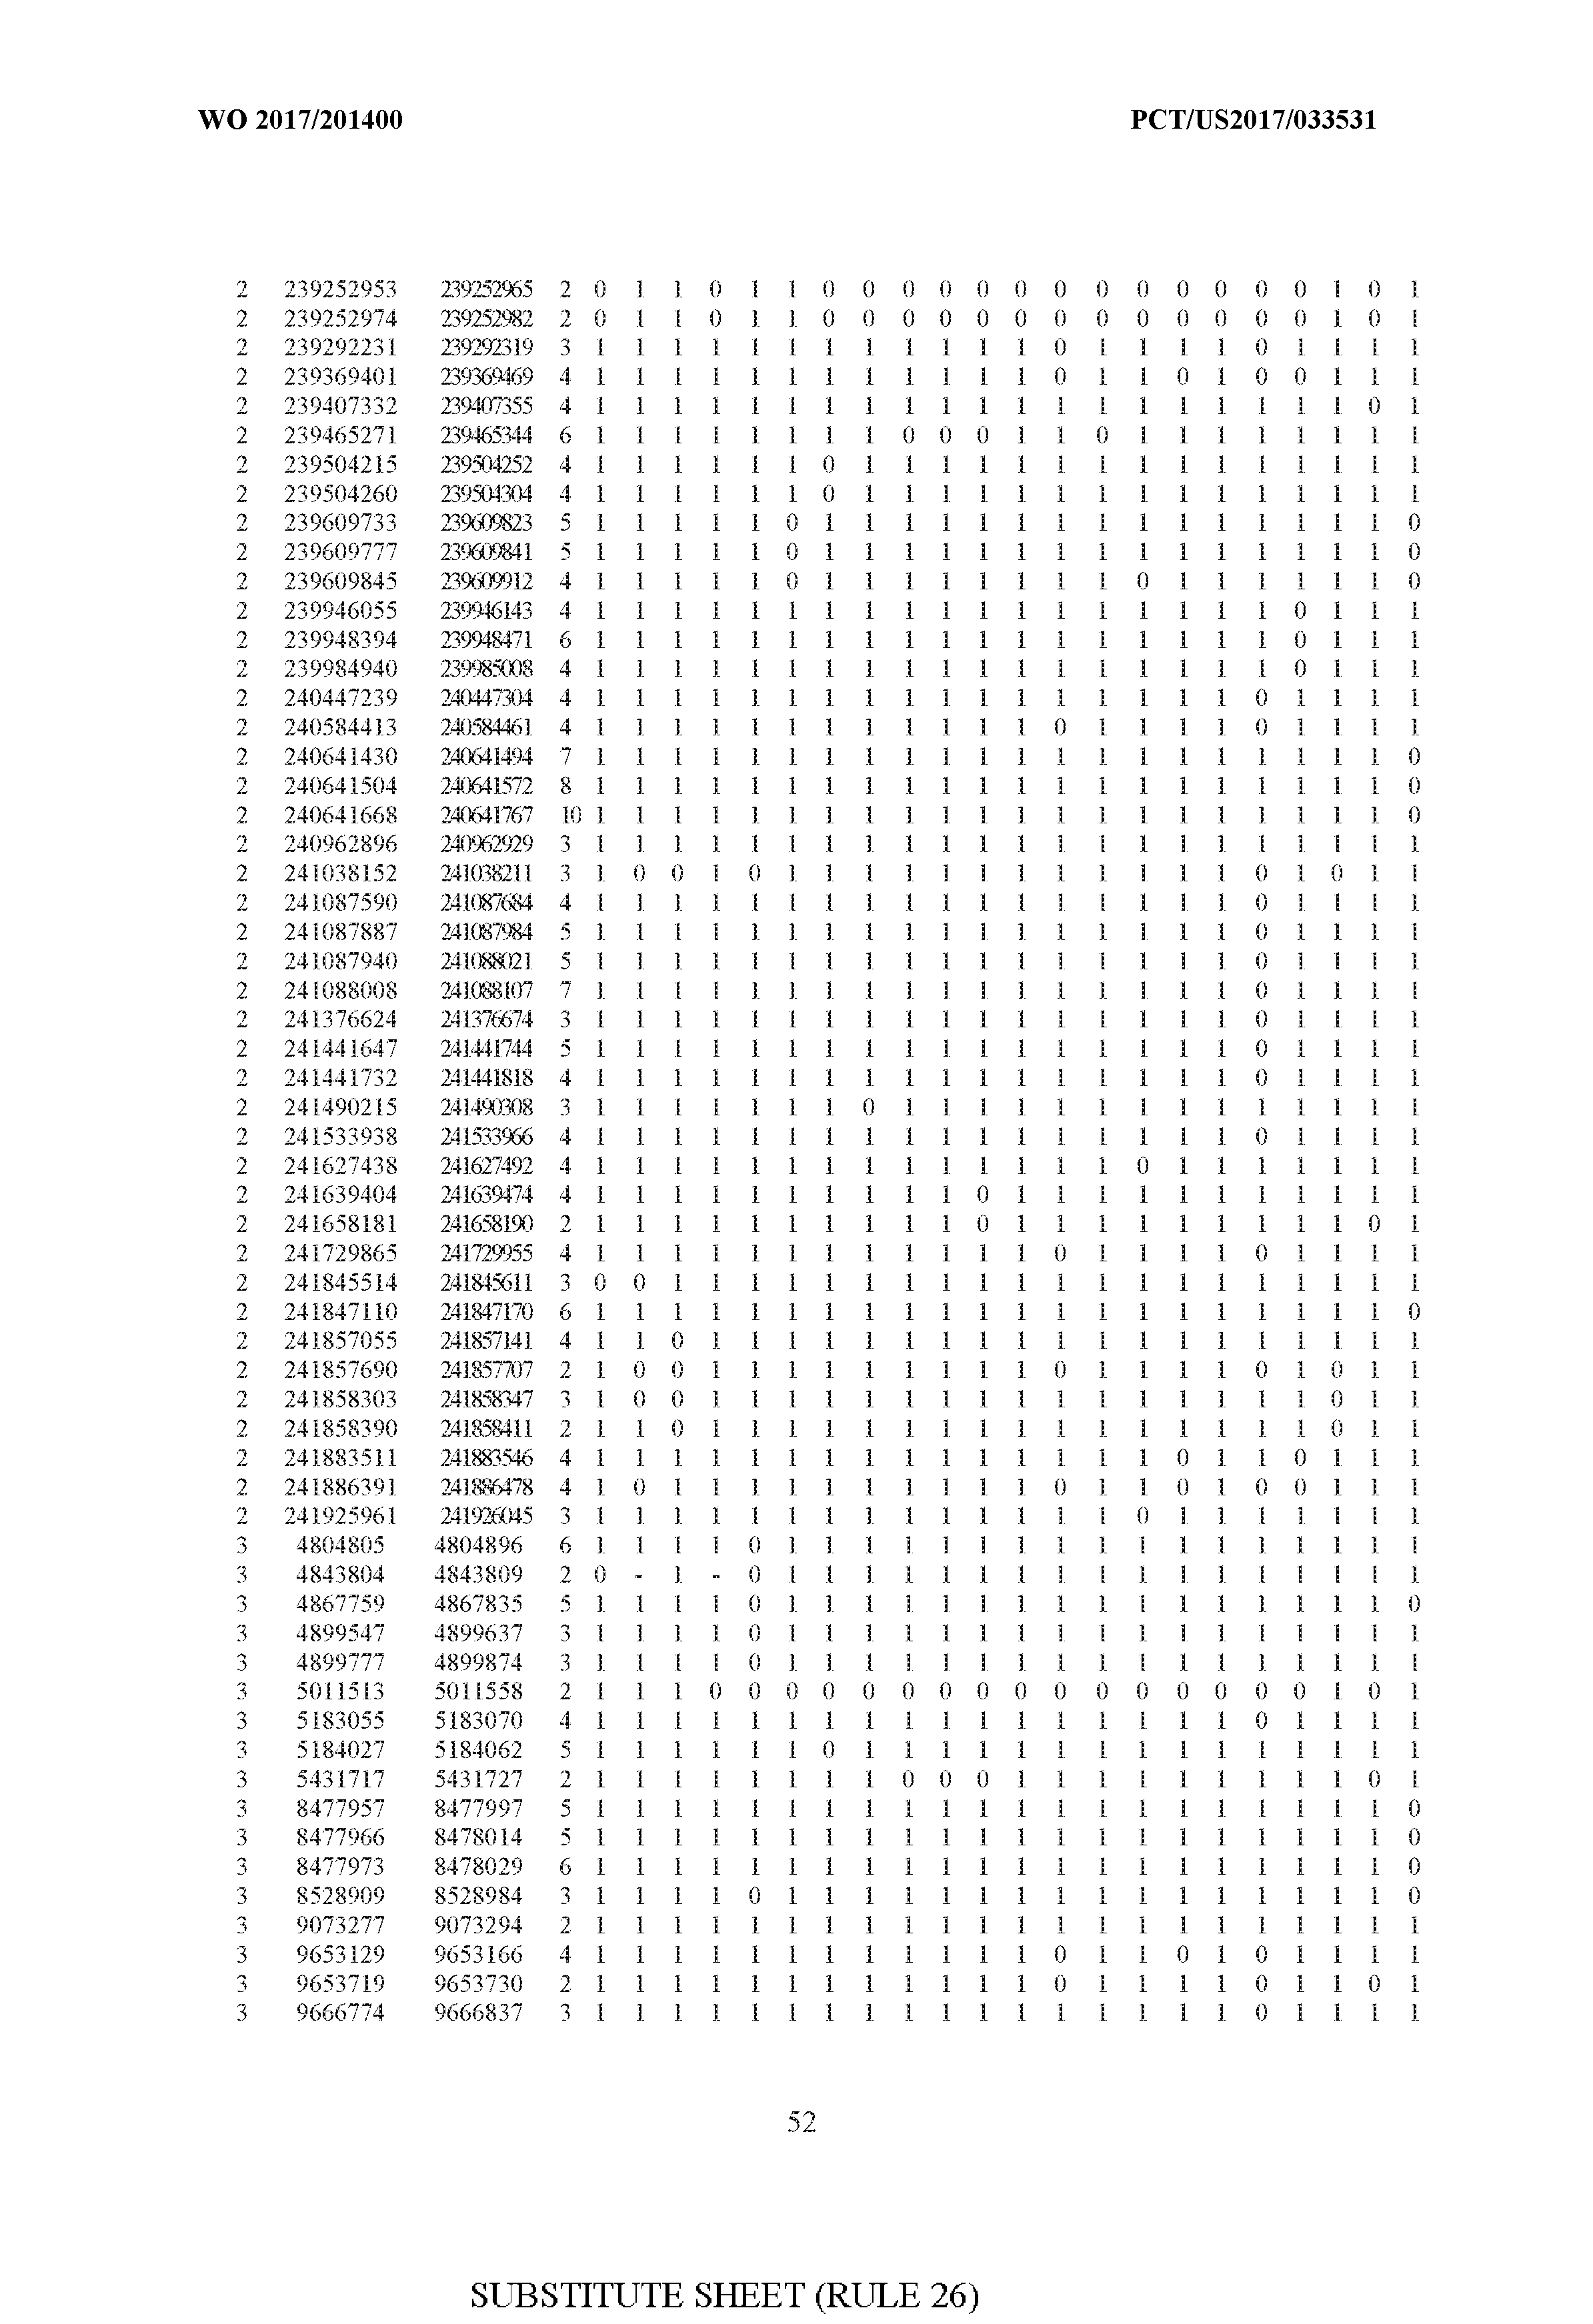


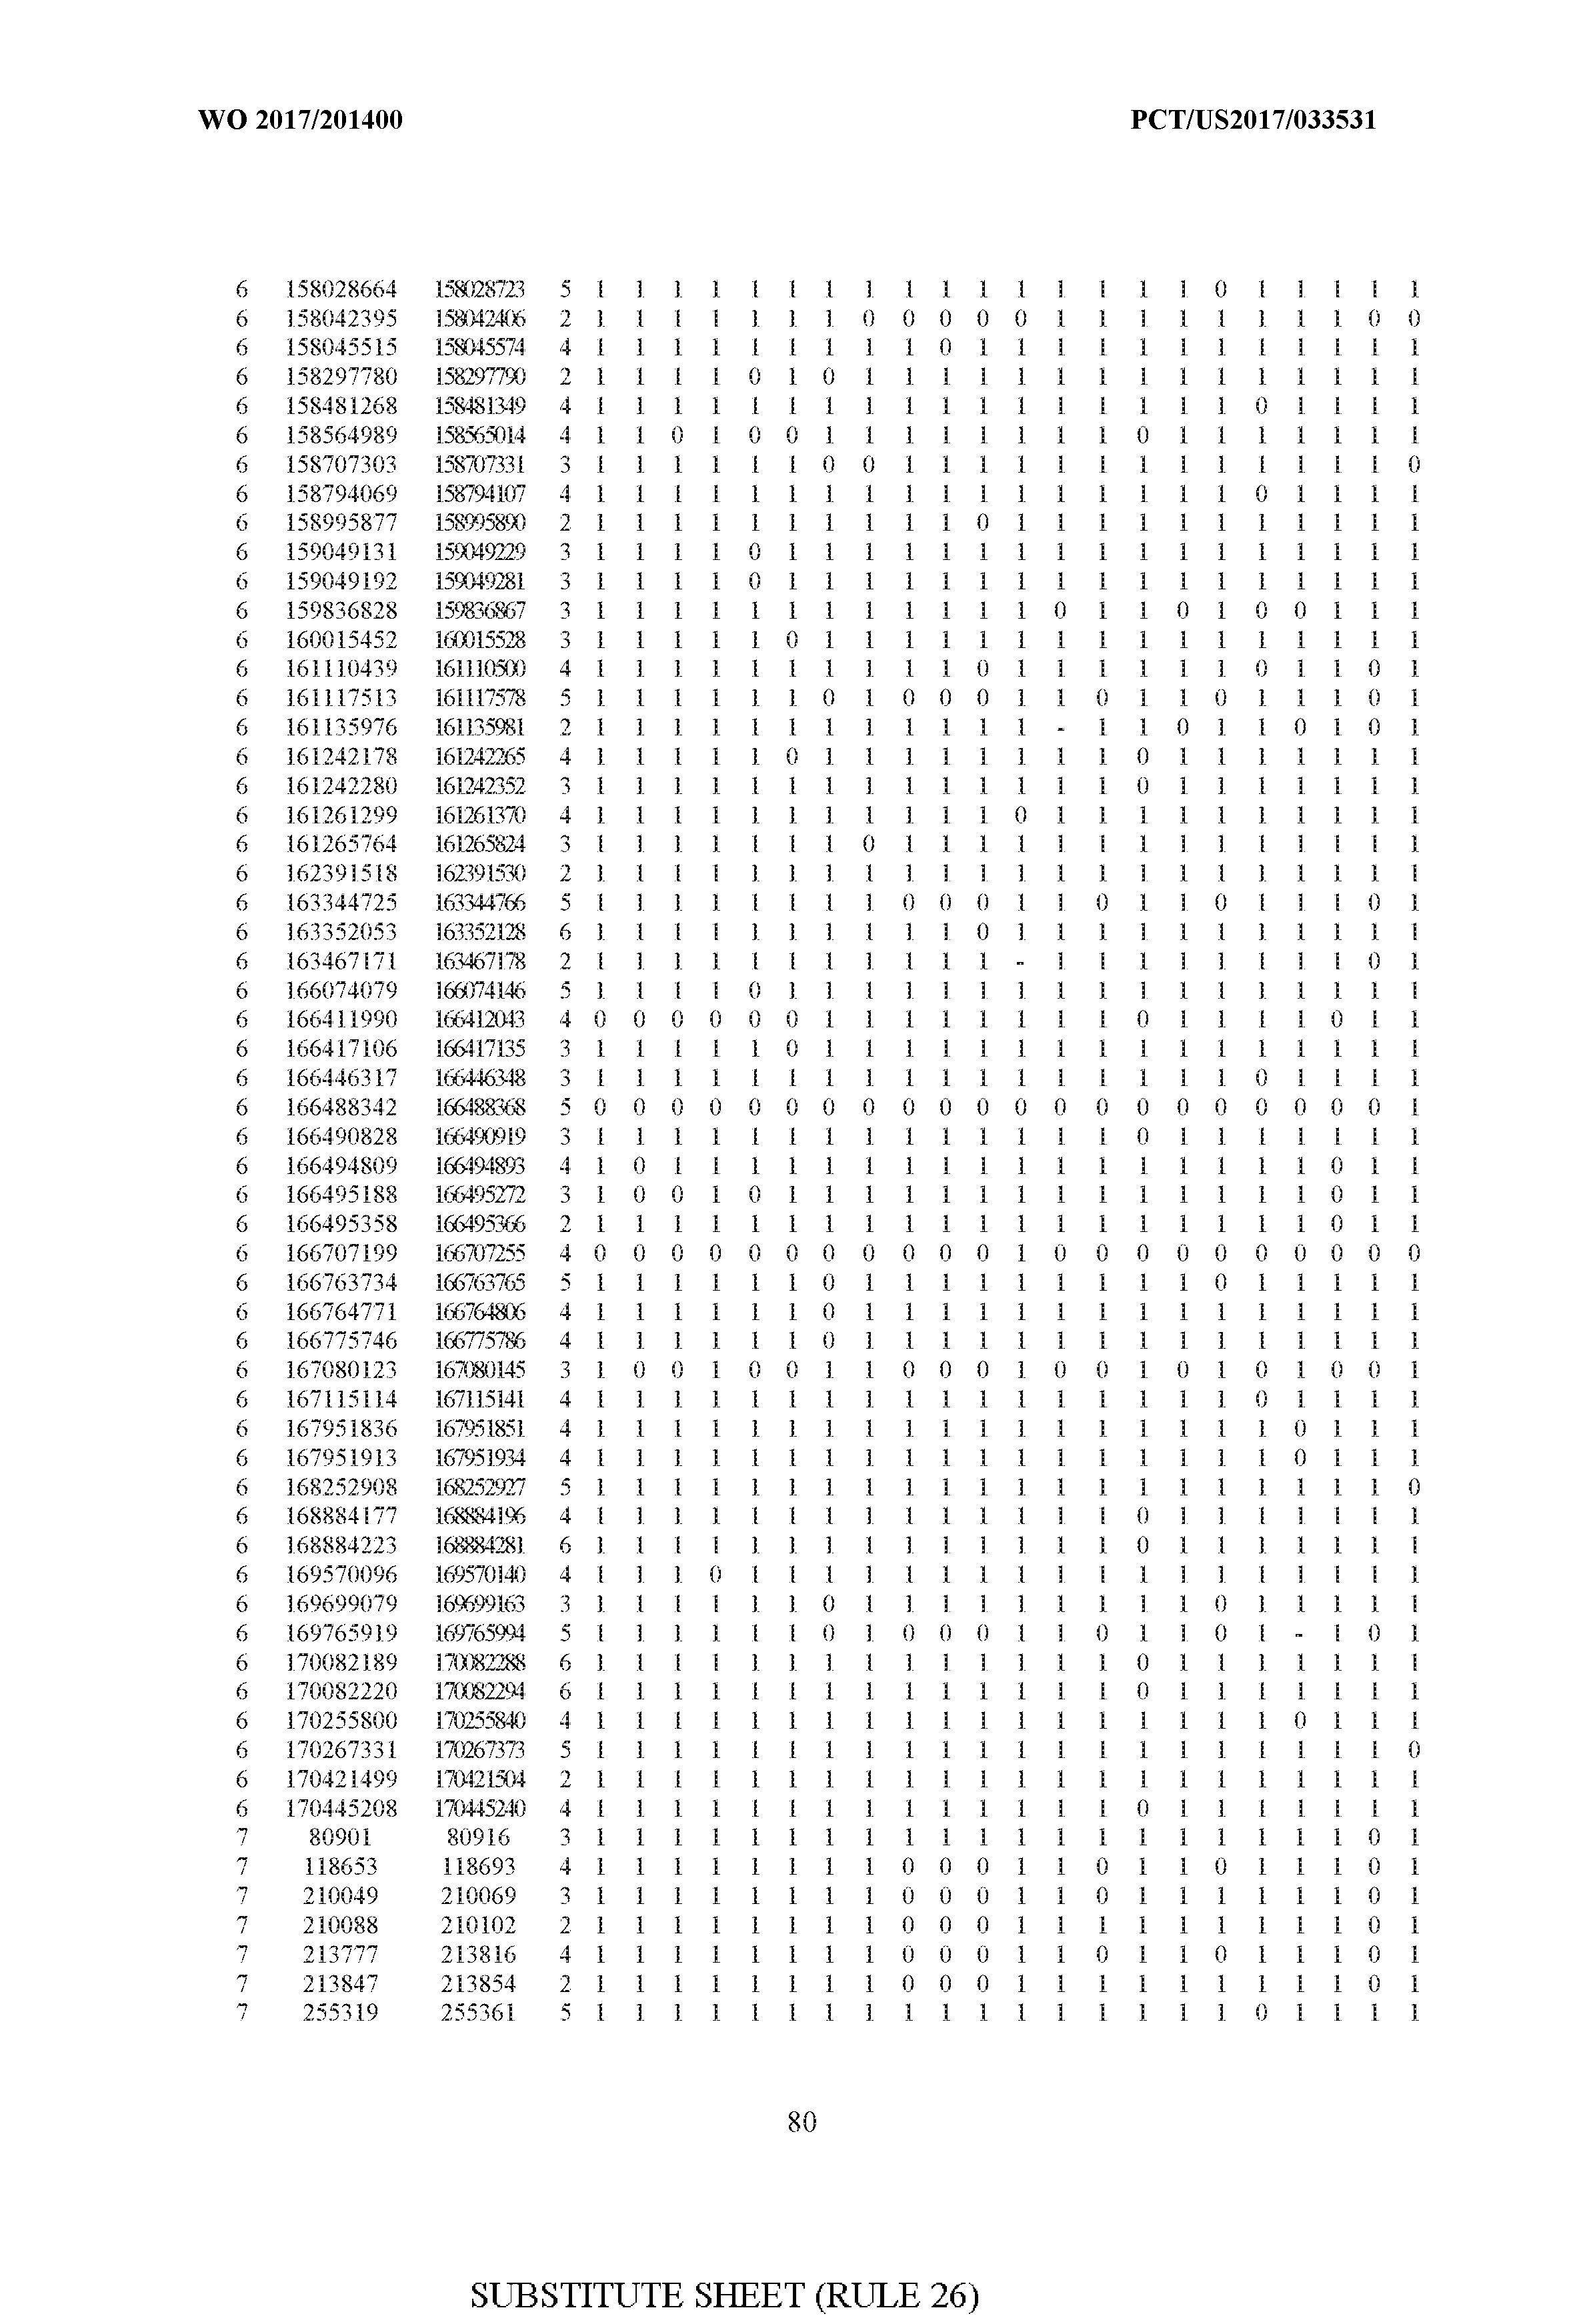


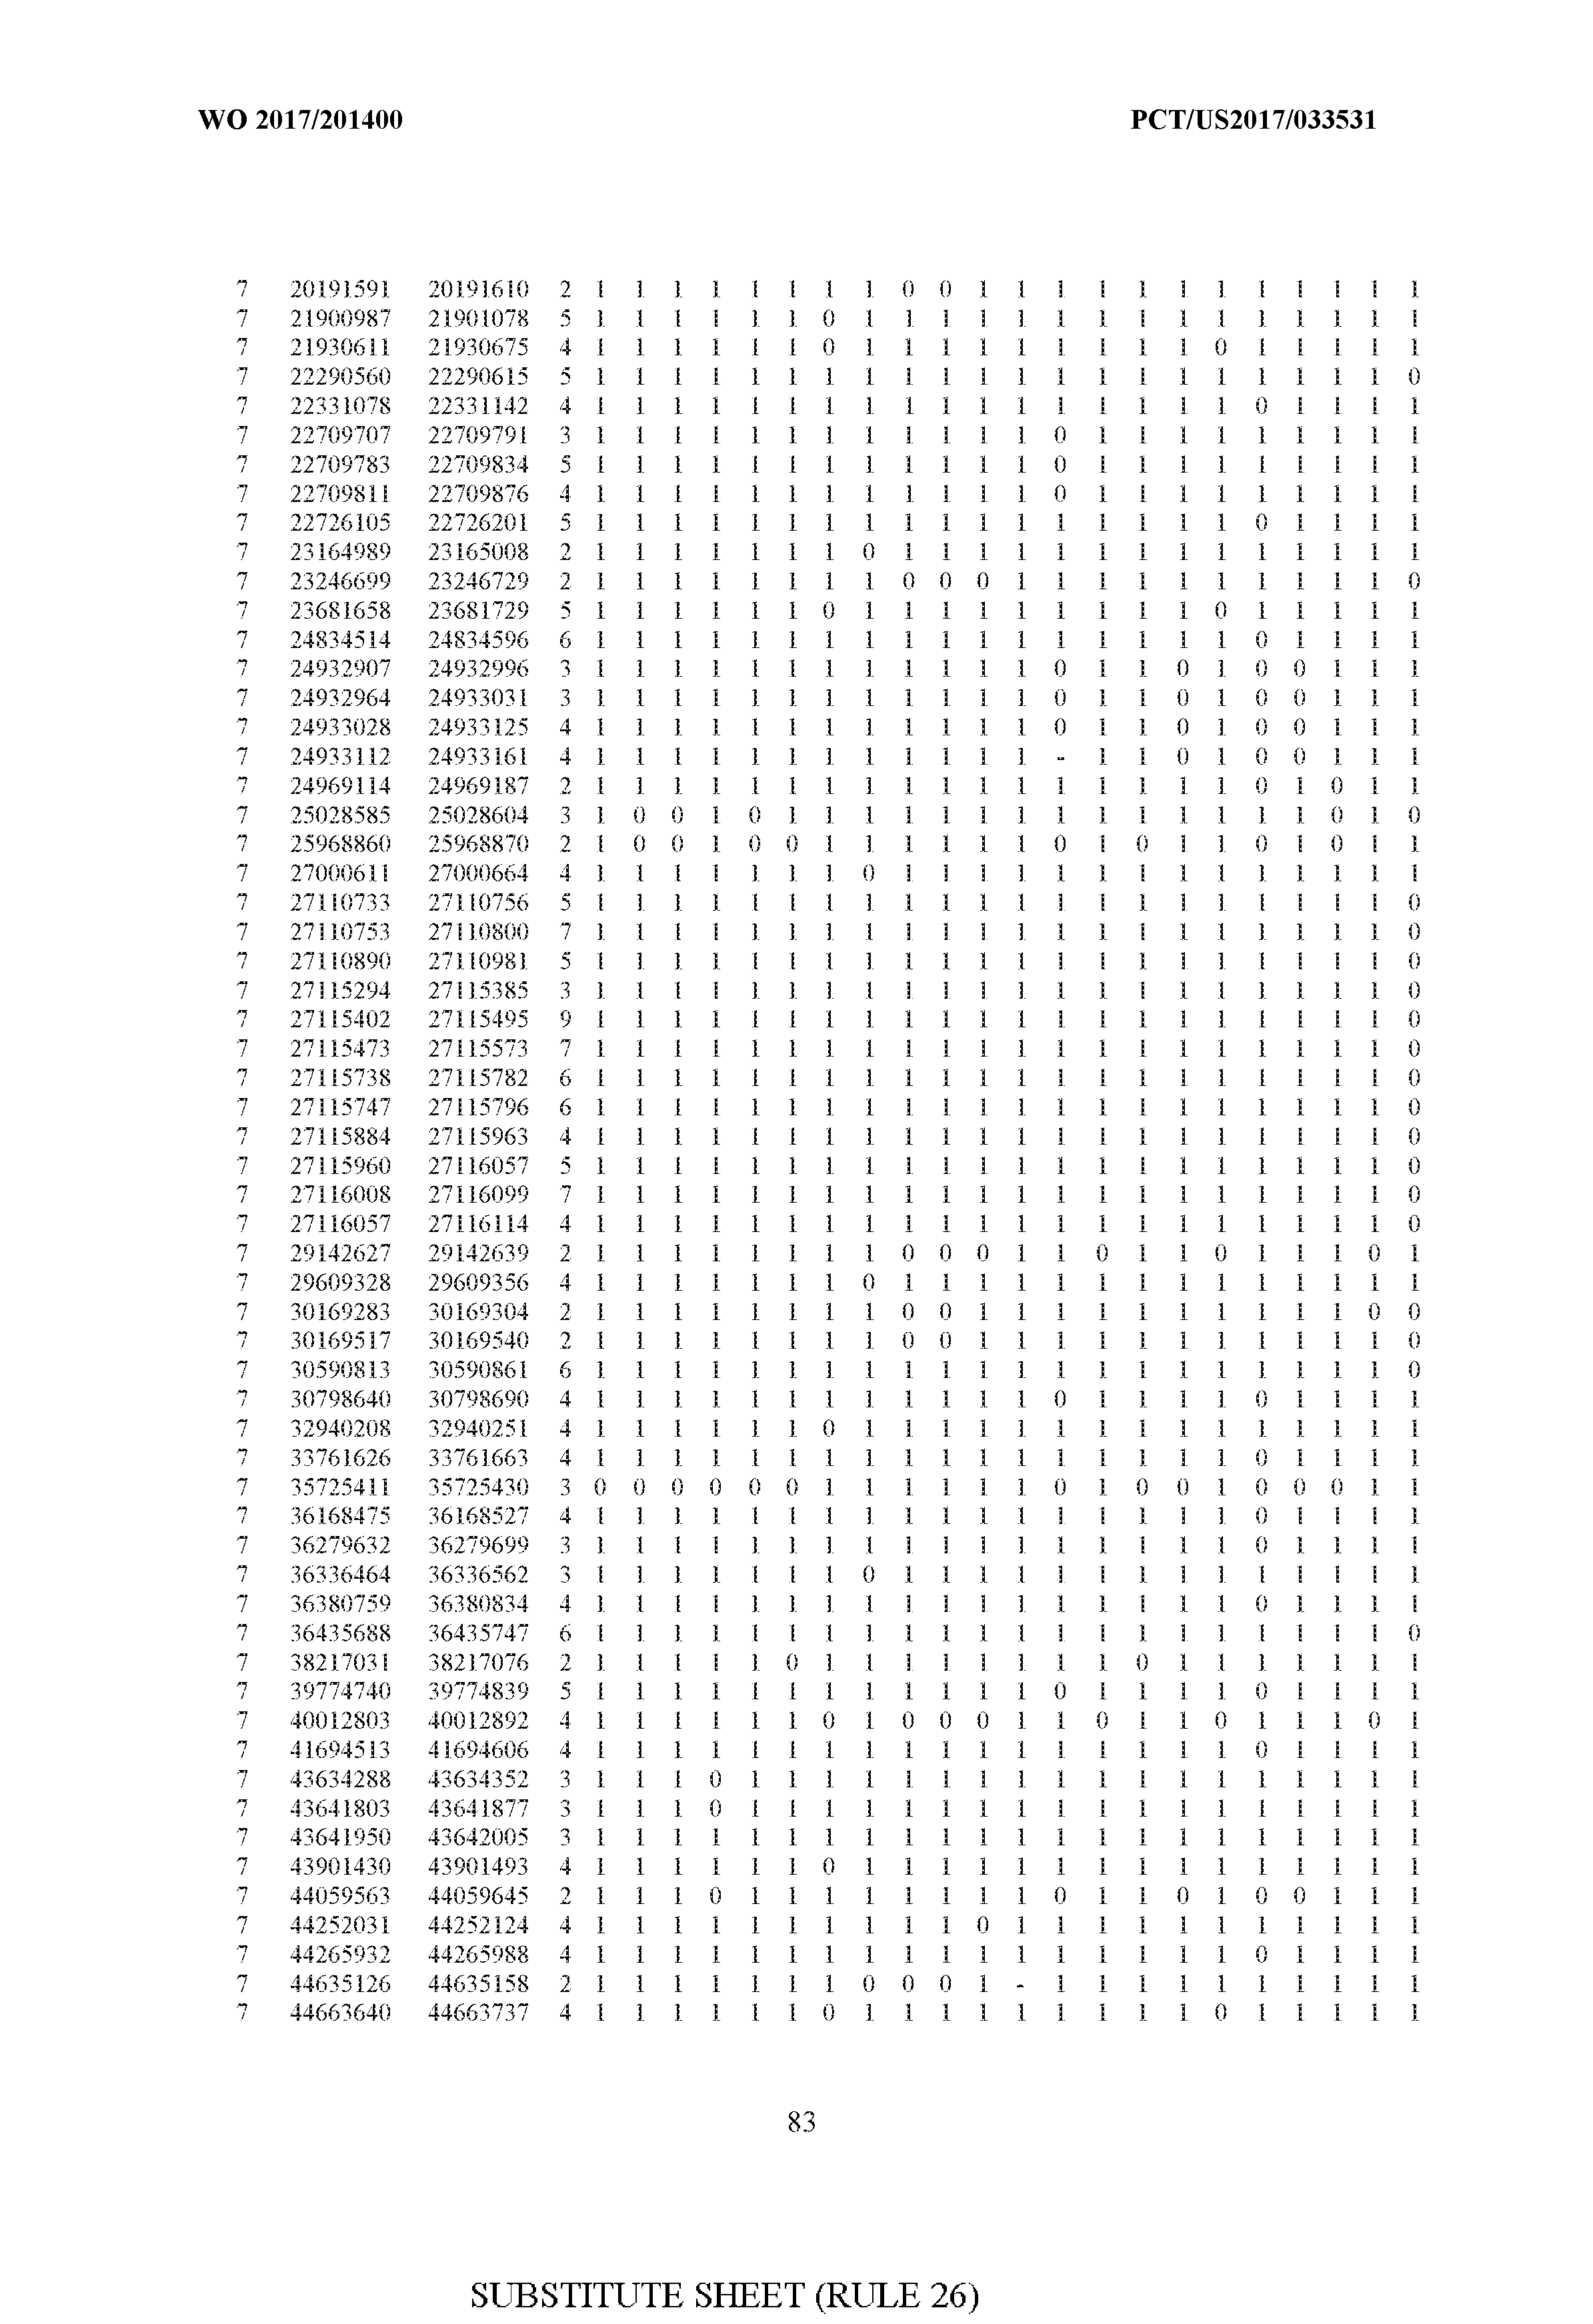


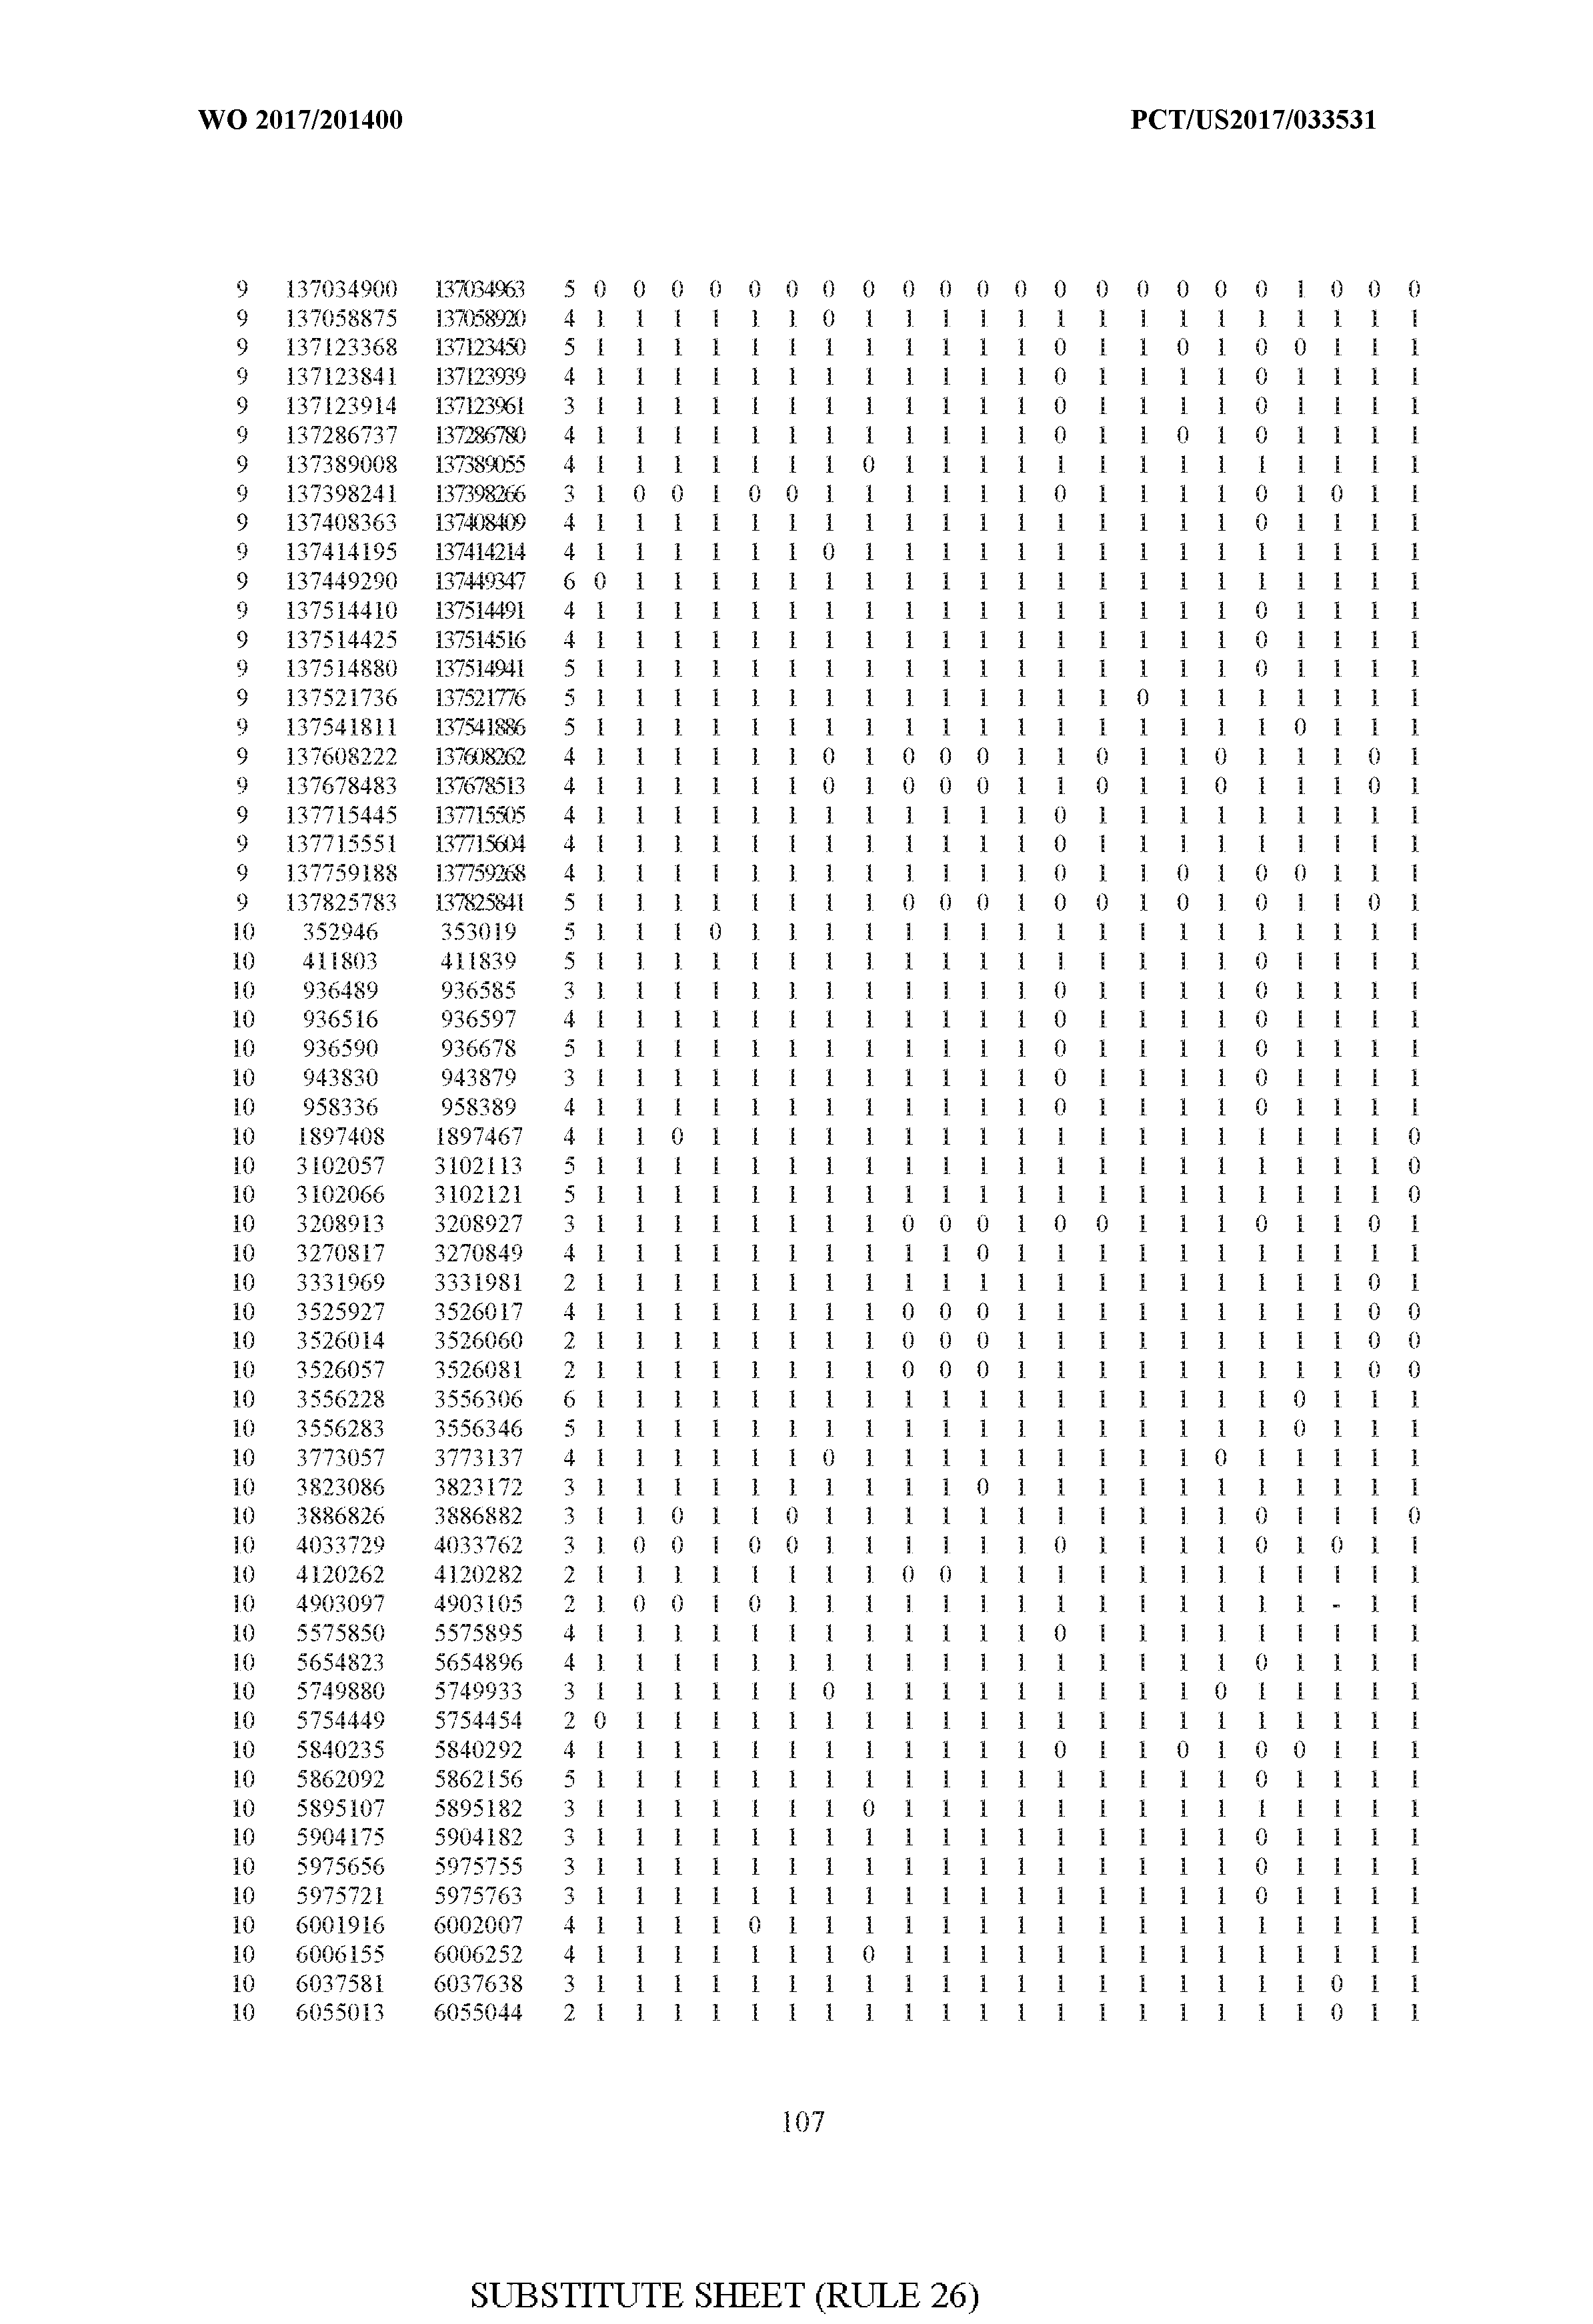


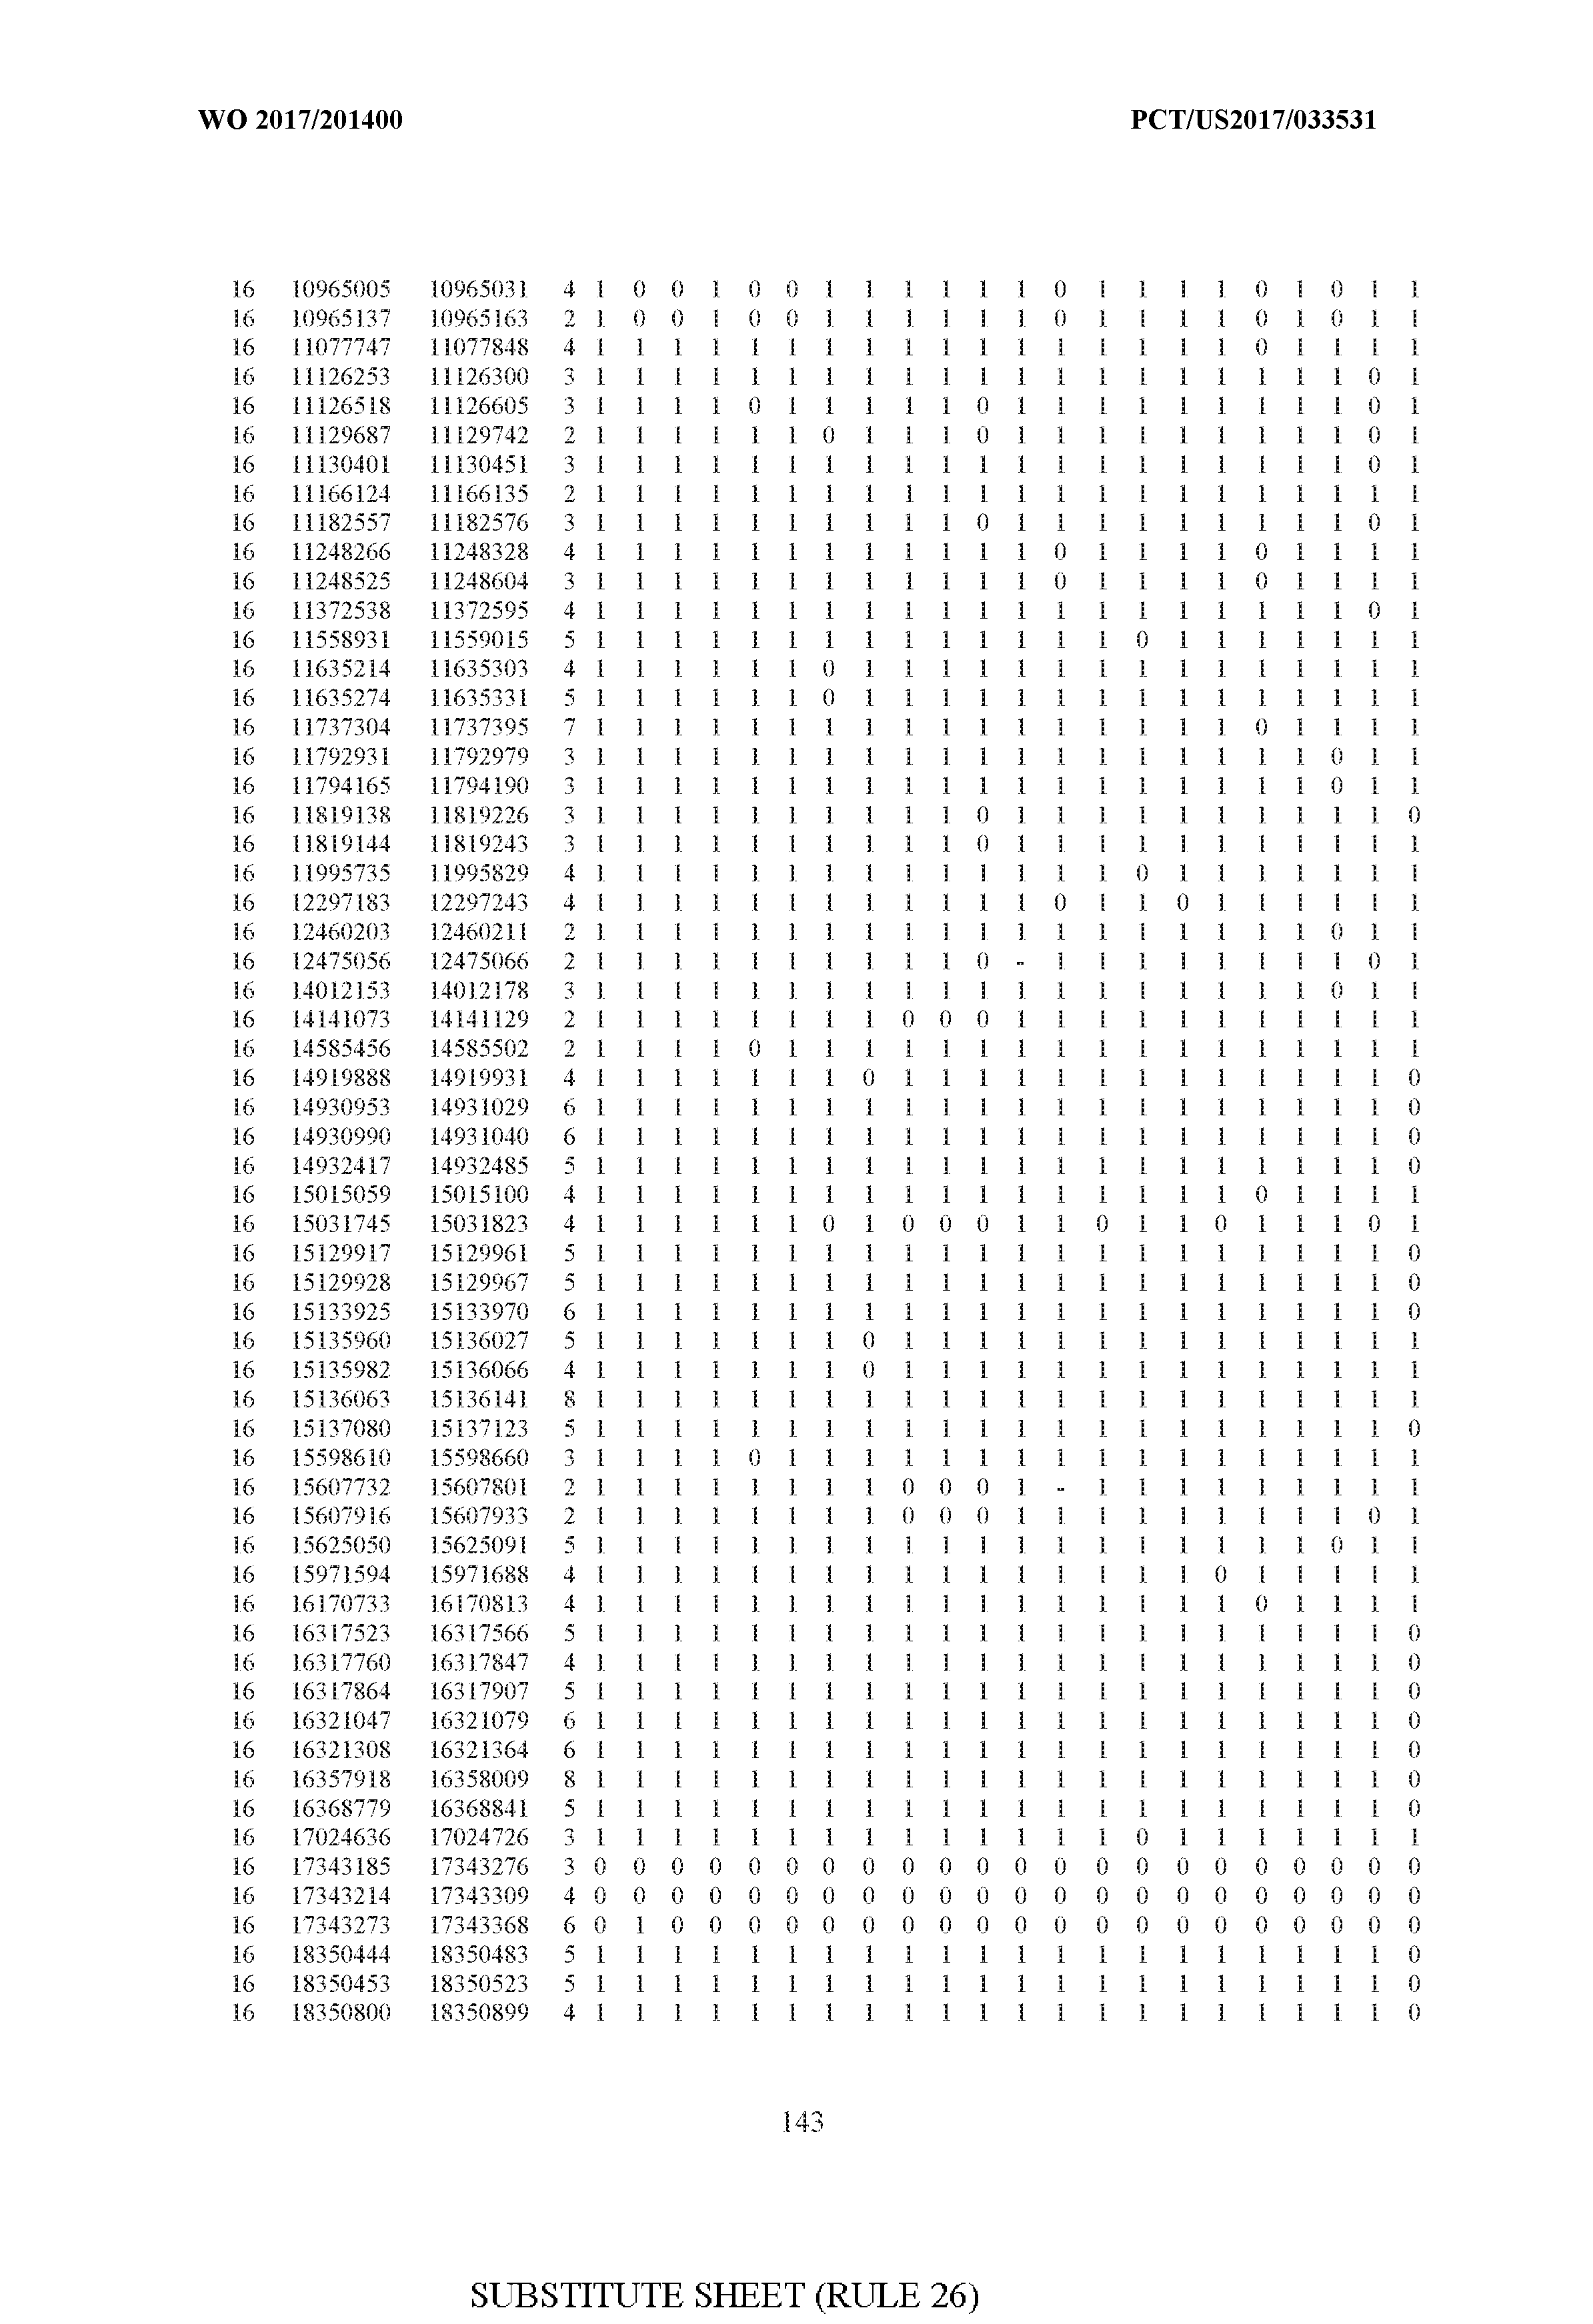


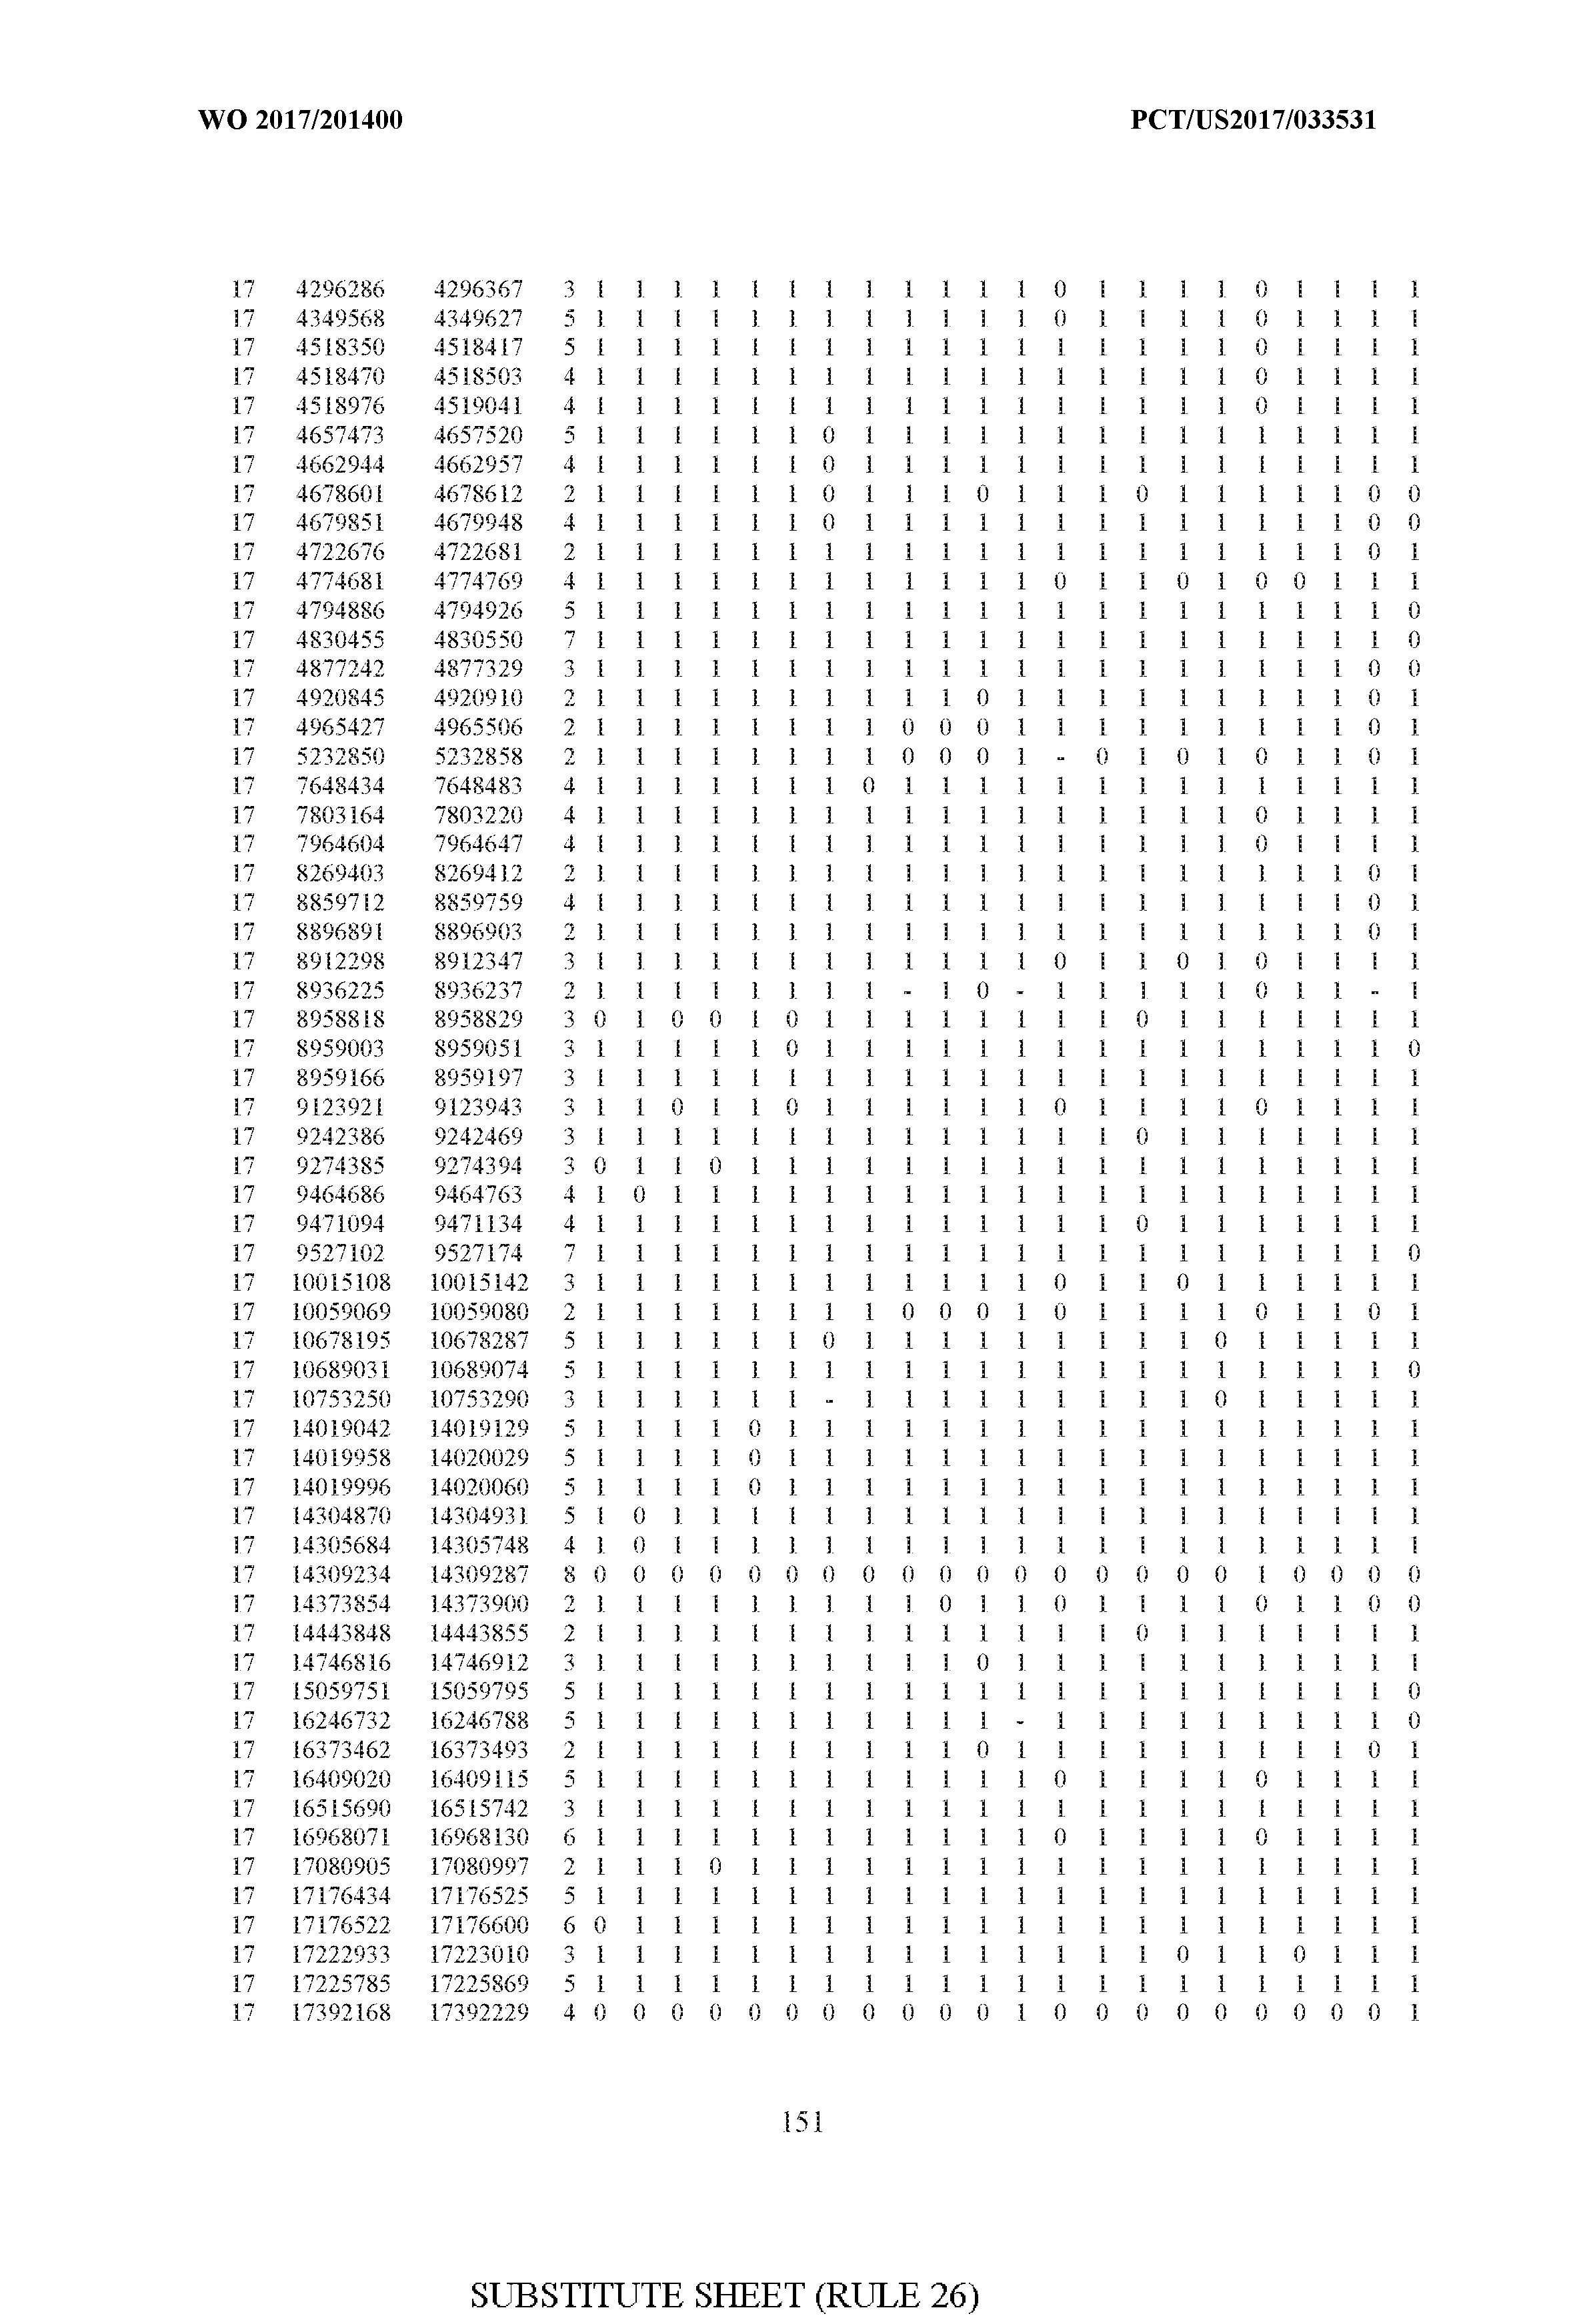


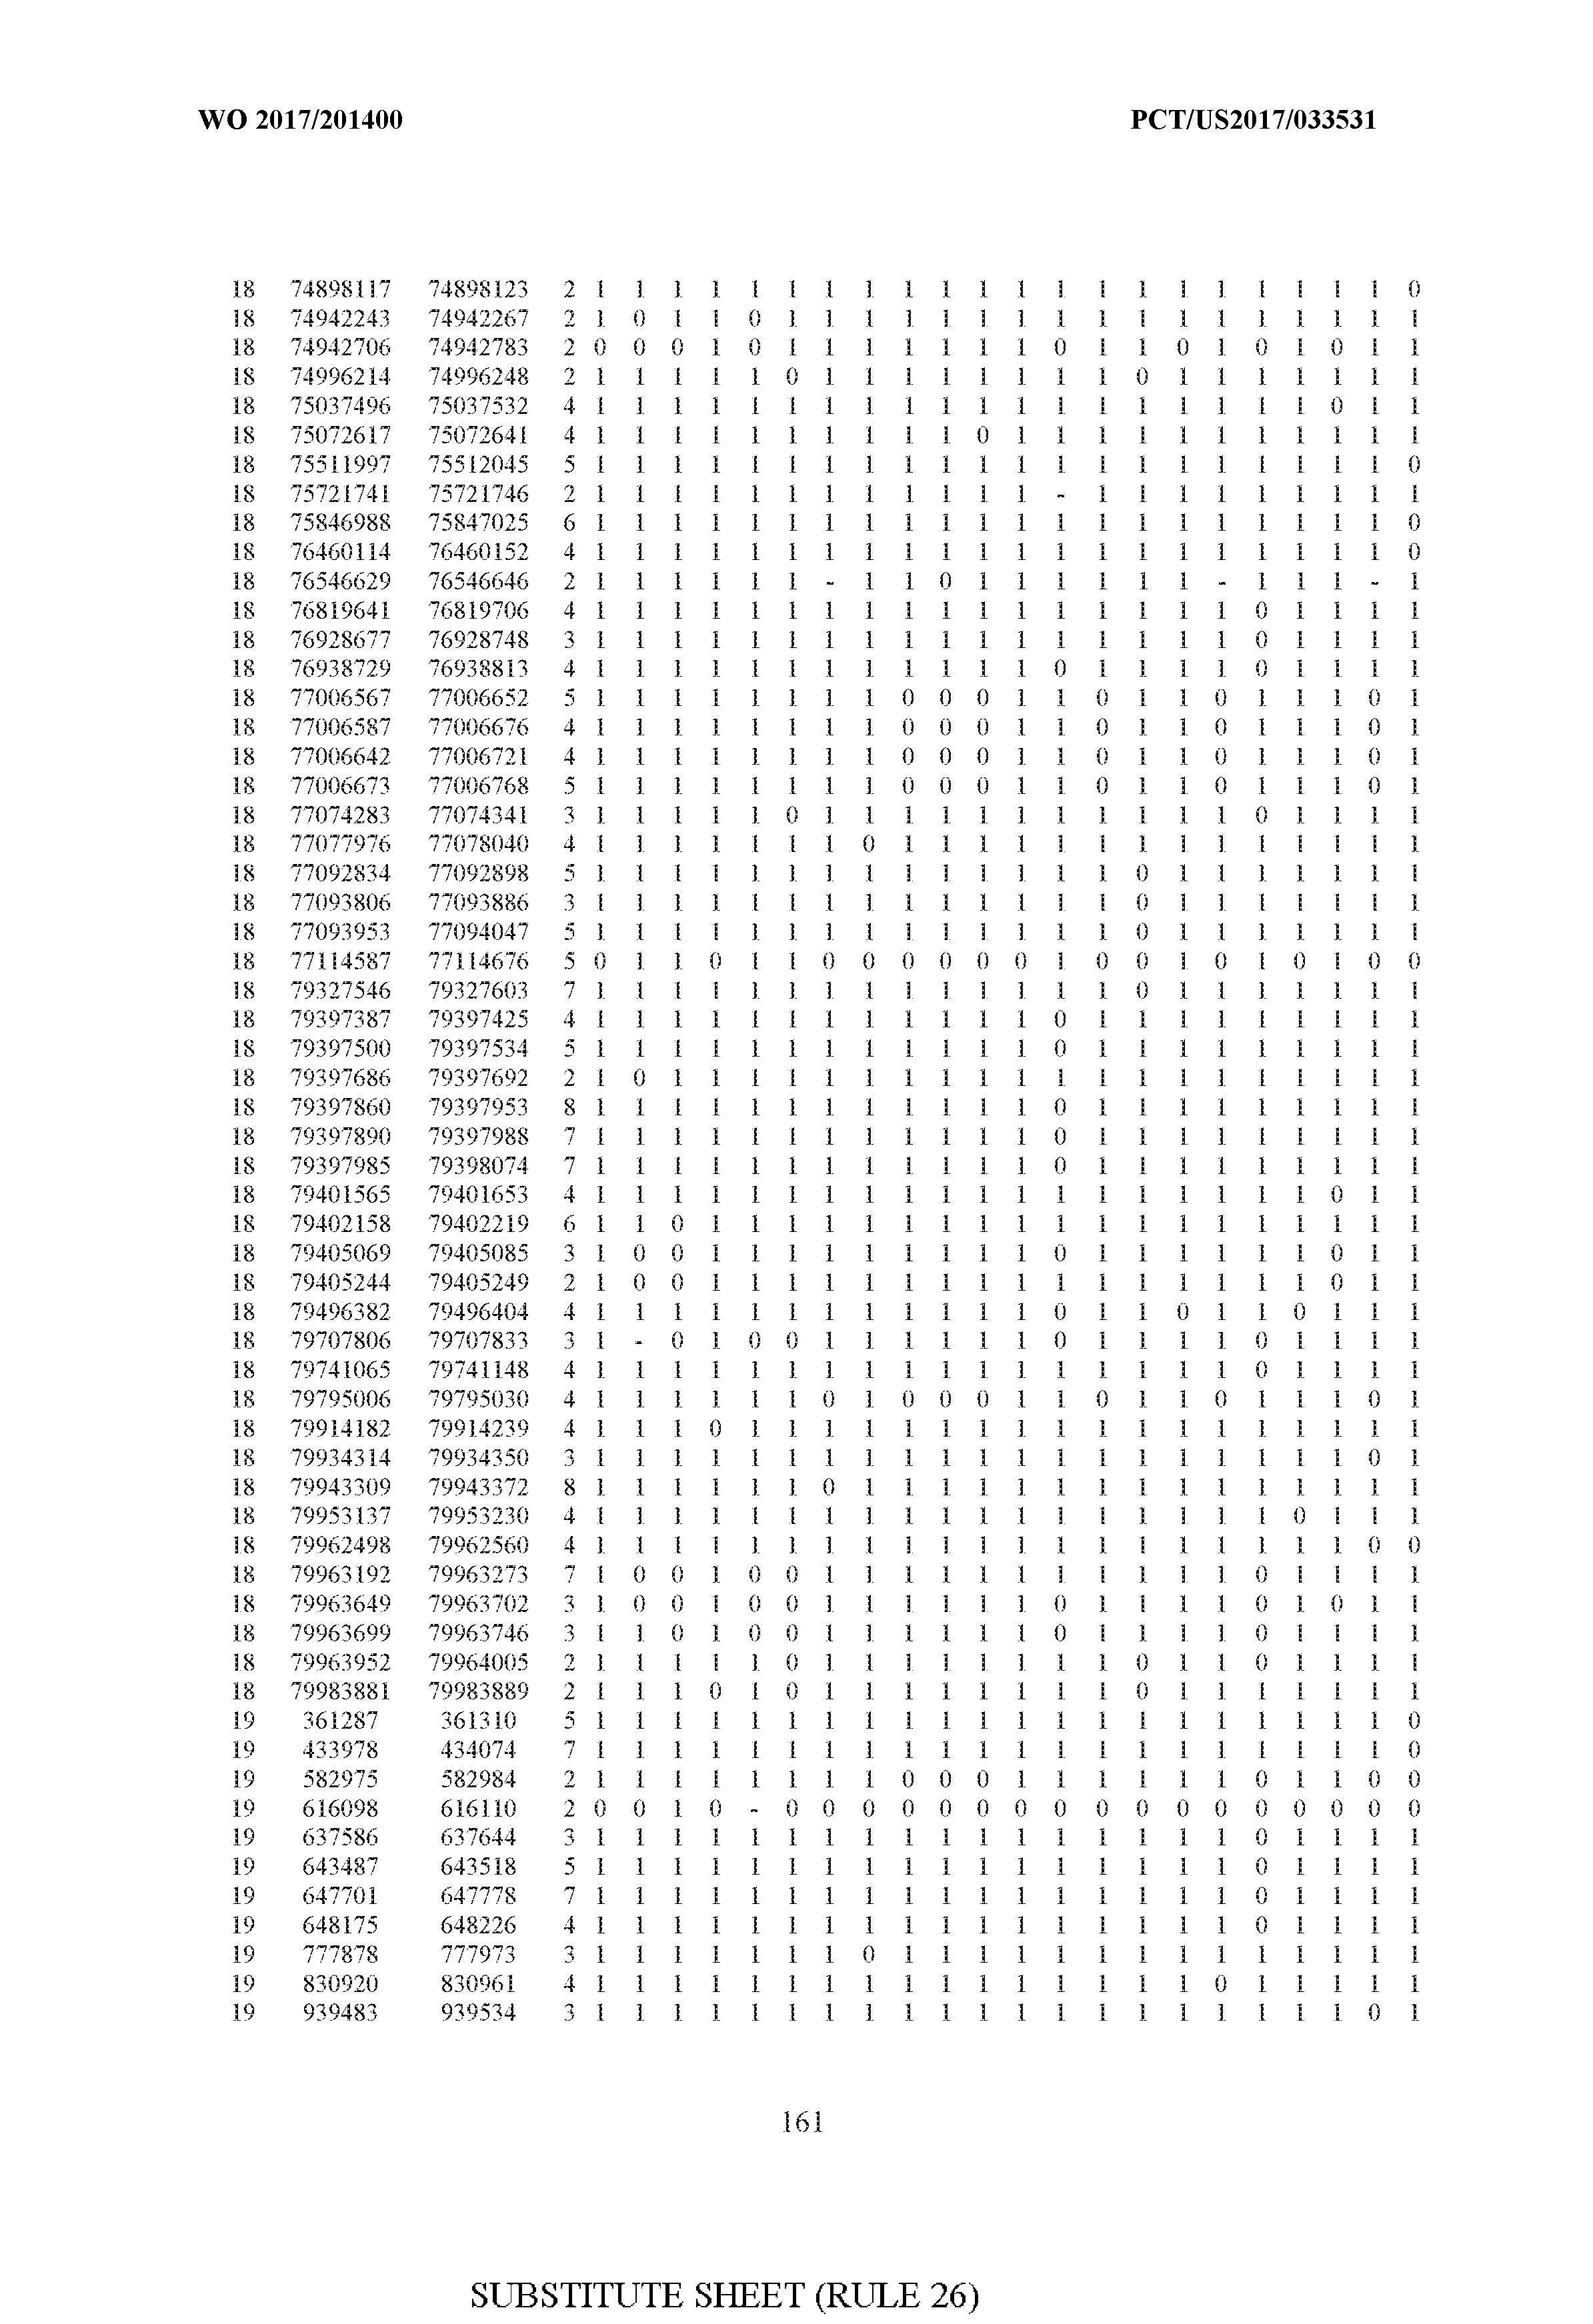


Example 7. Targeted bisulfite sequencing
[0108] Next, we designed a custom DNA enrichment kit suitable for bisulfite sequencing to allow for targeting of the UDMRs. We applied the enrichment assay on DNA extracted from 8 pure immune cell types. The targeting assay yielded a low on-target rate, ranging in 10- 15% of mapped reads, possibly due to using universal blocking oligos. Thus, per sample approximately only 300K reads were available (FIG. 8), and only approximately 10% of the targeted loci were sequenced in all samples at least 20 times. Yet, the analysis of the pure cell types showed that the majority of UDMRs are concordant with the Blueprint-reference matrix, are uniform and have low uninformative rate (FIGS. 3A and 3B). However, the concordance of unmethylated regions in neutrophils and plasmacytoid dendritic cells (pDCs) was low, indicating that enumeration of these cell types may not be accurate. The dendritic cells in Blueprint are from conventional DC, which may explain the incompatibility we observe with pDC.
[0109] We next employed the 8 pure immune cell types to perform simulated in silico mixtures, and predicted the underlying abundances using the original reference matrix learned from the Blueprint dataset. These simulations are based on the authentic sequenced reads and not on individual CpGs as in previous simulations, and therefore methylation calls may be partial and uninformative, making these simulations resembling real data. The analysis revealed that in all cell types, excluding pDCs, the predictions were highly accurate (FIG. 2A). We also generated 4 synthetic in vitro mixtures from the 8 cell types, with varying proportions of the cell types. In all 4 mixtures, EpiSort was able to recover significantly the underlying abundances (p value < 0.05) (FIG. 2A).
[0110] Finally, we test EpiSort against the gold-standard benchmark of cell counting. We performed the EpiSort assay on the DNA extracted from 20 PBMC samples, which were also analyzed by mass spectrometry (CyTOF) immunoprofiling. The DNA for this experiment was extracted from TRIzol samples and was of low quality; for some of the samples very low amount of DNA was available (FIG. 8). Yet, we found that the signal from this experiment was sufficient to infer with high accuracy most of the cell types in the mixture (FIG. 2B). Lower reliability was only observed in low abundant cell types, presumably related to non- sufficient on-target reads. Finally, we compared the correlations of our inferences with gene expression-based methods, including C1BERSORT (Newman, A. M. et al., Nat. Methods, 12, 453-7 (2015)) and our own xCell, (Aran, D., Hu, Z. & Butte, A. J., bioRxiv 114165 (2017). doi : 10.1 101/114165) and found that EpiSort is more reliable in inferring the proportions of cell types in PBMCs (Supplementary Figure 2).
[0111] We believe that EpiSort can serve as a potent tool for tissue composition analysis, and in particular for studying tumor microenvironment heterogeneity. The advantage of EpiSort over single-cell based technologies is clear: since no cell suspension is required, the analysis could be performed on solid tissues without additional destructive dissociation steps, and importantly, it could be performed on archived samples. In cancer studies, this is crucial. DNA methylation analysis from formalin-fixed paraffin -embedded (FFPE) tissues is possible, (Dumenil, T. D. et al., Genes. Chromosomes Cancer, 53, 537-548 (2014)) and thus EpiSort provides a compelling tool for reexamining archived cohorts.
[0112] We have shown here that EpiSort is more accurate than other bulk tissue-based methods. We expect that the accuracy can be further significantly improved with better optimization of the on-target reads. In addition, the reference matrix can be optimized as well by analyzing pure cell types with EpiSort, and removing inaccurate loci. However, since EpiSort relies on a reference matrix it is constrained by our current understanding of cell types annotations, and cannot detect continuums. It should be emphasized that EpiSort is only useful for enumerating cell types and not for any purpose beyond that.
[0113] In summary, EpiSort is an accurate low cost method to enumerate cell populations in a bulk mixture. It can be performed with low quality and low amount of input DNA, and with high accuracy compared to other methods. We prospect that EpiSort will be a valuable tool for identifying predictive biomarkers that could lead to personalized cancer
immunotherapy strategies, and facilitate new cancer immunotherapy approaches.
Example 8. Identifying uniform differentially methylated regions
[0114] DNA methylation calls of human whole genome bisulfite sequencing samples mapped to hg38 were downloaded from the Blueprint Epigenome project (Blueprint Epigenome - Welcome to the Blueprint project at http://www.blueprint- epigenome. eu/) and from MethBase. (Song, Q. et al., PIAS One, 8, e81 148 (2013)) Altogether we obtained 64 samples, which were aggregated to 23 cell types. Two samples were removed due to low coverage. We scan the genome for N consecutive CpGs in a region <100bp, such that in each cell type all CpGs are methylated or unmethylated. We measure this characteristic, which we term uniformity, using the following formula:

[0115] Then for each pair of cell types we use calculate the difference (D) of each of the CpGs in the region. We use different threshold for N, U and D, starting from stringent thresholds and gradually relaxing the thresholds to allow 100 regions for each per of cell types. Ranges are N=5 to 2, U=0.01 to 0.05 and D=0.95 to 0.5. Regions containing CpGs that are unavailable in more than 2 cell types are removed. The search yielded 9,291 regions across the genome .
Example 9. CvTOF Immunoprofiling
[0116] PBMCs of healthy volunteer were collected by the Stanford Blood Center, and were provided with courtesy from the Institute for Immunity, Transplantation and Infection (HIMC) at Stanford University.. PBMCs were analyzed using the CyTOF immunoprofiling protocol described in Leipold & Maeker. (Leipold, M. & Maecker, H., BIO-PROTOCOL, 5, (2015)) Normalization of the mass cytometry data was performed according to Finck et al. (Finck, R. et al., Cytom. Part A, 83A, 483-494 (2013)) Next, normalization beads, debris, doublets, and dead cells were removed from the data before marker-based gating to determine the cell populations. The fractions presented are the number of cells in a particular gated subpopulation divided by the number of viable singlet cells.
Example 10. DNA from pure immune cell types in peripheral blood
[0117] White blood cell concentrates of TrimaAccel® leukocyte reduction system (LRS) cones recovered after Plateletpheresis procedure were obtained from two donors by the
Stanford Blood Center according to Institutional Review Board (IRB) ("Minimal Risk Research Related Activities at Stanford Blood Center", Protocol #13942) protocol. Pure cell populations were isolated using EasyScp Human negative selection kits (STEM CELL technologies, >95% purity). In addition, we analyzed genomic DNA from frozen human peripheral blood Macrophages (> 90%) and Plasmacytoid Dendritic Cells (pDCs, (> 85%)). DNA was purified using QIAamp DNA Mini Kit (QIAGEN).
Example 11. Targeted bisulfite-seauencing
[0118] Extracted genomic DNA (gDNA) was sent to the University of California-Berkeley, Institute for Quantitative Biosciences (QB3), Functional Genomics Laboratory where it was prepared for Illumina short-read sequencing using a custom designed Nimblegen targeted capture probe panel. The DNAs were initially spiked with bisulfite conversion control, as indicated in the Nimblegen SeqCap Epi enrichment protocol (Roche Diagnostics Corp., Indianapolis, IN) and sheared to 200 base-pairs (bp) on a Covaris S220 Focused- Ultrasonicator (Covaris, Woburn, MA). Fragmented DNA was cleaned and concentrated with MinElute® PCR Purification columns (QIAGEN Inc., Valencia, CA) and prepared for sequencing on an Apollo 324™ with PrepX™ ILM 32i DNA Library Kits (WaferGen Biosystems, Fremont, CA), using eight base-pair dual-indexed methylated adapters
(Integrated DNA Technologies Inc., Chicago, IL). Post library preparation, bisulfite conversion was performed on the adapter-ligated, indexed libraries using the EZ DNA Memylation-Lightning kit (Zymo Research Corp., Irvine, CA), after which bisulfite- converted libraries were amplified with 12 polymerase chain reaction (PCR) cycles using KAPA HiFi Hotstart Uracil+ ReadyMix and Ligation-Mediated PCR oligos (Roche
Diagnostics Corp., Indianapolis, IN). Samples submitted with less than one microgram of extracted gDNA were amplified with an additional 2 PCR cycles to increase concentration pre -capture. Amplified libraries were purified using AMpure XP solid-phase reversible immobilization beads (Beckman Coulter Inc., Indianapolis, IN) and quantified using a high sensitivity DNA Qubit assay (Thermo Fisher Scientific, Billerica, MA).
[0119] Eight one-microgram pools, consisting of four different 250ng aliquots of purified, bisulfite-converted library, were hybridized to capture probes for approximately 70 hours following the SeqCap Epi Enrichment system protocol (Roche Diagnostics Corp.,
Indianapolis, IN). Bisulfite capture enhancer provided in the capture kit and xGen universal oligo blockers (Integrated DNA Technologies Inc., Chicago, IL) were added to the pools
prior to probe hybridization. Capture bead-bound sample pools were washed and amplified for 16 PCR cycles using KAPA HiFi Hostart ReadyMix and LM-PCR oligos (Roche Diagnostics Corp., Indianapolis, IN). Final products were visualized on a high-sensitivity DNA Advanced Analytical Fragment Analyzer assay (Advanced Analytical Technologies Inc., Ames, IA). Pools were then transferred to the QB3 Genomics Sequencing Laboratory at UC Berkeley and quantified in duplicate on a BioRad CFX connect quantitative PCR thermal cycler (BIO-RAD Laboratories, Hercules, CA) using the KAPA Universal qPCR Mix Library Quant Kit for Dlumina (Roche Diagnostics Corp., Indianapolis, IN). The eight capture pools were then pooled equimolar and sequenced across two Alumina HiSeq2500 v2 150bp single- end rapid lanes with a ten percent PhiX control library spike (Illurnina Inc., San Diego, CA). Basecall files (bclfiles) were demultiplexed and converted to fastQ file format using the bcl2fastq v2.18 software (Illumina Inc., San Diego, CA).
Example 12. EpiSort pipeline
[0120] Reference matrix - Based on the WGBS datasets we generated a 9,291x23 binary matrix for each of the UDMRs and cell types. Each cell in the matrix is 1 if the regions methylation > 0.5, and 0 otherwise. The reference matrix can be further refined using targeted bisulfite sequencing of pure cell types, which will yield higher reliability due to superior read depth.
[0121] DNA extraction - The requirement for the targeting assay is 1 microgram of DNA. However, our analyses show that the targeting assay can be performed with very low amount of DNA, as we were able to recover the composition of a sample where only 40 nanograms were available.
[0122] Targeting - We used here the SeqCap Epi kit to target 9,291 regions, multiplexing 4 samples per reaction. [0123] Sequencing - All 32 samples were multiplexed and sequenced together using one HiSeq 2500 lane. We used 150bp single-read sequences.
[0124] Alignment - Bismark Bisulfite Mapper (Krueger, F. & Andrews, S. R.
Bioinformatics, 27, 1571-2 (2011)) was used to align the reads to the hg38 reference genome. Using Matlab sparse matrices we efficiently analyzed each sample to count the number of methylated, unmethylated and uninformative reads in the targeted regions. A read is called
methylated if the majority of its CpGs are methylation, unmethylated if the majority is unmethylated, and uninformative if equal number of methylated and methylated CpGs.
[0125] Analysis - For the input sample we calculate for each region the methylation call, which is the fraction of methylated reads from all informative reads. This generates a vector (b), and with the reference matrix (A) we perform linear regression analysis to compute the underlying abundances of the cell types (x) . To perform the analysis we employ robust fitting to reduce the effect of outliers. (Buja, A. et al.. Computing and graphics in statistics.
Computing and graphics in statistics (Springer-Verlag, 1991). at
http://dl.acm.org/citation.cfm?id=140809) [0126] It is understood that me examples and embodiments described herein are for illustrative purposes only and that various modifications or changes in light thereof will be suggested to persons skilled in the art and are to be included within the spirit and purview of this application and scope of the appended claims. All publications, patents, and patent applications cited herein are hereby incorporated by reference in their entirety for all purposes.
Claims
WHAT IS CLAIMED IS: 1. A method for identifying a set of genetic loci having methylation states that distinguish between cell types, the method comprising,
receiving quantitative nucleotide sequencing data for a plurality of different cell types, where the data includes designations whether cytosines are methylated; and
selecting genetic loci from the quantitative nucleotide sequencing data:
(i) that have at least three CpG sequences within 200 contiguous nucleotides,
(ii) for which all of the at least three CpG sequences are fully methylated or fully unmethylated for a particular cell type; and
(iii) wherein methylation status of the at least three CpG sequences is stably different between two different cell types,
thereby selecting a set of genetic loci having methylation states that distinguish between cell types. 2. The method of claim 1 , wherein the cell types are mammalian immune cell types. 3. The method of claim 1 , wherein the plurality of different cell types comprises at least two (e.g.,
2,
3, 4, 5, 6, 7, 8, 9, 10 or more) cell types selected from
hematopoietic stem cells, neutrophils, CD4+ naive T-cell, CD8+ naive T-cell, CD4+ Central Memory T-cell, CD8+ Central Memory T-cell, CD4+ Effector Memory T-cell, CD8+ Effector Memory T-cell, regulatory T-cells, natural killer cells, naive B-cells, memory B-cells, plasma cells, precursor B-cells, monocytes, dendritic cells, macrophages M0, macrophages Ml, macrophages M2, eosinophils, erythroblasts, or basophils.
4. The method of claim 1 , wherein the genetic loci are scored as "methylated" when at least a majority of the CpG sequences are determined to be methylated and the genetic loci are scored as "unmethylated" when at least a majority of the CpG sequences are determined to be unmethylated.
5. The method of claim 1, wherein the methylation status signatures each have between 50-200 different genetic loci.
6. The method of claim 1, wherein the set of genetic loci is between 500- 10,000 different loci.
7 . The method of claim 1, wherein at least 90% of the genetic loci are between 200-500 nucleotides in length.
8. The method of claim 1 , wherein the quantitatively nucleotide sequencing comprises bisulfite deep sequencing.
9. A method for determining the proportion and identity of different cell types in a sample, the method comprising,
providing genomic DNA from a sample having a mixture of different cell types; quantitatively nucleotide sequencing a plurality of unique copies of the genomic DNA at said set of genetic loci having methylation states that distinguish between cell types of claim 1 , wherein the nucleotide sequencing includes designations whether cytosines are methylated, to generate a set of determined sequencing reads having a determined methylation status at each genetic locus in the set of genetic loci;
comparing the set of determined sequencing reads to a reference set of a plurality of different methylation status signatures that distinguish between at least two different cell types in the sample; and
determining the proportion of occurrences of different methylation status signatures in the set of determined sequencing reads and determining the proportion and identity of different cell types in the sample by deconvolving the occurrences of different methylation status signatures.
10. The method of claim 9, wherein the cell types are mammalian immune cell types.
11. The method of claim 9, wherein the plurality of different cell types comprises at least two (e.g., 2, 3, 4, 5, 6, 7, 8, 9, 10 or more) cell types selected from
hematopoietic stem cells, neutrophils, CD4+ naive T-cell, CD8+ naive T-cell, CD4+ Central Memory T-cell, CD8+ Central Memory T-cell, CD4+ Effector Memory T-cell, CD8+ Effector Memory T-cell, regulatory T-cells, natural killer cells, naive B-cells, memory B-cells, plasma cells, precursor B-cells, monocytes, dendritic cells, macrophages MO, macrophages Ml, macrophages M2, eosinophils, erythroblasts, or basophils.
12. The method of claim 9, wherein the genetic loci are scored as "methylated" when at least a majority of the CpG sequences are determined to be methylated and the genetic loci are scored as "unmethylated" when at least a majority of the CpG sequences are determined to be unmethylated.
13. The method of claim 9, wherein the methylation status signatures each have between 50-200 different genetic loci.
14. The method of claim 9, wherein the set of genetic loci is between 500- 10,000 different loci.
15 . The method of claim 9, wherein at least 90% of the genetic loci are between 200-500 nucleotides in length.
16. The method of claim 9, wherein the quantitatively nucleotide sequencing comprises bisulfite deep sequencing.
17. A computer product comprising a non-transitory computer readable medium storing a plurality of instructions that when executed determine the proportion and identity of different cell types in a sample, the instructions comprising:
receiving a set of determined sequencing reads from genomic DNA from a sample having a mixture of different cell types, the set of determined sequencing reads having a determined methylation status at each genetic locus in the set of genetic loci, the set of determined sequencing reads generated by quantitatively nucleotide sequencing a plurality of unique copies of the genomic DNA at the set of genetic loci having methylation states that distinguish between cell types of claim 1, wherein the nucleotide sequencing includes designations whether cytosines are methylated;
comparing the set of determined sequencing reads to a reference set of a plurality of different methylation status signature that distinguishes between at least two different cell types in the sample; and
determining the proportion of occurrences of different methylation status signatures in the set of determined sequencing reads and determining the proportion and identity of different cell types in the sample by deconvolving the occurrences of different methylation status signatures.
18. The computer product of claim 17, wherein the cell types are mammalian immune cell types.
19. The computer product of claim 17, wherein the plurality of different cell types comprises at least two (e.g., 2, 3, 4, 5, 6, 7, 8, 9, 10 or more) cell types selected from hematopoietic stem cells, neutrophils, CD4+ naive T-cell, CD8+ naive T-cell, CD4+ Central Memory T-cell, CD8+ Central Memory T-cell, CD4+ Effector Memory T-cell, CD8+ Effector Memory T-cell, regulatory T-cells, natural killer cells, naive B-cells, memory B-cells, plasma cells, precursor B-cells, monocytes, dendritic cells, macrophages M0, macrophages Ml, macrophages M2, eosinophils, erythroblasts, or basophils.
20. The computer product of claim 17, wherein the genetic loci are scored as "methylated" when at least a majority of the CpG sequences are determined to be methylated and the genetic loci are scored as "unmethylated" when at least a majority of the CpG sequences are determined to be unmethylated.
21. The computer product of claim 17, wherein the methylation status signatures each have between 50-200 different genetic loci.
22. The computer product of claim 17, wherein the set of genetic loci is between 500-10,000 different loci.
23 . The computer product of claim 17, wherein at least 90% of the genetic loci are between 200-500 nucleotides in length.
24. The computer product of claim 17, wherein the quantitatively nucleotide sequencing comprises bisulfite deep sequencing.
Applications Claiming Priority (2)
| Application Number | Priority Date | Filing Date | Title |
|---|---|---|---|
| US201662338845P | 2016-05-19 | 2016-05-19 | |
| US62/338,845 | 2016-05-19 |
Publications (1)
| Publication Number | Publication Date |
|---|---|
| WO2017201400A1 true WO2017201400A1 (en) | 2017-11-23 |
Family
ID=60325674
Family Applications (1)
| Application Number | Title | Priority Date | Filing Date |
|---|---|---|---|
| PCT/US2017/033531 Ceased WO2017201400A1 (en) | 2016-05-19 | 2017-05-19 | Determination of cell types in mixtures using targeted bisulfite sequencing |
Country Status (1)
| Country | Link |
|---|---|
| WO (1) | WO2017201400A1 (en) |
Cited By (2)
| Publication number | Priority date | Publication date | Assignee | Title |
|---|---|---|---|---|
| EP3962920A4 (en) * | 2019-04-22 | 2023-06-07 | Behavioral Diagnostics, LLC | Compositions and methods for correcting for cellular admixture in epigenetic analyses |
| EP4045685A4 (en) * | 2019-10-18 | 2023-11-15 | Washington University | METHOD AND SYSTEMS FOR MEASURING CELL STATES |
Citations (3)
| Publication number | Priority date | Publication date | Assignee | Title |
|---|---|---|---|---|
| US20120196756A1 (en) * | 2011-02-02 | 2012-08-02 | Mayo Foundation For Medical Education And Research | Digital sequence analysis of dna methylation |
| US20140178348A1 (en) * | 2011-05-25 | 2014-06-26 | The Regents Of The University Of California | Methods using DNA methylation for identifying a cell or a mixture of cells for prognosis and diagnosis of diseases, and for cell remediation therapies |
| US20150099670A1 (en) * | 2013-10-07 | 2015-04-09 | Weiwei Li | Method of preparing post-bisulfite conversion DNA library |
-
2017
- 2017-05-19 WO PCT/US2017/033531 patent/WO2017201400A1/en not_active Ceased
Patent Citations (3)
| Publication number | Priority date | Publication date | Assignee | Title |
|---|---|---|---|---|
| US20120196756A1 (en) * | 2011-02-02 | 2012-08-02 | Mayo Foundation For Medical Education And Research | Digital sequence analysis of dna methylation |
| US20140178348A1 (en) * | 2011-05-25 | 2014-06-26 | The Regents Of The University Of California | Methods using DNA methylation for identifying a cell or a mixture of cells for prognosis and diagnosis of diseases, and for cell remediation therapies |
| US20150099670A1 (en) * | 2013-10-07 | 2015-04-09 | Weiwei Li | Method of preparing post-bisulfite conversion DNA library |
Cited By (2)
| Publication number | Priority date | Publication date | Assignee | Title |
|---|---|---|---|---|
| EP3962920A4 (en) * | 2019-04-22 | 2023-06-07 | Behavioral Diagnostics, LLC | Compositions and methods for correcting for cellular admixture in epigenetic analyses |
| EP4045685A4 (en) * | 2019-10-18 | 2023-11-15 | Washington University | METHOD AND SYSTEMS FOR MEASURING CELL STATES |
Similar Documents
| Publication | Publication Date | Title |
|---|---|---|
| Kumar et al. | Next-generation sequencing and emerging technologies | |
| Berest et al. | Quantification of differential transcription factor activity and multiomics-based classification into activators and repressors: diffTF | |
| KR102746245B1 (en) | Molecular analyses using long cell-free fragments in pregnancy | |
| AU2019410635B2 (en) | Cell-free DNA end characteristics | |
| US9115401B2 (en) | Partition defined detection methods | |
| Aracena et al. | Epigenetic variation impacts individual differences in the transcriptional response to influenza infection | |
| US20210130900A1 (en) | Multiplexed parallel analysis of targeted genomic regions for non-invasive prenatal testing | |
| US20210238668A1 (en) | Biterminal dna fragment types in cell-free samples and uses thereof | |
| IL228843A (en) | Resolving genome fractions using polymorphism counts | |
| US20220396838A1 (en) | Cell-free dna methylation and nuclease-mediated fragmentation | |
| Waneka et al. | Mitochondrial mutations in Caenorhabditis elegans show signatures of oxidative damage and an AT-bias | |
| Agier et al. | The spatiotemporal program of replication in the genome of Lachancea kluyveri | |
| US20220336051A1 (en) | Method for Determining Relatedness of Genomic Samples Using Partial Sequence Information | |
| Bredemeyer et al. | Rapid macrosatellite evolution promotes X-linked hybrid male sterility in a feline interspecies cross | |
| Rackham et al. | A Bayesian approach for analysis of whole-genome bisulfite sequencing data identifies disease-associated changes in DNA methylation | |
| WO2017201400A1 (en) | Determination of cell types in mixtures using targeted bisulfite sequencing | |
| US20260078439A1 (en) | Next-Generation Sequencing Pipeline for Detection of Ultrashort Single-Stranded Cell-Free DNA | |
| Zhegalova et al. | Convergent gene pairs restrict chromatin looping in Dictyostelium discoideum, acting as directional barriers for extrusion | |
| Aran et al. | EpiSort: Enumeration of cell types using targeted bisulfite sequencing | |
| Ludwig et al. | Single-cell multi-omics resolved analysis of mitochondrial genome-wide mutational burden, constraint, and mosaicism | |
| RU2822040C1 (en) | Method of detecting copy number variations (cnv) based on sequencing data of complete human exome and low-coverage genome | |
| WO2025113619A1 (en) | Enrichment of clinically-relevant nucleic acids | |
| Hsieh et al. | Single-cell multi-omics resolved analysis of mitochondrial genome-wide mutational burden, constraint, and mosaicism | |
| Han et al. | Population-level genome-wide STR typing in Plasmodium species reveals higher resolution population structure and genetic diversity relative to SNP typing | |
| HK40074981A (en) | Noninvasive prenatal molecular karyotyping from maternal plasma |
Legal Events
| Date | Code | Title | Description |
|---|---|---|---|
| NENP | Non-entry into the national phase |
Ref country code: DE |
|
| 121 | Ep: the epo has been informed by wipo that ep was designated in this application |
Ref document number: 17800235 Country of ref document: EP Kind code of ref document: A1 |
|
| 122 | Ep: pct application non-entry in european phase |
Ref document number: 17800235 Country of ref document: EP Kind code of ref document: A1 |