WO2017208623A1 - システム監視装置及びプログラム - Google Patents
システム監視装置及びプログラム Download PDFInfo
- Publication number
- WO2017208623A1 WO2017208623A1 PCT/JP2017/014619 JP2017014619W WO2017208623A1 WO 2017208623 A1 WO2017208623 A1 WO 2017208623A1 JP 2017014619 W JP2017014619 W JP 2017014619W WO 2017208623 A1 WO2017208623 A1 WO 2017208623A1
- Authority
- WO
- WIPO (PCT)
- Prior art keywords
- state
- transition
- probability
- information
- unit
- Prior art date
- Legal status (The legal status is an assumption and is not a legal conclusion. Google has not performed a legal analysis and makes no representation as to the accuracy of the status listed.)
- Ceased
Links
Images









Classifications
-
- H—ELECTRICITY
- H02—GENERATION; CONVERSION OR DISTRIBUTION OF ELECTRIC POWER
- H02J—ELECTRIC POWER NETWORKS; CIRCUIT ARRANGEMENTS OR SYSTEMS FOR SUPPLYING OR DISTRIBUTING ELECTRIC POWER; SYSTEMS FOR STORING ELECTRIC ENERGY
- H02J3/00—Circuit arrangements for AC mains or AC distribution networks
- H02J3/003—Load forecast, e.g. methods or systems for forecasting future load demand
-
- H—ELECTRICITY
- H02—GENERATION; CONVERSION OR DISTRIBUTION OF ELECTRIC POWER
- H02J—ELECTRIC POWER NETWORKS; CIRCUIT ARRANGEMENTS OR SYSTEMS FOR SUPPLYING OR DISTRIBUTING ELECTRIC POWER; SYSTEMS FOR STORING ELECTRIC ENERGY
- H02J13/00—Circuit arrangements for providing remote monitoring or remote control of equipment in a power distribution network
-
- H—ELECTRICITY
- H02—GENERATION; CONVERSION OR DISTRIBUTION OF ELECTRIC POWER
- H02J—ELECTRIC POWER NETWORKS; CIRCUIT ARRANGEMENTS OR SYSTEMS FOR SUPPLYING OR DISTRIBUTING ELECTRIC POWER; SYSTEMS FOR STORING ELECTRIC ENERGY
- H02J13/00—Circuit arrangements for providing remote monitoring or remote control of equipment in a power distribution network
- H02J13/12—Monitoring network conditions, e.g. electrical magnitudes or operational status
-
- H—ELECTRICITY
- H02—GENERATION; CONVERSION OR DISTRIBUTION OF ELECTRIC POWER
- H02J—ELECTRIC POWER NETWORKS; CIRCUIT ARRANGEMENTS OR SYSTEMS FOR SUPPLYING OR DISTRIBUTING ELECTRIC POWER; SYSTEMS FOR STORING ELECTRIC ENERGY
- H02J13/00—Circuit arrangements for providing remote monitoring or remote control of equipment in a power distribution network
- H02J13/18—Circuit arrangements for providing remote monitoring or remote control of equipment in a power distribution network characterised by the remotely-controlled equipment, e.g. converters or transformers
- H02J13/333—Circuit arrangements for providing remote monitoring or remote control of equipment in a power distribution network characterised by the remotely-controlled equipment, e.g. converters or transformers the equipment forming part of substations
-
- H—ELECTRICITY
- H02—GENERATION; CONVERSION OR DISTRIBUTION OF ELECTRIC POWER
- H02J—ELECTRIC POWER NETWORKS; CIRCUIT ARRANGEMENTS OR SYSTEMS FOR SUPPLYING OR DISTRIBUTING ELECTRIC POWER; SYSTEMS FOR STORING ELECTRIC ENERGY
- H02J3/00—Circuit arrangements for AC mains or AC distribution networks
-
- H—ELECTRICITY
- H02—GENERATION; CONVERSION OR DISTRIBUTION OF ELECTRIC POWER
- H02J—ELECTRIC POWER NETWORKS; CIRCUIT ARRANGEMENTS OR SYSTEMS FOR SUPPLYING OR DISTRIBUTING ELECTRIC POWER; SYSTEMS FOR STORING ELECTRIC ENERGY
- H02J3/00—Circuit arrangements for AC mains or AC distribution networks
- H02J3/38—Arrangements for feeding a single network from two or more generators or sources in parallel; Arrangements for feeding already energised networks from additional generators or sources in parallel
- H02J3/381—Dispersed generators
-
- H—ELECTRICITY
- H02—GENERATION; CONVERSION OR DISTRIBUTION OF ELECTRIC POWER
- H02J—ELECTRIC POWER NETWORKS; CIRCUIT ARRANGEMENTS OR SYSTEMS FOR SUPPLYING OR DISTRIBUTING ELECTRIC POWER; SYSTEMS FOR STORING ELECTRIC ENERGY
- H02J2101/00—Supply or distribution of decentralised, dispersed or local electric power generation
- H02J2101/20—Dispersed power generation using renewable energy sources
-
- H—ELECTRICITY
- H02—GENERATION; CONVERSION OR DISTRIBUTION OF ELECTRIC POWER
- H02J—ELECTRIC POWER NETWORKS; CIRCUIT ARRANGEMENTS OR SYSTEMS FOR SUPPLYING OR DISTRIBUTING ELECTRIC POWER; SYSTEMS FOR STORING ELECTRIC ENERGY
- H02J2101/00—Supply or distribution of decentralised, dispersed or local electric power generation
- H02J2101/20—Dispersed power generation using renewable energy sources
- H02J2101/22—Solar energy
-
- H—ELECTRICITY
- H02—GENERATION; CONVERSION OR DISTRIBUTION OF ELECTRIC POWER
- H02J—ELECTRIC POWER NETWORKS; CIRCUIT ARRANGEMENTS OR SYSTEMS FOR SUPPLYING OR DISTRIBUTING ELECTRIC POWER; SYSTEMS FOR STORING ELECTRIC ENERGY
- H02J2103/00—Details of circuit arrangements for mains or AC distribution networks
- H02J2103/30—Simulating, planning, modelling, reliability check or computer assisted design [CAD] of electric power networks
-
- Y—GENERAL TAGGING OF NEW TECHNOLOGICAL DEVELOPMENTS; GENERAL TAGGING OF CROSS-SECTIONAL TECHNOLOGIES SPANNING OVER SEVERAL SECTIONS OF THE IPC; TECHNICAL SUBJECTS COVERED BY FORMER USPC CROSS-REFERENCE ART COLLECTIONS [XRACs] AND DIGESTS
- Y02—TECHNOLOGIES OR APPLICATIONS FOR MITIGATION OR ADAPTATION AGAINST CLIMATE CHANGE
- Y02E—REDUCTION OF GREENHOUSE GAS [GHG] EMISSIONS, RELATED TO ENERGY GENERATION, TRANSMISSION OR DISTRIBUTION
- Y02E40/00—Technologies for an efficient electrical power generation, transmission or distribution
- Y02E40/70—Smart grids as climate change mitigation technology in the energy generation sector
-
- Y—GENERAL TAGGING OF NEW TECHNOLOGICAL DEVELOPMENTS; GENERAL TAGGING OF CROSS-SECTIONAL TECHNOLOGIES SPANNING OVER SEVERAL SECTIONS OF THE IPC; TECHNICAL SUBJECTS COVERED BY FORMER USPC CROSS-REFERENCE ART COLLECTIONS [XRACs] AND DIGESTS
- Y02—TECHNOLOGIES OR APPLICATIONS FOR MITIGATION OR ADAPTATION AGAINST CLIMATE CHANGE
- Y02E—REDUCTION OF GREENHOUSE GAS [GHG] EMISSIONS, RELATED TO ENERGY GENERATION, TRANSMISSION OR DISTRIBUTION
- Y02E60/00—Enabling technologies; Technologies with a potential or indirect contribution to GHG emissions mitigation
-
- Y—GENERAL TAGGING OF NEW TECHNOLOGICAL DEVELOPMENTS; GENERAL TAGGING OF CROSS-SECTIONAL TECHNOLOGIES SPANNING OVER SEVERAL SECTIONS OF THE IPC; TECHNICAL SUBJECTS COVERED BY FORMER USPC CROSS-REFERENCE ART COLLECTIONS [XRACs] AND DIGESTS
- Y04—INFORMATION OR COMMUNICATION TECHNOLOGIES HAVING AN IMPACT ON OTHER TECHNOLOGY AREAS
- Y04S—SYSTEMS INTEGRATING TECHNOLOGIES RELATED TO POWER NETWORK OPERATION, COMMUNICATION OR INFORMATION TECHNOLOGIES FOR IMPROVING THE ELECTRICAL POWER GENERATION, TRANSMISSION, DISTRIBUTION, MANAGEMENT OR USAGE, i.e. SMART GRIDS
- Y04S10/00—Systems supporting electrical power generation, transmission or distribution
- Y04S10/12—Monitoring or controlling equipment for energy generation units, e.g. distributed energy generation [DER] or load-side generation
- Y04S10/123—Monitoring or controlling equipment for energy generation units, e.g. distributed energy generation [DER] or load-side generation the energy generation units being or involving renewable energy sources
-
- Y—GENERAL TAGGING OF NEW TECHNOLOGICAL DEVELOPMENTS; GENERAL TAGGING OF CROSS-SECTIONAL TECHNOLOGIES SPANNING OVER SEVERAL SECTIONS OF THE IPC; TECHNICAL SUBJECTS COVERED BY FORMER USPC CROSS-REFERENCE ART COLLECTIONS [XRACs] AND DIGESTS
- Y04—INFORMATION OR COMMUNICATION TECHNOLOGIES HAVING AN IMPACT ON OTHER TECHNOLOGY AREAS
- Y04S—SYSTEMS INTEGRATING TECHNOLOGIES RELATED TO POWER NETWORK OPERATION, COMMUNICATION OR INFORMATION TECHNOLOGIES FOR IMPROVING THE ELECTRICAL POWER GENERATION, TRANSMISSION, DISTRIBUTION, MANAGEMENT OR USAGE, i.e. SMART GRIDS
- Y04S10/00—Systems supporting electrical power generation, transmission or distribution
- Y04S10/30—State monitoring, e.g. fault, temperature monitoring, insulator monitoring, corona discharge
-
- Y—GENERAL TAGGING OF NEW TECHNOLOGICAL DEVELOPMENTS; GENERAL TAGGING OF CROSS-SECTIONAL TECHNOLOGIES SPANNING OVER SEVERAL SECTIONS OF THE IPC; TECHNICAL SUBJECTS COVERED BY FORMER USPC CROSS-REFERENCE ART COLLECTIONS [XRACs] AND DIGESTS
- Y04—INFORMATION OR COMMUNICATION TECHNOLOGIES HAVING AN IMPACT ON OTHER TECHNOLOGY AREAS
- Y04S—SYSTEMS INTEGRATING TECHNOLOGIES RELATED TO POWER NETWORK OPERATION, COMMUNICATION OR INFORMATION TECHNOLOGIES FOR IMPROVING THE ELECTRICAL POWER GENERATION, TRANSMISSION, DISTRIBUTION, MANAGEMENT OR USAGE, i.e. SMART GRIDS
- Y04S10/00—Systems supporting electrical power generation, transmission or distribution
- Y04S10/50—Systems or methods supporting the power network operation or management, involving a certain degree of interaction with the load-side end user applications
-
- Y—GENERAL TAGGING OF NEW TECHNOLOGICAL DEVELOPMENTS; GENERAL TAGGING OF CROSS-SECTIONAL TECHNOLOGIES SPANNING OVER SEVERAL SECTIONS OF THE IPC; TECHNICAL SUBJECTS COVERED BY FORMER USPC CROSS-REFERENCE ART COLLECTIONS [XRACs] AND DIGESTS
- Y04—INFORMATION OR COMMUNICATION TECHNOLOGIES HAVING AN IMPACT ON OTHER TECHNOLOGY AREAS
- Y04S—SYSTEMS INTEGRATING TECHNOLOGIES RELATED TO POWER NETWORK OPERATION, COMMUNICATION OR INFORMATION TECHNOLOGIES FOR IMPROVING THE ELECTRICAL POWER GENERATION, TRANSMISSION, DISTRIBUTION, MANAGEMENT OR USAGE, i.e. SMART GRIDS
- Y04S40/00—Systems for electrical power generation, transmission, distribution or end-user application management characterised by the use of communication or information technologies, or communication or information technology specific aspects supporting them
- Y04S40/20—Information technology specific aspects, e.g. CAD, simulation, modelling, system security
Definitions
- the present invention relates to a system monitoring device and a program for monitoring the state of a system such as a power system.
- the power system is a large-scale system that is constructed and operated by combining many devices and control methods for stable power supply.
- the state of the power system can be expressed using physical quantities such as voltage, current, power, and frequency.
- the state of the power system has a planar spread along the configuration of the power system (hereinafter referred to as “system configuration”), and the state of the power system (hereinafter referred to as “system state”) is temporal. With change. Since the state of the power system varies greatly depending on the generator and the load connected to the power system, various facilities / devices and control methods are used to maintain a steady state.
- non-continuous state changes occur in the power system.
- there are active discontinuity state changes such as facility / equipment control, system configuration switching, generator on / off, etc.
- power system state changes include passive discontinuity.
- accidents that often hinder power supply can occur. Reduction of the power outage range at the time of an accident and shortening of the recovery time are indispensable requests to increase the supply reliability of the power system.
- the power system has many power fluctuation factors.
- accidents may occur in the power system due to natural disasters.
- the state occurring in the power system (the state of the power system) can be treated as a “relationship between cause and result” as a result.
- a technique is widely used in which a sensor is installed in the power system and a measurement signal output from the sensor is used for monitoring the power system.
- a sensor-equipped switch installed in a domestic power distribution system transmits a measurement signal obtained by sampling state values such as voltage and current to a server at a master station using a transmission means such as power line carrier technology and optical cable.
- technologies have been proposed that analyze the state of the power system, such as detecting accidents that occur in the power system, estimating the cause of the accident, and locating the accident (estimating the location where the accident occurred). .
- ⁇ When an accident occurs in the power system, a transient state change such as a sudden flow of current in the power system (sensor) may occur. If the cause of the accident can be estimated from a signal obtained by measuring the power system (hereinafter referred to as “measurement signal”), recovery work can be supported.
- a method of associating an equivalent circuit at the time of an accident with a measurement signal in an electric power system is called accident location.
- Patent Document 1 stores received monitoring information as recorded data, extracts a causal relationship between events, compares it with monitoring information recorded data, and calculates a conditional probability of each event defined in the event definition information
- a power system monitoring system is disclosed. This power system monitoring system performs probabilistic inference for the future power equipment state based on the conditional probability table, the observation event, and the causal relationship.
- Patent Document 1 described above inputs information to be measured in the power system, extracts events that occur in the power system based on the input information, and calculates the probability that the event will occur for future or past events in the power system. Techniques to do this are disclosed. However, the technique described in Patent Document 1 does not have a means for inputting information related to the outside (periphery) of the power system, and does not use it for calculating the probability. In reality, events that occur in the power system are often caused by causes outside the power system. For example, when a ground fault accident occurs on the distribution line, the front line approaches, the wind blows strongly, the tree shakes, the tree contacts the power line, and the ground fault accident occurs. A combination of multiple types of causes and results outside the power system can affect the power system and cause an accident.
- Patent Document 1 there is no means for inputting information relating to the configuration, topology (connection form), geographical arrangement (location), time, etc. of the power system.
- weather information is information that greatly depends on location and time. For this reason, even if a means for inputting weather information from the outside is prepared, it is impossible to correlate weather information with an event of the power system, and it cannot be used for improving the accuracy of probability calculation.
- the present invention has been made in consideration of the above-described situation, and reflects the information obtained from the outside of the target system so that the future state of the target system can be predicted.
- a system monitoring apparatus stores a state transition information including a plurality of states of a target system and a path of state transition from one state of the plurality of states to another state Is provided. Further, the system monitoring device includes an input unit that receives input of measurement information that is information measured by a sensor provided in the target system, and peripheral information related to the target system, and the input unit that receives the input A state detection unit that detects the current state of the target system from the measurement information is provided. Further, the system monitoring device is based on the current state of the target system detected by the state detection unit, the state transition information stored in the storage unit, and the peripheral information received by the input unit. And a transition probability calculation unit for calculating a transition probability from the current state to another state. Furthermore, the system monitoring apparatus includes a transition state determination unit that determines a next state that transitions from the current state based on the transition probability, and an output unit that outputs a determination result of the transition state determination unit.
- the prediction accuracy of the next transition state is improved by taking not only information obtained from the power system but also related peripheral information and using it for calculation of transition probability. To do. Problems, configurations, and effects other than those described above will be clarified by the following description of embodiments.
- the steady state is a state in which, for example, the state of the system is maintained within an appropriate range, and no trouble occurs on the management side and the use side of the system.
- the transient state refers to a state in which there is a change in time, and includes an intentional state change that occurs as a result of control, and an accidental state change that causes an inconvenience that is out of the appropriate range as in an accident.
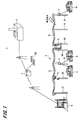
- FIG. 1 is a schematic diagram illustrating a configuration example of a general power system.
- the electric power system 1 is a system that supplies electricity generated by the power plant 2 to the customer U through a transmission line and a distribution line.
- electricity generated at the power plant 2 is sent to the distribution substation 4 via the primary substation 3 and the like by a transmission line.
- the primary substation 3 also receives electricity generated by the solar power generation facility 20.
- electricity is supplied from the distribution substation 4 to the consumer U through the distribution system 5. That is, the electricity transformed at the distribution substation 4 is sent to the consumer U through the distribution lines 6 suspended on the plurality of utility poles 10 and the pole transformer 7.
- a voltage regulator 8 (SVR), a sensor-equipped switch 9 and the like are provided in the middle of the distribution line 6.
- the power system is a complex system with many control devices and sensors connected for stable power supply.
- Various events that occur in the power system are observed as state quantities such as voltage, current, and power by sensors installed in the power system.
- An event is an event (phenomenon) that can cause a change in the state of a monitored object.
- state quantities can be signal-processed by collecting (measuring) them as time-series signals using some sensor such as a sensor-equipped switch.
- the event appearing in the measurement signal is observed as, for example, a steady gradual signal change (steady state) or a transient vibration waveform (transient state). In this way, the waveform appearing in the measurement signal can be handled as a result of the system. For example, if an accident occurs in the power system and a current flows rapidly, a transient vibration waveform is observed in the measurement signal. Thus, the cause that caused the event can be associated with the result that appears in the measurement signal.
- the power system 1 is a large-scale system having a wide area connected by electric wires.
- a ground fault may occur in which the distribution line 6 contacts the ground for some reason and current flows.
- the impedance between the cable used for the line and the ground is remarkably reduced, and a transient response waveform is generated when current flows from the line to the ground at the moment when the ground fault occurs on the line.
- the cause of the accident is contact between the cable and the tree, instantaneous contact may occur repeatedly.
- a contact thing may be heated and denatured by a ground fault current, for example, if it is a tree contact, ground fault resistance may change temporally by carbonization of a tree.
- the transient response waveform of the current generated at the time of the accident differs depending on the cause of the accident.
- the current flow in the power system 1 may change transiently, resulting in a malfunction in the power generation apparatus or the load apparatus, and a power outage due to a power supply trouble may occur.
- Such a change in state can be treated as a state transition from one state to another state.
- FIG. 2 is an explanatory diagram of the state transition of the system.
- the state is indicated by a circle and the transition path is indicated by an arrow.
- the state transition diagram of FIG. 2 from left to right, the state of the system in the past, the present, and the future, and possible state transitions from the past to the present and from the present to the future are described.
- Each state may be a state where an accident has occurred (transient state) or a stable state where there is no accident (steady state).
- the power system state is treated as a state including a steady state and a transient state.
- switching operations such as LRT and SVR in the distribution system, or system switching using switches
- One state transition may be set for such a switching operation, or it may be treated as an operation in a steady state.
- System state transitions can be created based on specifications at the time of system development, or can be created by analyzing observation results of system operations. If there is a specification, state transition can be determined with a clear basis. On the other hand, when the specification is ambiguous or does not exist, it is conceivable to make a state transition by using a method such as cluster classification or statistical processing using a measurement result of a sensor or the like.
- a transition is made from the past state s1 to the current state s2 via a transition path p1 (thick line) based on a certain cause. While there are a plurality of transition paths (causes) in the transition from the past state s1 to the current state s2, the transition is made through the transition path p1. That is, a state transition is caused mainly by some event, and the state transitions from the past state s1 to the current state s2.
- the states of the past and current systems are fixed, and if the past and current states are known, the cause of the state transition can be estimated.
- FIG. 2 also shows that the current state s2 moves to the future state s3 via a transition path p2 (thick line) based on a certain cause.
- p2 thin line
- the probability of occurrence of an event that may cause a state transition is calculated from currently acquired information (for example, measurement information and peripheral information), and the next state to be determined is determined.
- the transition path connecting the candidate state to the current state includes an event that causes an accident.
- FIG. 3 shows an overview of the overall configuration including the system monitoring apparatus according to the first embodiment of the present invention.
- the system monitoring device 30 monitors the state and state transition of a real system (monitored system) such as the power system 1.
- each embodiment of the present invention will be described using the power system 1 as an example of a monitoring target system.
- any system having a probabilistic relationship between a cause and a result regarding a state can be used without limiting the system. It goes without saying that the effect of can be realized. For example, it can be applied to a power generation system, a transportation system, a production system, and the like.
- the system monitoring device 30 inputs the measurement information measured by the sensor installed in the target system and the peripheral information that is considered to be related to the target system, and the next state that may transition from the current state of the system Predict. Also, the transition prediction and the basis for the transition prediction are presented to the operator who monitors and operates the system.
- the measurement information and the peripheral information include signals measured by a plurality of sensors, information published on the Internet, information calculated by simulation, and the like.
- the system monitoring device 30 includes means for inputting system information (system information) and peripheral information from the power system 1.
- the system information is information (measurement information) obtained by detecting the state of facilities, devices, and the like constituting the system (here, power system 1) with some sensor in the system.
- a switch 9 with a sensor (see FIG. 1) is installed on the line from the distribution substation 4 to the customer U, and the system state (voltage, current, etc.) is measured by the switch 9 with sensor.
- the sensor measurement signal can be collected by a server in the master station via a network N (for example, the Internet) using a power line carrier or optical cable technology.
- the data that affects the probability of an accident are: wire layout, facility / equipment capacity, load connection location and capacity, and distributed power supply connection location. And capacity. These can be classified into fixed values that can be known in advance and measured values collected by sensors installed in the system.
- the system information includes equipment / equipment history (hereinafter “equipment history data”).
- equipment / equipment history includes, for example, the installation year of the facility / equipment, the environment of the installation location, the number of times the switch of the facility / equipment operates, the past accident record of the facility / equipment, and the like.
- peripheral information refers to a wide variety of information surrounding the system (for example, power system 1).
- the peripheral information related to the state of the electric power system 1 includes weather information (such as weather forecast), calendar, map, human flow, and traffic. These peripheral information may be created or collected by a third party. Due to the recent development of network technology, an environment where these peripheral information can be used is being prepared. Is input.
- the peripheral information may include information that precedes the state change occurring in the power system 1 in time.
- weather data includes prediction information of weather conditions such as solar radiation, wind, and rain.
- weather conditions such as solar radiation, wind, and rain.
- the calendar also includes forecast (planned) information on holidays, some events, construction, etc. For example, when there is such a schedule, the probability that an accident will occur increases compared to other times.
- the map contains information on the density of consumers, the distribution of houses and trees that may cause contact accidents on electric wires, roads, etc. For example, power fluctuations are greater in regions with higher consumer density.
- a utility pole installed on the side of a road with a large amount of traffic has a higher probability of a traffic accident involving a utility pole or an electric wire than a utility pole installed on the side of a road with a small amount of traffic.
- these pieces of peripheral information do not necessarily need to know the relationship with the power system 1 in advance, and include cases where the relationship is found by some signal processing.
- the system monitoring device 30 uses peripheral information related to the system in addition to the measurement information of the system itself in order to determine the state transition of the system such as the power system 1.
- the system state may be influenced by the situation outside the system indicated by the peripheral information in addition to the situation inside the system indicated by the measurement information.
- the state of the power system 1 changes under the influence of the power generation amount of the photovoltaic power generation facility 20 that is one of the renewable energy power generation systems, but the power generation amount of the solar power generation facility 20 greatly depends on the weather conditions.
- weather conditions past, present, and future information can be obtained from meteorological information transmitted by the Japan Meteorological Agency.
- weather information that is not directly related to the power system 1 can be used to estimate or predict a change in the state of the power system 1.
- peripheral information may include information that precedes the system state in terms of time.
- the present invention is characterized by determining state transitions that are likely to occur or predicting state transitions by calculating transition probabilities of system state transitions using peripheral information in addition to system information (measurement information). To do. Therefore, the present invention extracts an event (cause) that causes a state transition (for example, an accident) from system information and peripheral information, and further assigns a probability of causing the transition to the event. As will be described later, when system information or peripheral information is input as a time-series signal, the time-series signal is converted into an event to which a probability can be assigned.
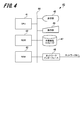
- FIG. 4 is a block diagram illustrating a hardware configuration example of the system monitoring device 30.
- the hardware configuration of the computer 40 applied to the system monitoring apparatus 30 will be described with reference to FIG.
- the computer 40 is hardware used as a so-called computer.
- the computer 40 includes a CPU (Central Processing Unit) 41, a ROM (Read Only Memory) 42, and a RAM (Random Access Memory) 43, which are arithmetic control devices connected to the bus 44, respectively.
- the computer 40 further includes a display unit 45, an operation unit 46, a nonvolatile storage 47, and a network interface 48.
- CPU41 (an example of a control part) reads the program code of the software which implement
- the computer 40 may include a processing device such as an MPU (Micro-Processing Unit) instead of the CPU 41.
- MPU Micro-Processing Unit
- the display unit 45 is, for example, a liquid crystal display monitor, and displays the results of processing performed by the computer 40 to the operator.
- a keyboard, a mouse, a touch panel, or the like is used as the operation unit 46, and an operator can perform predetermined operation inputs and instructions.
- Non-volatile storage 47 includes, for example, HDD (Hard Disk Drive), SSD (Solid State Drive), flexible disk, optical disk, magneto-optical disk, CD-ROM, CD-R, magnetic tape, nonvolatile memory card, and the like. Used. In addition to the OS (Operating System) and various parameters, the non-volatile storage 47 stores a program and data for causing the computer 40 to function. For example, the nonvolatile storage 47 corresponds to a history information storage unit 303, a state transition storage unit 304, a causal relationship storage unit 310, an event probability storage unit 311 and a support information storage unit 312 shown in FIG.
- a network interface 48 for example, a NIC (Network Interface Card) or the like is used, and various data can be transmitted and received between devices via a network N such as a LAN.
- a network N such as a LAN.
- FIG. 5 is a block diagram illustrating an internal configuration of the system monitoring apparatus 30.
- the function of each block of the system monitoring device 30 is realized by the CPU 41 in FIG. 4 executing a computer program stored in the ROM 42.
- the system monitoring device 30 includes an input unit 301, a state detection unit 302, a history information storage unit 303, a state transition storage unit 304, a transition probability calculation unit 305, a transition state determination unit 306, a display control unit 307, and a display unit 308. .
- the system monitoring apparatus 30 includes a cause estimating unit 309, a causal relationship storage unit 310, an event probability storage unit 311, and a support information storage unit 312. Further, the system monitoring apparatus 30 includes a state transition setting unit 321, a probability calculation method setting unit 322, a determination logic setting unit 323, and a probability setting unit 324.
- the input unit 301 inputs measurement information, which is information measured by sensors provided in the power system 1 that is a monitoring target system, and peripheral information related to the power system 1 via the network N (Internet or the like). Accept.
- This input unit 301 corresponds to the network interface 48 of FIG.
- the input unit 301 outputs the received measurement information and peripheral information to the state detection unit 302, the history information storage unit 303, and the transition probability calculation unit 305.
- the state detection unit 302 detects the current state (system state) of the power system 1 by analyzing the measurement information received by the input unit 301, and outputs the detection result to the history information storage unit 303.
- the history information storage unit 303 stores measurement information and peripheral information input from the input unit 301 in association with the date and time.
- the history information storage unit 303 stores the current state (system state) of the power system 1 input from the state detection unit 302 in association with the date and time.
- the measurement information and the peripheral information may be collectively referred to as “history information”.
- the state transition storage unit 304 is a state transition diagram (state transition information, including a plurality of states of the power system 1 and a transition path (route) of a state transition from one state to another state among the plurality of states. (See FIG. 2).
- the state transition storage unit 304 receives at least information on the current state of the power system 1 (and the latest (previous) state before reaching the current state) from the history information storage unit 303.
- the history information storage unit 303 and the state transition storage unit 304 correspond to the nonvolatile storage 47 of FIG.
- the transition probability calculation unit 305 includes the current state of the power system 1 detected by the state detection unit 302, the state transition information stored in the history information storage unit 303, and the peripheral information (event) received by the input unit 301. Based on the above, the probability (transition probability) that the power system 1 transitions from the current state to another state is calculated.
- the transition probability calculation unit 305 can grasp the most recent (past) state (state transition) before reaching the current state from the current state of the power system 1 and the state transition information.
- the state transition storage unit 304 may grasp the latest (past) state before reaching the current state and notify the transition probability calculation unit 305 of the past state. Then, the transition probability calculation unit 305 outputs the calculation result to the transition state determination unit 306.
- the transition state determination unit 306 determines the next state (state transition) to transition from the current state of the power system 1, and displays the determination result as a display control unit 307. Output to.
- the transition state determination unit 306 can also output determination logic of the determination result together with the determination result.
- the display control unit 307 is an example of an output unit, generates display data including the determination result of the transition state determination unit 306, and outputs the display data to the display unit 308.
- the display control unit 307 can generate display data including the determination result and the determination logic of the determination result and output the display data to the display unit 308.
- the display control unit 307 reads support information corresponding to the determination result (transition state or the like) from the support information storage unit 312 and outputs the support information to the display unit 308.
- the display unit 308 displays a screen based on the display data input from the display control unit 307.
- the display unit 308 corresponds to the display unit 45 in FIG.
- the cause estimating unit 309 takes in state transition information (including at least the current state) from the state transition storage unit 304, takes in a causal relationship from the causal relationship storage unit 310, and further causes the event probability storage unit 311 to reach the current state. Capture the probability of the event. And the cause estimation part 309 performs the process which estimates the cause with respect to the present state based on the present state of the electric power grid
- the causal relationship storage unit 310 the state (event) of the power system 1 is used as a result, and the causal relationship caused by the event causing the result is stored.
- This causal relationship is set in advance, but may be updated (corrected) based on history information (measurement information and peripheral information).
- the event probability storage unit 311 stores the probability of each event occurring. In addition, a correspondence relationship between an event that causes the current state and a probability that the event occurs is stored. Moreover, the prior probability and posterior probability used for probability calculation may be stored. In the present embodiment, an event as a result resulting from a combination of events as a plurality of causes is described by a conditional probability (Bayesian network) (see FIG. 10 described later), stored in the event probability storage unit 311, and input data The probability is sequentially updated using (measurement information, peripheral information).
- the causal relationship storage unit 310 and the event probability storage unit 311 correspond to the nonvolatile storage 47 of FIG.
- the support information storage unit 312 stores information (support information) for assisting the operator's work and judgment.
- the support information includes details of alarm information (FIG. 16), determination logic (FIG. 17), recovery support information (FIG. 18), precaution information (FIG. 19), and the like.
- the determination logic includes a state transition diagram and a determination basis (determination condition) as a basis for the state transition.
- the state transition setting unit 321 is based on the instruction from the operation unit 46 (FIG. 4), the state of the power system 1 (system) stored in the state transition storage unit 304, and the transition path between states (see FIG. 8). Set and modify.
- the probability calculation method setting unit 322 sets and corrects the transition probability calculation method by the transition probability calculation unit 305 based on an instruction from the operation unit 46.
- the determination logic setting unit 323 sets and corrects the determination logic of the determination result by the transition state determination unit 306 based on an instruction from the operation unit 46.
- the probability setting unit 324 sets and corrects the occurrence probability of each event stored in the event probability storage unit 311 based on an instruction from the operation unit 46.
- the measurement signal detected by the sensor installed in the power system 1 for the state of the power system 1 is a time-series signal sampled at an appropriate time interval.
- a time-series signal is a sequence of sampling values that are temporally continuous and has no break. Therefore, generally, a measurement signal is cut out from a time-series signal with a predetermined time width (time window) or the number of samples, and this is used as a unit of signal processing. Also, in the form of a time series signal, it is difficult to directly extract information as an event from the time series signal.
- information obtained by analyzing the measurement signal or a combination of information (features) is treated as an event, and a probability is assigned to each event.
- the combination of measurement signals can be enormous, so the probability is assigned by replacing the measurement signal with a feature amount by signal conversion.
- time-series signal when a part is extracted from a temporally continuous signal (time-series signal), the start and end on the time axis are determined. For example, a time width that includes a waveform at the time of an accident is determined, a combination of signals within the time width is extracted, and a feature amount is calculated by appropriate signal processing. Then, the procedure for shifting to the time for calculating the next feature value and extracting the signal combination is repeated.
- the state detection unit 302 converts the time series signal into a feature amount and handles it, so that the amount of data to be handled can be reduced compared to the case of handling the original time series signal.
- the waveform data has the characteristics of the time position (phase), but it is possible to collect information unrelated to the time position by converting the time series signal into the feature amount.
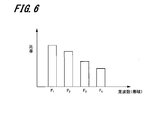
- FIG. 6 is a graph showing an example of analysis of a measurement signal.
- the horizontal axis of FIG. 6 indicates the frequency (band), and the vertical axis indicates the ratio of the frequency component of the target band to the whole. In this example, the ratio of the frequency component to the whole is shown for each of the frequency bands F1, F2, F3, and F4.
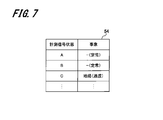
- FIG. 7 is a table showing an example of a correspondence relationship between the state of the measurement signal and the event according to the first embodiment.
- the state and event table 54 includes a measurement signal state field and an event field.
- the measurement signal state field has information indicating the state of the measurement signal of a certain sensor, and the event field has information on an event that has occurred in the system (power system 1).
- the state of the measurement signal is determined by, for example, the feature amount of the measurement signal.
- the states are classified into states A to C according to the feature amount, and in the states A and B, no event occurs (steady state), and the state C is associated with the ground fault (transient state).
- peripheral information Next, input and processing of peripheral information will be described.
- weather data, calendar, map, human flow, traffic, experience of operators, etc. are applied as the peripheral information.
- Such peripheral information may include information that precedes the state transition of the power system 1 in time.
- the weather forecast in the weather data is an example, and forecast data such as solar radiation, rainfall, and wind are available.
- the peripheral information is not limited to the above example.
- FIG. 8 is a diagram (state transition diagram) illustrating an example of state transition of the system.
- the system state is represented by a rectangle
- the transition path is represented by an arrow
- the direction from left to right represents the past, present, and future time passages.
- the relationship between states is represented as “state transition” having a temporal directionality of the past, present, and future.
- the probability of transition from one state to the next is treated as the “transition probability”.
- state transition information can be obtained by statistically processing past performance data, and can also be calculated by simulation for system analysis. Also, the subjective probability may be set based on the concept of Bayesian statistics. In real-time operation, it can be updated to real time based on measurement information input from the sensor to the system monitoring device 30.
- the state transition diagram of FIG. 8 there are three states s11, s12, and s13 at a time point before the current time, the state s11 further passes through the transition path p01 from the past state, and similarly, the state s12 is the transition path p02. Then, the state s13 transits to each state via the transition path p03.
- a state s21 via the transition path p11 and a state s22 via the transition path p12 are candidates for the transition destination of the past state s11. Further, there are a state s21 via the transition path p21, a state s22 via the transition path p22, and a state s23 via the transition path p23 as candidates for the transition destination of the state s12. Further, there are a state s22 via the transition path p32 and a state s23 via the transition path p33 as candidates for the transition destination of the state s13.
- a state s31 and a state s32 exist as candidates for the transition destination of the state s21 at the current time. Further, there are a state s31, a state s32, and a state s33 as candidates for the transition destination of the state s22. Further, there are a state s32 and a state s33 as candidates for the transition destination of the state s23. Further, the state s31 goes through the transition path p1, the state s32 goes through the transition path p2, and the state s33 goes through the transition path p3 to the next state.
- state transition diagram is recorded with the state transition information accompanying the system state change.
- This state transition diagram (that is, state transition information) is stored in the state transition storage unit 304.
- transition probability calculation method by the transition probability calculation unit 305 will be described.
- the probability that an event occurs when a plurality of causes are combined is expressed as the joint probability of each cause.
- the joint probability can be expanded to a conditional probability using Bayes' theorem. For example, when there are causes X1, X2, and X3, the simultaneous probability P (X1, X2, X3) that these causes occur simultaneously can be expanded as shown in Equation (1).
- transition probability in which multiple causes are combined in this way can be described as a joint probability, and the joint probability can be expressed as a product of conditional probabilities. That is, there is a relationship of multiplying individual causes as conditional probabilities.
- FIG. 9 is an explanatory diagram illustrating an example of a relationship between a cause and a result according to the first embodiment.
- tree contact is taken up as an accident occurring in the power system, and the relationship between the cause and the result is illustrated.
- the diagram is simplified to show the relationship between the causes and results of wind, tree shaking, and electric wire ground faults.
- X1 be an event of wind blowing
- X2 an event of tree shaking
- X3 an event of ground fault.
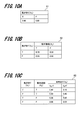
- FIG. 10 is an explanatory diagram showing an example of conditional probabilities of causes and results according to the first embodiment.
- 10A is a table 51 of the probability of wind blowing (X1)
- FIG. 10B is a table 52 of the probability of tree shaking (X2)
- FIG. 10C is a table 53 of the probability of ground fault (X3).
- T and F are logical terms representing true (T) and false (F).
- the probability of the result from the cause is prepared.
- the occurrence of a ground fault caused by tree swing (tree contact) and the occurrence of a ground fault caused by a broken wire can be prepared in advance by statistically processing past performance data.
- the probability that the wind blows (X1) can be obtained from the weather forecast included in the surrounding information. Accordingly, the probability that the caused ground fault is caused by the wind blowing (X1) is calculated using Bayes' theorem (Bayes's formula).
- the result is that the tree sways (X2).
- a ground fault (X3) occurs in the electric wire due to the cause of the swaying tree. From the probabilistic relationship between each cause and result, it is possible to calculate the probability (conditional probability) that a ground fault will occur due to wind blowing. Probabilities are similarly calculated for other possible causes, and it can be determined that the cause having the largest probability value is most likely to occur. Since the state of the power system and the probability of the cause change from time to time, the probability is sequentially calculated and the determination is repeated.
- Equation (3) The probability that the ground fault accident (X3) due to tree contact is caused by the wind blowing (X1) is expressed by equation (3).
- the transition probability calculation unit 305 outputs the transition probability calculated in this way to the transition state determination unit 306.
- Bayes' theorem relates prior probabilities and posterior probabilities (sometimes called inverse probabilities).
- the occurrence probability of the cause Ei is P (Ei) and the probability that the event F appears at the cause Ei is P (F
- the probability that the cause is Ei can be calculated by the equation (5).
- the magnitudes of the posterior probabilities P (Ei) corresponding to the respective causes are compared, and the cause having the highest probability is determined to be the most likely.
- the cause Ei of the accident is a cause of an accident such as a tree contact or a bird contact, and the number and cause of the accidents that have occurred in the past are often known.
- the appearance probability P (Ei) of the cause Ei can be prepared.
- the waveform that appears in the measurement signal when the cause Ei occurs can be obtained by prior experiments, simulations, or the like. This waveform can be input to the state detection unit 302, for example, and the feature amount of the waveform can be calculated by appropriate signal processing.
- the probability of the cause Ei is calculated by the following equation (7). Then, it is determined that the cause Ei having the largest posterior probability P (Ei) is the most likely cause.
- the frequency component is focused here, the waveform amplitude attenuation rate at the time of the accident, the waveform rising characteristics, and the like can be used.
- probabilities relating to some state values other than time series signals can be combined.
- the probability of the cause Ei can be calculated by combining the probabilities of a plurality of feature amounts.
- a combination of a plurality of frequency bands and component ratios (probabilities) is treated as an event Fj
- the probabilities of other events can be combined.
- the combination of the frequency band and attenuation rate obtained by the Proni analysis as described above may be treated as an event, and the probability assigned.
- it is determined that the cause Ei having the largest posterior probability P (Ei) is the most likely cause.
- this procedure corresponds to a filter for removing noise.
- the present embodiment is characterized in that a significant event is found by repeating the combination of event detection and cause estimation described above.
- two methods are prepared for setting the prior probability at the initial stage. First, prepare the means to input the past data related to the target system from the outside and the means to calculate the probability by statistical processing (simulation) using the data about the target system obtained from the outside, the initial probability This is a method of preparing data.
- the second is a method that uses the concept of subjective probability for the prior probability set at the initial stage based on Bayesian statistics.
- the subjective probability is an a priori probability that is set subjectively by the operator based on the experience and knowledge of the operator who knows the monitored system well.
- the method using the subjective probability does not necessarily require statistical processing (specific statistical data) of past data.
- Bayesian statistics there is a procedure called Bayesian updating in which the above-described prior probabilities are updated sequentially. By sequentially replacing prior probabilities using posterior probabilities, even if there is subjective judgment on the initial value of prior probabilities, prior probabilities are gradually corrected based on measurement signals (results). Can do. It is also possible to use a combination of the above two setting methods.
- FIG. 11 is a flowchart illustrating processing for calculating the transition probability of the state transition of the system according to the first embodiment.
- the transition probability calculation process of FIG. 11 is realized.
- the input unit 301 of the system monitoring apparatus 30 takes in sensor measurement information and peripheral information via the network N (S1).
- the state detection unit 302 detects the current state (system state) of the power system 1 from the measurement information received by the input unit 301, and outputs the detection result to the history information storage unit 303.
- the transition probability calculation unit 305 takes in state transition information (including the system state) from the state transition storage unit 304 (S2).
- the transition probability calculation unit 305 calculates the probability of transition from the current state to the next state (transition probability) (S3). That is, the transition probability calculation unit 305 includes the current state of the power system 1 detected by the state detection unit 302, the state transition information stored in the history information storage unit 303, and the peripheral information received by the input unit 301. First, the transition probability with the next state that can transition from the current state is calculated.
- transition probability calculation unit 305 outputs the calculation result of the transition probability to the transition state determination unit 306 (S4). After the process of step S4 is completed, a series of transition probability calculation processes are terminated.
- the transition state determination unit 306 determines the transition state. That is, the next state with a high possibility of transition from the current state is predicted.
- the determination result of the transition state determination unit 306 is input to the display control unit 307, and the determination result is displayed on the display unit 308.
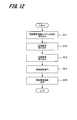
- FIG. 12 is a flowchart showing cause estimation processing according to the first embodiment.
- the CPU 41 executes the computer program stored in the ROM 42, thereby realizing the cause estimation process of FIG.
- the cause estimating unit 309 of the system monitoring device 30 takes in the state transition information (the current state of the power system 1) from the state transition storage unit 304 (S11).
- the cause estimating unit 309 fetches the causal relationship that is the relationship between the cause (event) and the result (state) related to the state transition information from the causal relationship storage unit 310 (S12).
- the cause estimating unit 309 takes in the probability of an event related to the state transition information from the event probability storage unit 311 (S13).
- the cause estimating unit 309 executes cause estimation for the current state based on the current state of the power system 1, the causal relationship, and the probability of the corresponding event (S14).
- the cause estimating unit 309 outputs an estimation result (estimated cause) to the display control unit 307 (S15).
- the estimated cause is input to the display control unit 307, and the estimated cause is displayed on the display unit 308.
- FIG. 13 is an explanatory diagram illustrating an example of the cause of an accident that exists in the power system according to the first embodiment.
- 13A shows the system configuration 60
- FIG. 13B shows the wind speed distribution 70
- FIG. 13C shows the equipment characteristics 80
- FIG. 13D shows the tree distribution 90.
- the power system is a system with a wide area.
- measurement information and peripheral information have a wide spread. Therefore, the probabilities indicating these relationships are also distributed with a wide spread.
- the relationship between the target system, measurement information, peripheral information, probability, and the like can be expressed as a field having a spatial distribution (hereinafter referred to as “probability field”).
- the probability is handled as spatially spread distribution information.
- the probability is set as a value associated with some condition, such as a dice eye and an appearance probability (in this case, a uniform distribution).
- a spatial position is given as one of the conditions so that the weather information has a geographical distribution of the probability of fine rain.
- This space may be a two-dimensional coordinate based on a map, or may be a multidimensional space having a large number of indices.
- the probability set in space is also a function of time. For example, you may update sequentially based on the distribution result of the probability calculated from measurement information and peripheral information.
- a spatial probability calculation becomes possible. And the probability of the point can be calculated by reading various indexes at the same geographical point.
- FIG. 13A a schematic diagram of the power system is described.
- Two circuit breakers (CB) are connected in series on the load (customer) side of the distribution transformer 4T of the distribution substation 4.
- three loads and two power sources are connected to the system between the circuit breakers.
- the power source for example, a solar power generation facility or the like is applied.
- the circuit breaker with two black circles (left side in the figure) indicates closed, and the circuit breaker with two white circles (right side in the figure) indicates open, and a triangle pointing to the right on the power system (4 in this example) represents a switch.
- the wind speed distribution 70 in FIG. 13B is expressed by being superimposed on the schematic diagram of the power system having the same contents as the system configuration 60.
- An arrow 71 in FIG. 13B represents the wind direction and the wind speed. The thicker the arrow 71, the higher the wind speed.
- the facility characteristic 80 in FIG. 13C is expressed by being superimposed on the schematic diagram of the power system having the same contents as the system configuration 60.
- FIG. 13C shows that the installation years of equipment in a certain load section 81 on the power system are long.
- the tree distribution 90 in FIG. 13D is expressed by being superimposed on the schematic diagram of the power system having the same contents as the system configuration 60.
- the influence ranges 91 and 92 of two trees are shown in the vicinity of the power system.
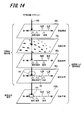
- FIG. 14 is an explanatory diagram showing a random field and probability calculation in a multidimensional space according to the first embodiment, and shows a procedure of probability calculation using a spatial random field.
- the electric power system is a system with a wide area, and there are a plurality of causes and results, and they have a distribution depending on the surface area. Therefore, in this embodiment, a layer having a surface spread is prepared, the surface distribution of the cause is shown in each layer, and the layers are spatially arranged.
- the 14 includes a layer 60L of the system configuration 60, a layer 70L of the wind speed distribution 70, a layer 80L of the facility characteristics 80, and a layer 90L of the tree distribution 90 in order from the top.
- the bottom row shows the accident prediction layer 100L that represents the probability (conditional probability) of the result obtained by combining the cause probabilities shown in the layers 60L to 90L.
- the combination probability is calculated by combining the probabilities of the causes at the same position in each layer 60L to 90L, and the calculation position is indicated by an arrow 102 in the figure. By scanning this calculation position within the plane of each layer, a planar probability distribution can be calculated. In FIG. 14, the calculation position coincides with the accident prediction point 101 of the ground fault on the power system.
- This embodiment is characterized in that the above-described spatial random field is used to display the screen as a means for explaining the relationship between the cause and the result.
- the overlapping of a plurality of layers can be displayed on the display unit 45 by a so-called three-dimensional graphics method, and the viewpoint can be switched in an arbitrary direction, or the display contents can be rewritten in real time.
- the viewpoint by moving the viewpoint in the direction orthogonal to the layer and displaying it on the screen, it becomes a two-dimensional display, which can be displayed in the same way as paper materials or conventional screen display.
- FIG. 15 is an explanatory diagram showing an example of calculating and setting the spatial distribution of probabilities in the spatial random field according to the first embodiment.
- the growth location of a tree is a point, but when there is a risk of contact with an electric wire due to shaking by the wind, the influence range of the tree becomes a spatial distribution. This range of influence is expressed as a spatial distribution of probabilities.
- a two-dimensional normal distribution can be used on a two-dimensional plane such as a map. Then, by multiplying the growth points 95 and 96 of the tree in the spatial tree position information 90A by the probability distribution 99, the spatial probability distribution (layer 90L) of the tree is calculated and set.
- This multiplication operation can be performed using convolution integration.
- the cause of such a transition state and / or the probability of the result is stored in the nonvolatile storage 47 as spatial distribution data in which the probability is spatially distributed.
- the present embodiment includes means (operation unit 46) for setting (range setting, probability setting) such a spatial distribution of such probabilities, and means (display unit 45) for displaying.
- this embodiment can perform calculation using a spatial filter such as differentiation and integration in a spatial random field.
- a spatial filter such as differentiation and integration in a spatial random field.
- effects such as noise removal (integration type filter) and edge enhancement (differential type filter) can be obtained.
- the random field is used as the object of the spatial filter, if the integral filter is applied, there is an effect of expanding the influence range of the probability. Also, applying a differential filter has the effect of finding a place where the probability condition changes.
- 16 to 19 show examples of operation screens provided to the operator.
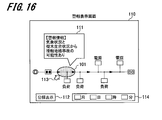
- FIG. 16 is a diagram illustrating an example of the alarm display screen 110 according to the first embodiment.
- an alarm information display window 111 is displayed.
- a warning message “There is a possibility of a contact ground fault from weather information and tree growth status” is displayed.
- the alarm display screen 110 in FIG. 16 displays a disassembly display button 112.
- the alarm display screen 110 is displayed in a plurality of layers (spatial areas as shown in FIG. It is disassembled and displayed in a random field. As a result, the operator can grasp a place where an accident is highly likely to occur and can quickly take measures against the accident.
- the alarm display screen 110 in FIG. 16 has a date / time input field 114.
- a date / time input field 114 When the operator inputs a date and time to be viewed in the date and time input field 114, an alarm display screen 110 of the input date and time is displayed. Thereby, the operator can confirm necessary information by specifying the date and time.
- This date / time input field 114 may be displayed not only on the alarm display screen 110 but also on other screens shown in FIGS.
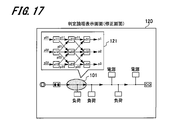
- FIG. 17 is a diagram illustrating an example of the determination logic display screen (correction screen) 120 according to the first embodiment.
- the logic (state transition diagram) display window 121 (see FIG. 8) used for the state transition prediction is displayed.
- the determination logic information is not limited to the state transition diagram, and the determination condition in the transition state determination unit 306 may be displayed.
- the determination condition is, for example, “the state transition with the highest transition probability is the most likely state transition”. However, when the difference in transition probability among a plurality of state transitions is small, a determination condition such as giving priority to past results may be used.
- a probability calculation process (for example, FIG. 9, FIG. 10, etc.) may be displayed on the display window 121 as a basis for prediction.
- the operator may correct the state transition determination logic displayed on the display window 121 by operating the operation unit 46. For example, a state in the state transition diagram or a transition path between states is specified, and the state transition is corrected.
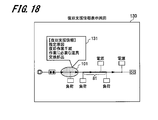
- FIG. 18 is a diagram illustrating an example of the recovery support information display screen 130 according to the first embodiment.
- a recovery support information display window 131 showing a recommended procedure for recovery work when an accident occurs in the power system 1 is displayed.
- the display window 131 displays items such as “estimated cause”, “recovery work procedure”, “tool required for work”, “replacement part”, and the like. Thereby, it is possible to support the operator's recovery work and determination.
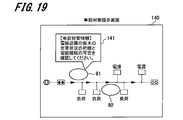
- FIG. 19 is a diagram showing an example of the precautionary measure presentation screen 140 according to the first embodiment.
- the display window 141 for the precautionary measure information is displayed.
- a precaution message “Please confirm the growth status of trees in the vicinity of the electric wire and check whether or not the electric wire can be contacted” is displayed.
- the operator can prevent the accident beforehand by grasping in advance the place where the accident is likely to occur and taking a countermeasure in accordance with the presented preliminary countermeasure information.
- GUI graphical user interface
- the probabilities of these individual causes are prepared, and the probability that an accident will occur as a result of the combination of these causes is calculated.
- the probability of each cause may vary over time and geographically and may be updated sequentially to reflect the latest state.
- This kind of probabilistic relationship can be expressed using techniques such as Bayesian networks, hierarchical Bayes, or Bayes graphical models.
- the present embodiment is not limited to the notation method of these stochastic relationships.
- This embodiment calculates a probability when a plurality of causes are combined as a conditional probability.
- formula setting and transformation based on Bayes formula (Bayes's theorem) are used.
- the probability of the cause is calculated from the actual result by referring to the probabilistic relationship between the cause and the result of the power system accident prepared in advance.
- a probability calculation based on the Monte Carlo method can be used.
- MCMC method Markov Chain Monte Carlo method
- methods belonging to the MCMC method there are a metropolis method and a Gibbs sampling.
- this embodiment includes means for ensuring and verifying system reliability. Specifically, it includes means for presenting the probability calculation procedure and results to the operator, means for correcting the probability calculation procedure by the operator, means for executing the prepared probability calculation procedure on a trial basis, and the like.
- the above-mentioned conventional method can express the cause and the result as a probability in a one-to-one relationship, but cannot associate an accident caused by combining a plurality of types of causes and results.
- This also has the same problem in the clustering method that is a signal classification method.
- the internal logic is often not explicitly understood, and it is often difficult to explain the validity of the internal logic, that is, the output.
- transition prediction result and the basis of the transition prediction (FIG. 17) to the person in charge of monitoring and operating the power system 1, there is an effect of supporting the judgment in the work procedure.
- accidents can be prevented in advance by the advance countermeasures of the electric power system 1 (FIG. 19), and the power failure time can be reduced.
- it is effective in shortening the time required for the restoration work by presenting to the person in charge a plausible accident cause (FIG. 18) in response to the accident that occurred.
- the effect of improving the prediction accuracy can be obtained by noting the specificity as a probability (FIGS. 13 and 14) and reflecting it sequentially and repeatedly. is there.
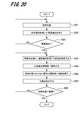
- FIG. 20 is a flowchart showing an accident recovery procedure according to the first embodiment.
- the state of the power system 1 detected by the CPU 41 for example, the state detection unit 302 of the system monitoring device 30 is a steady state (S21).
- the state detection unit 302 detects an event using the measurement signal received by the input unit 301 (S22).
- the state detection unit 302 determines whether any event has occurred in the power system 1 (S23). If no event has occurred (NO in S23), the process returns to step S21.
- the cause estimating unit 309 estimates the cause of the event using the transition probability (S24).
- the display control unit 307 presents a countermeasure plan on the display unit 308 based on the determination result of the cause estimation unit 309, and prompts the operator to make a determination (S25). If the cause is not found, the operator is prompted to make a determination (S26). Note that the process of “prompt the operator to make a determination when no cause is found” in the process of step S25 will be described in detail in a first modification of the first embodiment to be described later.
- the display control unit 307 displays a countermeasure on the display unit 308 to instruct the operator of the countermeasure (S27). This process is judged including whether to instruct countermeasures depending on the content of the abnormality, such as in the case of a significant abnormality such as a major failure of equipment or equipment.
- the worker starts the accident recovery work and confirms the accident removal. After the confirmation of the accident removal, the accident recovery is performed.
- the state detection part 302 judges whether the electric power grid
- step S28 if the process returns to the steady state in step S28 (YES in S28), the series of accident recovery processing is terminated.
- the system monitoring device 30 can estimate the cause, present the countermeasure plan, and the like, thereby reducing the manual intervention procedure. Therefore, the cause can be estimated quickly, and the restoration work can be accelerated compared to the conventional method.
- First Modified Example of First Embodiment> [Rare cases, irrational, unexpected, unrelated]
- probabilistic situations such as likelihood, consistency, contradiction, and contradiction may occur (S26 in FIG. 20).
- the first modification of the first embodiment is characterized by prompting the operator's judgment by showing the probabilistic situation to the operator.
- Probability data prepared in advance cannot include causes and results that cannot be assumed in advance. For example, it is difficult to set a stochastic relationship for an event that causes an extremely large-scale accident because of its low frequency. When a result is caused by such a cause, a probable cause is obtained by the above-described cause estimation procedure. However, since the original cause is not prepared in advance, the likelihood is low. This situation can also occur when noise enters the measurement signal. In the first modification of the first embodiment, when the likelihood of the probabilistic relationship between the cause and the result is low, the operator's judgment is prompted by presenting the situation to the operator.
- a rarely occurring state may be taken into a high-frequency state and cannot be distinguished. If the measurement signal is not related to the cause prepared in advance, it is determined as noise and excluded. Accordingly, a significant signal is passed through the state detection unit 302, and the state detection unit 302 operates as a filter that eliminates noise. The accuracy of signal analysis can be improved by eliminating noise. Further, by eliminating noise, it is possible to eliminate erroneous dispatch of accident recovery work.
- the contents of the plurality of measurement signals may not match.
- the cause estimated from the measurement signal is a tree contact, but the weather data obtained as another measurement signal indicates that there is no wind, the tree sways and touched the track even though there was no wind As a result, the cause and the result are not consistent. Whether any information contains noise or whether the tree has shaken for an unexpected reason cannot be determined from the association between the previous cause and the result.
- the cause estimated from the measurement signal is tree contact
- the map data obtained as another measurement signal indicates that there is no tree near the power system. The cause and the result are inconsistent.
- the operator's judgment is prompted by presenting the contradiction to the operator.
- the first modified example of the first embodiment has a means for prompting a judgment by presenting the contradictory situation to the operator, assuming that an accident that has not been anticipated in advance may have occurred.
- Second Modification of First Embodiment> [Acceleration, asynchronous access]
- information such as a state having a possibility of transition, the cause of transition, and the probability of transition is read from the storage unit and used.
- the storage unit include a data center and a cloud system that are accessed via the network N in addition to a memory and a hard disk.
- the system monitoring device 30 when the system monitoring device 30 calculates the probability related to the state transition, the system monitoring device 30 issues a related information search without waiting for the instruction of the related data operator, and performs a high-speed buffer. To accumulate. As a result, when an instruction from the operator is issued, the system monitoring apparatus 30 realizes a high-speed response by performing data access to the buffer. In other words, the data search is performed asynchronously based on the state transition. The related data that has been retrieved asynchronously and accumulated in the buffer can be read out at a very high speed because it can be read out from the buffer.
- Second Embodiment> [Probability calculation by particle filter]
- the Kalman filter is widely used as a method for sequentially calculating probabilistic likelihood states for a noisy system.
- the particle filter that is a derivation method is a numerical calculation method that approximates a probability distribution with a large number of particles, and has a feature that it can handle a non-linear, non-Gaussian system.
- the calculation amount increases because the calculation is repeatedly performed using a large number of particles.
- the particle filter is a probability calculation method having high flexibility, but the calculation time becomes a problem. Although it can be expected to improve the performance of computers in the future, it can be used as a differentiating technique if it can speed up calculations. In the following, a method for high-speed computation of the particle filter will be examined.
- xt is a state vector
- yt is an observation vector
- wt is system noise
- vt observation noise
- F is a system equation
- h is an observation equation.
- the subscript t indicates a time step. System noise generated in the system is sampled by an observer that generates observation noise, and the most probable state value is calculated when both types of noise exist. Note that a system with one input and one output can be simply expressed as in equations (11) and (12).
- the estimated value can be obtained analytically.
- events that cause accidents do not always have a normal distribution. Since the particle filter approximates the probability distribution with a large number of particles, there is no restriction on the shape of the probability distribution.
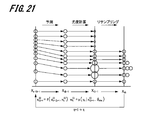
- FIG. 21 is an explanatory diagram showing a typical calculation procedure of the particle filter.
- the particle filter has a property that the weight of the particles (wt (i) in FIG. 21) changes in the calculation process. Therefore, a procedure for normalizing the weight and the number of particles is necessary for each repeated calculation. This is a process for characterizing the particle filter called resampling.
- FIG. 21 and FIGS. 22 and 23 to be described later are extracted from “Tomoyuki Higuchi,“ Basics of Statistical Modeling Utilizing Prediction ”, Kodansha, 2011”.
- a general description of the Kalman filter is described in detail in “Toru Katayama,“ Nonlinear Kalman Filter ”, Asakura Publishing, 978-4-254-20148-2”.
- Calculating the particle filter is a mixture of processing that handles individual particles and processing that handles all particles. Among them, resampling is aimed at normalization, and is an operation that handles the whole particle. Speeding up is an important requirement when considering the application of probability calculation to accident response. Accordingly, the inventors focused on resampling processing and studied a new high-speed method that replaces the conventional method.
- FIG. 22 is a graph showing a general resampling process procedure of the particle filter.
- a general resampling process procedure will be described with reference to FIG.
- the resampling process is interpreted as canceling the error caused by the integer conversion of individual particles as a whole. It is noted that this procedure is not specific to the particle filter and is similar to error diffusion processing known in the field of image processing. For example, if a multilevel signal is input per pixel and output by a binary level printer, an error occurs in input / output. By passing this error to adjacent pixels and canceling the error for the entire screen, an output image corresponding to a multi-value level can be obtained with a binary-level printer.
- FIG. 23 shows the procedure of the resampling processing of the particle filter using error diffusion.
- Calculation of the number of particles from the particle size (weight) wt (i) corresponds to converting the size into an integer, and the decimal part remains as an error. By diffusing the remaining error to adjacent particles (arrows in the figure), the error is canceled as a whole.
- the program can be realized by a simple procedure of converting the particle size wt (i) into an integer, calculating an error, and correcting the weight of an adjacent particle. In this method, the processing is completed between the particle and the adjacent particle, and it is not necessary to refer to the entire particle. As a result, the number of processing steps is reduced, contributing to speeding up, and the possibility of implementing parallel processing appears.
- the error that occurs in the last particle is a residual because there is no particle to receive.
- the probability distribution may be biased depending on how the particles that diffuse the error are selected. However, these effects will be minor if the total number of particles is large. Furthermore, these influences can be reduced by making the error diffusion destination a plurality of particles.
- the above-described exemplary embodiments are detailed and specific descriptions of the configuration of the apparatus and the system in order to explain the present invention in an easy-to-understand manner, and are not necessarily limited to those having all the configurations described above. . Further, it is possible to replace a part of the configuration of one embodiment with the configuration of another embodiment. In addition, the configuration of another embodiment can be added to the configuration of a certain embodiment. Moreover, it is also possible to add, delete, and replace other configurations for a part of the configuration of each exemplary embodiment.
- each of the above-described configurations, functions, processing units, processing means, and the like may be realized by hardware by designing a part or all of them with, for example, an integrated circuit.
- Each of the above-described configurations, functions, and the like may be realized by software by interpreting and executing a program that realizes each function by the processor.
- Information such as programs, tables, and files for realizing each function can be stored in a recording device such as a memory, a hard disk, or an SSD (Solid State Drive), or a recording medium such as an IC card, an SD card, or a DVD.
- control lines and information lines indicate what is considered necessary for the explanation, and not all the control lines and information lines on the product are necessarily shown. Actually, it may be considered that almost all the components are connected to each other.
- processing steps describing time-series processing are not limited to processing performed in time series according to the described order, but may be performed in parallel or It also includes individually executed processes (for example, parallel processing or object processing).
- State transition storage unit 305 ... Transition probability calculation unit, 306 ... Transition state determination unit, 307 ... display control unit, 308 ... display unit, 309 ... cause estimation unit, 310 ... causal relationship storage unit, 311 ... event probability storage unit, 312 ... support information storage section, 321 ... state transition setting unit, 322 ... probability calculation method setting unit, 323 ... decision logic setting unit, 324 ... probability setting unit
Landscapes
- Engineering & Computer Science (AREA)
- Power Engineering (AREA)
- Remote Monitoring And Control Of Power-Distribution Networks (AREA)
- Supply And Distribution Of Alternating Current (AREA)
Abstract
本発明の一態様は、対象システムに設けられたセンサで計測された情報である計測情報、及び対象システムに関わりを持つ周辺情報の入力を受け付ける入力部と、受け付けた計測情報から、対象システムの現在の状態を検知する状態検知部と、該状態検知部で検知された対象システムの現在の状態と、対象システムの状態遷移情報と、受け付けた周辺情報とを元に、現在の状態から他の状態への遷移確率を算出する遷移確率算出部と、算出した遷移確率に基づいて現在の状態から遷移する次の状態を判定する遷移状態判定部とを備える。
Description
本発明は、電力系統等のシステムの状態を監視するシステム監視装置及びプログラムに関する。
電力系統は、電力の安定供給のために多くの機器と制御方法を組み合わせて構築及び運用されている大規模システムである。電力系統の状態は、電圧、電流、電力、周波数等の物理量を用いて表記することができる。電力系統の状態は、該電力系統の構成(以下「系統構成」と記す。)に沿って面的な広がりを持つとともに、電力系統の状態(以下「系統状態」と記す。)は時間的な変化を伴う。電力系統に連系する発電機と負荷によって、電力系統の状態は大きく変化するので、定常状態を維持するように様々な設備・機器と制御方法が利用されている。
電力系統には、連続的な状態変化のほかに、非連続な状態変化が起こる。即ち、電力系統の状態変化には、設備・機器の制御、系統構成の切り替え、発電機のオンオフ等の能動的な非連続性の状態変化がある一方で、受動的な非連続性として事故の発生がある。電力系統においては、しばしば電力供給に支障をもたらす事故が発生することがある。事故時の停電範囲の縮小、復旧時間の短縮は、電力系統の供給信頼度を高めるために必須の要請となっている。
しかし、近年、再生可能エネルギーの導入が進み負荷特性が多様化することで、電力系統は、多くの電力変動要因を備えている。また電力系統には、自然災害などによって偶発的な事故が発生することがある。これらを原因とするとき、電力系統に起きる状態(電力系統の状態)を結果として、「原因と結果の関係」として扱うことができる。
ところで、人間によって原因と結果の関係を推定する場合、担当者の経験、知識、体調などの個人的なばらつきが入り込む。ここで、原因と結果の関係を推定する処理を、計測信号を用いた信号処理で実現できるならば、ばらつきを減らした高速動作が期待できる。
例えば、近年の情報通信技術の進展により、高速にデータ伝送することが可能になってきている。そこで、電力系統にセンサを設置して、センサが出力する計測信号を電力系統の監視に活用する技術が普及している。例えば、国内配電系統に設置されているセンサ付き開閉器は、電圧・電流等の状態値をサンプリングした計測信号を、電力線搬送技術、光ケーブル等の伝送手段を使って親局のサーバに伝送する。そして、電力潮流等の物理量のほか、電力系統に起きる事故の検出、事故原因の推定、事故点標定(事故の発生した箇所の推定)などの電力系統の状態を解析する技術が提案されている。
電力系統に事故が起きたとき、電力系統(センサ)に電流が急激に流れるなどの過渡的な状態変化が起きることがある。電力系統を計測して得られる信号(以下「計測信号」)から、事故原因が推定できるならば、復旧作業を支援できる。電力系統において、事故時の等価回路と計測信号を対応付ける方法は、事故点標定と呼ばれている。
特許文献1には、受信した監視情報を記録データとして保存し、事象同士の因果関係を抽出して監視情報記録データと比較し、事象定義情報に定義された各事象の条件付き確率を計算する電力系統監視システムが開示されている。この電力系統監視システムは、条件付き確率表と観測事象と因果関係とに基づき、将来の電力設備状態に対する確率推論を行う。
上述した特許文献1には、電力系統において計測する情報を入力し、入力情報を元に電力系統で起きる事象を抽出して、電力系統の将来または過去の事象についてその事象が発生する確率を計算する技術が開示されている。しかし、この特許文献1に記載の技術では、電力系統の外部(周辺)に関する情報を入力する手段を持たず、また確率の計算に利用していない。現実には、電力系統に起きる事象は、電力系統の外部にある原因によって引き起こされることが多い。例えば配電線に地絡事故が起きた場合を例にとると、前線が近づいて、風が強く吹いて、樹木が揺れて、電線に樹木が接触して、地絡事故が発生するというように、電力系統の外部にある複数種類の原因と結果が組み合わされて、電力系統に影響を与えて事故が引き起こされることがある。
しかし、上記特許文献1では、電力系統で計測される情報だけを利用して計算するため、電力系統の外部で起きた事象は、事象発生の確率計算の精度向上に役立てられていない。
また特許文献1では、電力系統の構成、トポロジー(接続形態)、地理的配置(場所)、時刻等に関する情報を入力する手段を持たない。しかし、例えば気象情報は、場所と時間に大きく依存する情報である。このため、たとえ単に気象情報を外部から入力する手段を用意しても、気象情報と、電力系統の事象とを関連付けることは出来ず、確率計算の精度向上に役立てることができない。
本発明は、上記の状況を考慮してなされたものであり、対象システムの外部から得られる情報を反映して、対象システムの未来の状態を予測できるようにするものである。
本発明の一態様のシステム監視装置は、対象システムの複数の状態と、上記複数の状態の中の一の状態から他の状態への状態遷移の経路とを含む状態遷移情報を記憶する記憶部を備える。また、システム監視装置は、上記対象システムに設けられたセンサで計測された情報である計測情報、及び上記対象システムに関わりを持つ周辺情報の入力を受け付ける入力部と、上記入力部で受け付けた上記計測情報から、上記対象システムの現在の状態を検知する状態検知部を備える。また、システム監視装置は、上記状態検知部で検知された上記対象システムの現在の状態と、上記記憶部に記憶された上記状態遷移情報と、上記入力部で受け付けた上記周辺情報とを元に、上記現在の状態から他の状態への遷移確率を算出する遷移確率算出部を備える。さらにまた、システム監視装置は、上記遷移確率に基づいて上記現在の状態から遷移する次の状態を判定する遷移状態判定部と、上記遷移状態判定部の判定結果を出力する出力部とを備える。
上記構成の本発明の一態様によれば、電力系統から得られる情報のみならず、関わりのある周辺情報を取り込んで遷移確率の計算に利用することで、次に遷移する状態の予測精度が向上する。
上記した以外の課題、構成及び効果は、以下の実施形態の説明により明らかにされる。
上記した以外の課題、構成及び効果は、以下の実施形態の説明により明らかにされる。
以下、本発明を実施するための形態の例について、添付図面を参照しながら説明する。なお、各図において実質的に同一の機能又は構成を有する構成要素については、同一の符号を付して重複する説明を省略する。
<1.第1の実施形態>
[システムの状態監視と状態予測]
[システムの状態監視と状態予測]
エネルギー、運輸交通(公共バス、鉄道)、生産等に関わるシステムは、大規模かつ複雑であるため、システムの運用、監視には多くの困難がある。例えば、システムは面的な広がりを持ち、システムの状態は多種のデータで表記され、システム内部のみならずシステム外部からの影響を受けてシステムの状態は変化する。状態とは、ある時刻における監視対象のありようや状況である。このためシステム内部にセンサを配置して、ネットワーク経由でセンサから情報を収集し、解析する方法が検討、実用化されている。
収集した情報に基づくシステムの状態の分類には多くの手法があるが、一つには「定常状態」と「過渡状態」で分離する方法がある。
定常状態は、例えばシステムの状態が適正範囲内に維持されていて、システムの管理側と利用側において支障が発生していない状態である。
一方の過渡状態は、時間的に変化がある状態を指し、制御結果として起きる意図的な状態変化のほか、事故のように適正範囲を外れて不都合をもたらす偶発的な状態変化を含む。
定常状態は、例えばシステムの状態が適正範囲内に維持されていて、システムの管理側と利用側において支障が発生していない状態である。
一方の過渡状態は、時間的に変化がある状態を指し、制御結果として起きる意図的な状態変化のほか、事故のように適正範囲を外れて不都合をもたらす偶発的な状態変化を含む。
事故は、偶発的な状態変化であり、システム運用を妨げる他、システムを利用している顧客に不都合をもたらすことがある。したがって、事故が起きないように未然に対策すること、並びに事故が起きたときには速やかに復旧することが望まれる。
ここで、システムの一例として、電力系統を説明する。
図1は、一般的な電力系統の構成例を示す概略図である。
図1は、一般的な電力系統の構成例を示す概略図である。
電力系統1は、発電所2で発電した電気を送電線、配電線を通じて需要家Uへ供給するシステムである。例えば発電所2で発電された電気は送電線により、1次変電所3等を経由して配電変電所4へ送られる。なお、実際の送電線は3線であるが説明の都合により1本線で表現している。1次変電所3には、太陽光発電設備20が発電した電気なども送られてくる。そして、配電変電所4から配電系統5を通じて需要家Uに電気が供給される。即ち、配電変電所4で変圧された電気は、複数の電柱10に懸架された配電線6、柱上変圧器7を介して需要家Uに送られる。配電線6の途中には、電圧調整器8(SVR)やセンサ付き開閉器9などが設けられる。
電力系統は、電力の安定供給のため多くの制御機器、センサが接続された複雑なシステムになっている。電力系統に起きる様々な事象は、電力系統に設置したセンサにより、電圧、電流、電力などの状態量として観察される。事象は監視対象の状態変化をもたらしうる出来事(現象)である。これらの状態量は、センサ付き開閉器等の何らかのセンサを用いて時系列信号として採取(計測)することで信号処理が可能になる。計測信号に現れる事象は、例えば定常的な緩やかな信号変化(定常状態)、あるいは過渡的な振動波形(過渡状態)として観察される。このように計測信号に現れる波形は、システムに起きた結果として扱える。例えば、電力系統に何らかの事故が起きたとき、電流が急激に流れるならば、過渡的な振動波形が計測信号に観察される。このように、事象を引き起こした原因と、計測信号に現れる結果を対応付けることができる。
上述したとおり、電力系統1は、電線により接続された面的な広がりを持つ大規模システムである。ここで図1に示すように、何らかの原因により配電線6が地面に接触して電流が流れる地絡事故が起こることがある。地絡事故では、線路に用いるケーブルと地面間のインピーダンスが著しく低下し、線路に地絡事故が発生した瞬間に線路から地面に電流が流れることで、過渡的な応答波形が発生する。ここで、事故原因がケーブルと樹木の接触であれば、瞬時的な接触が繰り返し発生することがある。また、地絡電流により接触物が加熱して変成する場合があり、例えば樹木の接触であれば、樹木の炭化により地絡抵抗が時間的に変化することがある。このように事故原因によって、事故時に発生する電流の過渡的な応答波形は異なる。
そして、電力系統1(配電系統5)における電流の流れが過渡的に変化して、発電装置あるいは負荷装置に不具合をもたらす場合があり、また電力供給支障による停電が起きる場合がある。このような状態の変化は、ある状態から他の状態へ移る状態遷移として扱うことができる。
図2は、システムの状態遷移の説明図である。
状態遷移の表記方法として、ここでは状態を丸印、遷移パスを矢印で書くことにする。図2の状態遷移図において、左から右へ向かって過去、現在、未来におけるシステムの状態、並びに、過去から現在そして現在から未来への起こり得る状態遷移が記載されている。各状態として、事故が起きている状態(過渡状態)のほか、事故のない安定した状態(定常状態)があってよい。
状態遷移の表記方法として、ここでは状態を丸印、遷移パスを矢印で書くことにする。図2の状態遷移図において、左から右へ向かって過去、現在、未来におけるシステムの状態、並びに、過去から現在そして現在から未来への起こり得る状態遷移が記載されている。各状態として、事故が起きている状態(過渡状態)のほか、事故のない安定した状態(定常状態)があってよい。
電力系統において原因と結果の関係は様々である。例えば、何らかの原因で電力系統に事故が発生し、系統状態に変化が生じ、計測信号に信号変化が現れるとき、いずれの事象も結果として扱うことができる。そして、いずれの結果も、次に起こる状態変化の原因として扱うことができる。こうして複数の原因と結果の関係が組み合わされている。
電力系統の状態は、定常状態、過渡状態を含めて状態として扱う。事故に限らず、定常的な運用の中で、切り替え動作(配電系統のLRT,SVR、あるいは開閉器による系統切り替えなど)が行われている。このような切り替え動作に一つの状態遷移を設定してもよく、あるいは定常状態の中の動作として扱ってもよい。
システムの状態遷移は、システム開発時の仕様等に基づいて作成できる場合、またシステム動作の観察結果を解析することで作成できる場合等がある。仕様書が存在する場合には、明確な根拠を持って状態遷移を決めることができる。一方で、仕様書が曖昧あるいは存在しない場合には、センサ等の計測結果を用いて、クラスタ分類、統計処理などの手法を駆使して状態遷移を作ることが考えられる。
図2の例では、ある原因に基づく遷移パスp1(太線)を経て過去の状態s1から現在の状態s2に遷移している。過去の状態s1から現在の状態s2への遷移には複数の遷移パス(原因)がある中で、遷移パスp1を経て遷移している。即ち、何らかの事象が主要な原因となって状態の遷移が引き起こされ、過去の状態s1から現在の状態s2に遷移している。図2から分かるように、過去と現在のシステムの状態は確定しており、過去と現在の状態が分かれば、状態遷移の原因も推定できる。
また、図2において、ある原因に基づく遷移パスp2(太線)を経て現在の状態s2から未来の状態s3に移動することが示されている。現在の状態s2から遷移可能な状態の候補として状態s3-1,s3-2,s3-3,s3-4がある中で、状態s3-3に遷移すると予測されている。
本実施形態では、現在取得済みの情報(例えば計測情報、周辺情報)から状態遷移を引き起こす可能性のある事象が発生する確率を算出して、次に起きる状態を判定する。現在の状態から候補となる状態を結ぶ遷移パスは、事故の原因となる事象を含む。
[システム監視装置を含む全体構成]
図3は、本発明の第1の実施形態に係るシステム監視装置を含む全体構成の概要を示す。
システム監視装置30は、例えば電力系統1等の実体システム(監視対象システム)の状態及び状態遷移を監視する。
図3は、本発明の第1の実施形態に係るシステム監視装置を含む全体構成の概要を示す。
システム監視装置30は、例えば電力系統1等の実体システム(監視対象システム)の状態及び状態遷移を監視する。
以下では本発明の各実施形態について、監視対象システムとして電力系統1を例にして説明するが、状態に関して原因と結果の確率的な関係を有するシステムであれば、システムを限定することなく、同様の効果を実現できることは言うまでもない。例えば、発電システム、運輸交通システム、生産システム等に適用することが可能である。
システム監視装置30は、対象システムに設置したセンサにより計測した計測情報と、対象システムに関係があると考えられる周辺情報を入力して、システムの現在の状態から遷移する可能性のある次の状態を予測する。また、システムを監視・運用する運用者に、遷移予測及び当該遷移予測の根拠を提示する。ここで、計測情報及び周辺情報は、複数のセンサで計測した信号、インターネット等で公開されている情報、シミュレーションで算出する情報等を含む。
システム監視装置30は、電力系統1からシステム情報(系統情報)と周辺情報を入力する手段を備える。システム情報は、システム(ここでは電力系統1)を構成する設備・機器等の状態を、システム内部にある何らかのセンサで検知した情報(計測情報)である。例えば配電変電所4から需要家Uまでの線路にはセンサ付き開閉器9(図1参照)が設置されており、このセンサ付き開閉器9により系統状態(電圧、電流等)を計測している。センサの計測信号は、電力線搬送、あるいは光ケーブルの技術を使い、ネットワークN(例えばインターネット)を経由して親局にあるサーバでデータ収集が可能になっている。
また、系統情報には、時間的な先行はないものの、事故発生の確率に影響を与えるデータとして、電線の配置、設備・機器の容量、負荷の連系箇所と容量、分散電源の連系箇所と容量などがある。これらは事前に分かる固定値と、系統に設置したセンサで採取する計測値に分類できる。
また系統情報には、設備・機器の履歴(以下「設備履歴データ」)がある。設備・機器の履歴としては、例えば設備・機器の設置年数、設置箇所の環境、設備・機器が備えるスイッチの動作回数、設備・機器の過去の事故実績などがある。
一方、周辺情報は、システム(例えば電力系統1)を取り巻く多種多様な情報を指す。電力系統1の状態に関わりを持つ周辺情報としては、気象情報(天気予報など)、カレンダ、地図、人流、交通などがある。これらの周辺情報は、第三者が作成又は収集したものであってよく、近年のネットワーク技術の発展により、これらの周辺情報を利用できる環境が整いつつあり、ネットワークN経由で、システム監視装置30に入力される。
そして周辺情報には、電力系統1に起きる状態変化に、時間的に先行する情報が含まれることがある。例えば気象データには、日射、風、雨等の気象状況の予測情報が含まれている。例えば、天候が荒れると、電力系統1の設備や機器が影響を受ける事象(樹木動揺、倒木、強風による断線、洪水など)の発生確率が高くなる。
またカレンダには、休日、何らかのイベント、工事等の予測(予定)情報が含まれている。例えば、これらの予定があるときには、それ以外のときと比較して何らかの事故が発生する確率が大きくなる。
また地図には、需要家の密度、電線に接触事故を引き起こす可能性のある家屋や樹木等の分布、道路等の情報が含まれている。例えば、需要家の密度が多い地域ほど電力変動が大きい。また、交通量の多い道路脇に設置された電柱は、交通量の少ない道路脇に設置された電柱よりも、電柱や電線が巻き込まれる交通事故の確率が大きくなる。ただし、これらの周辺情報は、事前に電力系統1との関わりが分かっている必要は必ずしもなく、何らかの信号処理によって関わりが見出される場合を含む。
システム監視装置30は、電力系統1等のシステムの状態遷移を判定するため、システム自体の計測情報に加えて、システムに関わる周辺情報を利用する。システムの状態は、計測情報で示されるシステム内部の状況に加えて、周辺情報で示されるシステム外部の状況に影響を受けることがある。
例えば電力系統1は、再生可能エネルギー発電システムの一つである太陽光発電設備20の発電量の影響を受けて状態が変化するが、太陽光発電設備20の発電量は気象状況に大きく依存する。気象状況に関しては、気象庁等が発信する気象情報から過去、現在、未来に渡る情報が得られる。この場合には、もともとは電力系統1に直接関係のない気象情報を、電力系統1の状態変化を推定、あるいは予測するのに利用できることになる。同様にして、気象情報に限らず周辺情報には、システムの状態に対して時間的に先行する情報が含まれていることがある。
本発明は、システム情報(計測情報)に加えて周辺情報を用いて、システムの状態遷移の遷移確率を算出することで、起きやすい状態遷移を判定する、あるいは状態遷移を予測することを特徴とする。そのため本発明は、システム情報と周辺情報から、状態遷移(例えば事故)を引き起こす事象(原因)を抽出して、さらに、その事象に遷移を引き起こす確率を割り当てる。後述するが、システム情報あるいは周辺情報を時系列信号として入力する場合には、時系列信号から確率を割り当てられる事象に変換することが行われる。
[ハードウェア構成]
図4は、システム監視装置30のハードウェア構成例を示すブロック図である。
図4を参照してシステム監視装置30に適用される計算機40のハードウェア構成を説明する。
図4は、システム監視装置30のハードウェア構成例を示すブロック図である。
図4を参照してシステム監視装置30に適用される計算機40のハードウェア構成を説明する。
計算機40は、いわゆるコンピュータとして用いられるハードウェアである。計算機40は、バス44にそれぞれ接続された演算制御装置であるCPU(Central Processing Unit)41、ROM(Read Only Memory)42、RAM(Random Access Memory)43を備える。さらに、計算機40は、表示部45、操作部46、不揮発性ストレージ47、ネットワークインターフェース48を備える。
CPU41(制御部の一例)は、本実施形態に係る各機能を実現するソフトウェアのプログラムコードをROM42から読み出して実行する。なお、計算機40は、CPU41の代わりに、MPU(Micro-Processing Unit)等の処理装置を備えるようにしてもよい。
RAM43には、演算処理の途中に発生した変数やパラメータ等が一時的に書き込まれる。表示部45は、例えば、液晶ディスプレイモニタであり、計算機40で行われる処理の結果等を運転員に表示する。操作部46には、例えば、キーボード、マウス又はタッチパネル等が用いられ、運転員が所定の操作入力、指示を行うことが可能である。
不揮発性ストレージ47としては、例えば、HDD(Hard Disk Drive)、SSD(Solid State Drive)、フレキシブルディスク、光ディスク、光磁気ディスク、CD-ROM、CD-R、磁気テープ、不揮発性のメモリカード等が用いられる。この不揮発性ストレージ47には、OS(Operating System)、各種のパラメータの他に、計算機40を機能させるためのプログラム及びデータが記録されている。例えば不揮発性ストレージ47は、後述する図5の履歴情報記憶部303、状態遷移記憶部304、因果関係記憶部310、及び事象確率記憶部311、支援情報記憶部312に対応する。
ネットワークインターフェース48には、例えば、NIC(Network Interface Card)等が用いられ、LAN等のネットワークNを介して各装置間で各種のデータを送受信することが可能である。
[システム監視装置の内部構成]
図5は、システム監視装置30の内部構成を示すブロック図である。
システム監視装置30の各ブロックの機能は、図4のCPU41がROM42に格納されたコンピュータープログラムを実行することにより実現される。
図5は、システム監視装置30の内部構成を示すブロック図である。
システム監視装置30の各ブロックの機能は、図4のCPU41がROM42に格納されたコンピュータープログラムを実行することにより実現される。
システム監視装置30は、入力部301、状態検知部302、履歴情報記憶部303、状態遷移記憶部304、遷移確率算出部305、遷移状態判定部306、表示制御部307、及び表示部308を備える。またシステム監視装置30は、原因推定部309、因果関係記憶部310、事象確率記憶部311、及び支援情報記憶部312を備える。さらにシステム監視装置30は、状態遷移設定部321、確率算出方式設定部322、判定論理設定部323、及び確率設定部324を備える。
入力部301は、ネットワークN(インターネット等)を介して、監視対象システムである電力系統1に設けられたセンサで計測された情報である計測情報、及び電力系統1に関わりを持つ周辺情報の入力を受け付ける。この入力部301は、図4のネットワークインターフェース48に対応する。入力部301は、受け付けた計測情報及び周辺情報を、状態検知部302、履歴情報記憶部303及び遷移確率算出部305へ出力する。
状態検知部302は、入力部301で受け付けた計測情報を解析することにより、電力系統1の現在の状態(システム状態)を検知し、検知結果を履歴情報記憶部303へ出力する。
履歴情報記憶部303は、入力部301から入力される計測情報及び周辺情報を日時と対応づけて記憶する。また履歴情報記憶部303は、状態検知部302から入力される電力系統1の現在の状態(システム状態)を日時と対応づけて記憶する。以下、計測情報及び周辺情報をまとめて「履歴情報」と記すことがある。
状態遷移記憶部304は、電力系統1の複数の状態と、複数の状態の中の一の状態から他の状態への状態遷移の遷移パス(経路)とを含む状態遷移図(状態遷移情報、図2参照)を記憶する。また状態遷移記憶部304には、履歴情報記憶部303から少なくとも電力系統1の現在の状態(及び現在の状態に至る前の直近(過去)の状態)の情報が入力される。履歴情報記憶部303及び状態遷移記憶部304は、図4の不揮発性ストレージ47に対応する。
遷移確率算出部305は、状態検知部302で検知された電力系統1の現在の状態と、履歴情報記憶部303に記憶された状態遷移情報と、入力部301で受け付けた周辺情報(事象)とを元に、電力系統1が現在の状態から他の状態へ遷移する確率(遷移確率)を算出する。遷移確率算出部305は、電力系統1の現在の状態と状態遷移情報とから、現在の状態に至る前の直近(過去)の状態(状態遷移)を把握することができる。状態遷移記憶部304が、上記現在の状態に至る前の直近(過去)の状態を把握し、遷移確率算出部305へ当該過去の状態を通知してもよい。そして、遷移確率算出部305は、算出結果を遷移状態判定部306へ出力する。
遷移状態判定部306は、遷移確率算出部305で算出された遷移確率に基づいて、電力系統1の現在の状態から遷移する次の状態(状態遷移)を判定し、判定結果を表示制御部307へ出力する。遷移状態判定部306は、判定結果とともに当該判定結果の判定論理を出力することもできる。
表示制御部307は、出力部の一例であり、遷移状態判定部306の判定結果を含む表示データを生成し、表示部308へ出力する。また、表示制御部307は、判定結果とともに当該判定結果の判定論理を含む表示データを生成し、表示部308へ出力することもできる。また、表示制御部307は、判定結果(遷移状態等)に応じた支援情報を支援情報記憶部312から読み出し、表示部308へ出力する。
表示部308は、表示制御部307から入力される表示データに基づく画面を表示する。この表示部308は、図4の表示部45に対応する。
原因推定部309は、状態遷移記憶部304から状態遷移情報(少なくとも現在の状態を含む)を取り込み、因果関係記憶部310から因果関係を取り込み、さらに事象確率記憶部311から現在の状態に至る原因となった事象の確率を取り込む。そして、原因推定部309は、電力系統1の現在の状態、因果関係及び該当する事象の確率を元に、現在の状態に対する原因を推定する処理を行う。
因果関係記憶部310には、電力系統1の状態(事象)を結果とし、その結果を引き起こした事象を原因とする因果関係が格納されている。この因果関係は予め設定されるが、履歴情報(計測情報及び周辺情報)を元に更新(修正)されてもよい。
事象確率記憶部311には、各事象の発生する確率が格納されている。また、現在の状態に至る原因となった事象と当該事象が発生する確率との対応関係が格納されている。また、確率計算に用いる事前確率や事後確率が格納されてもよい。本実施形態では、複数の原因としての事象が組み合わされて起きる結果としての事象を条件付き確率(ベイジアンネットワーク)(後述する図10参照)で記述して事象確率記憶部311に記憶し、入力データ(計測情報、周辺情報)を用いてその確率を逐次更新する。因果関係記憶部310及び事象確率記憶部311は、図4の不揮発性ストレージ47に対応する。
支援情報記憶部312には、運用者の作業及び判断を支援するための情報(支援情報)が格納されている。例えば、支援情報として、警報情報の詳細(図16)、判定論理(図17)、復旧支援情報(図18)、事前対策情報(図19)などがある。判定論理には、状態遷移の根拠となる状態遷移図や判定根拠(判定条件)などが含まれる。
状態遷移設定部321は、操作部46(図4)からの指示に基づき、状態遷移記憶部304に記憶されている電力系統1(システム)の状態、及び状態間の遷移パス(図8参照)を設定及び修正する。
確率算出方式設定部322は、操作部46からの指示に基づき、遷移確率算出部305による遷移確率の算出方法を設定及び修正する。
判定論理設定部323は、操作部46からの指示に基づき、遷移状態判定部306による判定結果の判定論理を設定及び修正する。
確率設定部324は、操作部46からの指示に基づき、事象確率記憶部311に格納された各事象の発生確率を設定及び修正する。
確率算出方式設定部322は、操作部46からの指示に基づき、遷移確率算出部305による遷移確率の算出方法を設定及び修正する。
判定論理設定部323は、操作部46からの指示に基づき、遷移状態判定部306による判定結果の判定論理を設定及び修正する。
確率設定部324は、操作部46からの指示に基づき、事象確率記憶部311に格納された各事象の発生確率を設定及び修正する。
[状態検知部の動作]
ここで、状態検知部302の動作について詳細に説明する。
電力系統1の状態を電力系統1に設置したセンサによって検出した計測信号は、適宜の時間間隔でサンプリングした時系列信号である。時系列信号は、時間的に連続するサンプリング値の並びであり区切りを持たない。そこで一般的に、事前に決めた時間幅(時間窓)、あるいはサンプル数でもって時系列信号から計測信号を切り出して、これを信号処理の単位とすることが行われる。また、時系列信号の形態では、時系列信号から事象としての情報を直接取り出すことは難しい。
ここで、状態検知部302の動作について詳細に説明する。
電力系統1の状態を電力系統1に設置したセンサによって検出した計測信号は、適宜の時間間隔でサンプリングした時系列信号である。時系列信号は、時間的に連続するサンプリング値の並びであり区切りを持たない。そこで一般的に、事前に決めた時間幅(時間窓)、あるいはサンプル数でもって時系列信号から計測信号を切り出して、これを信号処理の単位とすることが行われる。また、時系列信号の形態では、時系列信号から事象としての情報を直接取り出すことは難しい。
本実施形態では、その計測信号を解析して得られる情報、又は情報の組み合わせ(特徴量)を事象として扱い、事象ごとに確率を割り当てる。ここで、計測信号から取り出した事象に確率を割り当てる場合、計測信号の組み合わせは膨大になりうるので、信号変換により計測信号を特徴量に置き換えて確率を割り当てる。
ここで、時系列信号から事象を検出するために組み合わせる信号の作り方を決める必要がある。例えば時間的に連続する信号(時系列信号)から一部を取り出す場合は、時間軸上の始まりと終わりを決めることになる。例えば事故時の波形を包含する程度の時間幅を決めておき、その時間幅のなかの信号の組み合わせを取り出して、適宜な信号処理により特徴量を算出する。そして、次の特徴量を算出する時刻にシフトして再び信号の組み合わせを取り出す手順を繰り返す。
時系列信号の特徴量を算出するための信号処理として、従来、多くの方法が提案されている。例えば、FFT(Fast Fourier Transform)、プローニ解析、ウェーブレット解析、瞬時周波数解析などがある。これらの解析手法で算出した数値を時系列信号の波形の特徴量として利用することができる。但し、本実施形態は、これらの時系列信号の解析方法、並びに算出結果である特徴量の種類を限定するものではない。また複数の特徴量を組み合わせて利用してもよい。ここで特徴量として、時系列信号の波形に含まれる周波数成分の分布、高調波成分の比率、波形の周波数成分と減衰特性、波形の位相変化(周波数の時間的な変化)、波形の形状パターンなどを利用できる。また時系列信号以外の、何らかの状態値に関する確率と特徴量を組み合わせて利用することができる。
本実施形態では、状態検知部302により時系列信号を特徴量に変換して扱うことで、元々の時系列信号を扱うのに比べて扱うデータ量を削減できる。また特徴量を扱うことにより、信号比較において類似性、差分、変化等の数値化が容易になる場合がある。これにより、データ蓄積量の削減の他、データ処理の高速化、データ入出力の高速化等のメリットがある。また、波形データは時間位置(位相)の特性を持つが、時系列信号を特徴量に変換することで時間位置に無関係な情報を採取することができる。
図6は、計測信号の解析例を示すグラフである。
図6の横軸は周波数(帯域)、縦軸は全体に対する対象帯域の周波数成分の比率を示す。この例では、周波数の帯域F1,F2,F3,F4の各々について全体に対する周波数成分の比率が示されている。
図6の横軸は周波数(帯域)、縦軸は全体に対する対象帯域の周波数成分の比率を示す。この例では、周波数の帯域F1,F2,F3,F4の各々について全体に対する周波数成分の比率が示されている。
図7は、第1の実施形態に係る計測信号の状態と事象との対応関係例を示すテーブルである。
状態と事象のテーブル54は、計測信号状態フィールドと事象フィールドを備える。計測信号状態フィールドは、あるセンサの計測信号の状態を表す情報を有し、事象フィールドは、システム(電力系統1)に発生した事象の情報を有する。計測信号の状態は、例えば計測信号の特徴量によって判断される。この例では、特徴量に応じて状態A~Cに分類し、状態A,Bのとき事象の発生はなし(定常状態)であり、状態Cと地絡(過渡状態)が対応づけられている。
状態と事象のテーブル54は、計測信号状態フィールドと事象フィールドを備える。計測信号状態フィールドは、あるセンサの計測信号の状態を表す情報を有し、事象フィールドは、システム(電力系統1)に発生した事象の情報を有する。計測信号の状態は、例えば計測信号の特徴量によって判断される。この例では、特徴量に応じて状態A~Cに分類し、状態A,Bのとき事象の発生はなし(定常状態)であり、状態Cと地絡(過渡状態)が対応づけられている。
[周辺情報の入力と処理]
次に、周辺情報の入力と処理について説明する。
本実施形態では、周辺情報として、気象データ、カレンダ、地図、人流、交通、運用者等の経験などが適用される。これらの周辺情報には、電力系統1の状態遷移に時間的に先行する情報が含まれていることがある。気象データにある気象予測が一例であり、日射、降雨、風等の予測データが入手可能である。本実施形態では、これらの周辺情報が事故発生に先行する情報か、あるいは事故原因との関わりがあるかどうかを事前に分かっている必要はない。周辺情報は、上記の例に限定されないことは勿論である。
次に、周辺情報の入力と処理について説明する。
本実施形態では、周辺情報として、気象データ、カレンダ、地図、人流、交通、運用者等の経験などが適用される。これらの周辺情報には、電力系統1の状態遷移に時間的に先行する情報が含まれていることがある。気象データにある気象予測が一例であり、日射、降雨、風等の予測データが入手可能である。本実施形態では、これらの周辺情報が事故発生に先行する情報か、あるいは事故原因との関わりがあるかどうかを事前に分かっている必要はない。周辺情報は、上記の例に限定されないことは勿論である。
ところで、確率を利用するシステム監視装置30においては、確率に関する初期データの設定方法に留意が必要である。システム監視装置30の最初の電源オン時に過去データの累積が無い、あるいは少ないとき、確率的なデータを利用するのは困難である。そこで、本実施形態は、以下の初期設定を行う構成を用意してあるものとする。
・運用者等が持っている過去データを取り込む入力手段を用意する
・対象システムについてシミュレーションを行い、該当データを溜め込む
・後述するベイズ統計の主観確率の考え方に基づいて、初期値を設定する
・対象システムについてシミュレーションを行い、該当データを溜め込む
・後述するベイズ統計の主観確率の考え方に基づいて、初期値を設定する
[状態遷移情報]
図8は、システムの状態遷移の一例を示す図(状態遷移図)である。
図8において、システムの状態を四角形、遷移パスを矢印で表し、左から右へ向かう方向が過去、現在、未来の時間経過を表す。この図8では、状態間の関係を、過去、現在、未来の時間的な方向性を持つ「状態遷移」として表記している。ある状態から次の状態に遷移する確率を「遷移確率」として扱う。
図8は、システムの状態遷移の一例を示す図(状態遷移図)である。
図8において、システムの状態を四角形、遷移パスを矢印で表し、左から右へ向かう方向が過去、現在、未来の時間経過を表す。この図8では、状態間の関係を、過去、現在、未来の時間的な方向性を持つ「状態遷移」として表記している。ある状態から次の状態に遷移する確率を「遷移確率」として扱う。
この状態遷移と遷移確率(これらを「状態遷移情報」という)は、過去の実績データを統計処理することで得られるほか、系統解析用のシミュレーションで算出することができる。またベイズ統計の考え方に基づいて主観確率を設定してもよい。そして実時間運用において、センサからシステム監視装置30に入力された計測情報に基づいて実時間に更新することができる。
図8の状態遷移図では、現時刻よりも過去の時点において3つの状態s11,s12,s13が存在し、状態s11はさらに過去の状態から遷移パスp01を経て、同様に状態s12は遷移パスp02を経て、状態s13は遷移パスp03を経て各々の状態に遷移している。
過去の状態s11の遷移先の候補として、遷移パスp11を経由しての状態s21、及び遷移パスp12を経由しての状態s22が存在する。また状態s12の遷移先の候補として、遷移パスp21を経由しての状態s21、遷移パスp22を経由しての状態s22、及び遷移パスp23を経由しての状態s23が存在する。さらに状態s13の遷移先の候補として、遷移パスp32を経由しての状態s22、及び遷移パスp33を経由しての状態s23が存在する。
同様にして、現時刻の状態s21の遷移先の候補として、状態s31、及び状態s32が存在する。また状態s22の遷移先の候補として、状態s31、状態s32、及び状態s33が存在する。さらに状態s23の遷移先の候補として、状態s32、及び状態s33が存在する。さらに、状態s31は遷移パスp1を経て、状態s32は遷移パスp2を経て、及び状態s33は遷移パスp3を経て次の状態へと遷移していく。
このように状態遷移図には、システムの状態変化に伴う状態遷移情報が記録されている。この状態遷移図(即ち状態遷移情報)は、状態遷移記憶部304に記憶されている。
[遷移確率の算出方法]
次に、遷移確率算出部305による遷移確率の算出方法を説明する。
複数の原因が組み合わされて事象が発生する確率は、それぞれの原因の同時確率として表される。同時確率は、ベイズの定理を用いて条件付き確率に展開することができる。例えば原因X1,X2、X3があるとき、これらの原因が同時に起きる同時確率P(X1,X2,X3)は、式(1)のように展開できる。
次に、遷移確率算出部305による遷移確率の算出方法を説明する。
複数の原因が組み合わされて事象が発生する確率は、それぞれの原因の同時確率として表される。同時確率は、ベイズの定理を用いて条件付き確率に展開することができる。例えば原因X1,X2、X3があるとき、これらの原因が同時に起きる同時確率P(X1,X2,X3)は、式(1)のように展開できる。

さらに、式(1)を一般化することで式(2)の展開公式が得られる。

このように複数の原因が組み合わされた遷移確率は同時確率で記述でき、同時確率は条件付き確率の積として表記できる。つまり、個々の原因を条件付き確率として掛け合わせていく関係にある。
(原因と結果の関係)
以下に、図9、図10を参照して原因と結果を関係づける条件付き確率の算出例を示す。この例は、樹木接触による電線の地絡事故が起きるときの原因と結果を示す。
以下に、図9、図10を参照して原因と結果を関係づける条件付き確率の算出例を示す。この例は、樹木接触による電線の地絡事故が起きるときの原因と結果を示す。
図9は、第1の実施形態に係る原因と結果の関係の一例を示す説明図である。
図9では、電力系統に起きる事故として樹木接触を取り上げて、その原因と結果の関係を例示している。ここでは説明のため図を簡単化して、風、樹木の揺れ、及び電線の地絡事故の原因と結果の関係を示す。風によって引き起こされる地絡事故は、風によって樹木が揺れて電線に接触する場合と、風によって切れた電線が地面に接触する場合の2種類あるとする。ここでは、風が吹くという事象をX1、樹木動揺という事象をX2、地絡という事象をX3とおく。
図9では、電力系統に起きる事故として樹木接触を取り上げて、その原因と結果の関係を例示している。ここでは説明のため図を簡単化して、風、樹木の揺れ、及び電線の地絡事故の原因と結果の関係を示す。風によって引き起こされる地絡事故は、風によって樹木が揺れて電線に接触する場合と、風によって切れた電線が地面に接触する場合の2種類あるとする。ここでは、風が吹くという事象をX1、樹木動揺という事象をX2、地絡という事象をX3とおく。
(条件付き確率)
図10は、第1の実施形態に係る原因と結果の条件付き確率の一例を示す説明図である。図10Aは風が吹く(X1)確率のテーブル51、図10Bは樹木動揺(X2)の確率のテーブル52、図10Cは地絡あり(X3)の確率のテーブル53である。T,Fは論理用語で、真(T),偽(F)を表す。
図10は、第1の実施形態に係る原因と結果の条件付き確率の一例を示す説明図である。図10Aは風が吹く(X1)確率のテーブル51、図10Bは樹木動揺(X2)の確率のテーブル52、図10Cは地絡あり(X3)の確率のテーブル53である。T,Fは論理用語で、真(T),偽(F)を表す。
図10A~図10Cに示すように、原因から結果が起きる確率を用意する。ここで樹木揺動(樹木接触)による地絡事故の発生と、電線断線による地絡事故発生については、過去の実績データを統計処理することで事前に用意できるものとする。また風が吹く(X1)確率は、周辺情報に含まれる気象予測から入手できるものとする。これより、発生した地絡事故が、風が吹いた(X1)ことが原因であるという確率は、ベイズの定理(ベイズの公式)を利用して算出する。
まず風が吹く(X1)という原因によって、樹木が揺れる(X2)という結果が起きる。次に揺れた樹木という原因によって、電線に地絡事故(X3)が発生するという結果が起きる。それぞれの原因と結果の確率的な関係から、風が吹くことによる地絡事故の発生する確率(条件付き確率)を算出できる。その他に想定できる原因について同様に確率を算出し、最も大きな確率値を持つ原因が最も起きやすいと判定することができる。電力系統の状態、並びに原因の確率は時々刻々変化するので、逐次に確率計算して判定を繰り返す。
樹木接触による地絡事故(X3)という結果は、風が吹いた(X1)ことが原因であるという確率は、式(3)で表される。ここで「X1i」は、X1の「風が吹く」、又は「吹かない」の2者択一の事象を記号「i」で切り替えて示している。例えばi=1ならば風が吹く、i=2ならば風が吹かない。一方、X1jの「j」は、右辺分母にある演算記号Σ(シグマ)で決められる。Σ(シグマ)は、添え字を取りうる範囲で変化させて足し算する。例えばj=1ならば「風が吹く」、j=2ならば「風が吹かない」と条件を振っている。

ここで、介在する樹木揺動(X2)の要素を式(3)に反映して展開すると式(4)が得られる。

遷移確率算出部305は、このようにして算出した遷移確率を遷移状態判定部306へ出力する。
[原因推定方法]
(原因推定方法の第1例)
次に、原因推定部309による原因推定方法を説明する。
状態遷移の原因と結果が1種類のみであれば、状態遷移を検出すれば原因は確定するが、一般に原因は複数あり一意に定まらない。本実施形態では、多種類の原因がある場合に、ベイズの定理を用いて計測信号(時系列信号)から確率的に原因を推定する。
(原因推定方法の第1例)
次に、原因推定部309による原因推定方法を説明する。
状態遷移の原因と結果が1種類のみであれば、状態遷移を検出すれば原因は確定するが、一般に原因は複数あり一意に定まらない。本実施形態では、多種類の原因がある場合に、ベイズの定理を用いて計測信号(時系列信号)から確率的に原因を推定する。
ベイズの定理は、事前確率と事後確率(逆確率と呼ぶ場合がある)を関係付ける。ここで原因Eiの出現確率をP(Ei)、原因Eiのときに事象Fが出現する確率をP(F|Ei)として、これらは事前確率として分かっているとする。事象Fが発生したとき、原因がEiである確率(事後確率)は、式(5)により算出できる。

そして、それぞれの原因に対応する事後確率P(Ei)の大きさを比較して、最も大きな確率を持つ原因を、最も「尤もらしい」と判定する。電力系統1の事故の場合、事故の原因Eiは、樹木接触、鳥獣接触などの事故を引き起こす原因であり、過去に起きた事故について件数と原因は分かっていることが多い。これより原因Eiの出現確率P(Ei)を準備できる。また原因Eiが発生したとき計測信号に現れる波形は、事前の実験、シミュレーションなどにより入手可能である。この波形を例えば状態検知部302に入力し、適宜な信号処理により当該波形の特徴量を算出することが可能である。
ここで、上記の説明に沿って数値計算すると、地絡事故(X3)が起きたとき、その原因が風が吹いた(X1)ことである確率は、次の式(6)のようになる。
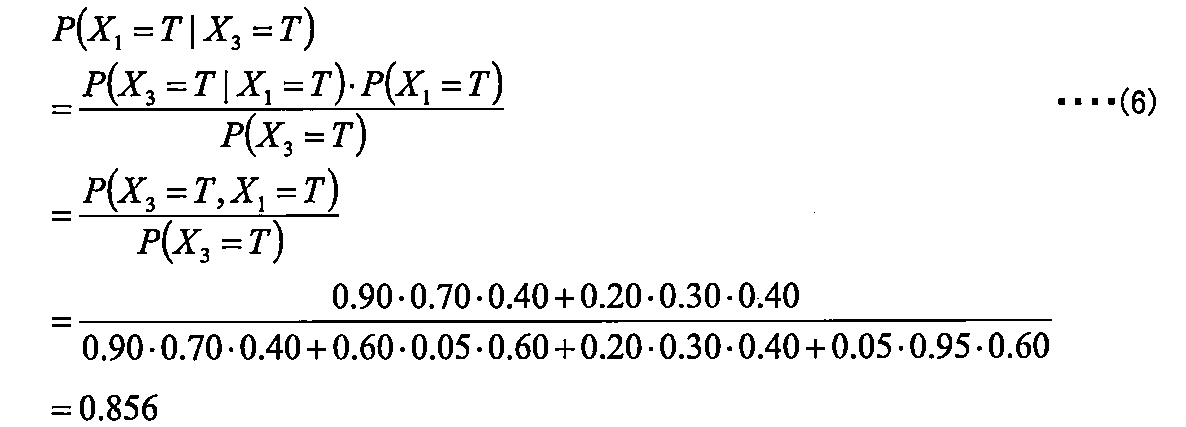
(原因推定方法の第2例)
時系列信号の波形の周波数成分に着目して、帯域(事象)Fkごとの成分比率を出現確率P(Fk)とすれば、事故の原因Eiのとき事象Fkが出現する確率P(Fk|Ei)が得られる。これを事前確率として用意する。この場合、例えば図6の帯域F1~F4が事象Fkとなる。
時系列信号の波形の周波数成分に着目して、帯域(事象)Fkごとの成分比率を出現確率P(Fk)とすれば、事故の原因Eiのとき事象Fkが出現する確率P(Fk|Ei)が得られる。これを事前確率として用意する。この場合、例えば図6の帯域F1~F4が事象Fkとなる。
次に、計測信号から算出した周波数成分の比率(確率)から、以下の式(7)で原因Eiの確率を算出する。そして、事後確率P(Ei)が最も大きくなる原因Eiが、最も尤もらしい原因であると判定する。ここでは周波数成分に着目したが、その他に事故時の波形の振幅の減衰率、波形の立ち上がり特性などを利用できる。また時系列信号以外の、何らかの状態値に関する確率を組み合わせることができる。

(原因推定方法の第3例)
また、下記の式(8)に示すように、複数の特徴量の確率を組み合わせて、原因Eiの確率を算出することができる。上記と同じ設定で、複数の周波数帯域と成分比率(確率)の組み合わせを事象Fjとして扱い、確率P(Fj)(j=1~m)を割り当て、原因Eiの確率と関係づける。ここでは別の事象の確率を組み合わせることができて、例えば上記のようにプローニ解析で得た周波数帯域と減衰率の組み合わせを事象として扱い、確率を割り当ててもよい。そして、上記と同様に、事後確率P(Ei)が最も大きくなる原因Eiが、最も尤もらしい原因であると判定する。
また、下記の式(8)に示すように、複数の特徴量の確率を組み合わせて、原因Eiの確率を算出することができる。上記と同じ設定で、複数の周波数帯域と成分比率(確率)の組み合わせを事象Fjとして扱い、確率P(Fj)(j=1~m)を割り当て、原因Eiの確率と関係づける。ここでは別の事象の確率を組み合わせることができて、例えば上記のようにプローニ解析で得た周波数帯域と減衰率の組み合わせを事象として扱い、確率を割り当ててもよい。そして、上記と同様に、事後確率P(Ei)が最も大きくなる原因Eiが、最も尤もらしい原因であると判定する。

ここで、時系列信号から取り出した事象について、尤もらしい原因が見つからない場合を考察する。この理由の一つは、実際に事象を起こすほどの原因が存在しない場合であるから、この事象を却下すればよい。この手順は、言い換えれば、ノイズを削除するフィルタに相当する。本実施形態は、上述した事象検出と原因推定を組み合わせて繰り返すことで、有意な事象を見出すことを特徴とする。
ところで、確率計算をするには、上述したように事前に確率のデータを用意しておく必要があり、その方法として過去データの統計処理から確率を算出する方法がある。しかし、この方法は、初期時に過去データが無い場合は確率を用意できない。
本実施形態は、初期時の事前確率の設定において大きく二つの手法を準備する。
一つ目は、対象システムに関わる過去データを外部から入力する手段と、外部から入手した対象システムに関するデータを用いた統計処理(シミュレーション)により確率を算出する手段を用意して、初期時の確率データを用意する方法である。
一つ目は、対象システムに関わる過去データを外部から入力する手段と、外部から入手した対象システムに関するデータを用いた統計処理(シミュレーション)により確率を算出する手段を用意して、初期時の確率データを用意する方法である。
二つ目は、ベイズ統計に基づいて、初期時に設定する事前確率について、主観確率の考え方を利用する方法である。ここで主観確率とは、監視対象のシステムを良く知る運用者の経験、知見等に基づいて、運用者が主観的に設定する事前確率である。この主観確率を利用する手法は、必ずしも過去データの統計処理(具体的な統計データ)を必須としない。そしてベイズ統計では、上述した事前確率を逐次に更新していくベイズ更新と呼ばれる手順がある。事後確率を用いて事前確率を順次に置き換えていくことで、事前確率の初期値に主観的な判断があったとしても、計測信号(結果)に基づいて事前確率を徐々に修正していくことができる。また、上記の二つの設定手法を組み合わせて利用することも当然可能である。
[遷移確率算出処理]
図11は、第1の実施形態に係るシステムの状態遷移の遷移確率を算出する処理を示すフローチャートである。CPU41がROM42に格納されたコンピュータープログラムを実行することにより、図11の遷移確率算出処理が実現される。
図11は、第1の実施形態に係るシステムの状態遷移の遷移確率を算出する処理を示すフローチャートである。CPU41がROM42に格納されたコンピュータープログラムを実行することにより、図11の遷移確率算出処理が実現される。
まず、システム監視装置30の入力部301は、ネットワークNを介してセンサの計測情報と周辺情報とを取り込む(S1)。状態検知部302は、入力部301で受け付けた計測情報から、電力系統1の現在の状態(システム状態)を検知し、検知結果を履歴情報記憶部303へ出力する。
次に、遷移確率算出部305は、状態遷移記憶部304から状態遷移情報(システム状態を含む)を取り込む(S2)。
次に、遷移確率算出部305は、現在の状態から次の状態へ遷移する確率(遷移確率)の算出を実行する(S3)。即ち、遷移確率算出部305は、状態検知部302で検知された電力系統1の現在の状態と、履歴情報記憶部303に記憶された状態遷移情報と、入力部301で受け付けた周辺情報とを元に、現在の状態から遷移し得る次の状態との遷移確率を計算する。
そして、遷移確率算出部305は、遷移確率の算出結果を遷移状態判定部306へ出力する(S4)。このステップS4の処理が完了後、一連の遷移確率算出処理を終了する。
その後、遷移状態判定部306において、遷移状態が判定される。即ち、現在の状態から遷移する可能性が高い次の状態が予測される。遷移状態判定部306の判定結果は、表示制御部307へ入力され、表示部308に判定結果が表示される。
[原因推定処理]
図12は、第1の実施形態に係る原因推定処理を示すフローチャートである。CPU41がROM42に格納されたコンピュータープログラムを実行することにより、図12の原因推定処理が実現される。
図12は、第1の実施形態に係る原因推定処理を示すフローチャートである。CPU41がROM42に格納されたコンピュータープログラムを実行することにより、図12の原因推定処理が実現される。
まず、システム監視装置30の原因推定部309は、状態遷移記憶部304から状態遷移情報(電力系統1の現在の状態)を取り込む(S11)。
次に、原因推定部309は、因果関係記憶部310から上記状態遷移情報に関連する、原因(事象)と結果(状態)の関係である因果関係を取り込む(S12)。
次に、原因推定部309は、事象確率記憶部311から上記状態遷移情報に関連する事象の確率を取り込む(S13)。
次に、原因推定部309は、電力系統1の現在の状態、因果関係及び該当する事象の確率を元に、現在の状態に対する原因推定を実行する(S14)。
そして、原因推定部309は、推定結果(推定原因)を表示制御部307へ出力する(S15)。推定原因は、表示制御部307へ入力され、表示部308に推定原因が表示される。
[電力系統の事故原因]
図13は、第1の実施形態に係る電力系統に存在する事故原因の一例を示す説明図である。図13Aは系統構成60、図13Bは風速分布70、図13Cは設備特性80、図13Dは樹木分布90を示す。
図13は、第1の実施形態に係る電力系統に存在する事故原因の一例を示す説明図である。図13Aは系統構成60、図13Bは風速分布70、図13Cは設備特性80、図13Dは樹木分布90を示す。
既述したように、電力系統は面的な広がりを持つシステムである。また計測情報、周辺情報も同様に面的な広がりを持つ。したがって、これらの関係を示す確率も面的な広がりを持って分布する。さらに一般的な表現をすれば、対象システム、計測情報、周辺情報、確率等の関係は空間的な分布を持った場(以下「確率場」と記す)として表記することができる。
本実施形態は、確率を、空間的に広がる分布情報として扱うことを特徴とする。一般に確率は、サイコロの目と出現確率(この場合は均一な分布になる)のように、何らかの条件に関連付けられた値として設定される。本実施形態は、気象情報が晴雨確率の地理的な分布を持つように、条件の一つとして空間位置を持たせる。この空間は、地図に基づく2次元座標であってよく、また多数の指標をもつ多次元空間であってよい。確率が時間的に変化する場合は、空間上に設定する確率は時間の関数でもある。例えば計測情報と周辺情報から計算した確率の分布結果に基づいて、逐次に更新してもよい。こうして確率を空間的な分布とすることで、空間的な確率演算が可能になる。そして、地理的な同一地点で、様々な指標を読み取ることで、該地点の確率を計算することができる。
図13Aの系統構成60には、電力系統の模式図が記載されている。配電変電所4の配電変圧器4Tの負荷(需要家)側に2つの遮断器(CB)が直列に接続されている。遮断器間の系統には、一例として3つの負荷と2つの電源が接続されている。電源は、例えば太陽光発電設備などが適用される。なお、2つの黒丸が記載された遮断器(図中左側)はクローズを表し、2つの白抜きの丸が記載された遮断器(図中右側)はオープンを表し、電力系統上の右向きの三角形(この例では4個)は開閉器を表している。
図13Bの風速分布70は、系統構成60と同じ内容の電力系統の模式図の上に重ねて表現されている。図13B内の矢印71が風向きと風速を表している。矢印71が太いほど風速が大きい。
図13Cの設備特性80は、系統構成60と同じ内容の電力系統の模式図の上に重ねて表現されている。図13Cでは、電力系統上のある負荷区間81の設備の設置年数が長いことを表している。
図13Dの樹木分布90は、系統構成60と同じ内容の電力系統の模式図の上に重ねて表現されている。図13Dでは、電力系統の付近に2か所の樹木の影響範囲91,92が示されている。
[多次元空間の確率場と確率計算]
図14は、第1の実施形態に係る多次元空間の確率場と確率計算を示す説明図であり、空間的な確率場による確率計算の手順を示している。
図14は、第1の実施形態に係る多次元空間の確率場と確率計算を示す説明図であり、空間的な確率場による確率計算の手順を示している。
上述したように電力系統は、面的な広がりを持つシステムであり、複数の原因と結果の関係があり、それらは面的な場所に依存する分布を持つ。そこで本実施形態では、面的な広がりを持つレイヤを用意して、各レイヤに原因の面的な分布を示し、空間的に配置する。
図14の例では、上から順に系統構成60のレイヤ60L、風速分布70のレイヤ70L、設備特性80のレイヤ80L、樹木分布90のレイヤ90Lを有する。最下段には、各レイヤ60L~90Lに示した原因の確率を組み合わせた結果の確率(条件付き確率)を表した事故予測レイヤ100Lを示している。組み合わせ確率は、各レイヤ60L~90Lの同一位置にある原因の確率を組み合わせて算出し、計算位置を図中の矢印102で指示する。この計算位置を各レイヤの面内で走査することにより、面的な確率分布が算出できる。なお、図14では、計算位置は、電力系統上の地絡事故の事故予測箇所101と一致している。
本実施形態は、上記の空間的確率場を利用して、原因と結果の関係を説明する手段として画面表示するという特徴を有する。いわゆる三次元グラフィックスの手法で複数レイヤの重なりを表示部45に表示して、視点を任意方向に切り替えたり、表示内容をリアルタイムに書き換えたりすることができる。また、レイヤと直交する方向に視点を移動して画面表示することで二次元表示になり、紙資料や従来の画面表示と同様の見せ方ができる。
[確率の空間分布の計算、設定]
図15は、第1の実施形態に係る空間的確率場で確率の空間分布を計算、設定する例を示した説明図である。
例えば樹木の生育箇所は点であるが、風による揺れによって電線に接触の恐れがあるとき、樹木の影響範囲は空間分布になる。この影響範囲を確率の空間分布で表記する。この空間分布は、地図のような2次元平面上では、2次元の正規分布を利用することができる。そして、空間的な樹木位置情報90Aにおける樹木の生育地点95,96に確率分布99を掛け合わせることで、樹木の空間的な確率分布(レイヤ90L)を算出、設定する。この掛け合わせの演算は、畳み込み積分を利用して行うことができる。このような遷移状態の原因及び/又は結果の確率を、該確率が空間的に分布する空間分布データとして、不揮発性ストレージ47に記憶しておく。また本実施形態は、このような確率の空間分布を設定(範囲設定、確率設定)する手段(操作部46)、及び表示する手段(表示部45)を備える。
図15は、第1の実施形態に係る空間的確率場で確率の空間分布を計算、設定する例を示した説明図である。
例えば樹木の生育箇所は点であるが、風による揺れによって電線に接触の恐れがあるとき、樹木の影響範囲は空間分布になる。この影響範囲を確率の空間分布で表記する。この空間分布は、地図のような2次元平面上では、2次元の正規分布を利用することができる。そして、空間的な樹木位置情報90Aにおける樹木の生育地点95,96に確率分布99を掛け合わせることで、樹木の空間的な確率分布(レイヤ90L)を算出、設定する。この掛け合わせの演算は、畳み込み積分を利用して行うことができる。このような遷移状態の原因及び/又は結果の確率を、該確率が空間的に分布する空間分布データとして、不揮発性ストレージ47に記憶しておく。また本実施形態は、このような確率の空間分布を設定(範囲設定、確率設定)する手段(操作部46)、及び表示する手段(表示部45)を備える。
また本実施形態は、空間的確率場で、微分、積分等の空間フィルタによる計算を行うことができる。空間フィルタは、例えば1次元の時系列信号、あるいは2次元の画像データを対象にするとき、ノイズ除去(積分型フィルタ)、エッジ強調(微分型フィルタ)などの効果が得られる。確率場を空間フィルタの対象にするとき、積分フィルタを掛ければ確率の影響範囲を広げる効果がある。また微分型フィルタを掛ければ確率の条件が変化する場所を見出せる効果がある。
[運用者による操作画面例]
本実施形態では、運用者が表示内容の詳細を調べる、あるいは関連事項を表示するために、例えばマウス(操作部46)をクリック操作して画面遷移したり、新たな表示窓を出したりすることができる。
本実施形態では、運用者が表示内容の詳細を調べる、あるいは関連事項を表示するために、例えばマウス(操作部46)をクリック操作して画面遷移したり、新たな表示窓を出したりすることができる。
図16~図19に運用者に提供する操作画面の一例を示す。
(警報表示画面)
図16は、第1の実施形態に係る警報表示画面110の一例を示す図である。
図16では、運用者が事故予測箇所101にカーソル113を合わせてクリックすることで、警報情報の表示窓111が表示される。例えば図16の表示窓111には、「気象情報と樹木生育状況から接触地絡事故の可能性あり」という警報メッセージが表示されている。
図16は、第1の実施形態に係る警報表示画面110の一例を示す図である。
図16では、運用者が事故予測箇所101にカーソル113を合わせてクリックすることで、警報情報の表示窓111が表示される。例えば図16の表示窓111には、「気象情報と樹木生育状況から接触地絡事故の可能性あり」という警報メッセージが表示されている。
また、図16の警報表示画面110には、分解表示ボタン112が表示されており、運用者が分解表示ボタン112を操作すると、警報表示画面110が図14に示すような複数のレイヤ(空間的確率場)に分解して表示される。これにより、運用者は、事故が発生した可能性の高い箇所を把握し、迅速に事故対策を講じることができる。
またさらに、図16の警報表示画面110は、日時入力欄114を有している。運用者が日時入力欄114に閲覧したい日時を入力すると、入力した日時の警報表示画面110が表示される。これにより、運用者は、日時を指定して必要な情報を確認することが可能となる。この日時入力欄114は、警報表示画面110だけではなく、図17~図19に示す他の画面にも表示するようにしてもよい。
(判定論理表示画面(修正画面))
図17は、第1の実施形態に係る判定論理表示画面(修正画面)120の一例を示す図である。
運用者が事故予測箇所101をカーソル113等により指定することで、状態遷移の予測に用いた論理(状態遷移図)の表示窓121(図8参照)が表示される。判定論理の情報としては、状態遷移図に限らず、遷移状態判定部306における判定条件を表示してもよい。判定条件としては、例えば「遷移確率が最も高い状態遷移を、最も尤もらしい状態遷移とする」などである。但し、複数の状態遷移間における遷移確率の差が小さい場合には、過去の実績を優先するなどの判定条件でもよい。さらに、表示窓121に、予測の根拠として確率計算の過程(例えば図9,図10等)を表示してもよい。
図17は、第1の実施形態に係る判定論理表示画面(修正画面)120の一例を示す図である。
運用者が事故予測箇所101をカーソル113等により指定することで、状態遷移の予測に用いた論理(状態遷移図)の表示窓121(図8参照)が表示される。判定論理の情報としては、状態遷移図に限らず、遷移状態判定部306における判定条件を表示してもよい。判定条件としては、例えば「遷移確率が最も高い状態遷移を、最も尤もらしい状態遷移とする」などである。但し、複数の状態遷移間における遷移確率の差が小さい場合には、過去の実績を優先するなどの判定条件でもよい。さらに、表示窓121に、予測の根拠として確率計算の過程(例えば図9,図10等)を表示してもよい。
また、判定論理表示画面(修正画面)120において、運用者は、操作部46を操作して表示窓121に表示される状態遷移の判定論理等を修正してもよい。例えば、状態遷移図の状態、又は状態間の遷移パスを指定し、状態遷移を修正する。
(復旧支援情報表示画面)
図18は、第1の実施形態に係る復旧支援情報表示画面130の一例を示す図である。
運用者が事故予測箇所101をカーソル113等により指定することで、電力系統1に事故が起きたときの復旧作業の推奨手順を示す復旧支援情報の表示窓131が表示される。例えば表示窓131には、「推定原因」、「復旧作業手順」、「作業に必要な道具」、「交換部品」等の項目が表示される。これにより、運用者の復旧作業及び判断を支援することができる。
図18は、第1の実施形態に係る復旧支援情報表示画面130の一例を示す図である。
運用者が事故予測箇所101をカーソル113等により指定することで、電力系統1に事故が起きたときの復旧作業の推奨手順を示す復旧支援情報の表示窓131が表示される。例えば表示窓131には、「推定原因」、「復旧作業手順」、「作業に必要な道具」、「交換部品」等の項目が表示される。これにより、運用者の復旧作業及び判断を支援することができる。
(事前対策提示画面)
図19は、第1の実施形態に係る事前対策提示画面140の一例を示す図である。
運用者が樹木の影響範囲91,92をカーソル113等により指定することで、事前対策情報の表示窓141が表示される。例えば図19の表示窓141には、「電線近隣の樹木の生育状況の把握と電線接触の可否を確認してください」という事前対策メッセージが表示されている。これにより、運用者は、事故が発生しそうな箇所を事前に把握し、提示された事前対策情報に沿って対策を講じることで、事故を未然に防ぐことができる。
図19は、第1の実施形態に係る事前対策提示画面140の一例を示す図である。
運用者が樹木の影響範囲91,92をカーソル113等により指定することで、事前対策情報の表示窓141が表示される。例えば図19の表示窓141には、「電線近隣の樹木の生育状況の把握と電線接触の可否を確認してください」という事前対策メッセージが表示されている。これにより、運用者は、事故が発生しそうな箇所を事前に把握し、提示された事前対策情報に沿って対策を講じることで、事故を未然に防ぐことができる。
上述した図16~図19に示すように、運用者が各表示画面において空間的な位置を指し示すことで、必要と思われる情報を用意に入手できるようにグラフィカル・ユーザー・インタフェース(GUI)を用意することで、運用者の作業の効率化が図れる。また、判定論理の理解を支援することで、判定結果に対する信頼性の向上を実現できる効果がある。このような効果は、従来技術である統計手法、ヒューリスティック手法、あるいは人工知能に類する技術が、内部論理を開示困難であるのに対して大きな相違である。
従来手法では、システム(電力系統1)に関わりのあるシステム外部の周辺情報を反映したシステム監視を行っていない。そのため、最初の原因(風が吹いた)と最後の結果(電線地絡)を確率的に関連付けることができず、ましてや途中過程の樹木の揺れを考慮することはできない。しかし現実には、樹木の状態が事故発生に大きな影響を持つため、本実施形態のように確率計算に取り込むことが望ましい。
本実施形態では、これらの個々の原因(事象)の確率を用意して、これらの原因の組み合わせの結果として事故が起きる確率を算出する。個々の原因の確率は、時間的、地理的に変化してよく、また最新の状態を反映するため逐次更新してよい。こうして、複数の原因の確率的な関連付けを開示することができる。
このような確率的な関係は、ベイジアンネットワーク、階層的ベイズ、あるいはベイズ・グラフィカルモデル、などの用語で示される技術を使って表記できる。本実施形態は、これらの確率的な関係の表記方法に限定されるものではない。
本実施形態は、複数の原因を組み合わせたときの確率を、条件付き確率として計算する。また、計算過程において、ベイズの公式(ベイズの定理)に基づく式の設定、変形を利用する。これにより、事前に用意した電力系統の事故の原因と結果の確率的な関係を参照して、実際に起きた結果から原因の確率を算出する。
ところで、原因と結果の確率的関係が確率分布として採取できるとき、モンテカルロ法(Monte Carlo method)に基づく確率計算を利用できる。具体的にはモンテカルロ法(Monte Carlo method)の発展であるMCMC法(Markov Chain Monte Carlo method)と呼ぶ確率分布に従った、模擬サンプリングの方法がある。そしてMCMC法に属する手法として、メトロポリス法(Metropolis method)、ギブスサンプリング(Gibbs sampling)がある。これらの手法を利用して、与えられた確率分布を模擬生成して確率計算に利用することで、統計的な計算を自在に行える。本実施形態は、原因と結果の確率計算において、これらのモンテカルロ法に基づく確率計算を利用することができる。
[運用者支援]
本実施形態は、電力系統の安定運用を実現するため、事故の発生数を減らし、また事故が起きたときの復旧時間を低減する。このため系統情報および周辺情報を入力し、運用者に対して予測される事故を提示する。その際、電力系統のように高い信頼性が求められるシステムの運用においては、説明困難な計算結果(判定論理)を利用することは好まれない。
本実施形態は、電力系統の安定運用を実現するため、事故の発生数を減らし、また事故が起きたときの復旧時間を低減する。このため系統情報および周辺情報を入力し、運用者に対して予測される事故を提示する。その際、電力系統のように高い信頼性が求められるシステムの運用においては、説明困難な計算結果(判定論理)を利用することは好まれない。
そこで本実施形態は、システムの信頼性の確保と検証を実現する手段を備える。具体的には、確率計算の手順と結果を運用者に提示する手段、確率計算の手順を運用者によって修正する手段、用意した確率計算の手順を試行的に実行する手段等を備える。
これに対して、従来技術であるニューロ計算や深層学習等の手法は、内部の計算手順を明示することができない。一方、クラスタリング手法は、信号の分類・判定は可能であるものの、逐次の計算手順を含まないので計算手順を修正することは困難である。このようにこれらの従来の手法、人工知能と呼ばれる技術の多くは、計算手順を順序立てて明示することが出来ない。
上記従来の手法は、原因と結果を一対一の関係で確率として表記することはできるが、複数種類の原因と結果が組み合わされて発生する事故については関連付けることができない。これは、信号の分類方法であるクラスタリング手法においても同様の課題がある。またメタヒューリスティック、人工知能等の手法は、内部論理が明示的に分からないことが多く、内部論理、即ち出力の妥当性を説明することは困難な場合が多い。
[本実施形態の効果]
上述した第1の実施形態によれば、電力系統1から得られる情報(例えば計測情報、系統情報)のみならず、関わりのある周辺情報を取り込んで遷移確率の計算に利用することで、次に遷移する状態の予測精度を向上させる効果がある。
上述した第1の実施形態によれば、電力系統1から得られる情報(例えば計測情報、系統情報)のみならず、関わりのある周辺情報を取り込んで遷移確率の計算に利用することで、次に遷移する状態の予測精度を向上させる効果がある。
さらに、電力系統1の状態に影響を与える周辺情報として、電力系統1の状態に対し時間的に先行する情報を入力することで、現在から未来の状態遷移の予測精度が向上する効果がある。
また、電力系統1を監視・運用する担当者に遷移予測の結果、および遷移予測の根拠(図17)を提示することで、作業手順における判断を支援する効果がある。
また、電力系統1の事前対策(図19)によって事故を未然に防止して、停電時間を減らす効果がある。
また発生した事故対応において尤もらしい事故原因(図18)を担当者に提示することで、復旧作業の時間短縮に効果がある。
また、電力系統1の事前対策(図19)によって事故を未然に防止して、停電時間を減らす効果がある。
また発生した事故対応において尤もらしい事故原因(図18)を担当者に提示することで、復旧作業の時間短縮に効果がある。
さらに、時間的、地理的に特異性がある場合は、その特異性を確率で表記(図13,図14)して、逐次に更新を繰り返して反映することで、予測精度を向上する効果がある。
[事故発生時の復旧手順]
従来、電力系統の事故の発生から復旧までの作業において、復旧までには、事故点の探索、事故原因判定など、人手による作業が多くある。以下に、従来の事故発生から復旧までの作業手順を箇条書きにする。括弧内の情報は、作業の主体又は説明である。
従来、電力系統の事故の発生から復旧までの作業において、復旧までには、事故点の探索、事故原因判定など、人手による作業が多くある。以下に、従来の事故発生から復旧までの作業手順を箇条書きにする。括弧内の情報は、作業の主体又は説明である。
・定常状態(事故発生前の状態)
・計測信号を用いて事象検出をする(システム監視装置)
・事象検出時には作業者を派遣する(人手)
・事故現場付近で事故点を探索する(人手)
・事故原因を判定する(人手)
・事故復旧作業に着手する(人手)
・事故除去の確認作業をする(人手)
・事故復旧する(人手)
・定常状態に復帰したことを確認する(システム監視装置)
・計測信号を用いて事象検出をする(システム監視装置)
・事象検出時には作業者を派遣する(人手)
・事故現場付近で事故点を探索する(人手)
・事故原因を判定する(人手)
・事故復旧作業に着手する(人手)
・事故除去の確認作業をする(人手)
・事故復旧する(人手)
・定常状態に復帰したことを確認する(システム監視装置)
電力系統に起きる事故は、設備・機器の故障のほか、気象等の電力系統周辺の状況によって引き起こされる事故が多いことがわかっている。本実施形態では、周辺情報に含まれる情報(システム状態に対し時間的に先行する情報が含まれる場合あり)を利用して事故を予測することで、事前対策、あるいは復旧作業の迅速化を実現することができる。
図20は、第1の実施形態に係る事故復旧手順を示すフローチャートである。
まず、システム監視装置30のCPU41(例えば状態検知部302)で検知される電力系統1の状態が、定常状態であることを前提とする(S21)。次に、状態検知部302は、入力部301で受け付けた計測信号を用いて、事象の検出を行う(S22)。
まず、システム監視装置30のCPU41(例えば状態検知部302)で検知される電力系統1の状態が、定常状態であることを前提とする(S21)。次に、状態検知部302は、入力部301で受け付けた計測信号を用いて、事象の検出を行う(S22)。
次に、状態検知部302は、電力系統1に何らかの事象が発生したかどうかを判定する(S23)。ここで事象が発生していない場合には(S23のNO)、ステップS21の処理に戻る。
次に、ステップS23において事象が発生したと判定された場合には(S23のYES)、原因推定部309は、遷移確率を用いて事象の原因を推定する(S24)。
次に、表示制御部307は、原因推定部309の判定結果に基づき、対策案を表示部308に提示し、運用者に判断を促す(S25)。ここで、原因が見つからない場合には、運用者に判断を促す(S26)。なお、このステップS25の処理における「原因が見つからない場合には、運用者に判断を促す」処理については、後述する第1の実施形態の第1変形例で詳細に説明する。
次に、表示制御部307は、表示部308に対策を表示することで、運用者に対策を指示する(S27)。この処理は、設備・機器の重故障などの著しい異常の場合など、異常の内容に応じて対策を指示するかどうかを含めて判断される。
ここで、作業員は、事故復旧作業に着手し、事故除去の確認作業をする。事故除去の確認が実施された後、事故復旧が行われる。
そして、状態検知部302は、入力部301に入力される計測情報を元に、電力系統1が定常状態に復帰したかどうかを判断する(S28)。ここで、定常状態に復帰していない場合には(S28のNO)、ステップS24の処理に進み、再度原因推定を行う。
一方、ステップS28において定常状態に復帰している場合には(S28のYES)、一連の事故復旧処理を終了する。
このように、本実施形態では、システム監視装置30が原因推定、対策案の提示等を行うことにより、人手が介在する手順を削減することができる。それゆえ、原因推定が迅速に行え、従来と比較して復旧作業を早められる。
<2.第1の実施形態の第1変形例>
[稀少事例、非合理、想定外、関連なし]
確率的な判定においては、尤もらしさ、整合性、矛盾、背反等の確率的な状況が発生することがある(図20のS26)。第1の実施形態の第1変形例は、これらの確率的な状況を運用者に示すことで、運用者の判断を促すことを特徴とする。
[稀少事例、非合理、想定外、関連なし]
確率的な判定においては、尤もらしさ、整合性、矛盾、背反等の確率的な状況が発生することがある(図20のS26)。第1の実施形態の第1変形例は、これらの確率的な状況を運用者に示すことで、運用者の判断を促すことを特徴とする。
事前に用意する確率データには、事前に想定できない原因と結果を含めることはできない。例えば、極めて大規模な事故が起きるような事象は、その頻度が低いために確率的な関係を設定することが難しい。このような原因により結果が起きたとき、上述した原因推定の手順により確率的に尤もらしい原因は求められるが、本来の原因は事前に準備してないので、尤もらしさは低い。この状況は計測信号にノイズが入る場合にも起こりうる。
第1の実施形態の第1変形例では、原因と結果の確率的な関係の尤もらしさが低い場合には、その状況を運用者に提示することで運用者の判断を促す。
第1の実施形態の第1変形例では、原因と結果の確率的な関係の尤もらしさが低い場合には、その状況を運用者に提示することで運用者の判断を促す。
また、出現頻度に基づく手法は、稀に起きる状態は、頻度の高い状態に取り込まれて区別ができなくなる場合がある。計測信号が、事前に準備した原因との関連が低い場合には、ノイズと判定して除外する。これにより、状態検知部302に有意な信号を通過させ、状態検知部302をノイズを排除するフィルタとして動作する。ノイズを排除することで信号解析の精度を向上させることができる。さらに、ノイズを排除することで、事故復旧作業の誤った出動を無くすことができる。
さらに、多種多様なデータをシステム監視装置30へ入力するとき、複数の計測信号の内容が整合しない場合がある。例えば計測信号から推定した原因が樹木接触であるにかかわらず、別の計測信号として入手した気象データは無風状態であることを示す場合には、無風であるのに樹木が揺れて線路と接触したことになり、原因と結果が整合しない。どちらかの情報にノイズが含まれているのか、あるいは想定外の理由で樹木が揺れたのかは、事前の原因と結果の関連付けからは判断できない。また、計測信号から推定した原因が樹木接触であるとき、別の計測信号として入手した地図データは電力系統の付近に樹木が無いことを示すとき、地図では樹木が無いのに樹木が揺れて線路と接触したことになり、原因と結果が整合しない。
第1の実施形態の第1変形例では、このような判定論理における矛盾が観測されたとき、その矛盾を運用者に提示することで運用者の判断を促す。
第1の実施形態の第1変形例では、このような判定論理における矛盾が観測されたとき、その矛盾を運用者に提示することで運用者の判断を促す。
このように、事前に想定できない、あるいは稀な原因であり、確率を設定できない原因については、事前に原因と結果を確率的に関連付けることができない。また確率的に尤もらしい原因を見付けながら、周辺情報とは背反する場合がある。このような場合、第1の実施形態の第1変形例は、事前に想定していなかった事故が起きた可能性があるとして、この背反の状況を運用者に提示して判断を促す手段を備える。具体的には表示部308に運用者への警報を表示する。
<3.第1の実施形態の第2変形例>
[高速化、非同期アクセス]
状態遷移の予測には、遷移可能性のある状態、遷移の原因、遷移の確率等の情報(以下「関連情報」という)を記憶部から読み出して利用する。この記憶部としては、メモリ、ハードディスク等のほか、ネットワークN経由でアクセスするデータセンタ、クラウドシステムなどがある。
[高速化、非同期アクセス]
状態遷移の予測には、遷移可能性のある状態、遷移の原因、遷移の確率等の情報(以下「関連情報」という)を記憶部から読み出して利用する。この記憶部としては、メモリ、ハードディスク等のほか、ネットワークN経由でアクセスするデータセンタ、クラウドシステムなどがある。
システム監視装置30が、これらの記憶部から関連情報を読み出すとき、その伝送容量、伝送速度等の制約から、検索結果を得るまでの時間遅延が発生する。また運用者による指示によって支援データを検索するとき、運用者が検索キーを考えて、キーボード入力するまでに手間と時間が掛かる。
第1の実施形態の第2変形例は、システム監視装置30が、状態遷移に関わる確率計算をするとき、関連するデータ操作者の指示を待たずに関連する情報検索を発行して高速のバッファに蓄積しておく。それにより、運用者の指示が出たときには、システム監視装置30は該バッファを対象にデータアクセスすることで高速な応答を実現する。この動作は、言い換えれば、状態遷移に基づいてデータ検索を非同期で実行する。非同期に検索を行いバッファに蓄積した関連データについては、バッファから読み出せばよいので極めて高速に読み出せることになる。
<4.第2の実施形態>
[粒子フィルタによる確率計算]
第2の実施形態では、状態遷移の遷移確率の計算の手段としてカルマンフィルタに着目する。カルマンフィルタは、ノイズのあるシステムを対象に、確率的に尤もらしい状態を逐次計算する手法として広く利用されている。また、その派生方式である粒子フィルタは、確率分布を多数の粒子で近似する数値計算法であり、非線形、非ガウスのシステムを扱えるという特徴がある。一方、多数の粒子を用いて繰り返し計算するため演算量が多くなる。このように粒子フィルタは、高い柔軟性を備える確率計算の手法であるが、計算時間が課題になる。今後の計算機の性能向上は期待できるものの、計算を高速化できるならば差別化技術として利用できる。以下、粒子フィルタの高速演算の手法について検討する。
[粒子フィルタによる確率計算]
第2の実施形態では、状態遷移の遷移確率の計算の手段としてカルマンフィルタに着目する。カルマンフィルタは、ノイズのあるシステムを対象に、確率的に尤もらしい状態を逐次計算する手法として広く利用されている。また、その派生方式である粒子フィルタは、確率分布を多数の粒子で近似する数値計算法であり、非線形、非ガウスのシステムを扱えるという特徴がある。一方、多数の粒子を用いて繰り返し計算するため演算量が多くなる。このように粒子フィルタは、高い柔軟性を備える確率計算の手法であるが、計算時間が課題になる。今後の計算機の性能向上は期待できるものの、計算を高速化できるならば差別化技術として利用できる。以下、粒子フィルタの高速演算の手法について検討する。
(粒子フィルタの高速化)
状態空間モデルにより表記した確率システムを下記に示す。


状態空間モデルにより表記した確率システムを下記に示す。
ここで、xtは状態ベクトル、ytは観測ベクトルであり、wtはシステムノイズ、vtは観測ノイズである。またfはシステム方程式、hが観測方程式を示す。添え字tは時間ステップを示す。システムに発生したシステムノイズを、観測ノイズが生じる観測器で採取する手順を持ち、両者のノイズがある中で最も尤もらしい状態値が算出される。なお、1入力1出力のシステムは、式(11)及び式(12)のように簡単に表すことができる。


上記システムでノイズが正規分布ならば推定値は解析的に求められる。しかし、事故原因となる事象は正規分布になるとは限らない。粒子フィルタは確率分布を多数の粒子で近似するので、確率分布の形状に制約がない。
図21は、粒子フィルタの典型的な計算手順を示した説明図である。
システムノイズと観測ノイズに対し事故原因が備える確率分布を設定することで、結果として二つの確率分布の同時確率が得られる。
システムノイズと観測ノイズに対し事故原因が備える確率分布を設定することで、結果として二つの確率分布の同時確率が得られる。
ところで、粒子フィルタは、計算過程で粒子の重み(図21のwt(i))が変化する性質があり、このため粒子の重みと個数を正規化する手順が、繰り返し計算ごとに必要になる。これが、リサンプリングと呼ばれる粒子フィルタを特徴付ける処理である。
なお、図21、及び後述する図22、図23の内容は、『樋口知之、「予測にいかす統計モデリングの基本」、講談社、2011』より抽出したものである。また、カルマンフィルタについての一般的な説明は、『片山徹、「非線形カルマンフィルタ」、朝倉出版、978-4-254-20148-2』に詳しく記載されている。
粒子フィルタの計算は、個々の粒子を扱う処理と、全体の粒子を扱う処理とが混在する。その中でリサンプリングは正規化を目的とするので、粒子全体を扱う演算になる。確率計算の事故対応への適用を考えるとき、高速化は重要な要請になる。そこで、発明者らはリサンプリング処理に着目し、従来方式に代わる新たな高速化手法を検討した。
図22は、粒子フィルタの一般的なリサンプリング処理の手順を示すグラフである。
まず、図22を参照して、一般的なリサンプリング処理の手順を示す。粒子番号をj=1~Mとおき、次の処理を実行する。その結果、重みの等しい新しく配置された粒子を作ることができる。
まず、図22を参照して、一般的なリサンプリング処理の手順を示す。粒子番号をj=1~Mとおき、次の処理を実行する。その結果、重みの等しい新しく配置された粒子を作ることができる。
(1)乱数rndを生成する。
(2)次の式(13)の条件を満たす粒子番号iを見つける。

(3)新しい粒子を式(14)のように設定する。

(2)次の式(13)の条件を満たす粒子番号iを見つける。
ここでリサンプリング処理を、個々の粒子の整数化演算で生じる誤差を全体としてキャンセルすること、と解釈することにする。そして、この手順は粒子フィルタに特有ではなく、画像処理の分野で知られている誤差拡散処理に類似していることに着目する。例えば1画素あたり多値レベルの信号を入力して2値レベルのプリンタで出力するならば、入出力で誤差が生じる。この誤差を隣接する画素に受け渡し、画面全体として誤差をキャンセルすることで、2値レベルのプリンタで多値レベルに相当する出力画像が得られる。
図23は、誤差拡散を利用した粒子フィルタのリサンプリング処理の手順を示す。
粒子の大きさ(重み)wt(i)から粒子の個数を算出することは、大きさを整数化することに相当して小数部分が誤差として残る。この残された誤差を隣接する粒子に拡散(図中の矢印)することで、全体として誤差をキャンセルする。プログラムとしては、粒子の大きさwt(i)の整数化、誤差算出、隣接粒子の重みの修正という簡単な手順で実現できる。この手法は、粒子と隣接粒子とで処理が完結し、粒子全体を参照しなくてよい。この結果、処理ステップが削減され高速化に寄与するほか、並列化処理の実現可能性が出てくる。
粒子の大きさ(重み)wt(i)から粒子の個数を算出することは、大きさを整数化することに相当して小数部分が誤差として残る。この残された誤差を隣接する粒子に拡散(図中の矢印)することで、全体として誤差をキャンセルする。プログラムとしては、粒子の大きさwt(i)の整数化、誤差算出、隣接粒子の重みの修正という簡単な手順で実現できる。この手法は、粒子と隣接粒子とで処理が完結し、粒子全体を参照しなくてよい。この結果、処理ステップが削減され高速化に寄与するほか、並列化処理の実現可能性が出てくる。
留意点として、最後の粒子で生じる誤差は受取先となる粒子が無いため残差になる。また、誤差を拡散する粒子の選び方によって確率分布にバイアスが生じることがある。しかし、全体の粒子数が多ければこれらの影響は軽微になる。さらに、誤差の拡散先を複数粒子にすることでこれらの影響を軽減できる。
<5.その他>
さらに、本発明は上述した各実施形態例に限られるものではなく、請求の範囲に記載した本発明の要旨を逸脱しない限りにおいて、その他種々の応用例、変形例を取り得ることは勿論である。
さらに、本発明は上述した各実施形態例に限られるものではなく、請求の範囲に記載した本発明の要旨を逸脱しない限りにおいて、その他種々の応用例、変形例を取り得ることは勿論である。
例えば、上述した実施形態例は本発明を分かりやすく説明するために装置及びシステムの構成を詳細且つ具体的に説明したものであり、必ずしも説明した全ての構成を備えるものに限定されるものではない。また、ある実施形態例の構成の一部を他の実施形態例の構成に置き換えることは可能である。また、ある実施形態例の構成に他の実施形態例の構成を加えることも可能である。また、各実施形態例の構成の一部について、他の構成の追加、削除、置換をすることも可能である。
また、上記の各構成、機能、処理部、処理手段等は、それらの一部又は全部を、例えば集積回路で設計する等によりハードウェアで実現してもよい。また、上記の各構成、機能等は、プロセッサがそれぞれの機能を実現するプログラムを解釈し、実行することによりソフトウェアで実現してもよい。各機能を実現するプログラム、テーブル、ファイル等の情報は、メモリやハードディスク、SSD(Solid State Drive)等の記録装置、又はICカード、SDカード、DVD等の記録媒体に置くことができる。
また、制御線や情報線は説明上必要と考えられるものを示しており、製品上必ずしも全ての制御線や情報線を示しているとは限らない。実際には殆ど全ての構成が相互に接続されていると考えてもよい。
また、本明細書において、時系列的な処理を記述する処理ステップは、記載された順序に沿って時系列的に行われる処理はもちろん、必ずしも時系列的に処理されなくても、並列的あるいは個別に実行される処理(例えば、並列処理あるいはオブジェクトによる処理)をも含むものである。
1…電力系統、 9…センサ付き開閉器、 30…システム監視装置、 40…コンピュータ、 41…CPU、 45…表示部、 46…操作部、 47…不揮発性ストレージ、 51~53…確率のテーブル、 54…事象テーブル、 110…警報表示画面、 111…警報情報、 112…分解表示ボタン、 113…日付入力欄、 120…判定論理表示(修正)画面、 121…状態遷移図、 130…復旧支援情報表示画面、 140…事前対策提示画面、 301…入力部、 302…システム状態判定部、 303…履歴情報記憶部、 304…状態遷移記憶部、 305…遷移確率算出部、 306…遷移状態判定部、 307…表示制御部、 308…表示部、 309…原因推定部、 310…因果関係記憶部、 311…事象確率記憶部、 312…支援情報記憶部、 321…状態遷移設定部、 322…確率算出方式設定部、 323…判定論理設定部、 324…確率設定部
Claims (9)
- 対象システムの複数の状態と、前記複数の状態の中の一の状態から他の状態への状態遷移の経路とを含む状態遷移情報を記憶する記憶部と、
前記対象システムに設けられたセンサで計測された情報である計測情報、及び前記対象システムに関わりを持つ周辺情報の入力を受け付ける入力部と、
前記入力部で受け付けた前記計測情報から、前記対象システムの現在の状態を検知する状態検知部と、
前記状態検知部で検知された前記対象システムの現在の状態と、前記記憶部に記憶された前記状態遷移情報と、前記入力部で受け付けた前記周辺情報とを元に、前記現在の状態から他の状態への遷移確率を算出する遷移確率算出部と、
前記遷移確率に基づいて前記現在の状態から遷移する次の状態を判定する遷移状態判定部と、
前記遷移状態判定部の判定結果を出力する出力部と、を備える
システム監視装置。 - 前記周辺情報は、前記対象システムの状態に対し時間的に先行する情報を含む
請求項1に記載のシステム監視装置。 - 前記出力部は、前記遷移状態判定部の判定結果と当該判定結果の判定論理とを出力する
請求項1に記載のシステム監視装置。 - 前記状態遷移の原因及び/又は結果の確率を、該確率が空間的に分布する空間分布データとして記憶する記憶部と、
前記出力部は、前記原因及び/又は前記結果の前記空間分布データを出力する
請求項1に記載のシステム監視装置。 - 前記記憶部には、複数の原因としての事象が組み合わされて起きる結果としての事象の条件付き確率が格納されており、当該条件付き確率が、前記計測情報及び前記周辺情報により逐次更新される
請求項1に記載のシステム監視装置。 - 前記出力部は、前記状態遷移の原因と結果の確率的な関係の尤もらしさが低い場合には、警報を出力する
請求項1に記載のシステム監視装置。 - 前記遷移状態判定部の前記判定結果に至る判定論理を修正するための操作部、を更に備える
請求項1に記載のシステム監視装置。 - 前記対象システムは、電力系統である
請求項1乃至5のいずれか一項に記載のシステム監視装置。 - 対象システムに設けられたセンサで計測された情報である計測情報、及び前記対象システムに関わりを持つ周辺情報の入力を受け付ける手順と、
受け付けた前記計測情報から、前記対象システムの現在の状態を検知する手順と、
検知された前記対象システムの現在の状態と、前記対象システムの複数の状態と前記複数の状態の中の一の状態から他の状態への状態遷移の経路とを含む状態遷移情報と、受け付けた前記周辺情報とを元に、前記現在の状態から他の状態への遷移確率を算出する手順と、
前記遷移確率に基づいて前記現在の状態から遷移する次の状態を判定する手順と、
前記判定の結果を出力する手順を
コンピュータに実行させるためのプログラム。
Priority Applications (1)
| Application Number | Priority Date | Filing Date | Title |
|---|---|---|---|
| EP17806184.2A EP3467984A4 (en) | 2016-05-30 | 2017-04-10 | SYSTEM MONITOR AND PROGRAM |
Applications Claiming Priority (2)
| Application Number | Priority Date | Filing Date | Title |
|---|---|---|---|
| JP2016-107034 | 2016-05-30 | ||
| JP2016107034A JP6796399B2 (ja) | 2016-05-30 | 2016-05-30 | 電力系統監視装置及びプログラム |
Publications (1)
| Publication Number | Publication Date |
|---|---|
| WO2017208623A1 true WO2017208623A1 (ja) | 2017-12-07 |
Family
ID=60479596
Family Applications (1)
| Application Number | Title | Priority Date | Filing Date |
|---|---|---|---|
| PCT/JP2017/014619 Ceased WO2017208623A1 (ja) | 2016-05-30 | 2017-04-10 | システム監視装置及びプログラム |
Country Status (3)
| Country | Link |
|---|---|
| EP (1) | EP3467984A4 (ja) |
| JP (1) | JP6796399B2 (ja) |
| WO (1) | WO2017208623A1 (ja) |
Cited By (1)
| Publication number | Priority date | Publication date | Assignee | Title |
|---|---|---|---|---|
| US12517280B2 (en) | 2018-11-09 | 2026-01-06 | Itron, Inc. | Techniques for geolocation and cloud detection with voltage data from solar homes |
Families Citing this family (11)
| Publication number | Priority date | Publication date | Assignee | Title |
|---|---|---|---|---|
| JP7158187B2 (ja) * | 2018-07-06 | 2022-10-21 | 関西電力株式会社 | 電力系統監視装置及び電力系統監視方法 |
| ES3057343T3 (en) * | 2018-11-27 | 2026-02-27 | Fujitsu Frontech Ltd | Cause estimation device, cause estimation output method, and paper sheet handling device |
| EP3751699B1 (de) | 2019-06-13 | 2021-09-15 | Siemens Aktiengesellschaft | Verfahren und anordnung zur schätzung eines netzzustands eines energieverteilungsnetzes |
| US12251842B2 (en) | 2019-07-22 | 2025-03-18 | Nec Corporation | Information processing device, control method, and storage medium |
| KR102561790B1 (ko) * | 2020-11-02 | 2023-08-01 | 광주과학기술원 | 폐루프 배전계통의 보호장치 및 인공지능 장치 |
| JP7508383B2 (ja) * | 2021-02-09 | 2024-07-01 | 株式会社日立製作所 | 電力系統監視制御装置、およびその制御方法 |
| JP7745432B2 (ja) * | 2021-11-02 | 2025-09-29 | 三菱重工業株式会社 | 被害予測装置、被害予測方法及びプログラム |
| JP7847442B2 (ja) * | 2022-02-07 | 2026-04-17 | 三菱電機株式会社 | 停電情報提供装置、停電情報提供システムおよびプログラム |
| JP7826775B2 (ja) * | 2022-03-23 | 2026-03-10 | 中国電力株式会社 | 事故原因推定装置、事故原因推定装置の制御方法及びプログラム |
| JP2024020696A (ja) * | 2022-08-02 | 2024-02-15 | 株式会社日立製作所 | 電力系統故障原因推定方法及び装置 |
| CN121036334B (zh) * | 2025-08-19 | 2026-04-10 | 青岛海青汽车股份有限公司 | 一种基于移动变电站的设备运行状态可视化分析系统 |
Citations (2)
| Publication number | Priority date | Publication date | Assignee | Title |
|---|---|---|---|---|
| JP2006259862A (ja) * | 2005-03-15 | 2006-09-28 | Toshiba Corp | ベイジアンネットワーク作成装置及び方法並びにプログラム |
| JP2013208042A (ja) * | 2012-03-29 | 2013-10-07 | Toshiba Corp | 電力系統監視システム |
Family Cites Families (3)
| Publication number | Priority date | Publication date | Assignee | Title |
|---|---|---|---|---|
| US10630099B2 (en) * | 2013-06-11 | 2020-04-21 | International Business Machines Corporation | Reducing conversion losses and minimizing load via appliance level distributed storage |
| US20170017215A1 (en) * | 2013-12-10 | 2017-01-19 | Panasonic Intellectual Property Management Co., Ltd. | Demand prediction system and program |
| US20150262110A1 (en) * | 2014-03-11 | 2015-09-17 | General Electric Company | Systems and methods for utility crew forecasting |
-
2016
- 2016-05-30 JP JP2016107034A patent/JP6796399B2/ja active Active
-
2017
- 2017-04-10 WO PCT/JP2017/014619 patent/WO2017208623A1/ja not_active Ceased
- 2017-04-10 EP EP17806184.2A patent/EP3467984A4/en active Pending
Patent Citations (2)
| Publication number | Priority date | Publication date | Assignee | Title |
|---|---|---|---|---|
| JP2006259862A (ja) * | 2005-03-15 | 2006-09-28 | Toshiba Corp | ベイジアンネットワーク作成装置及び方法並びにプログラム |
| JP2013208042A (ja) * | 2012-03-29 | 2013-10-07 | Toshiba Corp | 電力系統監視システム |
Non-Patent Citations (2)
| Title |
|---|
| See also references of EP3467984A4 * |
| YUJIA ZHOU: "Modeling Weather-Related Failures of Overhead Distribution Lines", IEEE TRANSACTIONS ON POWER SYSTEMS, vol. 21, no. 4, November 2006 (2006-11-01), pages 1683 - 1690, XP011149790 * |
Cited By (1)
| Publication number | Priority date | Publication date | Assignee | Title |
|---|---|---|---|---|
| US12517280B2 (en) | 2018-11-09 | 2026-01-06 | Itron, Inc. | Techniques for geolocation and cloud detection with voltage data from solar homes |
Also Published As
| Publication number | Publication date |
|---|---|
| JP2017216757A (ja) | 2017-12-07 |
| EP3467984A4 (en) | 2019-11-13 |
| EP3467984A1 (en) | 2019-04-10 |
| JP6796399B2 (ja) | 2020-12-09 |
Similar Documents
| Publication | Publication Date | Title |
|---|---|---|
| JP6796399B2 (ja) | 電力系統監視装置及びプログラム | |
| US12560639B2 (en) | Tracking of health and resilience of physical equipment and related systems | |
| Amini et al. | Electrical energy systems resilience: A comprehensive review on definitions, challenges, enhancements and future proceedings | |
| US20130191052A1 (en) | Real-time simulation of power grid disruption | |
| Mazhari et al. | A hybrid fault cluster and thévenin equivalent based framework for rotor angle stability prediction | |
| US20230118175A1 (en) | Event analysis in an electric power system | |
| Garcia et al. | Line outage localization using phasor measurement data in transient state | |
| Finogeev et al. | Collection and consolidation of big data for proactive monitoring of critical events at infrastructure facilities in an urban environment | |
| CN110347717A (zh) | 一种基于城市电力设备监测的大数据存储方法 | |
| CN120802153A (zh) | 物联网环境下电压传感器多参数实时监测方法及装置 | |
| Fahim et al. | The role of machine learning in improving power distribution systems resilience | |
| Reda et al. | Online detection of faults in transmission lines | |
| Khediri et al. | Deep-belief network based prediction model for power outage in smart grid | |
| Baloch et al. | Artificial Intelligence-Enhanced Fault Detection, Diagnosis, and Predictive Maintenance in Next-Generation Smart Grids | |
| Bajagain et al. | Spectral clustering for fast outage detection and visualization in power distribution systems | |
| CN117973609A (zh) | 一种变电站区域洪涝预测预警方法、装置及介质 | |
| Wanik et al. | PMU analytics for power fault awareness and prediction | |
| Chren | Towards multi-layered reliability analysis in smart grids | |
| Guo | Data analytics and application developments based on synchrophasor measurements | |
| Sheeba et al. | WFCM based big sensor data error detection and correction in wireless sensor network | |
| Mendhiratta et al. | Leveraging Graph Digital Twin for Fault Detection and Improved Power Grid Stability in Smart Cities | |
| Zhu et al. | An improved graph theoretic approach for quantifying the severity of branch interruptions in power system | |
| Han et al. | Design and application of secondary operation and maintenance supervision system based on AR modeling and indoor positioning | |
| Obbayed et al. | Fault Detection and Diagnosis in Smart Grids Using Modified Dragonfly with Adaptive Neuro-Fuzzy Inference System | |
| Chandrarathna | Historical phasor measurement unit (PMU) data analysis by using machine learning techniques for anomaly detection in power systems |
Legal Events
| Date | Code | Title | Description |
|---|---|---|---|
| NENP | Non-entry into the national phase |
Ref country code: DE |
|
| 121 | Ep: the epo has been informed by wipo that ep was designated in this application |
Ref document number: 17806184 Country of ref document: EP Kind code of ref document: A1 |
|
| ENP | Entry into the national phase |
Ref document number: 2017806184 Country of ref document: EP Effective date: 20190102 |