WO2017208623A1 - Dispositif et programme de surveillance de système - Google Patents
Dispositif et programme de surveillance de système Download PDFInfo
- Publication number
- WO2017208623A1 WO2017208623A1 PCT/JP2017/014619 JP2017014619W WO2017208623A1 WO 2017208623 A1 WO2017208623 A1 WO 2017208623A1 JP 2017014619 W JP2017014619 W JP 2017014619W WO 2017208623 A1 WO2017208623 A1 WO 2017208623A1
- Authority
- WO
- WIPO (PCT)
- Prior art keywords
- state
- transition
- probability
- information
- unit
- Prior art date
- Legal status (The legal status is an assumption and is not a legal conclusion. Google has not performed a legal analysis and makes no representation as to the accuracy of the status listed.)
- Ceased
Links
Images









Classifications
-
- H—ELECTRICITY
- H02—GENERATION; CONVERSION OR DISTRIBUTION OF ELECTRIC POWER
- H02J—ELECTRIC POWER NETWORKS; CIRCUIT ARRANGEMENTS OR SYSTEMS FOR SUPPLYING OR DISTRIBUTING ELECTRIC POWER; SYSTEMS FOR STORING ELECTRIC ENERGY
- H02J3/00—Circuit arrangements for AC mains or AC distribution networks
- H02J3/003—Load forecast, e.g. methods or systems for forecasting future load demand
-
- H—ELECTRICITY
- H02—GENERATION; CONVERSION OR DISTRIBUTION OF ELECTRIC POWER
- H02J—ELECTRIC POWER NETWORKS; CIRCUIT ARRANGEMENTS OR SYSTEMS FOR SUPPLYING OR DISTRIBUTING ELECTRIC POWER; SYSTEMS FOR STORING ELECTRIC ENERGY
- H02J13/00—Circuit arrangements for providing remote monitoring or remote control of equipment in a power distribution network
-
- H—ELECTRICITY
- H02—GENERATION; CONVERSION OR DISTRIBUTION OF ELECTRIC POWER
- H02J—ELECTRIC POWER NETWORKS; CIRCUIT ARRANGEMENTS OR SYSTEMS FOR SUPPLYING OR DISTRIBUTING ELECTRIC POWER; SYSTEMS FOR STORING ELECTRIC ENERGY
- H02J13/00—Circuit arrangements for providing remote monitoring or remote control of equipment in a power distribution network
- H02J13/12—Monitoring network conditions, e.g. electrical magnitudes or operational status
-
- H—ELECTRICITY
- H02—GENERATION; CONVERSION OR DISTRIBUTION OF ELECTRIC POWER
- H02J—ELECTRIC POWER NETWORKS; CIRCUIT ARRANGEMENTS OR SYSTEMS FOR SUPPLYING OR DISTRIBUTING ELECTRIC POWER; SYSTEMS FOR STORING ELECTRIC ENERGY
- H02J13/00—Circuit arrangements for providing remote monitoring or remote control of equipment in a power distribution network
- H02J13/18—Circuit arrangements for providing remote monitoring or remote control of equipment in a power distribution network characterised by the remotely-controlled equipment, e.g. converters or transformers
- H02J13/333—Circuit arrangements for providing remote monitoring or remote control of equipment in a power distribution network characterised by the remotely-controlled equipment, e.g. converters or transformers the equipment forming part of substations
-
- H—ELECTRICITY
- H02—GENERATION; CONVERSION OR DISTRIBUTION OF ELECTRIC POWER
- H02J—ELECTRIC POWER NETWORKS; CIRCUIT ARRANGEMENTS OR SYSTEMS FOR SUPPLYING OR DISTRIBUTING ELECTRIC POWER; SYSTEMS FOR STORING ELECTRIC ENERGY
- H02J3/00—Circuit arrangements for AC mains or AC distribution networks
-
- H—ELECTRICITY
- H02—GENERATION; CONVERSION OR DISTRIBUTION OF ELECTRIC POWER
- H02J—ELECTRIC POWER NETWORKS; CIRCUIT ARRANGEMENTS OR SYSTEMS FOR SUPPLYING OR DISTRIBUTING ELECTRIC POWER; SYSTEMS FOR STORING ELECTRIC ENERGY
- H02J3/00—Circuit arrangements for AC mains or AC distribution networks
- H02J3/38—Arrangements for feeding a single network from two or more generators or sources in parallel; Arrangements for feeding already energised networks from additional generators or sources in parallel
- H02J3/381—Dispersed generators
-
- H—ELECTRICITY
- H02—GENERATION; CONVERSION OR DISTRIBUTION OF ELECTRIC POWER
- H02J—ELECTRIC POWER NETWORKS; CIRCUIT ARRANGEMENTS OR SYSTEMS FOR SUPPLYING OR DISTRIBUTING ELECTRIC POWER; SYSTEMS FOR STORING ELECTRIC ENERGY
- H02J2101/00—Supply or distribution of decentralised, dispersed or local electric power generation
- H02J2101/20—Dispersed power generation using renewable energy sources
-
- H—ELECTRICITY
- H02—GENERATION; CONVERSION OR DISTRIBUTION OF ELECTRIC POWER
- H02J—ELECTRIC POWER NETWORKS; CIRCUIT ARRANGEMENTS OR SYSTEMS FOR SUPPLYING OR DISTRIBUTING ELECTRIC POWER; SYSTEMS FOR STORING ELECTRIC ENERGY
- H02J2101/00—Supply or distribution of decentralised, dispersed or local electric power generation
- H02J2101/20—Dispersed power generation using renewable energy sources
- H02J2101/22—Solar energy
-
- H—ELECTRICITY
- H02—GENERATION; CONVERSION OR DISTRIBUTION OF ELECTRIC POWER
- H02J—ELECTRIC POWER NETWORKS; CIRCUIT ARRANGEMENTS OR SYSTEMS FOR SUPPLYING OR DISTRIBUTING ELECTRIC POWER; SYSTEMS FOR STORING ELECTRIC ENERGY
- H02J2103/00—Details of circuit arrangements for mains or AC distribution networks
- H02J2103/30—Simulating, planning, modelling, reliability check or computer assisted design [CAD] of electric power networks
-
- Y—GENERAL TAGGING OF NEW TECHNOLOGICAL DEVELOPMENTS; GENERAL TAGGING OF CROSS-SECTIONAL TECHNOLOGIES SPANNING OVER SEVERAL SECTIONS OF THE IPC; TECHNICAL SUBJECTS COVERED BY FORMER USPC CROSS-REFERENCE ART COLLECTIONS [XRACs] AND DIGESTS
- Y02—TECHNOLOGIES OR APPLICATIONS FOR MITIGATION OR ADAPTATION AGAINST CLIMATE CHANGE
- Y02E—REDUCTION OF GREENHOUSE GAS [GHG] EMISSIONS, RELATED TO ENERGY GENERATION, TRANSMISSION OR DISTRIBUTION
- Y02E40/00—Technologies for an efficient electrical power generation, transmission or distribution
- Y02E40/70—Smart grids as climate change mitigation technology in the energy generation sector
-
- Y—GENERAL TAGGING OF NEW TECHNOLOGICAL DEVELOPMENTS; GENERAL TAGGING OF CROSS-SECTIONAL TECHNOLOGIES SPANNING OVER SEVERAL SECTIONS OF THE IPC; TECHNICAL SUBJECTS COVERED BY FORMER USPC CROSS-REFERENCE ART COLLECTIONS [XRACs] AND DIGESTS
- Y02—TECHNOLOGIES OR APPLICATIONS FOR MITIGATION OR ADAPTATION AGAINST CLIMATE CHANGE
- Y02E—REDUCTION OF GREENHOUSE GAS [GHG] EMISSIONS, RELATED TO ENERGY GENERATION, TRANSMISSION OR DISTRIBUTION
- Y02E60/00—Enabling technologies; Technologies with a potential or indirect contribution to GHG emissions mitigation
-
- Y—GENERAL TAGGING OF NEW TECHNOLOGICAL DEVELOPMENTS; GENERAL TAGGING OF CROSS-SECTIONAL TECHNOLOGIES SPANNING OVER SEVERAL SECTIONS OF THE IPC; TECHNICAL SUBJECTS COVERED BY FORMER USPC CROSS-REFERENCE ART COLLECTIONS [XRACs] AND DIGESTS
- Y04—INFORMATION OR COMMUNICATION TECHNOLOGIES HAVING AN IMPACT ON OTHER TECHNOLOGY AREAS
- Y04S—SYSTEMS INTEGRATING TECHNOLOGIES RELATED TO POWER NETWORK OPERATION, COMMUNICATION OR INFORMATION TECHNOLOGIES FOR IMPROVING THE ELECTRICAL POWER GENERATION, TRANSMISSION, DISTRIBUTION, MANAGEMENT OR USAGE, i.e. SMART GRIDS
- Y04S10/00—Systems supporting electrical power generation, transmission or distribution
- Y04S10/12—Monitoring or controlling equipment for energy generation units, e.g. distributed energy generation [DER] or load-side generation
- Y04S10/123—Monitoring or controlling equipment for energy generation units, e.g. distributed energy generation [DER] or load-side generation the energy generation units being or involving renewable energy sources
-
- Y—GENERAL TAGGING OF NEW TECHNOLOGICAL DEVELOPMENTS; GENERAL TAGGING OF CROSS-SECTIONAL TECHNOLOGIES SPANNING OVER SEVERAL SECTIONS OF THE IPC; TECHNICAL SUBJECTS COVERED BY FORMER USPC CROSS-REFERENCE ART COLLECTIONS [XRACs] AND DIGESTS
- Y04—INFORMATION OR COMMUNICATION TECHNOLOGIES HAVING AN IMPACT ON OTHER TECHNOLOGY AREAS
- Y04S—SYSTEMS INTEGRATING TECHNOLOGIES RELATED TO POWER NETWORK OPERATION, COMMUNICATION OR INFORMATION TECHNOLOGIES FOR IMPROVING THE ELECTRICAL POWER GENERATION, TRANSMISSION, DISTRIBUTION, MANAGEMENT OR USAGE, i.e. SMART GRIDS
- Y04S10/00—Systems supporting electrical power generation, transmission or distribution
- Y04S10/30—State monitoring, e.g. fault, temperature monitoring, insulator monitoring, corona discharge
-
- Y—GENERAL TAGGING OF NEW TECHNOLOGICAL DEVELOPMENTS; GENERAL TAGGING OF CROSS-SECTIONAL TECHNOLOGIES SPANNING OVER SEVERAL SECTIONS OF THE IPC; TECHNICAL SUBJECTS COVERED BY FORMER USPC CROSS-REFERENCE ART COLLECTIONS [XRACs] AND DIGESTS
- Y04—INFORMATION OR COMMUNICATION TECHNOLOGIES HAVING AN IMPACT ON OTHER TECHNOLOGY AREAS
- Y04S—SYSTEMS INTEGRATING TECHNOLOGIES RELATED TO POWER NETWORK OPERATION, COMMUNICATION OR INFORMATION TECHNOLOGIES FOR IMPROVING THE ELECTRICAL POWER GENERATION, TRANSMISSION, DISTRIBUTION, MANAGEMENT OR USAGE, i.e. SMART GRIDS
- Y04S10/00—Systems supporting electrical power generation, transmission or distribution
- Y04S10/50—Systems or methods supporting the power network operation or management, involving a certain degree of interaction with the load-side end user applications
-
- Y—GENERAL TAGGING OF NEW TECHNOLOGICAL DEVELOPMENTS; GENERAL TAGGING OF CROSS-SECTIONAL TECHNOLOGIES SPANNING OVER SEVERAL SECTIONS OF THE IPC; TECHNICAL SUBJECTS COVERED BY FORMER USPC CROSS-REFERENCE ART COLLECTIONS [XRACs] AND DIGESTS
- Y04—INFORMATION OR COMMUNICATION TECHNOLOGIES HAVING AN IMPACT ON OTHER TECHNOLOGY AREAS
- Y04S—SYSTEMS INTEGRATING TECHNOLOGIES RELATED TO POWER NETWORK OPERATION, COMMUNICATION OR INFORMATION TECHNOLOGIES FOR IMPROVING THE ELECTRICAL POWER GENERATION, TRANSMISSION, DISTRIBUTION, MANAGEMENT OR USAGE, i.e. SMART GRIDS
- Y04S40/00—Systems for electrical power generation, transmission, distribution or end-user application management characterised by the use of communication or information technologies, or communication or information technology specific aspects supporting them
- Y04S40/20—Information technology specific aspects, e.g. CAD, simulation, modelling, system security
Definitions
- the present invention relates to a system monitoring device and a program for monitoring the state of a system such as a power system.
- the power system is a large-scale system that is constructed and operated by combining many devices and control methods for stable power supply.
- the state of the power system can be expressed using physical quantities such as voltage, current, power, and frequency.
- the state of the power system has a planar spread along the configuration of the power system (hereinafter referred to as “system configuration”), and the state of the power system (hereinafter referred to as “system state”) is temporal. With change. Since the state of the power system varies greatly depending on the generator and the load connected to the power system, various facilities / devices and control methods are used to maintain a steady state.
- non-continuous state changes occur in the power system.
- there are active discontinuity state changes such as facility / equipment control, system configuration switching, generator on / off, etc.
- power system state changes include passive discontinuity.
- accidents that often hinder power supply can occur. Reduction of the power outage range at the time of an accident and shortening of the recovery time are indispensable requests to increase the supply reliability of the power system.
- the power system has many power fluctuation factors.
- accidents may occur in the power system due to natural disasters.
- the state occurring in the power system (the state of the power system) can be treated as a “relationship between cause and result” as a result.
- a technique is widely used in which a sensor is installed in the power system and a measurement signal output from the sensor is used for monitoring the power system.
- a sensor-equipped switch installed in a domestic power distribution system transmits a measurement signal obtained by sampling state values such as voltage and current to a server at a master station using a transmission means such as power line carrier technology and optical cable.
- technologies have been proposed that analyze the state of the power system, such as detecting accidents that occur in the power system, estimating the cause of the accident, and locating the accident (estimating the location where the accident occurred). .
- ⁇ When an accident occurs in the power system, a transient state change such as a sudden flow of current in the power system (sensor) may occur. If the cause of the accident can be estimated from a signal obtained by measuring the power system (hereinafter referred to as “measurement signal”), recovery work can be supported.
- a method of associating an equivalent circuit at the time of an accident with a measurement signal in an electric power system is called accident location.
- Patent Document 1 stores received monitoring information as recorded data, extracts a causal relationship between events, compares it with monitoring information recorded data, and calculates a conditional probability of each event defined in the event definition information
- a power system monitoring system is disclosed. This power system monitoring system performs probabilistic inference for the future power equipment state based on the conditional probability table, the observation event, and the causal relationship.
- Patent Document 1 described above inputs information to be measured in the power system, extracts events that occur in the power system based on the input information, and calculates the probability that the event will occur for future or past events in the power system. Techniques to do this are disclosed. However, the technique described in Patent Document 1 does not have a means for inputting information related to the outside (periphery) of the power system, and does not use it for calculating the probability. In reality, events that occur in the power system are often caused by causes outside the power system. For example, when a ground fault accident occurs on the distribution line, the front line approaches, the wind blows strongly, the tree shakes, the tree contacts the power line, and the ground fault accident occurs. A combination of multiple types of causes and results outside the power system can affect the power system and cause an accident.
- Patent Document 1 there is no means for inputting information relating to the configuration, topology (connection form), geographical arrangement (location), time, etc. of the power system.
- weather information is information that greatly depends on location and time. For this reason, even if a means for inputting weather information from the outside is prepared, it is impossible to correlate weather information with an event of the power system, and it cannot be used for improving the accuracy of probability calculation.
- the present invention has been made in consideration of the above-described situation, and reflects the information obtained from the outside of the target system so that the future state of the target system can be predicted.
- a system monitoring apparatus stores a state transition information including a plurality of states of a target system and a path of state transition from one state of the plurality of states to another state Is provided. Further, the system monitoring device includes an input unit that receives input of measurement information that is information measured by a sensor provided in the target system, and peripheral information related to the target system, and the input unit that receives the input A state detection unit that detects the current state of the target system from the measurement information is provided. Further, the system monitoring device is based on the current state of the target system detected by the state detection unit, the state transition information stored in the storage unit, and the peripheral information received by the input unit. And a transition probability calculation unit for calculating a transition probability from the current state to another state. Furthermore, the system monitoring apparatus includes a transition state determination unit that determines a next state that transitions from the current state based on the transition probability, and an output unit that outputs a determination result of the transition state determination unit.
- the prediction accuracy of the next transition state is improved by taking not only information obtained from the power system but also related peripheral information and using it for calculation of transition probability. To do. Problems, configurations, and effects other than those described above will be clarified by the following description of embodiments.
- the steady state is a state in which, for example, the state of the system is maintained within an appropriate range, and no trouble occurs on the management side and the use side of the system.
- the transient state refers to a state in which there is a change in time, and includes an intentional state change that occurs as a result of control, and an accidental state change that causes an inconvenience that is out of the appropriate range as in an accident.
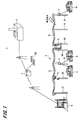
- FIG. 1 is a schematic diagram illustrating a configuration example of a general power system.
- the electric power system 1 is a system that supplies electricity generated by the power plant 2 to the customer U through a transmission line and a distribution line.
- electricity generated at the power plant 2 is sent to the distribution substation 4 via the primary substation 3 and the like by a transmission line.
- the primary substation 3 also receives electricity generated by the solar power generation facility 20.
- electricity is supplied from the distribution substation 4 to the consumer U through the distribution system 5. That is, the electricity transformed at the distribution substation 4 is sent to the consumer U through the distribution lines 6 suspended on the plurality of utility poles 10 and the pole transformer 7.
- a voltage regulator 8 (SVR), a sensor-equipped switch 9 and the like are provided in the middle of the distribution line 6.
- the power system is a complex system with many control devices and sensors connected for stable power supply.
- Various events that occur in the power system are observed as state quantities such as voltage, current, and power by sensors installed in the power system.
- An event is an event (phenomenon) that can cause a change in the state of a monitored object.
- state quantities can be signal-processed by collecting (measuring) them as time-series signals using some sensor such as a sensor-equipped switch.
- the event appearing in the measurement signal is observed as, for example, a steady gradual signal change (steady state) or a transient vibration waveform (transient state). In this way, the waveform appearing in the measurement signal can be handled as a result of the system. For example, if an accident occurs in the power system and a current flows rapidly, a transient vibration waveform is observed in the measurement signal. Thus, the cause that caused the event can be associated with the result that appears in the measurement signal.
- the power system 1 is a large-scale system having a wide area connected by electric wires.
- a ground fault may occur in which the distribution line 6 contacts the ground for some reason and current flows.
- the impedance between the cable used for the line and the ground is remarkably reduced, and a transient response waveform is generated when current flows from the line to the ground at the moment when the ground fault occurs on the line.
- the cause of the accident is contact between the cable and the tree, instantaneous contact may occur repeatedly.
- a contact thing may be heated and denatured by a ground fault current, for example, if it is a tree contact, ground fault resistance may change temporally by carbonization of a tree.
- the transient response waveform of the current generated at the time of the accident differs depending on the cause of the accident.
- the current flow in the power system 1 may change transiently, resulting in a malfunction in the power generation apparatus or the load apparatus, and a power outage due to a power supply trouble may occur.
- Such a change in state can be treated as a state transition from one state to another state.
- FIG. 2 is an explanatory diagram of the state transition of the system.
- the state is indicated by a circle and the transition path is indicated by an arrow.
- the state transition diagram of FIG. 2 from left to right, the state of the system in the past, the present, and the future, and possible state transitions from the past to the present and from the present to the future are described.
- Each state may be a state where an accident has occurred (transient state) or a stable state where there is no accident (steady state).
- the power system state is treated as a state including a steady state and a transient state.
- switching operations such as LRT and SVR in the distribution system, or system switching using switches
- One state transition may be set for such a switching operation, or it may be treated as an operation in a steady state.
- System state transitions can be created based on specifications at the time of system development, or can be created by analyzing observation results of system operations. If there is a specification, state transition can be determined with a clear basis. On the other hand, when the specification is ambiguous or does not exist, it is conceivable to make a state transition by using a method such as cluster classification or statistical processing using a measurement result of a sensor or the like.
- a transition is made from the past state s1 to the current state s2 via a transition path p1 (thick line) based on a certain cause. While there are a plurality of transition paths (causes) in the transition from the past state s1 to the current state s2, the transition is made through the transition path p1. That is, a state transition is caused mainly by some event, and the state transitions from the past state s1 to the current state s2.
- the states of the past and current systems are fixed, and if the past and current states are known, the cause of the state transition can be estimated.
- FIG. 2 also shows that the current state s2 moves to the future state s3 via a transition path p2 (thick line) based on a certain cause.
- p2 thin line
- the probability of occurrence of an event that may cause a state transition is calculated from currently acquired information (for example, measurement information and peripheral information), and the next state to be determined is determined.
- the transition path connecting the candidate state to the current state includes an event that causes an accident.
- FIG. 3 shows an overview of the overall configuration including the system monitoring apparatus according to the first embodiment of the present invention.
- the system monitoring device 30 monitors the state and state transition of a real system (monitored system) such as the power system 1.
- each embodiment of the present invention will be described using the power system 1 as an example of a monitoring target system.
- any system having a probabilistic relationship between a cause and a result regarding a state can be used without limiting the system. It goes without saying that the effect of can be realized. For example, it can be applied to a power generation system, a transportation system, a production system, and the like.
- the system monitoring device 30 inputs the measurement information measured by the sensor installed in the target system and the peripheral information that is considered to be related to the target system, and the next state that may transition from the current state of the system Predict. Also, the transition prediction and the basis for the transition prediction are presented to the operator who monitors and operates the system.
- the measurement information and the peripheral information include signals measured by a plurality of sensors, information published on the Internet, information calculated by simulation, and the like.
- the system monitoring device 30 includes means for inputting system information (system information) and peripheral information from the power system 1.
- the system information is information (measurement information) obtained by detecting the state of facilities, devices, and the like constituting the system (here, power system 1) with some sensor in the system.
- a switch 9 with a sensor (see FIG. 1) is installed on the line from the distribution substation 4 to the customer U, and the system state (voltage, current, etc.) is measured by the switch 9 with sensor.
- the sensor measurement signal can be collected by a server in the master station via a network N (for example, the Internet) using a power line carrier or optical cable technology.
- the data that affects the probability of an accident are: wire layout, facility / equipment capacity, load connection location and capacity, and distributed power supply connection location. And capacity. These can be classified into fixed values that can be known in advance and measured values collected by sensors installed in the system.
- the system information includes equipment / equipment history (hereinafter “equipment history data”).
- equipment / equipment history includes, for example, the installation year of the facility / equipment, the environment of the installation location, the number of times the switch of the facility / equipment operates, the past accident record of the facility / equipment, and the like.
- peripheral information refers to a wide variety of information surrounding the system (for example, power system 1).
- the peripheral information related to the state of the electric power system 1 includes weather information (such as weather forecast), calendar, map, human flow, and traffic. These peripheral information may be created or collected by a third party. Due to the recent development of network technology, an environment where these peripheral information can be used is being prepared. Is input.
- the peripheral information may include information that precedes the state change occurring in the power system 1 in time.
- weather data includes prediction information of weather conditions such as solar radiation, wind, and rain.
- weather conditions such as solar radiation, wind, and rain.
- the calendar also includes forecast (planned) information on holidays, some events, construction, etc. For example, when there is such a schedule, the probability that an accident will occur increases compared to other times.
- the map contains information on the density of consumers, the distribution of houses and trees that may cause contact accidents on electric wires, roads, etc. For example, power fluctuations are greater in regions with higher consumer density.
- a utility pole installed on the side of a road with a large amount of traffic has a higher probability of a traffic accident involving a utility pole or an electric wire than a utility pole installed on the side of a road with a small amount of traffic.
- these pieces of peripheral information do not necessarily need to know the relationship with the power system 1 in advance, and include cases where the relationship is found by some signal processing.
- the system monitoring device 30 uses peripheral information related to the system in addition to the measurement information of the system itself in order to determine the state transition of the system such as the power system 1.
- the system state may be influenced by the situation outside the system indicated by the peripheral information in addition to the situation inside the system indicated by the measurement information.
- the state of the power system 1 changes under the influence of the power generation amount of the photovoltaic power generation facility 20 that is one of the renewable energy power generation systems, but the power generation amount of the solar power generation facility 20 greatly depends on the weather conditions.
- weather conditions past, present, and future information can be obtained from meteorological information transmitted by the Japan Meteorological Agency.
- weather information that is not directly related to the power system 1 can be used to estimate or predict a change in the state of the power system 1.
- peripheral information may include information that precedes the system state in terms of time.
- the present invention is characterized by determining state transitions that are likely to occur or predicting state transitions by calculating transition probabilities of system state transitions using peripheral information in addition to system information (measurement information). To do. Therefore, the present invention extracts an event (cause) that causes a state transition (for example, an accident) from system information and peripheral information, and further assigns a probability of causing the transition to the event. As will be described later, when system information or peripheral information is input as a time-series signal, the time-series signal is converted into an event to which a probability can be assigned.
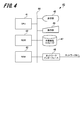
- FIG. 4 is a block diagram illustrating a hardware configuration example of the system monitoring device 30.
- the hardware configuration of the computer 40 applied to the system monitoring apparatus 30 will be described with reference to FIG.
- the computer 40 is hardware used as a so-called computer.
- the computer 40 includes a CPU (Central Processing Unit) 41, a ROM (Read Only Memory) 42, and a RAM (Random Access Memory) 43, which are arithmetic control devices connected to the bus 44, respectively.
- the computer 40 further includes a display unit 45, an operation unit 46, a nonvolatile storage 47, and a network interface 48.
- CPU41 (an example of a control part) reads the program code of the software which implement
- the computer 40 may include a processing device such as an MPU (Micro-Processing Unit) instead of the CPU 41.
- MPU Micro-Processing Unit
- the display unit 45 is, for example, a liquid crystal display monitor, and displays the results of processing performed by the computer 40 to the operator.
- a keyboard, a mouse, a touch panel, or the like is used as the operation unit 46, and an operator can perform predetermined operation inputs and instructions.
- Non-volatile storage 47 includes, for example, HDD (Hard Disk Drive), SSD (Solid State Drive), flexible disk, optical disk, magneto-optical disk, CD-ROM, CD-R, magnetic tape, nonvolatile memory card, and the like. Used. In addition to the OS (Operating System) and various parameters, the non-volatile storage 47 stores a program and data for causing the computer 40 to function. For example, the nonvolatile storage 47 corresponds to a history information storage unit 303, a state transition storage unit 304, a causal relationship storage unit 310, an event probability storage unit 311 and a support information storage unit 312 shown in FIG.
- a network interface 48 for example, a NIC (Network Interface Card) or the like is used, and various data can be transmitted and received between devices via a network N such as a LAN.
- a network N such as a LAN.
- FIG. 5 is a block diagram illustrating an internal configuration of the system monitoring apparatus 30.
- the function of each block of the system monitoring device 30 is realized by the CPU 41 in FIG. 4 executing a computer program stored in the ROM 42.
- the system monitoring device 30 includes an input unit 301, a state detection unit 302, a history information storage unit 303, a state transition storage unit 304, a transition probability calculation unit 305, a transition state determination unit 306, a display control unit 307, and a display unit 308. .
- the system monitoring apparatus 30 includes a cause estimating unit 309, a causal relationship storage unit 310, an event probability storage unit 311, and a support information storage unit 312. Further, the system monitoring apparatus 30 includes a state transition setting unit 321, a probability calculation method setting unit 322, a determination logic setting unit 323, and a probability setting unit 324.
- the input unit 301 inputs measurement information, which is information measured by sensors provided in the power system 1 that is a monitoring target system, and peripheral information related to the power system 1 via the network N (Internet or the like). Accept.
- This input unit 301 corresponds to the network interface 48 of FIG.
- the input unit 301 outputs the received measurement information and peripheral information to the state detection unit 302, the history information storage unit 303, and the transition probability calculation unit 305.
- the state detection unit 302 detects the current state (system state) of the power system 1 by analyzing the measurement information received by the input unit 301, and outputs the detection result to the history information storage unit 303.
- the history information storage unit 303 stores measurement information and peripheral information input from the input unit 301 in association with the date and time.
- the history information storage unit 303 stores the current state (system state) of the power system 1 input from the state detection unit 302 in association with the date and time.
- the measurement information and the peripheral information may be collectively referred to as “history information”.
- the state transition storage unit 304 is a state transition diagram (state transition information, including a plurality of states of the power system 1 and a transition path (route) of a state transition from one state to another state among the plurality of states. (See FIG. 2).
- the state transition storage unit 304 receives at least information on the current state of the power system 1 (and the latest (previous) state before reaching the current state) from the history information storage unit 303.
- the history information storage unit 303 and the state transition storage unit 304 correspond to the nonvolatile storage 47 of FIG.
- the transition probability calculation unit 305 includes the current state of the power system 1 detected by the state detection unit 302, the state transition information stored in the history information storage unit 303, and the peripheral information (event) received by the input unit 301. Based on the above, the probability (transition probability) that the power system 1 transitions from the current state to another state is calculated.
- the transition probability calculation unit 305 can grasp the most recent (past) state (state transition) before reaching the current state from the current state of the power system 1 and the state transition information.
- the state transition storage unit 304 may grasp the latest (past) state before reaching the current state and notify the transition probability calculation unit 305 of the past state. Then, the transition probability calculation unit 305 outputs the calculation result to the transition state determination unit 306.
- the transition state determination unit 306 determines the next state (state transition) to transition from the current state of the power system 1, and displays the determination result as a display control unit 307. Output to.
- the transition state determination unit 306 can also output determination logic of the determination result together with the determination result.
- the display control unit 307 is an example of an output unit, generates display data including the determination result of the transition state determination unit 306, and outputs the display data to the display unit 308.
- the display control unit 307 can generate display data including the determination result and the determination logic of the determination result and output the display data to the display unit 308.
- the display control unit 307 reads support information corresponding to the determination result (transition state or the like) from the support information storage unit 312 and outputs the support information to the display unit 308.
- the display unit 308 displays a screen based on the display data input from the display control unit 307.
- the display unit 308 corresponds to the display unit 45 in FIG.
- the cause estimating unit 309 takes in state transition information (including at least the current state) from the state transition storage unit 304, takes in a causal relationship from the causal relationship storage unit 310, and further causes the event probability storage unit 311 to reach the current state. Capture the probability of the event. And the cause estimation part 309 performs the process which estimates the cause with respect to the present state based on the present state of the electric power grid
- the causal relationship storage unit 310 the state (event) of the power system 1 is used as a result, and the causal relationship caused by the event causing the result is stored.
- This causal relationship is set in advance, but may be updated (corrected) based on history information (measurement information and peripheral information).
- the event probability storage unit 311 stores the probability of each event occurring. In addition, a correspondence relationship between an event that causes the current state and a probability that the event occurs is stored. Moreover, the prior probability and posterior probability used for probability calculation may be stored. In the present embodiment, an event as a result resulting from a combination of events as a plurality of causes is described by a conditional probability (Bayesian network) (see FIG. 10 described later), stored in the event probability storage unit 311, and input data The probability is sequentially updated using (measurement information, peripheral information).
- the causal relationship storage unit 310 and the event probability storage unit 311 correspond to the nonvolatile storage 47 of FIG.
- the support information storage unit 312 stores information (support information) for assisting the operator's work and judgment.
- the support information includes details of alarm information (FIG. 16), determination logic (FIG. 17), recovery support information (FIG. 18), precaution information (FIG. 19), and the like.
- the determination logic includes a state transition diagram and a determination basis (determination condition) as a basis for the state transition.
- the state transition setting unit 321 is based on the instruction from the operation unit 46 (FIG. 4), the state of the power system 1 (system) stored in the state transition storage unit 304, and the transition path between states (see FIG. 8). Set and modify.
- the probability calculation method setting unit 322 sets and corrects the transition probability calculation method by the transition probability calculation unit 305 based on an instruction from the operation unit 46.
- the determination logic setting unit 323 sets and corrects the determination logic of the determination result by the transition state determination unit 306 based on an instruction from the operation unit 46.
- the probability setting unit 324 sets and corrects the occurrence probability of each event stored in the event probability storage unit 311 based on an instruction from the operation unit 46.
- the measurement signal detected by the sensor installed in the power system 1 for the state of the power system 1 is a time-series signal sampled at an appropriate time interval.
- a time-series signal is a sequence of sampling values that are temporally continuous and has no break. Therefore, generally, a measurement signal is cut out from a time-series signal with a predetermined time width (time window) or the number of samples, and this is used as a unit of signal processing. Also, in the form of a time series signal, it is difficult to directly extract information as an event from the time series signal.
- information obtained by analyzing the measurement signal or a combination of information (features) is treated as an event, and a probability is assigned to each event.
- the combination of measurement signals can be enormous, so the probability is assigned by replacing the measurement signal with a feature amount by signal conversion.
- time-series signal when a part is extracted from a temporally continuous signal (time-series signal), the start and end on the time axis are determined. For example, a time width that includes a waveform at the time of an accident is determined, a combination of signals within the time width is extracted, and a feature amount is calculated by appropriate signal processing. Then, the procedure for shifting to the time for calculating the next feature value and extracting the signal combination is repeated.
- the state detection unit 302 converts the time series signal into a feature amount and handles it, so that the amount of data to be handled can be reduced compared to the case of handling the original time series signal.
- the waveform data has the characteristics of the time position (phase), but it is possible to collect information unrelated to the time position by converting the time series signal into the feature amount.
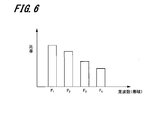
- FIG. 6 is a graph showing an example of analysis of a measurement signal.
- the horizontal axis of FIG. 6 indicates the frequency (band), and the vertical axis indicates the ratio of the frequency component of the target band to the whole. In this example, the ratio of the frequency component to the whole is shown for each of the frequency bands F1, F2, F3, and F4.
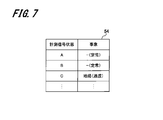
- FIG. 7 is a table showing an example of a correspondence relationship between the state of the measurement signal and the event according to the first embodiment.
- the state and event table 54 includes a measurement signal state field and an event field.
- the measurement signal state field has information indicating the state of the measurement signal of a certain sensor, and the event field has information on an event that has occurred in the system (power system 1).
- the state of the measurement signal is determined by, for example, the feature amount of the measurement signal.
- the states are classified into states A to C according to the feature amount, and in the states A and B, no event occurs (steady state), and the state C is associated with the ground fault (transient state).
- peripheral information Next, input and processing of peripheral information will be described.
- weather data, calendar, map, human flow, traffic, experience of operators, etc. are applied as the peripheral information.
- Such peripheral information may include information that precedes the state transition of the power system 1 in time.
- the weather forecast in the weather data is an example, and forecast data such as solar radiation, rainfall, and wind are available.
- the peripheral information is not limited to the above example.
- FIG. 8 is a diagram (state transition diagram) illustrating an example of state transition of the system.
- the system state is represented by a rectangle
- the transition path is represented by an arrow
- the direction from left to right represents the past, present, and future time passages.
- the relationship between states is represented as “state transition” having a temporal directionality of the past, present, and future.
- the probability of transition from one state to the next is treated as the “transition probability”.
- state transition information can be obtained by statistically processing past performance data, and can also be calculated by simulation for system analysis. Also, the subjective probability may be set based on the concept of Bayesian statistics. In real-time operation, it can be updated to real time based on measurement information input from the sensor to the system monitoring device 30.
- the state transition diagram of FIG. 8 there are three states s11, s12, and s13 at a time point before the current time, the state s11 further passes through the transition path p01 from the past state, and similarly, the state s12 is the transition path p02. Then, the state s13 transits to each state via the transition path p03.
- a state s21 via the transition path p11 and a state s22 via the transition path p12 are candidates for the transition destination of the past state s11. Further, there are a state s21 via the transition path p21, a state s22 via the transition path p22, and a state s23 via the transition path p23 as candidates for the transition destination of the state s12. Further, there are a state s22 via the transition path p32 and a state s23 via the transition path p33 as candidates for the transition destination of the state s13.
- a state s31 and a state s32 exist as candidates for the transition destination of the state s21 at the current time. Further, there are a state s31, a state s32, and a state s33 as candidates for the transition destination of the state s22. Further, there are a state s32 and a state s33 as candidates for the transition destination of the state s23. Further, the state s31 goes through the transition path p1, the state s32 goes through the transition path p2, and the state s33 goes through the transition path p3 to the next state.
- state transition diagram is recorded with the state transition information accompanying the system state change.
- This state transition diagram (that is, state transition information) is stored in the state transition storage unit 304.
- transition probability calculation method by the transition probability calculation unit 305 will be described.
- the probability that an event occurs when a plurality of causes are combined is expressed as the joint probability of each cause.
- the joint probability can be expanded to a conditional probability using Bayes' theorem. For example, when there are causes X1, X2, and X3, the simultaneous probability P (X1, X2, X3) that these causes occur simultaneously can be expanded as shown in Equation (1).
- transition probability in which multiple causes are combined in this way can be described as a joint probability, and the joint probability can be expressed as a product of conditional probabilities. That is, there is a relationship of multiplying individual causes as conditional probabilities.
- FIG. 9 is an explanatory diagram illustrating an example of a relationship between a cause and a result according to the first embodiment.
- tree contact is taken up as an accident occurring in the power system, and the relationship between the cause and the result is illustrated.
- the diagram is simplified to show the relationship between the causes and results of wind, tree shaking, and electric wire ground faults.
- X1 be an event of wind blowing
- X2 an event of tree shaking
- X3 an event of ground fault.
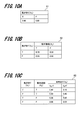
- FIG. 10 is an explanatory diagram showing an example of conditional probabilities of causes and results according to the first embodiment.
- 10A is a table 51 of the probability of wind blowing (X1)
- FIG. 10B is a table 52 of the probability of tree shaking (X2)
- FIG. 10C is a table 53 of the probability of ground fault (X3).
- T and F are logical terms representing true (T) and false (F).
- the probability of the result from the cause is prepared.
- the occurrence of a ground fault caused by tree swing (tree contact) and the occurrence of a ground fault caused by a broken wire can be prepared in advance by statistically processing past performance data.
- the probability that the wind blows (X1) can be obtained from the weather forecast included in the surrounding information. Accordingly, the probability that the caused ground fault is caused by the wind blowing (X1) is calculated using Bayes' theorem (Bayes's formula).
- the result is that the tree sways (X2).
- a ground fault (X3) occurs in the electric wire due to the cause of the swaying tree. From the probabilistic relationship between each cause and result, it is possible to calculate the probability (conditional probability) that a ground fault will occur due to wind blowing. Probabilities are similarly calculated for other possible causes, and it can be determined that the cause having the largest probability value is most likely to occur. Since the state of the power system and the probability of the cause change from time to time, the probability is sequentially calculated and the determination is repeated.
- Equation (3) The probability that the ground fault accident (X3) due to tree contact is caused by the wind blowing (X1) is expressed by equation (3).
- the transition probability calculation unit 305 outputs the transition probability calculated in this way to the transition state determination unit 306.
- Bayes' theorem relates prior probabilities and posterior probabilities (sometimes called inverse probabilities).
- the occurrence probability of the cause Ei is P (Ei) and the probability that the event F appears at the cause Ei is P (F
- the probability that the cause is Ei can be calculated by the equation (5).
- the magnitudes of the posterior probabilities P (Ei) corresponding to the respective causes are compared, and the cause having the highest probability is determined to be the most likely.
- the cause Ei of the accident is a cause of an accident such as a tree contact or a bird contact, and the number and cause of the accidents that have occurred in the past are often known.
- the appearance probability P (Ei) of the cause Ei can be prepared.
- the waveform that appears in the measurement signal when the cause Ei occurs can be obtained by prior experiments, simulations, or the like. This waveform can be input to the state detection unit 302, for example, and the feature amount of the waveform can be calculated by appropriate signal processing.
- the probability of the cause Ei is calculated by the following equation (7). Then, it is determined that the cause Ei having the largest posterior probability P (Ei) is the most likely cause.
- the frequency component is focused here, the waveform amplitude attenuation rate at the time of the accident, the waveform rising characteristics, and the like can be used.
- probabilities relating to some state values other than time series signals can be combined.
- the probability of the cause Ei can be calculated by combining the probabilities of a plurality of feature amounts.
- a combination of a plurality of frequency bands and component ratios (probabilities) is treated as an event Fj
- the probabilities of other events can be combined.
- the combination of the frequency band and attenuation rate obtained by the Proni analysis as described above may be treated as an event, and the probability assigned.
- it is determined that the cause Ei having the largest posterior probability P (Ei) is the most likely cause.
- this procedure corresponds to a filter for removing noise.
- the present embodiment is characterized in that a significant event is found by repeating the combination of event detection and cause estimation described above.
- two methods are prepared for setting the prior probability at the initial stage. First, prepare the means to input the past data related to the target system from the outside and the means to calculate the probability by statistical processing (simulation) using the data about the target system obtained from the outside, the initial probability This is a method of preparing data.
- the second is a method that uses the concept of subjective probability for the prior probability set at the initial stage based on Bayesian statistics.
- the subjective probability is an a priori probability that is set subjectively by the operator based on the experience and knowledge of the operator who knows the monitored system well.
- the method using the subjective probability does not necessarily require statistical processing (specific statistical data) of past data.
- Bayesian statistics there is a procedure called Bayesian updating in which the above-described prior probabilities are updated sequentially. By sequentially replacing prior probabilities using posterior probabilities, even if there is subjective judgment on the initial value of prior probabilities, prior probabilities are gradually corrected based on measurement signals (results). Can do. It is also possible to use a combination of the above two setting methods.
- FIG. 11 is a flowchart illustrating processing for calculating the transition probability of the state transition of the system according to the first embodiment.
- the transition probability calculation process of FIG. 11 is realized.
- the input unit 301 of the system monitoring apparatus 30 takes in sensor measurement information and peripheral information via the network N (S1).
- the state detection unit 302 detects the current state (system state) of the power system 1 from the measurement information received by the input unit 301, and outputs the detection result to the history information storage unit 303.
- the transition probability calculation unit 305 takes in state transition information (including the system state) from the state transition storage unit 304 (S2).
- the transition probability calculation unit 305 calculates the probability of transition from the current state to the next state (transition probability) (S3). That is, the transition probability calculation unit 305 includes the current state of the power system 1 detected by the state detection unit 302, the state transition information stored in the history information storage unit 303, and the peripheral information received by the input unit 301. First, the transition probability with the next state that can transition from the current state is calculated.
- transition probability calculation unit 305 outputs the calculation result of the transition probability to the transition state determination unit 306 (S4). After the process of step S4 is completed, a series of transition probability calculation processes are terminated.
- the transition state determination unit 306 determines the transition state. That is, the next state with a high possibility of transition from the current state is predicted.
- the determination result of the transition state determination unit 306 is input to the display control unit 307, and the determination result is displayed on the display unit 308.
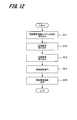
- FIG. 12 is a flowchart showing cause estimation processing according to the first embodiment.
- the CPU 41 executes the computer program stored in the ROM 42, thereby realizing the cause estimation process of FIG.
- the cause estimating unit 309 of the system monitoring device 30 takes in the state transition information (the current state of the power system 1) from the state transition storage unit 304 (S11).
- the cause estimating unit 309 fetches the causal relationship that is the relationship between the cause (event) and the result (state) related to the state transition information from the causal relationship storage unit 310 (S12).
- the cause estimating unit 309 takes in the probability of an event related to the state transition information from the event probability storage unit 311 (S13).
- the cause estimating unit 309 executes cause estimation for the current state based on the current state of the power system 1, the causal relationship, and the probability of the corresponding event (S14).
- the cause estimating unit 309 outputs an estimation result (estimated cause) to the display control unit 307 (S15).
- the estimated cause is input to the display control unit 307, and the estimated cause is displayed on the display unit 308.
- FIG. 13 is an explanatory diagram illustrating an example of the cause of an accident that exists in the power system according to the first embodiment.
- 13A shows the system configuration 60
- FIG. 13B shows the wind speed distribution 70
- FIG. 13C shows the equipment characteristics 80
- FIG. 13D shows the tree distribution 90.
- the power system is a system with a wide area.
- measurement information and peripheral information have a wide spread. Therefore, the probabilities indicating these relationships are also distributed with a wide spread.
- the relationship between the target system, measurement information, peripheral information, probability, and the like can be expressed as a field having a spatial distribution (hereinafter referred to as “probability field”).
- the probability is handled as spatially spread distribution information.
- the probability is set as a value associated with some condition, such as a dice eye and an appearance probability (in this case, a uniform distribution).
- a spatial position is given as one of the conditions so that the weather information has a geographical distribution of the probability of fine rain.
- This space may be a two-dimensional coordinate based on a map, or may be a multidimensional space having a large number of indices.
- the probability set in space is also a function of time. For example, you may update sequentially based on the distribution result of the probability calculated from measurement information and peripheral information.
- a spatial probability calculation becomes possible. And the probability of the point can be calculated by reading various indexes at the same geographical point.
- FIG. 13A a schematic diagram of the power system is described.
- Two circuit breakers (CB) are connected in series on the load (customer) side of the distribution transformer 4T of the distribution substation 4.
- three loads and two power sources are connected to the system between the circuit breakers.
- the power source for example, a solar power generation facility or the like is applied.
- the circuit breaker with two black circles (left side in the figure) indicates closed, and the circuit breaker with two white circles (right side in the figure) indicates open, and a triangle pointing to the right on the power system (4 in this example) represents a switch.
- the wind speed distribution 70 in FIG. 13B is expressed by being superimposed on the schematic diagram of the power system having the same contents as the system configuration 60.
- An arrow 71 in FIG. 13B represents the wind direction and the wind speed. The thicker the arrow 71, the higher the wind speed.
- the facility characteristic 80 in FIG. 13C is expressed by being superimposed on the schematic diagram of the power system having the same contents as the system configuration 60.
- FIG. 13C shows that the installation years of equipment in a certain load section 81 on the power system are long.
- the tree distribution 90 in FIG. 13D is expressed by being superimposed on the schematic diagram of the power system having the same contents as the system configuration 60.
- the influence ranges 91 and 92 of two trees are shown in the vicinity of the power system.
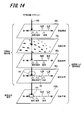
- FIG. 14 is an explanatory diagram showing a random field and probability calculation in a multidimensional space according to the first embodiment, and shows a procedure of probability calculation using a spatial random field.
- the electric power system is a system with a wide area, and there are a plurality of causes and results, and they have a distribution depending on the surface area. Therefore, in this embodiment, a layer having a surface spread is prepared, the surface distribution of the cause is shown in each layer, and the layers are spatially arranged.
- the 14 includes a layer 60L of the system configuration 60, a layer 70L of the wind speed distribution 70, a layer 80L of the facility characteristics 80, and a layer 90L of the tree distribution 90 in order from the top.
- the bottom row shows the accident prediction layer 100L that represents the probability (conditional probability) of the result obtained by combining the cause probabilities shown in the layers 60L to 90L.
- the combination probability is calculated by combining the probabilities of the causes at the same position in each layer 60L to 90L, and the calculation position is indicated by an arrow 102 in the figure. By scanning this calculation position within the plane of each layer, a planar probability distribution can be calculated. In FIG. 14, the calculation position coincides with the accident prediction point 101 of the ground fault on the power system.
- This embodiment is characterized in that the above-described spatial random field is used to display the screen as a means for explaining the relationship between the cause and the result.
- the overlapping of a plurality of layers can be displayed on the display unit 45 by a so-called three-dimensional graphics method, and the viewpoint can be switched in an arbitrary direction, or the display contents can be rewritten in real time.
- the viewpoint by moving the viewpoint in the direction orthogonal to the layer and displaying it on the screen, it becomes a two-dimensional display, which can be displayed in the same way as paper materials or conventional screen display.
- FIG. 15 is an explanatory diagram showing an example of calculating and setting the spatial distribution of probabilities in the spatial random field according to the first embodiment.
- the growth location of a tree is a point, but when there is a risk of contact with an electric wire due to shaking by the wind, the influence range of the tree becomes a spatial distribution. This range of influence is expressed as a spatial distribution of probabilities.
- a two-dimensional normal distribution can be used on a two-dimensional plane such as a map. Then, by multiplying the growth points 95 and 96 of the tree in the spatial tree position information 90A by the probability distribution 99, the spatial probability distribution (layer 90L) of the tree is calculated and set.
- This multiplication operation can be performed using convolution integration.
- the cause of such a transition state and / or the probability of the result is stored in the nonvolatile storage 47 as spatial distribution data in which the probability is spatially distributed.
- the present embodiment includes means (operation unit 46) for setting (range setting, probability setting) such a spatial distribution of such probabilities, and means (display unit 45) for displaying.
- this embodiment can perform calculation using a spatial filter such as differentiation and integration in a spatial random field.
- a spatial filter such as differentiation and integration in a spatial random field.
- effects such as noise removal (integration type filter) and edge enhancement (differential type filter) can be obtained.
- the random field is used as the object of the spatial filter, if the integral filter is applied, there is an effect of expanding the influence range of the probability. Also, applying a differential filter has the effect of finding a place where the probability condition changes.
- 16 to 19 show examples of operation screens provided to the operator.
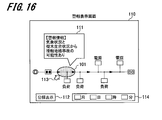
- FIG. 16 is a diagram illustrating an example of the alarm display screen 110 according to the first embodiment.
- an alarm information display window 111 is displayed.
- a warning message “There is a possibility of a contact ground fault from weather information and tree growth status” is displayed.
- the alarm display screen 110 in FIG. 16 displays a disassembly display button 112.
- the alarm display screen 110 is displayed in a plurality of layers (spatial areas as shown in FIG. It is disassembled and displayed in a random field. As a result, the operator can grasp a place where an accident is highly likely to occur and can quickly take measures against the accident.
- the alarm display screen 110 in FIG. 16 has a date / time input field 114.
- a date / time input field 114 When the operator inputs a date and time to be viewed in the date and time input field 114, an alarm display screen 110 of the input date and time is displayed. Thereby, the operator can confirm necessary information by specifying the date and time.
- This date / time input field 114 may be displayed not only on the alarm display screen 110 but also on other screens shown in FIGS.
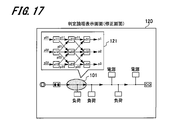
- FIG. 17 is a diagram illustrating an example of the determination logic display screen (correction screen) 120 according to the first embodiment.
- the logic (state transition diagram) display window 121 (see FIG. 8) used for the state transition prediction is displayed.
- the determination logic information is not limited to the state transition diagram, and the determination condition in the transition state determination unit 306 may be displayed.
- the determination condition is, for example, “the state transition with the highest transition probability is the most likely state transition”. However, when the difference in transition probability among a plurality of state transitions is small, a determination condition such as giving priority to past results may be used.
- a probability calculation process (for example, FIG. 9, FIG. 10, etc.) may be displayed on the display window 121 as a basis for prediction.
- the operator may correct the state transition determination logic displayed on the display window 121 by operating the operation unit 46. For example, a state in the state transition diagram or a transition path between states is specified, and the state transition is corrected.
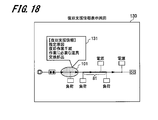
- FIG. 18 is a diagram illustrating an example of the recovery support information display screen 130 according to the first embodiment.
- a recovery support information display window 131 showing a recommended procedure for recovery work when an accident occurs in the power system 1 is displayed.
- the display window 131 displays items such as “estimated cause”, “recovery work procedure”, “tool required for work”, “replacement part”, and the like. Thereby, it is possible to support the operator's recovery work and determination.
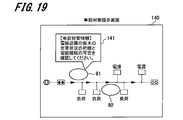
- FIG. 19 is a diagram showing an example of the precautionary measure presentation screen 140 according to the first embodiment.
- the display window 141 for the precautionary measure information is displayed.
- a precaution message “Please confirm the growth status of trees in the vicinity of the electric wire and check whether or not the electric wire can be contacted” is displayed.
- the operator can prevent the accident beforehand by grasping in advance the place where the accident is likely to occur and taking a countermeasure in accordance with the presented preliminary countermeasure information.
- GUI graphical user interface
- the probabilities of these individual causes are prepared, and the probability that an accident will occur as a result of the combination of these causes is calculated.
- the probability of each cause may vary over time and geographically and may be updated sequentially to reflect the latest state.
- This kind of probabilistic relationship can be expressed using techniques such as Bayesian networks, hierarchical Bayes, or Bayes graphical models.
- the present embodiment is not limited to the notation method of these stochastic relationships.
- This embodiment calculates a probability when a plurality of causes are combined as a conditional probability.
- formula setting and transformation based on Bayes formula (Bayes's theorem) are used.
- the probability of the cause is calculated from the actual result by referring to the probabilistic relationship between the cause and the result of the power system accident prepared in advance.
- a probability calculation based on the Monte Carlo method can be used.
- MCMC method Markov Chain Monte Carlo method
- methods belonging to the MCMC method there are a metropolis method and a Gibbs sampling.
- this embodiment includes means for ensuring and verifying system reliability. Specifically, it includes means for presenting the probability calculation procedure and results to the operator, means for correcting the probability calculation procedure by the operator, means for executing the prepared probability calculation procedure on a trial basis, and the like.
- the above-mentioned conventional method can express the cause and the result as a probability in a one-to-one relationship, but cannot associate an accident caused by combining a plurality of types of causes and results.
- This also has the same problem in the clustering method that is a signal classification method.
- the internal logic is often not explicitly understood, and it is often difficult to explain the validity of the internal logic, that is, the output.
- transition prediction result and the basis of the transition prediction (FIG. 17) to the person in charge of monitoring and operating the power system 1, there is an effect of supporting the judgment in the work procedure.
- accidents can be prevented in advance by the advance countermeasures of the electric power system 1 (FIG. 19), and the power failure time can be reduced.
- it is effective in shortening the time required for the restoration work by presenting to the person in charge a plausible accident cause (FIG. 18) in response to the accident that occurred.
- the effect of improving the prediction accuracy can be obtained by noting the specificity as a probability (FIGS. 13 and 14) and reflecting it sequentially and repeatedly. is there.
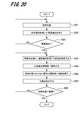
- FIG. 20 is a flowchart showing an accident recovery procedure according to the first embodiment.
- the state of the power system 1 detected by the CPU 41 for example, the state detection unit 302 of the system monitoring device 30 is a steady state (S21).
- the state detection unit 302 detects an event using the measurement signal received by the input unit 301 (S22).
- the state detection unit 302 determines whether any event has occurred in the power system 1 (S23). If no event has occurred (NO in S23), the process returns to step S21.
- the cause estimating unit 309 estimates the cause of the event using the transition probability (S24).
- the display control unit 307 presents a countermeasure plan on the display unit 308 based on the determination result of the cause estimation unit 309, and prompts the operator to make a determination (S25). If the cause is not found, the operator is prompted to make a determination (S26). Note that the process of “prompt the operator to make a determination when no cause is found” in the process of step S25 will be described in detail in a first modification of the first embodiment to be described later.
- the display control unit 307 displays a countermeasure on the display unit 308 to instruct the operator of the countermeasure (S27). This process is judged including whether to instruct countermeasures depending on the content of the abnormality, such as in the case of a significant abnormality such as a major failure of equipment or equipment.
- the worker starts the accident recovery work and confirms the accident removal. After the confirmation of the accident removal, the accident recovery is performed.
- the state detection part 302 judges whether the electric power grid
- step S28 if the process returns to the steady state in step S28 (YES in S28), the series of accident recovery processing is terminated.
- the system monitoring device 30 can estimate the cause, present the countermeasure plan, and the like, thereby reducing the manual intervention procedure. Therefore, the cause can be estimated quickly, and the restoration work can be accelerated compared to the conventional method.
- First Modified Example of First Embodiment> [Rare cases, irrational, unexpected, unrelated]
- probabilistic situations such as likelihood, consistency, contradiction, and contradiction may occur (S26 in FIG. 20).
- the first modification of the first embodiment is characterized by prompting the operator's judgment by showing the probabilistic situation to the operator.
- Probability data prepared in advance cannot include causes and results that cannot be assumed in advance. For example, it is difficult to set a stochastic relationship for an event that causes an extremely large-scale accident because of its low frequency. When a result is caused by such a cause, a probable cause is obtained by the above-described cause estimation procedure. However, since the original cause is not prepared in advance, the likelihood is low. This situation can also occur when noise enters the measurement signal. In the first modification of the first embodiment, when the likelihood of the probabilistic relationship between the cause and the result is low, the operator's judgment is prompted by presenting the situation to the operator.
- a rarely occurring state may be taken into a high-frequency state and cannot be distinguished. If the measurement signal is not related to the cause prepared in advance, it is determined as noise and excluded. Accordingly, a significant signal is passed through the state detection unit 302, and the state detection unit 302 operates as a filter that eliminates noise. The accuracy of signal analysis can be improved by eliminating noise. Further, by eliminating noise, it is possible to eliminate erroneous dispatch of accident recovery work.
- the contents of the plurality of measurement signals may not match.
- the cause estimated from the measurement signal is a tree contact, but the weather data obtained as another measurement signal indicates that there is no wind, the tree sways and touched the track even though there was no wind As a result, the cause and the result are not consistent. Whether any information contains noise or whether the tree has shaken for an unexpected reason cannot be determined from the association between the previous cause and the result.
- the cause estimated from the measurement signal is tree contact
- the map data obtained as another measurement signal indicates that there is no tree near the power system. The cause and the result are inconsistent.
- the operator's judgment is prompted by presenting the contradiction to the operator.
- the first modified example of the first embodiment has a means for prompting a judgment by presenting the contradictory situation to the operator, assuming that an accident that has not been anticipated in advance may have occurred.
- Second Modification of First Embodiment> [Acceleration, asynchronous access]
- information such as a state having a possibility of transition, the cause of transition, and the probability of transition is read from the storage unit and used.
- the storage unit include a data center and a cloud system that are accessed via the network N in addition to a memory and a hard disk.
- the system monitoring device 30 when the system monitoring device 30 calculates the probability related to the state transition, the system monitoring device 30 issues a related information search without waiting for the instruction of the related data operator, and performs a high-speed buffer. To accumulate. As a result, when an instruction from the operator is issued, the system monitoring apparatus 30 realizes a high-speed response by performing data access to the buffer. In other words, the data search is performed asynchronously based on the state transition. The related data that has been retrieved asynchronously and accumulated in the buffer can be read out at a very high speed because it can be read out from the buffer.
- Second Embodiment> [Probability calculation by particle filter]
- the Kalman filter is widely used as a method for sequentially calculating probabilistic likelihood states for a noisy system.
- the particle filter that is a derivation method is a numerical calculation method that approximates a probability distribution with a large number of particles, and has a feature that it can handle a non-linear, non-Gaussian system.
- the calculation amount increases because the calculation is repeatedly performed using a large number of particles.
- the particle filter is a probability calculation method having high flexibility, but the calculation time becomes a problem. Although it can be expected to improve the performance of computers in the future, it can be used as a differentiating technique if it can speed up calculations. In the following, a method for high-speed computation of the particle filter will be examined.
- xt is a state vector
- yt is an observation vector
- wt is system noise
- vt observation noise
- F is a system equation
- h is an observation equation.
- the subscript t indicates a time step. System noise generated in the system is sampled by an observer that generates observation noise, and the most probable state value is calculated when both types of noise exist. Note that a system with one input and one output can be simply expressed as in equations (11) and (12).
- the estimated value can be obtained analytically.
- events that cause accidents do not always have a normal distribution. Since the particle filter approximates the probability distribution with a large number of particles, there is no restriction on the shape of the probability distribution.
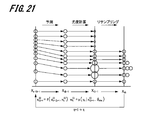
- FIG. 21 is an explanatory diagram showing a typical calculation procedure of the particle filter.
- the particle filter has a property that the weight of the particles (wt (i) in FIG. 21) changes in the calculation process. Therefore, a procedure for normalizing the weight and the number of particles is necessary for each repeated calculation. This is a process for characterizing the particle filter called resampling.
- FIG. 21 and FIGS. 22 and 23 to be described later are extracted from “Tomoyuki Higuchi,“ Basics of Statistical Modeling Utilizing Prediction ”, Kodansha, 2011”.
- a general description of the Kalman filter is described in detail in “Toru Katayama,“ Nonlinear Kalman Filter ”, Asakura Publishing, 978-4-254-20148-2”.
- Calculating the particle filter is a mixture of processing that handles individual particles and processing that handles all particles. Among them, resampling is aimed at normalization, and is an operation that handles the whole particle. Speeding up is an important requirement when considering the application of probability calculation to accident response. Accordingly, the inventors focused on resampling processing and studied a new high-speed method that replaces the conventional method.
- FIG. 22 is a graph showing a general resampling process procedure of the particle filter.
- a general resampling process procedure will be described with reference to FIG.
- the resampling process is interpreted as canceling the error caused by the integer conversion of individual particles as a whole. It is noted that this procedure is not specific to the particle filter and is similar to error diffusion processing known in the field of image processing. For example, if a multilevel signal is input per pixel and output by a binary level printer, an error occurs in input / output. By passing this error to adjacent pixels and canceling the error for the entire screen, an output image corresponding to a multi-value level can be obtained with a binary-level printer.
- FIG. 23 shows the procedure of the resampling processing of the particle filter using error diffusion.
- Calculation of the number of particles from the particle size (weight) wt (i) corresponds to converting the size into an integer, and the decimal part remains as an error. By diffusing the remaining error to adjacent particles (arrows in the figure), the error is canceled as a whole.
- the program can be realized by a simple procedure of converting the particle size wt (i) into an integer, calculating an error, and correcting the weight of an adjacent particle. In this method, the processing is completed between the particle and the adjacent particle, and it is not necessary to refer to the entire particle. As a result, the number of processing steps is reduced, contributing to speeding up, and the possibility of implementing parallel processing appears.
- the error that occurs in the last particle is a residual because there is no particle to receive.
- the probability distribution may be biased depending on how the particles that diffuse the error are selected. However, these effects will be minor if the total number of particles is large. Furthermore, these influences can be reduced by making the error diffusion destination a plurality of particles.
- the above-described exemplary embodiments are detailed and specific descriptions of the configuration of the apparatus and the system in order to explain the present invention in an easy-to-understand manner, and are not necessarily limited to those having all the configurations described above. . Further, it is possible to replace a part of the configuration of one embodiment with the configuration of another embodiment. In addition, the configuration of another embodiment can be added to the configuration of a certain embodiment. Moreover, it is also possible to add, delete, and replace other configurations for a part of the configuration of each exemplary embodiment.
- each of the above-described configurations, functions, processing units, processing means, and the like may be realized by hardware by designing a part or all of them with, for example, an integrated circuit.
- Each of the above-described configurations, functions, and the like may be realized by software by interpreting and executing a program that realizes each function by the processor.
- Information such as programs, tables, and files for realizing each function can be stored in a recording device such as a memory, a hard disk, or an SSD (Solid State Drive), or a recording medium such as an IC card, an SD card, or a DVD.
- control lines and information lines indicate what is considered necessary for the explanation, and not all the control lines and information lines on the product are necessarily shown. Actually, it may be considered that almost all the components are connected to each other.
- processing steps describing time-series processing are not limited to processing performed in time series according to the described order, but may be performed in parallel or It also includes individually executed processes (for example, parallel processing or object processing).
- State transition storage unit 305 ... Transition probability calculation unit, 306 ... Transition state determination unit, 307 ... display control unit, 308 ... display unit, 309 ... cause estimation unit, 310 ... causal relationship storage unit, 311 ... event probability storage unit, 312 ... support information storage section, 321 ... state transition setting unit, 322 ... probability calculation method setting unit, 323 ... decision logic setting unit, 324 ... probability setting unit
Landscapes
- Engineering & Computer Science (AREA)
- Power Engineering (AREA)
- Remote Monitoring And Control Of Power-Distribution Networks (AREA)
- Supply And Distribution Of Alternating Current (AREA)
Abstract
Un aspect de la présente invention comprend : une unité d'entrée qui accepte l'entrée d'informations de mesure qui sont des informations mesurées par un capteur disposé dans un système objet, et des informations périphériques concernant le système objet ; une unité de détection d'état qui détecte l'état actuel du système objet à partir des informations de mesure acceptées ; une unité de calcul de probabilité de transition qui, en fonction de l'état actuel du système objet détecté par l'unité de détection d'état, des informations de transition d'état du système objet, et des informations périphériques acceptées, calcule une probabilité de transition de l'état actuel à un autre état ; et une unité de détermination d'état de transition qui, en fonction de la probabilité de transition calculée, détermine un état suivant vers lequel la transition est effectuée à partir de l'état actuel.
Priority Applications (1)
| Application Number | Priority Date | Filing Date | Title |
|---|---|---|---|
| EP17806184.2A EP3467984A4 (fr) | 2016-05-30 | 2017-04-10 | Dispositif et programme de surveillance de système |
Applications Claiming Priority (2)
| Application Number | Priority Date | Filing Date | Title |
|---|---|---|---|
| JP2016107034A JP6796399B2 (ja) | 2016-05-30 | 2016-05-30 | 電力系統監視装置及びプログラム |
| JP2016-107034 | 2016-05-30 |
Publications (1)
| Publication Number | Publication Date |
|---|---|
| WO2017208623A1 true WO2017208623A1 (fr) | 2017-12-07 |
Family
ID=60479596
Family Applications (1)
| Application Number | Title | Priority Date | Filing Date |
|---|---|---|---|
| PCT/JP2017/014619 Ceased WO2017208623A1 (fr) | 2016-05-30 | 2017-04-10 | Dispositif et programme de surveillance de système |
Country Status (3)
| Country | Link |
|---|---|
| EP (1) | EP3467984A4 (fr) |
| JP (1) | JP6796399B2 (fr) |
| WO (1) | WO2017208623A1 (fr) |
Cited By (1)
| Publication number | Priority date | Publication date | Assignee | Title |
|---|---|---|---|---|
| US12517280B2 (en) | 2018-11-09 | 2026-01-06 | Itron, Inc. | Techniques for geolocation and cloud detection with voltage data from solar homes |
Families Citing this family (11)
| Publication number | Priority date | Publication date | Assignee | Title |
|---|---|---|---|---|
| JP7158187B2 (ja) * | 2018-07-06 | 2022-10-21 | 関西電力株式会社 | 電力系統監視装置及び電力系統監視方法 |
| EP3889864B1 (fr) * | 2018-11-27 | 2025-10-08 | Fujitsu Frontech Limited | Dispositif d'estimation de cause, procédé de sortie d'estimation de cause, et dispositif de manipulation de feuille de papier |
| EP3751699B1 (fr) | 2019-06-13 | 2021-09-15 | Siemens Aktiengesellschaft | Procédé et dispositif d'estimation d'un état d'un réseau de distribution d'énergie |
| US12251842B2 (en) | 2019-07-22 | 2025-03-18 | Nec Corporation | Information processing device, control method, and storage medium |
| KR102561790B1 (ko) * | 2020-11-02 | 2023-08-01 | 광주과학기술원 | 폐루프 배전계통의 보호장치 및 인공지능 장치 |
| JP7508383B2 (ja) * | 2021-02-09 | 2024-07-01 | 株式会社日立製作所 | 電力系統監視制御装置、およびその制御方法 |
| JP7745432B2 (ja) * | 2021-11-02 | 2025-09-29 | 三菱重工業株式会社 | 被害予測装置、被害予測方法及びプログラム |
| JP7847442B2 (ja) * | 2022-02-07 | 2026-04-17 | 三菱電機株式会社 | 停電情報提供装置、停電情報提供システムおよびプログラム |
| JP7826775B2 (ja) * | 2022-03-23 | 2026-03-10 | 中国電力株式会社 | 事故原因推定装置、事故原因推定装置の制御方法及びプログラム |
| JP2024020696A (ja) * | 2022-08-02 | 2024-02-15 | 株式会社日立製作所 | 電力系統故障原因推定方法及び装置 |
| CN121036334B (zh) * | 2025-08-19 | 2026-04-10 | 青岛海青汽车股份有限公司 | 一种基于移动变电站的设备运行状态可视化分析系统 |
Citations (2)
| Publication number | Priority date | Publication date | Assignee | Title |
|---|---|---|---|---|
| JP2006259862A (ja) * | 2005-03-15 | 2006-09-28 | Toshiba Corp | ベイジアンネットワーク作成装置及び方法並びにプログラム |
| JP2013208042A (ja) * | 2012-03-29 | 2013-10-07 | Toshiba Corp | 電力系統監視システム |
Family Cites Families (3)
| Publication number | Priority date | Publication date | Assignee | Title |
|---|---|---|---|---|
| US10630099B2 (en) * | 2013-06-11 | 2020-04-21 | International Business Machines Corporation | Reducing conversion losses and minimizing load via appliance level distributed storage |
| US20170017215A1 (en) * | 2013-12-10 | 2017-01-19 | Panasonic Intellectual Property Management Co., Ltd. | Demand prediction system and program |
| US20150262110A1 (en) * | 2014-03-11 | 2015-09-17 | General Electric Company | Systems and methods for utility crew forecasting |
-
2016
- 2016-05-30 JP JP2016107034A patent/JP6796399B2/ja active Active
-
2017
- 2017-04-10 EP EP17806184.2A patent/EP3467984A4/fr active Pending
- 2017-04-10 WO PCT/JP2017/014619 patent/WO2017208623A1/fr not_active Ceased
Patent Citations (2)
| Publication number | Priority date | Publication date | Assignee | Title |
|---|---|---|---|---|
| JP2006259862A (ja) * | 2005-03-15 | 2006-09-28 | Toshiba Corp | ベイジアンネットワーク作成装置及び方法並びにプログラム |
| JP2013208042A (ja) * | 2012-03-29 | 2013-10-07 | Toshiba Corp | 電力系統監視システム |
Non-Patent Citations (2)
| Title |
|---|
| See also references of EP3467984A4 * |
| YUJIA ZHOU: "Modeling Weather-Related Failures of Overhead Distribution Lines", IEEE TRANSACTIONS ON POWER SYSTEMS, vol. 21, no. 4, November 2006 (2006-11-01), pages 1683 - 1690, XP011149790 * |
Cited By (1)
| Publication number | Priority date | Publication date | Assignee | Title |
|---|---|---|---|---|
| US12517280B2 (en) | 2018-11-09 | 2026-01-06 | Itron, Inc. | Techniques for geolocation and cloud detection with voltage data from solar homes |
Also Published As
| Publication number | Publication date |
|---|---|
| JP2017216757A (ja) | 2017-12-07 |
| JP6796399B2 (ja) | 2020-12-09 |
| EP3467984A4 (fr) | 2019-11-13 |
| EP3467984A1 (fr) | 2019-04-10 |
Similar Documents
| Publication | Publication Date | Title |
|---|---|---|
| JP6796399B2 (ja) | 電力系統監視装置及びプログラム | |
| Zhang et al. | Time series anomaly detection for smart grids: A survey | |
| US12560639B2 (en) | Tracking of health and resilience of physical equipment and related systems | |
| Tu et al. | Big data issues in smart grid–A review | |
| US20130191052A1 (en) | Real-time simulation of power grid disruption | |
| Mazhari et al. | A hybrid fault cluster and thévenin equivalent based framework for rotor angle stability prediction | |
| JP2018170006A (ja) | 電力グリッドにおけるサイバー脅威を検出する汎用フレームワーク | |
| US12039045B2 (en) | Event analysis in an electric power system | |
| Garcia et al. | Line outage localization using phasor measurement data in transient state | |
| JP6774797B2 (ja) | 監視装置および監視方法 | |
| Koshy et al. | Smart grid–based big data analytics using machine learning and artificial intelligence: A survey | |
| CN119247034A (zh) | 电网故障诊断方法、装置、存储介质及设备 | |
| Fahim et al. | The role of machine learning in improving power distribution systems resilience | |
| Reda et al. | Online detection of faults in transmission lines | |
| Khediri et al. | Deep-belief network based prediction model for power outage in smart grid | |
| CN121117943A (zh) | 基于模态分析的宽频电网振荡定位方法和装置 | |
| Baloch et al. | Artificial Intelligence-Enhanced Fault Detection, Diagnosis, and Predictive Maintenance in Next-Generation Smart Grids | |
| Bajagain et al. | Spectral clustering for fast outage detection and visualization in power distribution systems | |
| Aljurbua et al. | Spatiotemporal multiplex network model for predicting forced outage severity in distribution grids | |
| CN117973609A (zh) | 一种变电站区域洪涝预测预警方法、装置及介质 | |
| Wanik et al. | PMU analytics for power fault awareness and prediction | |
| Chren | Towards multi-layered reliability analysis in smart grids | |
| Guo | Data analytics and application developments based on synchrophasor measurements | |
| Sheeba et al. | WFCM based big sensor data error detection and correction in wireless sensor network | |
| Mendhiratta et al. | Leveraging Graph Digital Twin for Fault Detection and Improved Power Grid Stability in Smart Cities |
Legal Events
| Date | Code | Title | Description |
|---|---|---|---|
| NENP | Non-entry into the national phase |
Ref country code: DE |
|
| 121 | Ep: the epo has been informed by wipo that ep was designated in this application |
Ref document number: 17806184 Country of ref document: EP Kind code of ref document: A1 |
|
| ENP | Entry into the national phase |
Ref document number: 2017806184 Country of ref document: EP Effective date: 20190102 |