WO2019198681A1 - Système d'affichage d'environnement d'ondes radio et procédé d'affichage d'environnement d'ondes radio - Google Patents
Système d'affichage d'environnement d'ondes radio et procédé d'affichage d'environnement d'ondes radio Download PDFInfo
- Publication number
- WO2019198681A1 WO2019198681A1 PCT/JP2019/015366 JP2019015366W WO2019198681A1 WO 2019198681 A1 WO2019198681 A1 WO 2019198681A1 JP 2019015366 W JP2019015366 W JP 2019015366W WO 2019198681 A1 WO2019198681 A1 WO 2019198681A1
- Authority
- WO
- WIPO (PCT)
- Prior art keywords
- radio wave
- radio
- environment
- target area
- measurement
- Prior art date
- Legal status (The legal status is an assumption and is not a legal conclusion. Google has not performed a legal analysis and makes no representation as to the accuracy of the status listed.)
- Ceased
Links
Images


Classifications
-
- H—ELECTRICITY
- H04—ELECTRIC COMMUNICATION TECHNIQUE
- H04B—TRANSMISSION
- H04B3/00—Line transmission systems
- H04B3/52—Systems for transmission between fixed stations via waveguides
-
- G—PHYSICS
- G01—MEASURING; TESTING
- G01R—MEASURING ELECTRIC VARIABLES; MEASURING MAGNETIC VARIABLES
- G01R29/00—Arrangements for measuring or indicating electric quantities not covered by groups G01R19/00 - G01R27/00
- G01R29/08—Measuring electromagnetic field characteristics
-
- G—PHYSICS
- G01—MEASURING; TESTING
- G01R—MEASURING ELECTRIC VARIABLES; MEASURING MAGNETIC VARIABLES
- G01R29/00—Arrangements for measuring or indicating electric quantities not covered by groups G01R19/00 - G01R27/00
- G01R29/08—Measuring electromagnetic field characteristics
- G01R29/0864—Measuring electromagnetic field characteristics characterised by constructional or functional features
- G01R29/0871—Complete apparatus or systems; circuits, e.g. receivers or amplifiers
-
- H—ELECTRICITY
- H04—ELECTRIC COMMUNICATION TECHNIQUE
- H04W—WIRELESS COMMUNICATION NETWORKS
- H04W16/00—Network planning, e.g. coverage or traffic planning tools; Network deployment, e.g. resource partitioning or cells structures
- H04W16/18—Network planning tools
-
- H—ELECTRICITY
- H04—ELECTRIC COMMUNICATION TECHNIQUE
- H04W—WIRELESS COMMUNICATION NETWORKS
- H04W24/00—Supervisory, monitoring or testing arrangements
- H04W24/10—Scheduling measurement reports ; Arrangements for measurement reports
-
- G—PHYSICS
- G01—MEASURING; TESTING
- G01R—MEASURING ELECTRIC VARIABLES; MEASURING MAGNETIC VARIABLES
- G01R29/00—Arrangements for measuring or indicating electric quantities not covered by groups G01R19/00 - G01R27/00
- G01R29/08—Measuring electromagnetic field characteristics
- G01R29/0807—Measuring electromagnetic field characteristics characterised by the application
- G01R29/0814—Field measurements related to measuring influence on or from apparatus, components or humans, e.g. in ESD, EMI, EMC, EMP testing, measuring radiation leakage; detecting presence of micro- or radiowave emitters; dosimetry; testing shielding; measurements related to lightning
-
- G—PHYSICS
- G01—MEASURING; TESTING
- G01R—MEASURING ELECTRIC VARIABLES; MEASURING MAGNETIC VARIABLES
- G01R29/00—Arrangements for measuring or indicating electric quantities not covered by groups G01R19/00 - G01R27/00
- G01R29/08—Measuring electromagnetic field characteristics
- G01R29/0864—Measuring electromagnetic field characteristics characterised by constructional or functional features
- G01R29/0878—Sensors; antennas; probes; detectors
Definitions
- This disclosure relates to a radio wave environment display system and a radio wave environment display method.
- Patent Document 1 discloses a method of dividing an estimation target area into minute sections and grasping reception qualities from a plurality of base stations installed in each area in each minute section. Further, this Patent Document 1 discloses a method for estimating an area where a handover occurs by detecting a handover condition with reference to a difference between reception quality in each minute section and reception quality between a minute section and an adjacent minute section. Disclosure.
- An object of the present invention is to provide a radio wave environment display system and a radio wave environment display method for suppressing deterioration of the radio wave.
- the present disclosure includes: a measurement antenna installed in a target area of a wireless communication service; and a radio wave environment display device that analyzes a communication environment of the wireless communication service using a radio wave intensity of a radio wave received by the measurement antenna.
- the measurement antenna measures the radio field intensity of the first radio wave transmitted by the wireless communication service, scans the radio field intensity of the plurality of radio waves including the first radio wave in the target area, and
- the display device selects a radio wave intensity of a second radio wave having a frequency that is the same as or close to the frequency of the first radio wave from the plurality of radio waves obtained by the scan, and selects the radio wave intensity and the selection of the first radio wave.
- a radio wave environment display system that calculates a communication environment of the wireless communication service based on a difference between the radio wave intensity of the second radio wave and displays the communication environment on a display unit.
- the present disclosure also includes a measurement antenna installed in a target area of a wireless communication service, and a radio wave environment display device that analyzes a communication environment of the wireless communication service using a radio wave intensity of a radio wave received by the measurement antenna.
- a radio wave environment display method in a radio wave environment display system including: the measurement antenna measures a radio wave intensity of a first radio wave transmitted by the wireless communication service, and includes the first radio wave in the target area.
- the radio wave environment display device scans radio wave intensities of a plurality of radio waves, and the radio wave environment display device has a radio wave intensity of a second radio wave having a frequency the same as or close to the frequency of the first radio wave among the plurality of radio waves obtained by the scan
- the communication environment of the wireless communication service is calculated based on the difference between the radio field intensity of the first radio wave and the radio field intensity of the selected second radio wave. It is displayed on the display unit and to provide a radio wave environment display method.
- the present disclosure it is possible to visually clearly indicate whether or not the communication environment of the wireless communication service in the area provided to be available to the user is good, and it is possible to suppress deterioration of the user's usability.
- FIG. 3 is a block diagram showing a hardware configuration example of each of the measurement antenna device and the PC that constitute the radio wave environment display system according to the first embodiment.
- the perspective view which shows the external appearance of the measurement antenna apparatus which concerns on Embodiment 1.
- FIG. The figure which shows the example of a display of the calculation result of the communication environment in a target area
- FIG. 6 is a sequence diagram illustrating an example of an operation procedure related to measurement of the radio wave environment of the measurement antenna device and the PC constituting the radio wave environment display system according to the first embodiment.
- FIG. 7 is a sequence diagram illustrating an example of an operation procedure related to measurement of a radio wave environment of a measurement antenna device and a PC constituting a radio wave environment display system according to a second embodiment.
- the radio wave environment of a wireless LAN (Local Area Network) service such as Wifi (registered trademark) that is provided for free use to travelers etc. in areas such as airports or stations, etc. Often deteriorates under the influence of radio waves transmitted (radiated) from a mobile router or the like possessed by.
- the radio wave environment of the wireless LAN service described above changes. In other words, since the usability of the wireless LAN service provided freely available in the area (that is, whether the communication environment in the area is good) is not clearly indicated, such as a traveler who wants to use the wireless LAN service User convenience was not good.
- Patent Document 1 described above it is not assumed that the communication environment in the area where the wireless LAN service can be used is visually good.
- a radio wave that visually indicates whether or not the communication environment of the wireless communication service in the area provided to be available to the user is favorable, and suppresses deterioration of the user's usability.
- a measurement antenna is provided in the target area. (See FIG. 3) is always installed.
- the measurement antenna includes a first radio wave (in other words, a main signal) transmitted (radiated) from an access point corresponding to wireless identification information (for example, SSID (Service Set IDentifier)) of a desired wireless LAN service, and the first A plurality of radio waves including radio waves are received and the radio wave intensity of each radio wave is measured.
- a PC an example of a radio wave environment display device connected to the measurement antenna calculates and monitors the communication environment in the target area of the desired wireless LAN service based on the radio wave intensity of each radio wave received by the measurement antenna. (Display example).
- the radio wave here is not limited to the radio wave corresponding to the main signal in the frequency band corresponding to the desired wireless LAN service, for example, and may be in the same frequency band as that frequency band (in other words, there is a possibility of interference).
- the radio wave intensity is an index indicating the reception quality of the radio wave received by the measurement antenna.
- the reception quality is, for example, the signal power of the received signal or the received electric field strength.
- the communication environment is an index (for example, a rate of 0% to 100%) that quantitatively indicates whether the wireless communication of the desired wireless LAN service can be performed satisfactorily in the target area. For example, if the communication environment is 100% Wireless communication using the wireless LAN service can be performed satisfactorily. On the other hand, if the communication environment is 0%, wireless communication using the wireless LAN service cannot be performed satisfactorily.
- FIG. 1 is a diagram illustrating an example of a target area RG1 including a counter CNT1 in an airport ARP1 in which the measurement antenna device 10 according to Embodiment 1 is installed.
- a counter CNT1 where many travelers gather for check-in to the airport ARP1 is arranged.
- the measurement antenna device 10 is supported by a pole PL1 from the desk surface of the counter CNT1, for example, and is always installed.
- a PC 20 is arranged on the desk of the counter CNT1. Note that the measurement antenna device 10 is not limited to be supported by the pole PL1, and may be disposed by being suspended from a ceiling surface (not shown) above the counter CNT1 by a string or the like.
- the first radio wave (main signal WV1) is transmitted from the access point AP1 corresponding to a desired wireless LAN service such as Wifi (registered trademark) provided to the traveler etc. in the airport ARP1 so as to be freely usable. (Radiated).
- the measurement antenna device 10 receives the main signal WV1 during the measurement mode, measures the radio field intensity of the main signal WV1 when the main signal WV1 is received, and outputs it to the PC 20. Further, the measurement antenna device 10 receives a plurality of radio waves including the main signal WV1 existing in the target area RG1 in the scan mode, measures the radio field intensity of the main signal WV1 at the time of receiving each radio wave, and outputs it to the PC 20 To do.
- the PC 20 calculates the communication environment of the wireless LAN service in the target area RG1 using various radio wave intensities from the measurement antenna device 10 and outputs the communication environment to the monitor DP1.
- the monitor DP1 is a large display disposed in the target area RG1, for example, and is disposed at a position where many travelers can easily touch it.
- the plurality of radio waves are, for example, radio waves NZ1, NZ2, NZ3 from the signal sources IF1, IF2, IF3 other than the main signal WV1 from the access point AP1.
- the measurement antenna device 10 switches to either the measurement mode or the scan mode according to a mode switching signal (in other words, a measurement command described later) from the PC 20, for example.
- the signal sources IF1 to IF3 are, for example, radio waves different from those of a mobile router possessed by a traveler or the like appearing in the vicinity of the target area RG1 of the airport ARP1 (that is, an access point AP1 corresponding to a desired wireless LAN service in the airport ARP1).
- Signal source that is, the signal sources IF1 to IF3 transmit (radiate) the radio waves NZ1, NZ2, and NZ3 as interference waves that may deteriorate the communication environment of the wireless LAN.
- the number of radio waves as the signal source and the jamming wave is illustratively three, but it is needless to say that the number is not limited to three.
- the signal sources IF1 to IF3 are not access points having a predetermined SSID that is registered in advance so as to be usable in the target area RG1.
- a router may be included, and the same applies to the following embodiments.
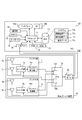
- FIG. 2 is a block diagram illustrating a hardware configuration example of each of the measurement antenna device 10 and the PC 20 included in the radio wave environment display system 100 according to the first embodiment.
- the radio wave environment display system 100 includes a measurement antenna device 10 and a PC 20 as an example of the radio wave environment display device.
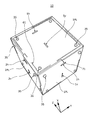
- FIG. 3 is a perspective view showing an appearance of the measurement antenna device 10 according to the first embodiment.
- the respective directions of the X axis, the Y axis, and the Z axis follow the directions of arrows shown in FIG. 3, for example.
- the + X direction and the ⁇ X direction are the vertical direction of the housing of the measurement antenna device 10
- the ⁇ Y direction and the + Y direction are the horizontal direction of the housing of the measurement antenna device 10
- the ⁇ Z direction and the + Z direction are the measurement antenna device 10. This corresponds to the front-rear direction of the housing.
- the measurement antenna device 10 has a polyhedral housing such as a quadrangular prism (for example, a rectangular parallelepiped or a cube), and has a total of six surfaces (specifically, the front surface 1PL, Corresponding antenna portions 1,..., 6 are provided on the left surface 2PL, the rear surface, the right surface, the upper surface 5PL, and the lower surface.
- the housing of the measurement antenna device 10 is arranged such that any surface (for example, the lower surface) is supported by the pole PL.
- the measurement antenna device 10 is always installed above the counter CNT1 and can receive radio waves present in the target area RG1.
- the measurement antenna apparatus 10 includes antenna units 1 to 6, an MPU 7a, and a USB (Universal Serial Bus) port 7b. Since all the antenna units 1 to 6 have the same configuration, the antenna unit 1 will be described as an example in order to simplify the description. Moreover, in the following description of the antenna unit 1, it may be read as a corresponding configuration of another antenna unit.
- USB Universal Serial Bus
- the antenna unit 1 includes a horizontally polarized antenna 1h, a vertically polarized antenna 1v, a switch unit 1s, and an antenna control unit 1m.
- the horizontally polarized antenna 1h includes various signal sources IF1 to IF3 including a first radio wave (main signal WV1) from the access point AP1 (see FIG. 1) corresponding to desired radio identification information being transmitted in the target area RG1. Specifically, it receives horizontal polarization of a predetermined frequency band (for example, 1.9 GHz to 2.4 GHz band).
- the horizontally polarized antenna 1h is electrically connected to the switch unit 1s.
- the vertically polarized antenna 1v includes various signal sources IF1 to IF3 including a first radio wave (main signal WV1) from the access point AP1 (see FIG. 1) corresponding to desired radio identification information being transmitted in the target area RG1. Specifically, it receives vertical polarization of radio waves from, for example, vertical polarization in a predetermined frequency band (for example, 1.9 GHz to 2.4 GHz band).
- the vertically polarized antenna 1v is electrically connected to the switch unit 1s.
- the switch unit 1s is either a horizontal polarization antenna 1h or a vertical polarization antenna 1v according to a switch switching signal that is output in a time-sharing manner for each surface constituting the housing of the measurement antenna device 10 from the switch switching control unit 7a2 of the MPU 7a. Is connected to the antenna control unit 1m. In other words, the switch unit 1s outputs the output of the horizontal polarization antenna 1h or the vertical polarization antenna 1v to the antenna control unit 1m according to the switch switching signal described above.
- the antenna control unit 1m is configured by using a circuit capable of processing a radio signal conforming to various radio communication schemes handling the frequency band of 1.9 GHz to 2.4 GHz described above.
- the wireless communication method here is, for example, a wireless LAN such as DECT (Digital Enhanced Cordless Communications), Bluetooth (registered trademark), WiFi (registered trademark), or the like.
- the antenna control unit 1m extracts the output (for example, signal power or received electric field strength) of the horizontal polarization antenna 1h or the vertical polarization antenna 1v connected to the switch unit 1s as parallel format data, and extracts the parallel format data.
- the data is output to the data converter 7a1 of the MPU 7a.
- the MPU (Micro Processing Unit) 7 a functions as a control unit of the measurement antenna device 10, performs control processing for overall control of each unit of the measurement antenna device 10, and data between each unit of the measurement antenna device 10 Input / output processing, data calculation processing, and data storage processing.
- the MPU 7a includes a data conversion unit 7a1 and a switch switching control unit 7a2.
- the MPU 7a When the measurement command for measuring the signal power of the wireless identification information designated by the system operator (for example, SSID (Service Set IDentifier)) is sent from the PC 20, the MPU 7a sends the measurement command via the USB port 7b. Receive. The MPU 7a shifts to the measurement mode in response to the reception of the measurement command, and starts the measurement of the signal power of the SSID signal designated by the system operator (that is, the main signal WV1 described above). Control each part. For example, in the measurement mode, the MPU 7a uses each antenna unit 1 to 1 so as to receive a signal of the SSID designated by the system operator (that is, the main signal WV1 described above) using the antenna arranged on each surface. 6 is controlled.
- SSID Service Set IDentifier
- the MPU 7a sends from the PC 20 a measurement command (that is, a scan mode measurement command) for measuring the signal power of radio waves from various signal sources (see FIG. 4) including the access point AP1 of the main signal WV1 described above.
- the measurement command is received via the USB port 7b.
- the MPU 7a shifts to the scan mode in response to the reception of the measurement command, and the radio waves NZ1 to NZ3 from various signal sources IF1 to IF3 including the SSID signal designated by the system operator (that is, the main signal WV1 described above).
- Each part of the measurement antenna device 10 is controlled so as to start the measurement of the signal power.
- the MPU 7a uses various antennas IF1 to IF3 including the SSID signal designated by the system operator (that is, the main signal WV1 described above) using the antennas arranged on the respective surfaces in the scan mode.
- the antenna units 1 to 6 are controlled to receive the radio waves NZ1 to NZ3.
- the measurement mode and the scan mode are alternately switched in a time division manner according to the measurement command sent from the PC 20 (see FIG. 6).
- the PC 20 may cause the measurement antenna device 10 to measure the radio wave intensity of the measurement antenna device 10 in combination with the measurement mode and the scan mode in order to speed up the measurement of the radio wave strength of the radio wave in the measurement antenna device 10.
- the PC 20 includes various signal sources IF1 to IF1 including a main signal WV1 on one of the polyhedrons (for example, hexahedrons) constituting the housing of the measurement antenna device 10 (for example, the front signal 1V).
- the antenna unit 1 is controlled to receive the radio waves NZ1 to NZ3 from the IF3.
- the PC 20 has antenna units corresponding to receive the main signal WV1) on the remaining five surfaces (for example, the left surface 2PL, the right surface, the upper surface 5PL, the lower surface, and the rear surface) of the polyhedron (for example, the hexahedron). Control.
- the data conversion unit 7a1 is configured using, for example, a UART (Universal Asynchronous Receiver / Transmitter) circuit, and converts the parallel data output by each antenna control unit (for example, the antenna control units 1m to 6m) into serial data. Convert to This data (for example, signal power or reception field strength of radio waves transmitted from various signal sources including the access point AP1) is input to the PC 20 connected to the measurement antenna device 10 via the USB port 7b. In addition to the PC 20, the data may be input to a measuring device (not shown, for example, a spectrum analyzer or a network analyzer) connected via the USB port 7b.
- a measuring device not shown, for example, a spectrum analyzer or a network analyzer
- the switch switching control unit 7a2 generates, in a time division manner, a switch switching signal for inputting the output of the horizontal polarization antenna or the vertical polarization antenna on any one of the surfaces of the measurement antenna device 10 to the MPU unit 7. To do.
- the switch switching control unit 7a2 has a GPIO (General-purpose Input / Output) terminal. Via this GPIO terminal, the switch switching signal generated in the above-described time division is supplied to the switch unit (for example, the switch unit) of each surface. 1s to 6s).
- USB port 7b connects measurement antenna device 10 and PC 20.
- the measurement antenna device 10 receives radio waves.
- the measurement antenna device 10 may be considered to have a configuration for transmitting radio waves.
- the measurement antenna device 10 switches to use any one of the antenna units 1 to 6 in a time division manner, and further, a radio wave is transmitted from a horizontal polarization antenna or a vertical polarization antenna provided in the antenna unit. May be transmitted in time division.
- the measurement antenna device 10 includes a laminated substrate as a face material constituting each surface and a frame body inside the housing of the measurement antenna device 10 as main components.
- the multilayer substrate and the frame body constitute a housing of the measurement antenna device 10 which is a polyhedron (for example, a hexahedron).
- the housing of the measurement antenna device 10 is, for example, a hexahedron, and FIG. 2 illustrates a case of a cube.
- the laminated substrate is attached to each surface of the cube with, for example, fixing screws 35.
- the face material constituting the housing of the measurement antenna device 10 is not limited to the laminated substrate.
- the polyhedron is not limited to a hexahedron, and may be a tetrahedron, a dodecahedron, or the like.
- the measurement antenna device 10 is arranged on one laminated substrate arranged on one upper surface 5PL, one laminated substrate arranged on each of four side surfaces (for example, front surface 1PL, left surface 2PL, right surface, rear surface) and one lower surface. Antennas (horizontal polarization antenna and vertical polarization antenna) are respectively provided on the stacked substrates. Thereby, the measurement antenna device 10 can receive incoming radio waves from a total of six directions. When the measurement antenna device 10 is fixed to a predetermined placement surface and radio waves are measured, a laminated substrate including an antenna may be omitted from the lower surface of the measurement antenna device 10.
- each laminated substrate is, for example, a dipole antenna.
- a dipole antenna is formed on a laminated substrate, for example, and a pattern of the dipole antenna is formed by etching a metal foil on the surface.
- Each of the plurality of layers is made of, for example, copper foil or glass epoxy.
- the 1.9 GHz to 2.4 GHz band horizontal polarization antennas 1 h to 6 h and the 1.9 GHz to 2.4 GHz band vertical polarization antenna 1 v are provided on each laminated substrate of the cubic housing of the measurement antenna device 10.
- To 6v are provided on the surface (upper layer).
- AMC Artificial Magnetic Conductor
- PMC Perfect Magnetic Conductor
- the antenna of the measurement antenna device 10 can be arranged in parallel to the laminated substrate, and the overall size can be reduced.
- the AMC can be prevented from receiving radio waves from other directions by the ground conductor, and the gain of the antenna can be increased.
- the measurement antenna device 10 is provided with a plurality of ground via conductors 61 arranged in a straight line along each side at the four side edges of the multilayer substrate.
- the grounding via conductors 61 may be arranged side by side at equal intervals.
- Each grounding via conductor 61 is sufficiently large to shield radio waves from the outside of the measurement antenna device 10 according to the frequency band (in other words, wavelength) corresponding to the antenna conductor arranged on the multilayer substrate. It may be provided with a small pitch (interval).
- the ground via conductor 61 is provided so as to penetrate from the upper surface to the lower surface of the multilayer substrate.
- the measurement antenna device 10 has a laminated substrate formed in a square shape, for example.
- a concave portion and a convex portion are formed in each side portion with a single step portion 71 provided in the center of the side portion as a boundary along the side portion. That is, as shown in FIG. 3, the housing of the measurement antenna device 10 is combined by fitting the concave and convex portions between adjacent laminated substrates.
- the PC 20 as an example of the radio wave environment display device is connected to the measurement antenna device 10 via a wired cable (for example, a USB cable), and the radio wave intensity (for example, signal power or received electric field) of the radio wave received by the measurement antenna device 10. Enter (strength).
- the PC 20 uses the radio wave intensity of the input radio wave, and uses the radio wave environment of the main signal WV1 (see FIG. 1) at the point where the measurement antenna device 10 is disposed in the target area RG1 (for example, SINR (Signal-to-to be described later)). -Interference-plus-Noise Ratio)). Further, the PC 20 calculates the communication environment in the target area RG1 based on the calculated SINR, and displays it on the monitor DP1 or the display 18a.
- SINR Signal-to-to be described later
- the PC 20 includes a processor 11, a ROM 12, a RAM 13, a keyboard 14, a mouse 15, an input / output interface 16, an HDD (Hard Disk Drive) 17, a display 18a, and a speaker 18b.
- the ROM 12, RAM 13, keyboard 14, mouse 15, input / output interface 16, HDD 17, display 18a, and speaker 18b are connected to the processor 11 via an internal bus or the like so as to be able to input / output data or information.
- the processor 11 is configured using, for example, a CPU (Central Processing Unit), an MPU (Micro Processing Unit), a DSP (Digital Signal Processor), or an FPGA (Field Programmable Gate Array).
- the processor 11 functions as a control unit of the PC 20, and performs control processing for overall control of operations of each unit of the PC 20, data input / output processing with each unit of the PC 20, data calculation processing, and data Alternatively, information storage processing is performed.
- the processor 11 operates in accordance with a program 17a stored in the HDD 17.
- the processor 11 uses the ROM 12 and the RAM 13 at the time of execution of the process, and outputs the calculation result data 17c generated by the calculation process described later or the display data 17d based on the calculation result data 17c to the display 18a for display.
- the processor 11 as an example of the selection unit generates a first radio wave (main signal WV1) from a measurement result (hereinafter referred to as “second measurement result”) of the radio wave intensity obtained from the measurement antenna device 10 in the scan mode. At least one radio wave intensity measurement result (second measurement result) corresponding to radio waves (see FIG. 1) other than the main signal WV1 having the same frequency as the frequency (channel) or in the vicinity thereof is selected.
- the processor 11 as an example of the control unit includes a measurement result (hereinafter, referred to as “first measurement result”) of the radio signal intensity of the main signal WV1 at the point where the measurement antenna device 10 is disposed, and the selected second measurement result. Difference (so-called SINR) is calculated by calculation. Based on the calculated difference (SINR), the processor 11 calculates the communication environment in the target area RG1 and displays it on the monitor DP1 and / or the display 18a. For example, when the calculation basic data 17b includes a table in which SINR and communication environment numerical values are associated in advance, the processor 11 refers to the table and calculates a communication environment corresponding to the calculated SINR.
- the processor 11 uses a predetermined SSID registered in advance so as to be usable in the target area RG1.
- a predetermined SSID registered in advance so as to be usable in the target area RG1.
- information indicating that the SSID of the mobile router has been detected may be displayed on the display 18a.
- the PC 20 can visually indicate to the system operator that an access point (that is, a mobile router) other than the default is brought into the target area RG1, for example, and can strengthen monitoring of the target area RG1.
- the ROM 12 is a read-only memory, and stores an OS (Operating System) program and data in advance.
- the OS program is executed when the PC 20 is activated.
- the RAM 13 is a memory that can be written to and read from.
- the RAM 13 is used as a work memory when executing SINR and communication environment calculation processing (see FIGS. 6 and 9), and is used or generated during SINR and communication environment calculation processing. Data or information to be stored temporarily.
- the keyboard 14 and the mouse 15 as examples of the operation input unit have a function as a human interface with the system operator, and input the operation of the system operator.
- the keyboard 14 and the mouse 15 are used for various settings in various processes executed by the PC 20.
- the input / output interface 16 as an example of the receiving unit operates as an interface for inputting / outputting data or information to / from the measurement antenna device 10.
- the input / output interface 16 displays the measurement result (first measurement result) of the radio wave intensity including the frequency of the main signal WV1 transmitted from the access point AP1 (see FIG. 1) corresponding to the wireless identification information designated by the system operator.
- the input / output interface 16 receives the measurement result (second measurement result) of the radio wave intensity including the frequency of various radio waves including the main signal WV1 described above from the measurement antenna device 10 and sends it to the processor 11.
- the HDD 17 includes a program 17a for executing SINR and communication environment calculation processing (see FIGS. 6 and 9), calculation basic data 17b used for SINR and communication environment calculation processing, and SINR and communication environment calculation processing results. Is stored, and display data 17d generated based on the calculation result data 17c is stored.
- the calculation basic data 17b includes, for example, mathematical expressions or table information for calculating SINR and communication environment, map or layout data in the target areas RG1, RG2, and RG3 (see later), and targets received by the communication unit 19.
- Information on radio waves from various signal sources being transmitted in the area RG1 and information on the access point AP1 corresponding to the radio identification information desired by the system operator are included.
- the program 17a for executing arithmetic processing of SINR and communication environment is read from the HDD 17 to the RAM 13 via the processor 11 and executed by the processor 11.
- the program 17a may be recorded on a recording medium (not shown, for example, a CD-ROM) other than the HDD 17 and read to the RAM 13 by a corresponding reading device (not shown, for example, a CD-ROM drive device).
- the display 18a as an example of the display unit or the output unit is configured using a display device such as an LCD (Liquid Crystal Display) or an organic EL (Electroluminescence).
- the display 18a has a function as a human interface with the system operator, and displays various setting contents, operation states of the PC 20, various calculation results, and display data 17d corresponding to the calculation results.
- the processor 11b determines that the radio field intensity of a mobile router that is not an access point having a predetermined SSID registered in advance so as to be usable in the target area RG1 is greater than or equal to the threshold value, the processor 11b A predetermined sound (for example, an alarm sound) is output as a sound in response to an instruction from.
- the predetermined sound is an alarm sound indicating that a mobile router that is not an access point having a predetermined SSID registered in advance so as to be usable in the target area RG1 is brought in.
- the communication unit 19 receives a radio wave being transmitted (in other words, flying) in the target area RG1 in which the PC 20 is disposed, and using, for example, a known technique, the radio wave intensity (for example, signal power or reception) of the radio wave.
- the radio wave intensity for example, signal power or reception
- Each piece of information regarding the electric field intensity), frequency, and radio wave signal source for example, SSID corresponding to the access point
- This extraction result is displayed on the display 18a by the processor 11 as a radio wave list of radio waves received by the PC 20.
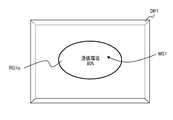
- FIG. 4A is a diagram illustrating a display example of the calculation result of the communication environment in the target area RG1.
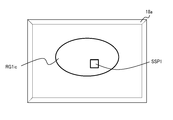
- FIG. 4B is a diagram illustrating a display example of a notification screen indicating that a non-default access point has been brought into the target area RG1.
- FIG. 5 is a graph showing an example of signal power of each of the main signal WV1, the interference wave, and the standing wave.
- the measurement antenna device 10 is disposed above a counter CNT1 (for example, a check-in counter) in the target area RG1.
- a counter CNT1 for example, a check-in counter
- .. 5h (not shown) or vertically polarized antennas 1v, 2v,..., 5v, provided on the respective faces of the hexahedron constituting the casing of the measurement antenna device 10.
- ... 6v (not shown) receives respective radio waves (that is, radio waves NZ1 to NZ3 which are interference waves) from the signal sources IF1 to IF3 in addition to the main signal WV1 from the access point AP1.
- the access point AP1 is arranged for a wireless LAN service provided to be freely usable in the airport APR1, and has a radio signal having a frequency corresponding to radio identification information (for example, SSID) designated by the system operator ( That is, it is a wireless transmitter that transmits the main signal WV1).
- the main signal WV1 is a signal conforming to a wireless LAN such as WiFi (registered trademark).
- the signal sources IF1 to IF3 have a frequency that is the same as or close to the frequency of the main signal WV1 (in other words, a frequency that overlaps in whole or part with the frequency of the main signal WV1) (that is, a signal that may interfere).
- the radio waves NZ1 to NZ3 are, for example, interference radio waves transmitted (radiated) by a mobile router corresponding to a wireless LAN possessed by a traveler who appears in the target area RG1.
- the radio waves NZ1 to NZ3 that are interference waves are also wireless signals of the wireless LAN (for example, 2.4 GHz band).
- the combination of the radio waves NZ1 to NZ3 may be a combination of a wireless LAN, Bluetooth (registered trademark), and DECT in addition to the wireless LAN.
- the data is displayed on the monitor DP1 as an example of the display data 17d.
- a traveler or the like in the target area RG1 displays whether the current communication environment for the wireless LAN service in the target area RG1 is good or not in an image that matches the shape of the target area RG1.
- the PC 20 can more visually clearly indicate that the current communication environment of the wireless LAN service is as good as 80% to travelers in the target area RG1, so that the user can use the wireless LAN service.
- the user convenience can be improved.
- the PC 20 determines that the radio wave intensity of the mobile router that is not the access point AP1 having the default SSID registered in advance in the target area RG1 is not less than the threshold value.
- the screen data generated by superimposing the icon SSP1 indicating the SSID of the mobile router generated by the PC 20 on the image RG1ic indicating the shape of the target area RG1 is the display data 17d. As an example, it is displayed on the display 18a.
- the PC 20 can visually indicate to the system operator that an access point (that is, a mobile router) other than the default is brought into the target area RG1, for example, and can strengthen monitoring of the target area RG1.
- the signal power M1 of the main signal WV1 includes the signal power N1 obtained by adding the signal powers of the radio waves NZ1 to NZ3, which are interference waves, or a stationary wave (which exists constantly in the target area RG1). Noise) is higher than the signal power C1.
- the signal power is shown in units of decibels for easy understanding.
- the signal power M1 of the main signal WV1 shown in FIG. 5 is as the radio wave intensity in the target area RG1 where the measurement antenna device 10 is arranged.
- This is a disturbing wave in which the magnitude of the signal power M1 of the main signal WV1 interferes with the main signal WV1 at the measurement position where the signal power M1 is obtained (that is, the position where the measurement antenna device 10 is constantly disposed). This is because it deteriorates under the influence of the signal power of certain radio waves NZ1 to NZ3.
- the PC 20 has a radio wave environment (for example, SINR) in the target area RG1 from which the signal power M1 of the main signal WV1 is obtained from the magnitude of the signal power M1 of the main signal WV1.
- the signal power pw1 is calculated by subtracting the sum of the radio waves NZ1 to NZ3.
- the signal power pw1 may be obtained by subtracting the average value of the sum of the magnitudes of the radio waves NZ1 to NZ4, which are interference waves at a certain time, from the average value of the signal power M1 of the main signal WV1 at a certain time. Good.
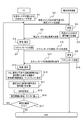
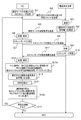
- FIG. 6 is a sequence diagram illustrating an example of an operation procedure related to measurement of the radio wave environment of measurement antenna apparatus 10 and PC 20 configuring radio wave environment display system 100 according to Embodiment 1.
- the measurement antenna device 10 is arranged above the desk of the counter CNT1 of the target area RG1, and the PC 20 receives the radio wave being transmitted in the target area RG1 by the communication unit 19, and is received.
- the result of extracting information on the radio wave intensity, frequency and signal source of the received radio wave is displayed on the display 18a as a radio wave list.
- the PC 20 operates the access point AP1 corresponding to the main signal WV1 that is the object of the measurement mode by operating the system operator using the keyboard 14 or the mouse 15 from the radio wave list displayed on the display 18a.
- the designation of wireless identification information (for example, SSID) is accepted (St1).
- the PC 20 generates a measurement command for the measurement mode for measuring the signal power of the main signal WV1 from the access point AP1 corresponding to the SSID specified in step St1, and uses the generated measurement command as the measurement antenna device 10. (St2).
- the measurement antenna apparatus 10 receives the measurement command transmitted from the PC 20 in step St2 (St3), and is designated by the measurement command as the measurement mode at the arrangement point of the counter CNT1 of the target area RG1 where the apparatus is arranged.
- the radio field intensity (for example, signal power) of the main signal WV1 from the access point AP1 corresponding to the SSID is measured (St4).
- the measurement antenna device 10 transmits the measurement result (first measurement result) of the signal power of the main signal WV1 in the measurement mode in step St4 to the PC 20 (St5).
- the PC 20 receives the first measurement result transmitted from the measurement antenna device 10 in step St5 and stores it in the HDD 17 (St6).
- the PC 20 determines to end the measurement mode and start the scan mode after step St6 (St7).
- the PC 20 generates a scan mode measurement command for measuring the signal power of various radio signals including the main signal WV1 (for example, the main signal WV1 and the radio waves NZ1 to NZ3 shown in FIG. 1),
- the generated measurement command is transmitted to the measurement antenna device 10 (St8).
- the measurement antenna apparatus 10 receives the measurement command transmitted from the PC 20 in step St8 (St9), and is designated by the measurement command as the scan mode at the arrangement point of the counter CNT1 of the target area RG1 where the apparatus is arranged.
- the signal power of all radio signals (for example, the main signal WV1 and the radio waves NZ1 to NZ3 which are interference waves) is measured (St10).
- the measurement antenna device 10 transmits the signal power measurement results (second measurement results) of all the radio signals in the scan mode in step St10 to the PC 20 (St11).
- the PC 20 receives the second measurement result transmitted from the measurement antenna device 10 in step St11 and stores it in the HDD 17 (St12).
- the PC 20 has a frequency that is the same as or close to the frequency (channel) of the main signal WV1 received at step St6 (in other words, a frequency that interferes with the main signal WV1).
- a plurality (for example, 2 to 3) of signal sources that transmit (radiate) wireless signals are selected (St13).
- the PC 20 has a predetermined SSID pre-registered to be usable in the target area RG1 based on the second measurement result.
- information indicating that the SSID of the mobile router has been detected may be displayed on the display 18a (St13).
- the PC 20 may output a warning sound indicating information indicating that a non-default mobile router has been detected from the speaker 18b.
- the PC 20 adds (specifically, adds) the signal powers of the plurality of signal sources selected in step St13 (St14), and in step St6, the signal power of the main signal WV1 stored in the HDD 17 and in step St14.
- the difference from the addition result of the added signal power (that is, SINR shown in FIG. 5) is calculated as the radio wave environment of the target area RG1 in which the measurement antenna device 10 is arranged (St15).
- the PC 20 quantitatively calculates the communication environment of the wireless LAN service in the target area RG1 based on the SINR calculated by the arithmetic processing in step St15, and displays the calculated communication environment on the monitor DP1 (St16, FIG. 4A).
- the PC 20 may display the calculated communication environment on the display 18a.
- step St16 when the user continues to measure SINR of the same main signal WV1 in the target area RG1 (St17, YES), the process of the PC 20 returns to step St2. On the other hand, when the user does not continue the measurement of the SINR of the main signal WV1 in the target area RG1 (St17, NO), the process of FIG. 6 ends.
- the radio wave environment display system 100 includes the measurement antenna device 10 installed in the target area RG1 of the wireless LAN service (an example of a wireless communication service) provided to be freely usable in the airport ARP1. And a PC 20 for analyzing the communication environment of the wireless LAN service using the radio wave intensity of the radio wave received by the measurement antenna device 10.
- the measurement antenna device 10 measures the radio field intensity of the main signal WV1 (an example of the first radio wave) in the target area RG1 transmitted by the wireless LAN service, and includes a plurality of radio waves including the main signal WV1 in the target area RG1. Scan the intensity.
- the PC 20 selects the radio wave intensity of a radio wave (an example of a second radio wave) having a frequency that is the same as or close to the frequency of the main signal WV1 among the plurality of radio waves obtained by scanning.
- the PC 20 calculates the communication environment of the wireless LAN service based on the difference (that is, SINR) between the radio field intensity of the main signal WV1 and the radio field intensity of the selected second radio wave, and displays the communication environment on the monitor DP1.
- the PC 20 exists in the target area RG1 when measuring the radio wave environment of a desired radio wave (main signal WV1) transmitted from the access point AP1 transmitting the target area RG1.
- An accurate radio wave environment (for example, SINR) can be calculated by eliminating the influence of the interference wave.
- the PC 20 can visually present on the monitor DP1 whether or not the latest communication environment of the wireless LAN service provided so as to be freely usable for travelers and the like at airports and stations is good. It is possible to effectively suppress the deterioration of the user's usability for the service.
- the magnitude of the signal power of the main signal WV1 is used as it is as the radio wave environment at the location where the measurement antenna device 10 is disposed in the target area RG1, there is an interference wave that may strongly interfere with the main signal WV1.
- the signal power of the main signal WV1 may be greatly degraded due to the influence of the interference wave. Therefore, even if the signal power of the main signal WV1 is large, if the signal power of the jamming wave is strong, the SINR at that point becomes small, and data transmitted from another wireless communication device (not shown) cannot be demodulated at that point. Therefore, communication quality deteriorates.
- the PC 20 has a wireless communication environment at that point. Whether the user is superior or not can be determined appropriately by the user based on the quantitative communication environment displayed on the monitor DP1.
- the PC 20 displays the communication environment of the wireless LAN service superimposed on an image showing the shape of the target area RG1.
- a traveler or the like in the target area RG1 displays whether the current communication environment for the wireless LAN service in the target area RG1 is good or not in an image that matches the shape of the target area RG1.
- the PC 20 can more visually clearly indicate that the current communication environment of the wireless LAN service is as good as 80% to travelers in the target area RG1, so that the user can use the wireless LAN service. The user convenience can be improved.
- the PC 20 causes the processor 11 to add each of the radio signal strengths of the main signal WV1 and the radio signal strengths of the radio waves NZ1 to NZ3 that are a plurality of interference waves. Based on the difference, the communication environment in the target area RG1 is quantitatively calculated. Thereby, even when there are a plurality of interference waves that may interfere with the main signal WV1 near the counter CNT1 of the target area RG1 where the measurement antenna device 10 is installed, the PC 20 has a signal power of the plurality of interference waves.
- the communication environment of the wireless LAN service can be accurately calculated and displayed in consideration of the above.
- the measurement antenna device 10 has a polyhedral housing in which antennas are arranged on the respective surfaces, and the antennas arranged on the respective surfaces according to the measurement command sent from the PC 20 are connected to the radio field intensity of the main signal WV1. And measurement of the radio field intensity of a plurality of radio waves including the main signal WV1 are alternately used for time division (for example, every minute). As a result, the measurement antenna device 10 can alternately measure the radio field intensity of the main signal WV1 and the radio field intensity of a plurality of radio waves including the main signal WV1 for each predetermined period.
- the measurement antenna device 10 has a polyhedral housing in which antennas are arranged on the respective surfaces, and the antennas arranged on the respective surfaces are connected to at least one surface of the polyhedron with a plurality of radio waves.
- An antenna disposed on the remaining surface of the polyhedron is used for measuring the radio wave environment of the main signal WV1.
- the PC 20 can execute the measurement in the scan mode for measuring various radio waves being transmitted in the target area RG1 including the main signal WV1 between the measurement mode and the synchronization mode. Communication environment can be quickly calculated without the need for measurement.
- the PC 20 detects that there is a radio wave other than the default main signal WV1 in the target area RG1 (that is, a radio wave outside the default (that is, not allowed to be brought in) in the target area RG1, Information indicating that radio waves other than the main signal WV1 exist is output to the display 18a and / or the speaker 18b, whereby the PC 20 brings an access point (that is, a mobile router) other than the default into the target area RG1, for example. This can be clearly shown to the system operator, and the monitoring of the target area RG1 can be strengthened.
- the radio wave environment display according to the first embodiment also in other target areas where the same wireless LAN service as the first embodiment can be used, such as in an airport or a station.
- a system 100 is deployed.
- the PC 20 of the radio wave environment display system 100 arranged in each target area calculates the communication environment in the target area where the device itself is arranged, and is sent from the PC of the radio wave environment display system arranged in another target area.
- the data or information of the communication environment received is displayed on the monitor arranged in the subject area.
- radio wave environment display system 100 according to the second embodiment is the same as that of radio wave environment display system 100 according to the first embodiment. Therefore, the same reference numerals are assigned to the same components to simplify the description or Omitted and different contents will be described.
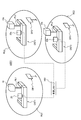
- FIG. 7 is a diagram illustrating an example of a plurality of target areas RG1, RG2, RG3 including counters CNT1, CNT2, CNT3 in an airport where measurement antenna devices 10, 10a, 10b according to Embodiment 2 are respectively installed. . Since the target area RG1 has been described with reference to FIG. 1, description of the same content is simplified or omitted, and different content is described.
- counters CNT ⁇ b> 2 and CNT ⁇ b> 3 where many travelers gather for check-in to the airport ARP ⁇ b> 1 are arranged in the target areas RG ⁇ b> 2 and RG ⁇ b> 3, for example.
- Measurement antenna devices 10a and 10b are supported by poles PL2 and PL3 from the desk surface of counters CNT2 and CNT3, for example, and are always installed.
- PCs 20a and 20b having the same configuration as the PC 20 according to the first embodiment are arranged on the desks of the counters CNT2 and CNT3, respectively.
- the measurement antenna devices 10a and 10b are not limited to be arranged to be supported by the poles PL2 and PL3.
- the measurement antenna devices 10a and 10b are arranged to be suspended from a ceiling surface (not shown) above the counters CNT2 and CNT3 by a string or the like. May be.
- the first radio wave (main signal) is transmitted from the access point AP1 corresponding to a desired wireless LAN service such as WiFi (registered trademark) provided to the traveler and the like in the airport ARP1.
- WV1 is transmitted (radiated).
- the measurement antenna devices 10a and 10b receive the main signal WV1 during the measurement mode, measure the radio field intensity of the main signal WV1 when the main signal WV1 is received, and output it to the corresponding PCs 20a and 20b.
- the measurement antenna devices 10a and 10b receive a plurality of radio waves including the main signal WV1 existing in the target areas RG2 and RG3 in the scan mode, and measure the radio field intensity of the main signal WV1 when receiving each radio wave.
- the PCs 20a and 20b calculate the communication environment of the wireless LAN service in the target areas RG2 and RG3 using the various radio wave intensities from the corresponding measurement antenna devices 10a and 10b, and output them to the monitors DP2 and DP3, respectively.
- the monitors DP2 and DP3 are, for example, large displays arranged in the target area RG1, and are arranged at positions where many travelers can easily touch them.
- the PCs 20, 20a and 20b arranged in the respective target areas RG1 to RG3 generate display data 17d indicating the radio wave intensity calculated in the target area where the own apparatus is arranged and transmit it to other PCs.
- the PCs 20, 20a, and 20b are connected to each other via a wired LAN hub HB1 so that wired communication of data or information is possible.
- the measurement antenna devices 10, 10a, 10b are switched to either the measurement mode or the scan mode according to a mode switching signal (in other words, a measurement command described later) from the corresponding PC 20, 20a, 20b, for example.
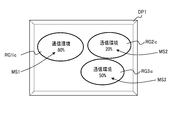
- FIG. 8A is a diagram showing a display example of the calculation result of the communication environment in each of the target areas RG1 to RG3.
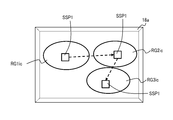
- FIG. 8B is a diagram showing a display example of a notification screen indicating that a non-default access point has been brought into each of the target areas RG1 to RG3.
- FIG. 8A messages MS1, MS2, MS3 of quantitative communication environments (for example, 80%, 20%, 50%) in the target areas RG1, RG2, RG3 calculated by the PCs 20, 20a, 20b, respectively.
- the screen data generated by superimposing the images RG1ic, RG2ic, and RG3ic showing the shapes of the target areas RG1, RG2, and RG3 is displayed on the monitor DP1 as an example of the display data 17d.
- the screen data of FIG. 8A may be displayed on the monitors DP2 and DP3, respectively.
- a traveler or the like in the target areas RG1, RG2, RG3 determines whether the communication environment of the wireless LAN service in the current target areas RG1, RG2, RG3 is good or not. It can be recognized more visually by the screen displayed in the image that matches the shape of.
- the PCs 20, 20a, and 20b have the current communication environment of the wireless LAN service in the target area RG1 as good as 80% and the current communication environment of the wireless LAN service in the target area RG2 as poor as 20%.
- the current communication environment of the wireless LAN service in the target area RG3 is 80%, it can be more visually clearly shown, so that the user can be encouraged to use the wireless LAN service and the user convenience Can be improved.
- the radio wave intensity of a mobile router that is not an access point AP1 having a predetermined SSID registered in advance so as to be usable in each of the target areas RG1, RG2, and RG3 is equal to or higher than a threshold
- PC20, 20a, and 20b Assume that each is judged.
- the icon SSP1 indicating the SSID of the mobile router generated by the PC 20, 20a, 20b is superimposed on the images RG1ic, RG2ic, RG3ic indicating the shapes of the target areas RG1, RG2, RG3.
- the generated screen data is displayed on the display 18a as an example of the display data 17d.
- the PC 20, 20a, 20b may display the time when the radio wave intensity from the mobile router is determined to be greater than or equal to the threshold value in the vicinity of the icon SSP1. Good.
- the PCs 20, 20a, and 20b visually indicate to the system operator that non-default access points (that is, mobile routers) were brought in, for example, in the order of the target area RG1, the target area RG2, and the target area RG3.
- FIG. 9 is a sequence diagram illustrating, in time series, an example of an operation procedure relating to measurement of the radio wave environment of measurement antenna device 10 and PC 20 configuring radio wave environment display system 100 according to Embodiment 2.
- the operation of the measurement antenna device 10 among the measurement antenna devices 10, 10 a, and 10 b and the operation of the PC 20 among the PCs 20, 20 a, and 20 b are illustrated and described, but the other measurement antenna devices 10 a, 10 b, and PC 20 a are illustrated.
- 20b is the same.
- the same process as that of FIG. 6 is assigned the same step number, and the description is simplified or omitted, and different contents will be described.
- the PC 20 has a radio wave intensity from a mobile router that is not an access point AP1 having a predetermined SSID registered in advance so as to be usable in the other target areas RG2 and RG3. If it is determined to be 20b, information (signal source information) regarding the mobile router is received (St13). Using the received information on the mobile router, the PC 20 generates a screen in which the icon SSP1 indicating the SSID of the mobile router is superimposed on the images RG1ic, RG2ic, and RG3ic indicating the shapes of the target areas RG1, RG2, and RG3. 18a (St13, see FIG. 8B).
- the PC 20 quantitatively calculates the communication environment of the wireless LAN service in the target area RG1 based on the SINR calculated by the arithmetic processing in step St15 (St16a).
- the other PCs 20a and 20b quantitatively calculate the communication environment of the wireless LAN service in the target areas RG2 and RG3 based on the SINRs in the other target areas RG2 and RG3, and transmit them to the PC 20.
- the PC 20 receives the communication environment calculation result transmitted from the other PCs 20a and 20b (St16a).
- the PC 20 displays messages MS1, MS2, and MS3 in a quantitative communication environment (for example, 80%, 20%, and 50%) in the target areas RG1, RG2, and RG3, and an image showing the shapes of the target areas RG1, RG2, and RG3.
- a screen superimposed on RG1ic, RG2ic, and RG3ic is generated and displayed on the monitor DP1 (see St16a, FIG. 8A).
- the description of the processing after step St16a is the same as FIG.
- the PC 20 arranged in each target area allows various radio waves (for example, interference) including the main signal WV1 and the main signal WV1 measured in the other target areas.
- the communication environment data or information of the wireless LAN service calculated based on each of the radio field strengths of the radio waves NZ1 to NZ3) is received.
- the PC 20 arranged in each target area has a wireless LAN service communication environment in the target area (for example, the target area RG1) in which the device is arranged, and a wireless LAN service in other target areas (for example, the target areas RG2 and RG3).
- a monitor for example, monitor DP1).
- the PCs 20, 20a, and 20b measure the radio wave environment of a desired radio wave (main signal WV1) transmitted from the access point AP1 that is transmitting through the target areas RG1, RG2, and RG3, respectively, the target areas RG1, RG2 .
- the radio wave environment (for example, SINR) can be accurately calculated by eliminating the influence of the interference wave existing in RG3. Accordingly, the PCs 20, 20a, and 20b visually indicate on the monitors DP1, DP2, and DP3 whether or not the latest communication environment of the wireless LAN service provided so as to be freely usable for travelers at airports and stations is good. Therefore, it is possible to effectively suppress deterioration of user convenience for the wireless LAN service.
- the PC 20, 20a, 20b provides a comprehensive overview of the current communication environment of the wireless LAN service in each of the target areas RG1 to RG3 in the airport ARP1 to a traveler or the like in the target areas RG1, RG2, RG3. Since it can be visually clearly shown, it is possible to prompt the user to use the wireless LAN service and to improve the convenience for the user.
- the present disclosure provides a radio wave environment display system and a radio wave environment that clearly indicate whether or not the communication environment of a wireless communication service in an area provided to be available to a user is favorable, and suppress deterioration of user convenience. It is useful as a display method.
Landscapes
- Engineering & Computer Science (AREA)
- Computer Networks & Wireless Communication (AREA)
- Signal Processing (AREA)
- Physics & Mathematics (AREA)
- Electromagnetism (AREA)
- General Physics & Mathematics (AREA)
- Mobile Radio Communication Systems (AREA)
Abstract
L'invention concerne un système d'affichage d'environnement d'ondes radio qui comprend : une antenne de mesure qui est installée dans une zone de couverture d'un service de communication radio ; et un dispositif d'affichage d'environnement d'ondes radio qui analyse un environnement de communication du service de communication radio à l'aide de l'intensité d'onde radio d'une onde radio reçue par l'antenne de mesure. L'antenne de mesure mesure l'intensité d'onde radio d'une première onde radio transmise par le service de communication radio, et balaye les intensités d'onde radio de multiples ondes radio comprenant la première onde radio dans la zone de couverture. Le dispositif d'affichage d'environnement d'ondes radio sélectionne l'intensité d'onde radio d'une seconde onde radio présentant une fréquence qui est identique ou proche de la fréquence de la première onde radio parmi de multiples ondes radio obtenues par balayage, et sur la base d'une différence entre l'intensité d'onde radio de la première onde radio et l'intensité d'onde radio sélectionnée de la seconde onde radio, calcule et affiche sur une unité d'affichage l'environnement de communication du service de communication radio.
Priority Applications (2)
| Application Number | Priority Date | Filing Date | Title |
|---|---|---|---|
| JP2020513265A JP7008256B2 (ja) | 2018-04-10 | 2019-04-08 | 電波環境表示システムおよび電波環境表示方法 |
| US17/065,732 US11522577B2 (en) | 2018-04-10 | 2020-10-08 | Radio wave environment display system and radio wave environment display method |
Applications Claiming Priority (2)
| Application Number | Priority Date | Filing Date | Title |
|---|---|---|---|
| JP2018075634 | 2018-04-10 | ||
| JP2018-075634 | 2018-04-10 |
Related Child Applications (1)
| Application Number | Title | Priority Date | Filing Date |
|---|---|---|---|
| US17/065,732 Continuation US11522577B2 (en) | 2018-04-10 | 2020-10-08 | Radio wave environment display system and radio wave environment display method |
Publications (1)
| Publication Number | Publication Date |
|---|---|
| WO2019198681A1 true WO2019198681A1 (fr) | 2019-10-17 |
Family
ID=68163110
Family Applications (1)
| Application Number | Title | Priority Date | Filing Date |
|---|---|---|---|
| PCT/JP2019/015366 Ceased WO2019198681A1 (fr) | 2018-04-10 | 2019-04-08 | Système d'affichage d'environnement d'ondes radio et procédé d'affichage d'environnement d'ondes radio |
Country Status (3)
| Country | Link |
|---|---|
| US (1) | US11522577B2 (fr) |
| JP (1) | JP7008256B2 (fr) |
| WO (1) | WO2019198681A1 (fr) |
Citations (5)
| Publication number | Priority date | Publication date | Assignee | Title |
|---|---|---|---|---|
| JP2005080141A (ja) * | 2003-09-03 | 2005-03-24 | Nec Corp | 無線通信システムの運用管理システム及びその方法並びにそれに用いる運用管理装置及びプログラム |
| WO2005117473A1 (fr) * | 2004-05-28 | 2005-12-08 | Matsushita Electric Industrial Co., Ltd. | Station de commande multimodale, système de communications radio, station radio et procédé de commande de communications radio |
| JP2009152976A (ja) * | 2007-12-21 | 2009-07-09 | Canon Inc | 通信装置、通信方法及びプログラム |
| JP2013074305A (ja) * | 2011-09-26 | 2013-04-22 | Nec Corp | 電磁干渉検出装置、電磁干渉検出方法および電磁干渉検出プログラム |
| WO2017134715A1 (fr) * | 2016-02-03 | 2017-08-10 | パナソニックIpマネジメント株式会社 | Dispositif de mesure d'ondes radio |
Family Cites Families (6)
| Publication number | Priority date | Publication date | Assignee | Title |
|---|---|---|---|---|
| WO1994019704A1 (fr) * | 1993-02-26 | 1994-09-01 | Fujitsu Limited | Appareil a mesurer la vitesse de mouvement d'un systeme de communication mobile |
| JP4217043B2 (ja) * | 2002-09-20 | 2009-01-28 | 京セラ株式会社 | アダプティブアレイ無線通信装置、受信レベル表示方法、受信レベル調整方法、受信レベル表示プログラム、および受信レベル調整プログラム |
| JP3779673B2 (ja) * | 2002-10-30 | 2006-05-31 | 株式会社東芝 | 中継装置及び通信システム |
| JP2004325239A (ja) * | 2003-04-24 | 2004-11-18 | Sharp Corp | アンテナゲイン特定装置および無線通信装置 |
| JP4186957B2 (ja) | 2005-06-15 | 2008-11-26 | 日本電気株式会社 | 通信エリアの受信品質測定方法及びその装置並びにプログラム |
| JP2007027902A (ja) | 2005-07-12 | 2007-02-01 | Ntt Docomo Inc | アンテナ装置、電界強度測定システム |
-
2019
- 2019-04-08 WO PCT/JP2019/015366 patent/WO2019198681A1/fr not_active Ceased
- 2019-04-08 JP JP2020513265A patent/JP7008256B2/ja active Active
-
2020
- 2020-10-08 US US17/065,732 patent/US11522577B2/en active Active
Patent Citations (5)
| Publication number | Priority date | Publication date | Assignee | Title |
|---|---|---|---|---|
| JP2005080141A (ja) * | 2003-09-03 | 2005-03-24 | Nec Corp | 無線通信システムの運用管理システム及びその方法並びにそれに用いる運用管理装置及びプログラム |
| WO2005117473A1 (fr) * | 2004-05-28 | 2005-12-08 | Matsushita Electric Industrial Co., Ltd. | Station de commande multimodale, système de communications radio, station radio et procédé de commande de communications radio |
| JP2009152976A (ja) * | 2007-12-21 | 2009-07-09 | Canon Inc | 通信装置、通信方法及びプログラム |
| JP2013074305A (ja) * | 2011-09-26 | 2013-04-22 | Nec Corp | 電磁干渉検出装置、電磁干渉検出方法および電磁干渉検出プログラム |
| WO2017134715A1 (fr) * | 2016-02-03 | 2017-08-10 | パナソニックIpマネジメント株式会社 | Dispositif de mesure d'ondes radio |
Also Published As
| Publication number | Publication date |
|---|---|
| JPWO2019198681A1 (ja) | 2021-03-18 |
| US20210028821A1 (en) | 2021-01-28 |
| JP7008256B2 (ja) | 2022-01-25 |
| US11522577B2 (en) | 2022-12-06 |
Similar Documents
| Publication | Publication Date | Title |
|---|---|---|
| WO2023071931A1 (fr) | Procédé et appareil de traitement de signal de détection et dispositif de communication | |
| WO2023198152A1 (fr) | Procédé et appareil de mesure de détection, et dispositif associé | |
| JP2024523130A (ja) | 無線周波数検知に基づいてデバイスおよび処理設定を制御すること | |
| WO2021088970A1 (fr) | Procédé de réglage d'émission d'un signal de référence de sondage, procédé de configuration d'informations, procédé de positionnement et dispositif associé | |
| WO2021081811A1 (fr) | Procédé de positionnement d'angle, appareil et dispositif | |
| WO2018103584A1 (fr) | Procédé de détermination de cellule, et dispositif et système pertinents | |
| JP2013131898A (ja) | 映像送信装置、映像送信方法およびプログラム | |
| US12219084B2 (en) | Communication apparatus, information processing apparatus, and information processing method to feed back presence of a wireless signal | |
| EP3790307A1 (fr) | Procédé et dispositif de communication | |
| CN113407423A (zh) | 信号强度显示方法和信号强度显示装置 | |
| US10079930B2 (en) | Information processing apparatus, information processing system, and information processing method | |
| WO2019198681A1 (fr) | Système d'affichage d'environnement d'ondes radio et procédé d'affichage d'environnement d'ondes radio | |
| US11353488B2 (en) | Radio wave measurement method | |
| US11463895B2 (en) | Radio wave environment display device and radio wave environment display method | |
| US10382105B2 (en) | Beacon frame transmission using learned beamforming parameters | |
| JP7304549B2 (ja) | 通信装置、通信方法および通信システム | |
| US20260032474A1 (en) | Network measurement device with combined receivers | |
| CN117081637A (zh) | 独立于网络的智能反射表面 | |
| JP2023108229A (ja) | 電波干渉モニター装置、及び電波干渉モニター方法 | |
| US12543050B2 (en) | Control apparatus, communication system, control method and program | |
| EP3327952A1 (fr) | Station de base et procédé | |
| JP2005210656A (ja) | 端末位置の検出方法及び、端末位置検出システム | |
| JP2017017388A (ja) | アンテナ装置 | |
| CN120303888A (zh) | 天线系统、电子可穿戴设备和用于控制天线系统的方法 | |
| WO2022049955A1 (fr) | Système d'estimation de débit, procédé d'estimation de débit et dispositif d'estimation de débit |
Legal Events
| Date | Code | Title | Description |
|---|---|---|---|
| 121 | Ep: the epo has been informed by wipo that ep was designated in this application |
Ref document number: 19784474 Country of ref document: EP Kind code of ref document: A1 |
|
| ENP | Entry into the national phase |
Ref document number: 2020513265 Country of ref document: JP Kind code of ref document: A |
|
| NENP | Non-entry into the national phase |
Ref country code: DE |
|
| 122 | Ep: pct application non-entry in european phase |
Ref document number: 19784474 Country of ref document: EP Kind code of ref document: A1 |