WO2020003673A1 - Procédé de mesure de sensibilité spectrale pour capteurs d'image, procédé d'inspection pour dispositifs de mesure de sensibilité spectrale, et dispositif de mesure de sensibilité spectrale - Google Patents
Procédé de mesure de sensibilité spectrale pour capteurs d'image, procédé d'inspection pour dispositifs de mesure de sensibilité spectrale, et dispositif de mesure de sensibilité spectrale Download PDFInfo
- Publication number
- WO2020003673A1 WO2020003673A1 PCT/JP2019/014410 JP2019014410W WO2020003673A1 WO 2020003673 A1 WO2020003673 A1 WO 2020003673A1 JP 2019014410 W JP2019014410 W JP 2019014410W WO 2020003673 A1 WO2020003673 A1 WO 2020003673A1
- Authority
- WO
- WIPO (PCT)
- Prior art keywords
- spectral sensitivity
- local
- image
- chart
- image sensor
- Prior art date
- Legal status (The legal status is an assumption and is not a legal conclusion. Google has not performed a legal analysis and makes no representation as to the accuracy of the status listed.)
- Ceased
Links
Images







Classifications
-
- G—PHYSICS
- G01—MEASURING; TESTING
- G01J—MEASUREMENT OF INTENSITY, VELOCITY, SPECTRAL CONTENT, POLARISATION, PHASE OR PULSE CHARACTERISTICS OF INFRARED, VISIBLE OR ULTRAVIOLET LIGHT; COLORIMETRY; RADIATION PYROMETRY
- G01J3/00—Spectrometry; Spectrophotometry; Monochromators; Measuring colours
- G01J3/46—Measurement of colour; Colour measuring devices, e.g. colorimeters
- G01J3/52—Measurement of colour; Colour measuring devices, e.g. colorimeters using colour charts
-
- H—ELECTRICITY
- H04—ELECTRIC COMMUNICATION TECHNIQUE
- H04N—PICTORIAL COMMUNICATION, e.g. TELEVISION
- H04N23/00—Cameras or camera modules comprising electronic image sensors; Control thereof
- H04N23/10—Cameras or camera modules comprising electronic image sensors; Control thereof for generating image signals from different wavelengths
- H04N23/12—Cameras or camera modules comprising electronic image sensors; Control thereof for generating image signals from different wavelengths with one sensor only
Definitions
- the present technology relates to a method for measuring a spectral sensitivity of an image sensor, a method for inspecting a spectral sensitivity measuring device, and a spectral sensitivity measuring device, and particularly relates to a spectral sensitivity measuring method for measuring spectral sensitivity when an image sensor is used as a spectroscope, and a spectral sensitivity.
- the present invention relates to an inspection method of a measurement device and a technique of a spectral sensitivity measurement device.
- CMOS Complementary Metal Oxide Semiconductor
- the above-described spectral sensitivity measuring device for measuring the spectral sensitivity irradiates the image sensor while changing the wavelength of the single wavelength light source, and thus has a problem that it takes a long time to measure the spectral sensitivity.
- the present technology has been made in view of such a situation, and a spectral sensitivity measuring method of an image sensor and an inspecting method of a spectral sensitivity measuring device capable of measuring spectral sensitivity without requiring a long time. And a spectral sensitivity measuring device.
- the present inventors have conducted intensive studies to solve the above-mentioned object, and as a result, succeeded in measuring the spectral sensitivity without requiring a long time, and completed the present technology.
- a chart having a plurality of local regions including at least two or more colors is captured for each of the local regions; Based on the captured local region, measuring a pixel value of a local image corresponding to the local region,
- a spectral sensitivity measurement method for an image sensor comprising: measuring a spectral sensitivity of a local image based on a measured pixel value of the local image and a spectral characteristic of the local region.
- the spectral sensitivities are measured, and the spectral sensitivities of the entire surface of the image sensor are calculated from the plurality of spectral sensitivities. It may be.
- the spectral sensitivity measurement method for an image sensor imaging the local region a plurality of times, generating an average image from a plurality of the local images, Measuring the pixel value of the generated average image;
- the average spectral sensitivity of the average image is measured based on the measured pixel values of the average image and the spectral characteristics of the local area, and the average spectral sensitivity over the entire surface of the image sensor is calculated from the plurality of average spectral sensitivities. Calculation may be included.
- the imaging region is changed in one or more color units adjacent to the imaged local region, and the image is repeatedly captured. Is also good.
- the first correction may be performed using a first correction image corresponding to the correction chart to correct luminance unevenness of the chart image.
- the method may also include performing a second correction of removing a fixed pattern noise of a chart image using a second correction image corresponding to the noise removal image based on the captured noise removal image. Good.
- the method for measuring the spectral sensitivity of an image sensor according to the present technology may include irradiating the chart with two or more illumination lights, and imaging the local area based on the reflected light reflected by the irradiation.
- the colors configuring the chart are generated by at least one or more light sources, and the light of the color generated by the light sources is converted to an image sensor that measures spectral sensitivity. Irradiation may be included.
- the chart is formed as a detectable subject, A marker is provided in a part of the chart, After the position of the marker is detected by the image sensor, imaging of the local region may be started.
- the chart may include changing a wavelength continuously and outputting a predetermined wavelength.
- the chart is formed by a transmission chart, The local region is imaged, and the local image is generated at a position facing the local region,
- a backlight light source that irradiates light from the opposite side of the chart where the local image is generated may irradiate an image sensor that measures spectral sensitivity with light.
- the chart is formed by a transmission chart, The local region is imaged, and the local image is generated at a position facing the local region,
- a backlight light source that irradiates light from the opposite side of the chart where the local image is generated may irradiate an image sensor that measures spectral sensitivity with light.
- the chart may include that the two or more colors are arranged in a spatial direction by predetermined repetition.
- an image capturing unit that captures a chart including a plurality of local regions including at least two or more colors by an imaging unit that captures the chart for each local region; Based on the captured local region, measuring a pixel value of a local image corresponding to the local region, Based on the measured pixel value of the local image and the spectral sensitivity of the imaging unit, measuring the spectral characteristics of the local region, Based on a predetermined threshold provided for the measured spectral characteristics, to determine whether the imaging unit is non-defective threshold value, Selecting a spectral sensitivity measuring device including the imaging unit, and providing an inspection method for the spectral sensitivity measuring device.
- an imaging unit that captures a chart having a plurality of local regions including at least two or more colors for each of the local regions
- a pixel value measurement unit that measures a pixel value of a local image corresponding to the local region based on the local region imaged by the imaging unit
- a spectral sensitivity measuring device including: a pixel value of the local image measured by the pixel value measuring unit; and a spectral sensitivity measuring unit that measures spectral sensitivity of the local image based on spectral characteristics of the local region.
- the spectral sensitivity can be measured without requiring a long time.
- the effects of the present technology are not necessarily limited to the above effects, and may be any of the effects described in the present technology.
- FIG. 4 is an explanatory diagram illustrating an example of a spectroscopic measurement method of the image sensor according to the first embodiment to which the present technology is applied.
- FIG. 4 is an explanatory diagram illustrating a configuration of a chart having a plurality of local regions according to the first embodiment to which the present technology is applied.
- 5 is a flowchart illustrating a method for measuring the spectral sensitivity of the image sensor according to the first embodiment to which the present technology is applied.
- 15 is a flowchart illustrating a method for measuring a spectral sensitivity of an image sensor according to a third embodiment to which the present technology is applied.
- FIG. 4 is an explanatory diagram showing a concept when measuring shading correction data.
- FIG. 15 is a flowchart illustrating a method for measuring a spectral sensitivity of an image sensor according to a fourth embodiment to which the present technology is applied.
- FIG. 14 is an explanatory diagram showing a method of measuring the spectral sensitivity of an image sensor by irradiating light to the image sensor as a chart as a method of measuring the spectral sensitivity of the image sensor according to the fifth embodiment of the present technology.
- FIG. 21 is an explanatory diagram showing a plurality of markers formed on a chart as a method for measuring a spectral sensitivity of an image sensor according to a sixth embodiment to which the present technology is applied.
- FIG. 14 is an explanatory diagram showing a method of measuring the spectral sensitivity of an image sensor by irradiating light to the image sensor as a chart as a method of measuring the spectral sensitivity of the image sensor according to the fifth embodiment of the present technology.
- FIG. 21 is an explanatory diagram showing a plurality of markers formed on a chart
- FIG. 21 is an explanatory diagram showing that a plurality of charts emit illumination light on a plurality of charts as a spectral sensitivity measurement method for an image sensor according to a seventh embodiment to which the present technology is applied. It is an explanatory view showing an example of a spectral sensitivity measuring method of irradiating light to an image sensor using a linear variable filter as a spectral sensitivity measuring method of an image sensor of an eighth embodiment to which the present technology is applied.
- FIG. 21 is an explanatory diagram showing an example of a spectral sensitivity measuring method of irradiating light to an image sensor using a backlight light source as a spectral sensitivity measuring method of an image sensor according to a ninth embodiment to which the present technology is applied.
- FIG. 21 is an explanatory diagram showing that a plurality of charts emit illumination light on a plurality of charts as a spectral sensitivity measurement method for an image sensor according to a seventh embodiment to which the present technology is applied. It is an explanatory view showing an
- FIG. 21 is an explanatory diagram showing a chart applicable in the spectral sensitivity measuring method of the image sensor according to the tenth embodiment to which the present technology is applied.
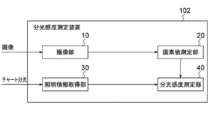
- FIG. 39 shows a functional block diagram of a spectral sensitivity measurement device as an inspection method of the spectral sensitivity measurement device of the eleventh embodiment to which the present technology is applied.
- FIG. 39 is a functional block diagram illustrating an example of a configuration of a spectral sensitivity measurement device according to a twelfth embodiment to which the present technology is applied.
- FIG. 39 is a functional block diagram illustrating an example of a configuration of a spectral sensitivity measurement device according to a thirteenth embodiment to which the present technology is applied.
- FIG. 3 is an explanatory diagram showing an example in which a Macbeth chart is imaged by an image sensor.
- Spectral sensitivity measurement method of ninth embodiment (Example 5 of light source and chart) 11.
- Spectral sensitivity measurement method of the tenth embodiment (example of chart) 12.
- Inspection method of spectral sensitivity measuring device of eleventh embodiment Spectral sensitivity measuring device of twelfth embodiment (first example) 14.
- the present technology relates to a case where an image sensor is used as a spectroscope, and can measure spectral sensitivity without requiring a long time.
- a method using a Fabry-Perot filter or a method using a Plasmonic filter is known.
- the spectral sensitivity of the sensor using the Fabry-Perot filter or the Plasmonic filter also depends on the incident angle. Therefore, when using a Fabry-Perot filter or a Plasmonic filter, it is necessary to measure the spectral sensitivity for each image height in the sensor.
- a method of measuring the spectral sensitivity of the image sensor a method of irradiating the image sensor with a light source having a single wavelength is generally known.
- this method irradiates the image sensor while changing the wavelength of a single wavelength, so that the spectral sensitivity measuring device becomes large, the spectral sensitivity measuring device becomes expensive, and the measurement requires a long time. .
- a method of measuring the spectral sensitivity of an image sensor by imaging a subject For example, a method of measuring a spectral sensitivity by imaging a natural or artificial object as a subject or a method of measuring a spectral sensitivity by imaging a chart for reproducing a color are known.
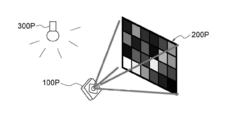
- FIG. 16 shows, as an example of a method of measuring spectral sensitivity, a method of imaging a Macbeth chart in which color samples are arranged in order to reproduce colors.
- FIG. 16 is an explanatory diagram showing an example in which a Macbeth chart is imaged by an image sensor.
- the chart 200P is illuminated by the illumination light of the illumination 300P. Then, the image sensor 100P captures an image of the chart 200P illuminated by the illumination light of the illumination 300P. Thus, FIG. 16 illustrates that the image sensor 100P captures an image of the chart 200P. Thus, the image sensor 100P captures the chart 200P and performs calibration based on the obtained captured image.
- the image sensor 100P could not cope with a change in the spectral sensitivity on the imaging surface of the image sensor 100P even if the calibration was performed based on the captured image.
- the influence of shading by the illumination light of the illumination 300P and the lens was not considered at the time of imaging.
- the spectral sensitivity of the image sensor can be measured with high precision by measuring the spectral sensitivity in consideration of the image height of the imaging surface of the image sensor.
- the spectral sensitivity measuring method for an image sensor includes: capturing a chart having a plurality of local regions including at least two or more colors for each local region; Measuring the pixel value of the local image corresponding to the local region based on the region; and measuring the spectral sensitivity of the local image based on the measured pixel value of the local image and the spectral characteristics of the local region. And a method for measuring the spectral sensitivity of the image sensor.
- the spectral sensitivity measuring device is not expensive and does not require a long time.
- the spectral sensitivity can be measured.
- the chart is an object to be imaged.
- three modes are assumed as modes for configuring the chart. The first is a case where a color sample is formed by applying a light source to the chart to form a color chart. The second is a case where a chart is configured by generating the color of the chart by the light of the light source. Third, the chart is formed by a transmission chart and is configured using a backlight light source.
- FIG. 1 shows an example of a method for measuring the spectral sensitivity of the image sensor according to the first embodiment of the present technology.
- FIG. 1 shows an example in which an image sensor 100 captures an image of a chart 200 illuminated by illumination light 300 as a method for measuring the spectral sensitivity of the image sensor according to the first embodiment.
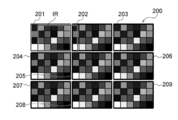
- FIG. 2 shows an example of the configuration of a chart 200 according to the first embodiment of the present technology.
- FIG. 2 is a front view of a chart 200 including a local area 201, a local area 202, a local area 203, a local area 204, a local area 205, a local area 206, a local area 207, a local area 208, and a local area 209, as viewed from the front. It is. Unless otherwise specified, "right” means rightward in FIG. 2, and “down” means downward in FIG.
- the chart 200 includes nine local regions (local region 201, local region 202, local region 203, local region 204, local region 205, local region 206, local region 207, local region 208, and local region 209. )have.
- Each of the local areas 201 to 209 is composed of at least two or more colors.
- each of the local regions 201 to 209 is configured by the same color combination. Note that two or more types mean a sufficient number of colors necessary to reproduce and calibrate colors.
- any one of the nine local regions (local region 201, local region 202, local region 203, local region 204, local region 205, local region 206, local region 207, local region 208, and local region 209) is selected. If there is no need to specify one, the local regions are collectively referred to simply as the local region 210.
- the local region 210 has, for example, 24 colors of 4 rows ⁇ 6 columns. Further, the minimum unit constituting a color is called a patch.
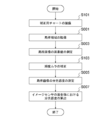
- FIG. 3 shows an example of a flowchart of a method for measuring the spectral sensitivity of the image sensor 100 according to the first embodiment of the present technology.
- FIG. 3 is a flowchart illustrating a method for measuring the spectral sensitivity of the image sensor 100 according to the first embodiment.
- the image sensor 100 captures an image of the chart 200 having a plurality of local regions 210 including at least two or more colors for each local region 210 in accordance with a user operation (step S001).
- the image sensor 100 generates a local image corresponding to the local region 210 by imaging the local region 210.
- the image sensor 100 measures the pixel value of the local image corresponding to the local region 210 based on the captured local region 210 (Step S003). Since the image sensor 100 can perform signal processing on the captured local image, the pixel value of the local image can be measured.
- the image sensor 100 measures the spectral sensitivity of the local image (Step S005).
- the image sensor 100 measures the spectral sensitivity x of the local image based on the measured pixel value b of the local image and the spectral characteristic A of the local region 210 by applying the following equation.
- the pixel value b is a measured pixel value, and is therefore also referred to as an observed pixel value.
- the spectral characteristic A is a known value that can be calculated from the spectral intensity of the illumination 300 and the spectral reflectance of the chart 200.
- the spectral sensitivity x of the local image can be obtained by the least square method when the number of equations is sufficient. However, if the number of equations is smaller than the number of unknowns, there is no solution or a poor setting problem in which a plurality of solutions exist. In this case, the spectral sensitivity x cannot be solved by the least square method, but the spectral sensitivity x can be obtained by, for example, Tikhonov regularization, Wiener estimation, quadratic programming, or the like.
- the number of equations can be increased by increasing the number of colors of the local region 210 to be photographed.
- x 0 is a representative value of the spectral sensitivity
- ⁇ 1 is a covariance matrix of the spectral sensitivity
- the spectral sensitivity X on the entire surface of the image sensor can be calculated from the plurality of spectral sensitivities x (step S007). That is, after imaging the local region 210, the image sensor 100 captures an image of a local region different from the local region 210, measures the spectral sensitivity x, and obtains the spectral sensitivity x from the plurality of spectral sensitivities x over the entire surface of the image sensor. The sensitivity X can be calculated.
- the image sensor 100 can change the imaging region IR in one or more color units (that is, patch units) adjacent to the captured local region 210, and can repeatedly image. Note that a region where the image sensor 100 captures an image is referred to as an imaging region IR (see FIG. 2).
- the image sensor 100 shifts the imaging region IR to the right of the local region 201 by one patch, that is, shifts by one column, after imaging the local region 201.
- the amount of shifting the imaging region IR is not limited to one patch.
- the amount by which the imaging region IR is shifted may be two patches. In this case, the image is shifted by two columns to the right.
- the image sensor 100 can repeatedly perform imaging for each local region 210, for example, when imaging is started from the local region 201, it is possible to capture one patch at a time from the local region 201 to the local region 203. Furthermore, since the image sensor 100 can shift the image downward by one patch at a time, for example, after imaging from the local region 201 to the local region 203, the image sensor 100 shifts the imaging region IR by one patch downward from the local region 201. After shifting, images can be taken one patch at a time in the right direction again.
- the image sensor 100 measures the spectral sensitivities x of a plurality of local images corresponding to the plurality of local regions 210. As a result, the image sensor 100 performs an interpolation process based on the measured spectral sensitivities x of the plurality of local images, and calculates the spectral sensitivity X over the entire surface of the image sensor 100.
- known interpolation processing can be applied to the interpolation processing, and, for example, bilinear interpolation, spline interpolation, or the like can be applied.
- the entire surface of the image sensor 100 refers to the entire surface on which the image sensor 100 receives light. For example, when the image sensor 100 includes a photodiode, it refers to the entire light receiving surface of the photodiode.
- the chart 200 having a plurality of local regions 210 including at least two or more colors is imaged for each local region 210.
- the pixel value b of the local image corresponding to the local region is measured based on the captured local region 210.
- the spectral sensitivity measuring method of the image sensor 100 according to the first embodiment measures the spectral sensitivity x of the local image based on the measured pixel value b of the local image and the spectral characteristic A of the local region.
- the spectral sensitivity X over the entire surface of the image sensor is calculated from the plurality of spectral sensitivities x.
- the spectral sensitivity measuring method of the image sensor 100 according to the first embodiment of the present technology does not need to change the wavelength of the single wavelength light source, and thus measures the spectral sensitivity without requiring a long time. be able to.
- the spectral sensitivity measurement method of the image sensor 100 according to the first embodiment can finely divide the local area 210 of the chart 200 in patch units and measure the spectral characteristics, so that the spectral sensitivity over the entire surface of the image sensor can be measured. Can be measured with high accuracy.
- the spectral sensitivity measurement method for an image sensor captures a local region a plurality of times, generates an average image from the plurality of local images, and calculates a pixel value of the generated average image. Measuring, measuring the average spectral sensitivity of the average image based on the measured pixel values of the average image and the spectral characteristics of the local region, and measuring the average spectral sensitivity over the entire surface of the image sensor from the plurality of average spectral sensitivities. Calculating a sensitivity, which is a method for measuring the spectral sensitivity of the image sensor.
- the image sensor 100 images the local region 210 a plurality of times.
- a plurality of local images can be generated by imaging the same local region 210 a plurality of times. Then, the image sensor 100 generates an average image from the plurality of local images.
- the pixel value of the generated average image can be measured in step S003. Further, in the spectral sensitivity measuring method of the image sensor 100 according to the second embodiment, in step S005, the image sensor 100 performs the measurement based on the measured pixel value b of the average image and the spectral characteristic A of the local region. Measure the average spectral sensitivity of the average image. In the spectral sensitivity measuring method for an image sensor according to the second embodiment, in step S007, the average spectral sensitivity over the entire surface of the image sensor can be calculated from the plurality of average spectral sensitivities.
- the local region 210 is imaged a plurality of times, and an average image is generated from the plurality of local images.
- the pixel value b of the generated average image is measured, and the measured pixel value b of the average image and the spectral characteristic A of the local region are calculated.
- the average spectral sensitivity of the average image is measured. Accordingly, in the method for measuring the spectral sensitivity of the image sensor 100 according to the second embodiment, the average spectral sensitivity over the entire surface of the image sensor can be calculated from the plurality of average spectral sensitivities.
- the spectral sensitivity measuring method of the image sensor according to the third embodiment of the present technology captures a correction chart having a substantially constant spectral reflectance within an imaging surface where an image is captured and uses the correction chart based on the captured correction chart. And correcting the luminance unevenness of the chart image using the first correction image corresponding to the correction chart, and performing the first correction.
- the image sensor 100 in addition to the processing of the flowchart described in the first embodiment, the image sensor 100 further captures a correction chart having a constant spectral reflectance. Measure shading.
- the spectral sensitivity measuring method of the image sensor according to the third embodiment can perform the shading correction as the first correction on the image obtained by imaging the chart 200 (or the local region 210). it can.
- FIG. 4 shows an example of a flowchart in the case where shading correction is performed in the method for measuring the spectral sensitivity of the image sensor 100 according to the third embodiment of the present technology.
- FIG. 4 is a flowchart when shading correction is performed in the spectral sensitivity measurement method of the image sensor 100 according to the first embodiment. Note that the same processes as those in the spectral sensitivity measuring method of the image sensor 100 in FIG. 3 are denoted by the same reference numerals, and description thereof will be omitted as appropriate.
- the image sensor 100 captures an image of a correction chart having a substantially constant spectral reflectance within the imaging surface where the image is captured, and measures shading (step S101).
- the spectral reflectance is substantially constant, for example, when the spectral reflectance of the correction chart is 50%, the spectral reflectance at which the spectral reflectance is changed from 48% to 52% is substantially constant. That is, for example, the range of ⁇ 2% of the spectral reflectance with respect to a predetermined reference value (for example, 50%) can be defined as substantially constant. Further, that the spectral reflectance is constant is assumed to be substantially constant. The reference value of 50% can be set to a desired value.
- the image sensor 100 When the image sensor 100 captures the correction chart, the image sensor 100 obtains shading correction data by applying the following expression indicating the shading correction function s.
- the image sensor 100 captures an image for each local region 210 and generates a local image corresponding to the local region 210 (Step S001).
- the image sensor 100 measures the pixel value b of the local image corresponding to the local area 210 based on the local area 210 (Step S003).
- the image sensor 100 can correct the luminance unevenness by applying the shading correction function s to the pixel value b (step S103).
- the image sensor 100 applies the Tikhonov regularization and calculates the spectral sensitivity x of the sensor in which the luminance unevenness has been corrected by the following equation, similarly to the method of measuring the spectral sensitivity of the image sensor 100 according to the first embodiment. (Step S005).
- ⁇ represents a regularization parameter
- F is a differential matrix composed of a first-order differential equation and a second-order differential equation.
- step S101 the correction chart is imaged once, but the correction chart may be imaged a plurality of times to generate a white average image.
- the image sensor 100 can apply the white average image obtained by imaging the correction chart a plurality of times to the first embodiment of the present technology, as well as to the second embodiment of the present technology. .
- the method of calculating the shading correction data is not limited to the equation (3).
- the image sensor 100 can image the local region 210, evaluate the luminance in the imaging plane based on the value obtained by adding the luminance values of the local image, and use the inverse function as a shading correction function.
- the image sensor 100 can generate data corresponding to the correction chart by imaging the local area 210 using the chart 200.
- FIG. 5 shows a method of measuring shading correction data corresponding to a correction chart.
- FIG. 5 is an explanatory diagram showing the concept when measuring shading correction data.
- FIG. 5A shows that there is a region where the spectral reflectance is substantially constant in a part of each local region 210 of the chart 200.
- the image sensor 100 for example, as a region having a substantially constant spectral reflectance, a white region 201W of the local region 201, a white region 202W of the local region 202, a white region 203W of the local region 203, a white region 204W of the local region 204, and a local region.
- the white region 205W of the region 205, the white region 206W of the local region 206, the white region 207W of the local region 207, the white region 208W of the local region 208, and the white region 209W of the local region 209 are imaged.
- the image sensor 100 can include the nine white regions 201W to 209W of the chart 200 in which the spectral reflectance is substantially constant in the imaging region IR. Then, the image sensor 100 can generate the shading correction data CC shown in FIG. 5B by interpolating the imaging data of the nine white regions 201W to 209W.
- the unevenness of illumination is a low-frequency change
- discrete data can be interpolated with sufficient accuracy.
- the image sensor 100 can generate a luminance image from the captured image data, the image sensor 100 can execute shading correction.
- the spectral sensitivity measuring method for an image sensor includes capturing an image for noise removal in a state where a local region is shielded from light, and performing noise reduction based on the captured image for noise removal.
- a spectral sensitivity measurement method for an image sensor comprising: performing a second correction to remove a fixed pattern noise of a chart image using a second corrected image corresponding to the image.
- the image sensor 100 further generates a noise removal image while shielding the local region 210 from light. Take an image. Accordingly, in the method for measuring the spectral sensitivity of the image sensor according to the fourth embodiment, the second correction is performed using the second correction image corresponding to the noise removal image based on the captured noise removal image. Can be corrected to remove the fixed pattern noise.
- FIG. 6 shows an example of a flowchart in the case where correction for removing fixed pattern noise is performed in the method for measuring the spectral sensitivity of the image sensor 100 according to the fourth embodiment of the present technology.
- FIG. 6 is a flowchart in the case where correction for removing fixed pattern noise is performed in the spectral sensitivity measurement method of the image sensor 100 according to the first embodiment.
- the same processes as those in the method for measuring the spectral sensitivity of the image sensor 100 shown in FIG. 3 are denoted by the same reference numerals, and description thereof will be omitted as appropriate.
- the image sensor 100 captures an image for noise removal in a state where the local region 210 is shielded from light (Step S201).
- the image sensor 100 can measure fixed pattern noise by capturing an image for noise removal.
- the image sensor 100 captures an image for each local region 210 and generates a local image corresponding to the local region 210 (Step S001).
- the image sensor 100 removes the fixed pattern noise for each pixel of the local image corresponding to the local region 210 (Step S203).
- the image sensor 100 measures the pixel value of the local image from which the fixed pattern noise has been removed (Step S003).
- the spectral sensitivity measurement method of the image sensor 100 according to the fourth embodiment of the present technology can remove fixed pattern noise of a local image, so that spectral sensitivity can be measured with high accuracy.
- the spectral sensitivity measuring method of the image sensor 100 of the fourth embodiment according to the present technology can be applied not only to the spectral sensitivity measuring method of the image sensor 100 of the first embodiment, but also to the second embodiment or the third embodiment.
- the present invention can also be applied to the method of measuring the spectral sensitivity of the image sensor 100 according to the embodiment.
- the noise removal image is captured once, but the noise removal image may be captured a plurality of times to generate an average image.
- the image sensor 100 can apply the average image obtained by capturing the noise removal image a plurality of times to the spectral sensitivity measurement method of the image sensor 100 according to the first embodiment of the present technology, and also can use the second image of the present technology.
- the present invention can also be applied to the method for measuring the spectral sensitivity of the image sensor 100 of the embodiment or the third embodiment in a superimposed manner.
- Spectral Sensitivity Measurement Method of Fifth Embodiment (Example 1 of Light Source and Chart)>
- a method for measuring spectral sensitivity of an image sensor wherein the colors constituting the chart are generated by at least one or more light sources, and the chart includes an LED for the image sensor for measuring the spectral sensitivity.
- the chart can irradiate, for example, an LED or a laser beam to the image sensor that measures the spectral sensitivity.
- the spectral sensitivity at that wavelength can be directly measured using a narrow band light source.
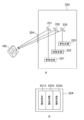
- FIG. 7 shows a method for measuring the spectral sensitivity of the image sensor 100 according to the fifth embodiment of the present technology.
- FIG. 7 is an explanatory diagram showing a method for measuring the spectral sensitivity of the image sensor 100 according to the fifth embodiment of the present technology as a method for measuring the spectral sensitivity of the image sensor 100 according to the fifth embodiment. It is.
- FIG. 7A is an explanatory diagram showing a configuration in which the chart 224 is configured by the light source 220 and irradiates the image sensor 100 with light.
- FIG. 7B is an explanatory diagram showing a configuration example of light emitted by the chart 224.
- the chart 224 is constituted by the light source 220.
- the colors that make up the chart 224 are generated by at least one or more light sources.
- the light source 220 has a blue light source 221, a green light source 222, and a red light source 223.
- the light source 220 includes a first mirror 231, a second mirror 232, and a third mirror 233.
- FIG. 7A illustrates the case where there are three light sources, the number of light sources is not limited to three.
- about ten light sources may be provided. In this case, ultraviolet rays or infrared rays may be included.
- the first mirror 231 reflects the light emitted from the blue light source 221 toward the image sensor 100.
- the second mirror 232 reflects the light emitted from the green light source 222 toward the image sensor 100.
- the third mirror 233 reflects the light emitted from the red light source 223 toward the image sensor 100.
- the chart 224 can irradiate the light of the blue light source 221A, the green light source 222A, and the red light source 223A to the image sensor 100.
- the chart 224 may irradiate the image sensor 100 with an LED or laser light using, for example, a narrow band light source. Therefore, the wavelength can be measured with high accuracy.
- Spectral Sensitivity Measuring Method of Sixth Embodiment (Example 2 of Light Source and Chart)>
- a chart is formed as a detectable subject, a marker is provided in a part of the chart, and the position of the marker is detected by the image sensor. After that, the imaging sensitivity of the image sensor is started, including starting imaging for each local area.
- the image sensor spectral sensitivity measuring method of the sixth embodiment of the present technology when the image sensor 100 detects a marker that is a part of the chart 200, the spectral sensitivity measuring method of the image sensor 100 can be started. it can.
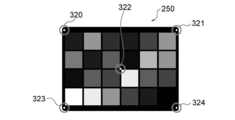
- FIG. 8 illustrates an example in which a marker 320, a marker 321, a marker 322, a marker 323, and a marker 324 are formed on a chart 250 as an example of a method for measuring the spectral sensitivity of the image sensor 100 according to the sixth embodiment of the present technology.
- FIG. 8 is an explanatory diagram showing a chart 250 on which a marker 320, a marker 321, a marker 322, a marker 323, and a marker 324 are formed as a method for measuring the spectral sensitivity of the image sensor 100 according to the sixth embodiment.
- the chart 250 is formed as a detectable subject.
- the chart 250 is provided with five markers 320 to 324.
- the marker 320 illuminates blue as a chart position detecting light source.
- the marker 321 illuminates red as a chart position detecting light source.
- the marker 322 illuminates green as a chart position detecting light source.
- the marker 323 turns on yellow as a chart position detecting light source.
- the marker 324 turns on cyan as a chart position detecting light source.
- the image sensor 100 detects the lit marker
- the position of the lit marker is detected, and the image sensor 100 detects the lit marker. Turn off the marker.
- the image sensor 100 turns off the light source for detecting the chart position of the detected marker and starts imaging for each local region 210. Can be.
- the image sensor 100 can specify the imaging start position, so that the spectral characteristics of the patches in the chart 250 can be prevented from changing.
- the number of markers 320 to 324 is not limited to five, and the number of light sources may be increased as a chart position detecting light source. In this case, the accuracy of marker detection can be improved by increasing the number of light sources.
- the markers 320 to 324 can increase the number of colors of the light source to increase the information detected.
- the markers 320 to 324 are not limited to light sources, and may be objects that can be detected by the image sensor 100.
- the spectral sensitivity measuring method of the image sensor according to the sixth embodiment of the present technology can be applied.
- the method for measuring the spectral sensitivity of an image sensor according to the seventh embodiment of the present technology includes the steps of: irradiating a chart with two or more illuminating lights; and imaging a local area based on the reflected light reflected by the irradiation. This is a method for measuring the spectral sensitivity of the sensor.
- a chart can be irradiated with a plurality of light sources, and the reflected light can be imaged.
- a plurality of charts may be provided, a plurality of charts may be irradiated with illumination light of a plurality of illuminations, and a local region may be imaged based on the reflected light reflected by the irradiation.
- the illumination light may be, for example, an LED or laser light, and the local area may be imaged based on the reflected LED or laser light.
- the illumination light may be a halogen lamp, a xenon lamp, a fluorescent lamp, or the like, and the local area may be imaged based on the reflected halogen lamp, xenon lamp, a fluorescent lamp, or the like.
- FIG. 9 shows a method for measuring the spectral sensitivity of the image sensor according to the seventh embodiment of the present technology.
- FIG. 9 illustrates a chart 200, a chart 241, and a chart 242 in which the illumination 300, the illumination 301, and the illumination 302 irradiate illumination light as a method for measuring the spectral sensitivity of the image sensor according to the seventh embodiment.
- FIG. 9 illustrates a chart 200, a chart 241, and a chart 242 in which the illumination 300, the illumination 301, and the illumination 302 irradiate illumination light as a method for measuring the spectral sensitivity of the image sensor according to the seventh embodiment.
- the illumination light of the illumination 300, the illumination 301, and the illumination 302 can be applied to one chart 200, so that spectral measurement of various wavelengths is performed. Can be.
- the chart 200, the chart 241, and the chart 242 can be irradiated with the illumination light of the illumination 300, the illumination 301, and the illumination 302, the spectral sensitivity of various wavelengths can be further measured.
- the spectral sensitivity measuring method for an image sensor according to the eighth embodiment of the present technology is a method for measuring the spectral sensitivity of an image sensor, in which a chart continuously changes a wavelength and outputs a predetermined wavelength.
- any chart may be used as long as the chart continuously changes the wavelength and outputs a predetermined wavelength. Is also good.
- a predetermined wavelength can be output by using a prism.
- the chart is formed by a transmission chart.
- a transmission chart is an image in which a local area is imaged, a local image is generated at a position facing the local area, and a backlight light source that irradiates light from the opposite side of the chart where the local image is generated measures spectral sensitivity. Irradiates the sensor with light.
- the image sensor can capture light passing through a transmission chart using a backlight light source.
- a glass filter, a linear variable filter, or the like can be used as the transmission chart.
- FIG. 10 shows an example in which the chart 200 is configured by a linear variable filter and irradiates light to the image sensor 100 in the spectral sensitivity measuring method for the image sensor 100 according to the eighth embodiment of the present technology.
- FIG. 10 is an explanatory diagram showing an example of a spectral sensitivity measuring method of irradiating light to the image sensor 100 using the backlight light source 330 as a spectral sensitivity measuring method of the image sensor 100 according to the eighth embodiment.
- “right” means a right direction in FIG. 10
- “down” means a downward direction in FIG. 10.
- the backlight light source 330 includes a backlight 331, a linear variable filter 332, and a glass substrate 333.
- the backlight 331 emits light from the right side of the linear variable filter 332 to an image sensor (not shown) located to the left.
- the backlight 331 irradiates light of various wavelengths to an image sensor (not shown) via a linear variable filter 332 using, for example, a halogen lamp or a xenon lamp as a light source.
- the linear variable filter 332 is a wedge-shaped filter that can continuously change the wavelength and output a predetermined wavelength by moving the incident position of the multilayer filter in the longitudinal direction. Since the linear variable filter 332 has a linearly changing spectral characteristic, the number of colors to be irradiated can be increased.
- the glass substrate 333 is provided on the emission side of the backlight light source 330.
- the glass substrate 333 is provided to protect the linear variable filter 332.
- the number of colors to be irradiated on the image sensor 100 can be increased by the combination of the backlight 331 and the linear variable filter 332, The solution for measuring the spectral sensitivity can be stabilized.
- Spectral Sensitivity Measurement Method of Ninth Embodiment (Example 5 of Light Source and Chart)>
- a chart is formed by a transmission chart, a local area is imaged, a local image is generated at a position facing the local area, and a local image is generated.
- a method for measuring the spectral sensitivity of an image sensor which includes irradiating a backlight light source that irradiates light to an image sensor that measures spectral sensitivity from the opposite side of the chart in which the image sensor is generated.
- the image sensor can capture light passing through a transmission chart using a backlight light source.
- a glass filter can be used as a transmission chart.
- FIG. 11 shows an example in which the chart 200 is formed of a glass filter and irradiates light to the image sensor 100 in the spectral sensitivity measuring method for the image sensor 100 according to the eighth embodiment of the present technology.
- FIG. 11 is an explanatory diagram illustrating an example of a spectral sensitivity measuring method of irradiating light to the image sensor 100 using the backlight light source 340 in the spectral sensitivity measuring method of the image sensor 100 according to the ninth embodiment.
- the same components as those in FIG. 10 are denoted by the same reference numerals, and description thereof will be omitted as appropriate.
- “right” means a rightward direction in FIG. 11
- “down” means a downward direction in FIG.
- the backlight light source 340 includes a backlight 331, a glass filter 334, and a glass substrate 333.
- the backlight 331 irradiates, for example, white light to the glass filter 334 which is the transmission chart 200.
- the backlight 331 is not limited to white light, and irradiates light of various wavelengths to an image sensor (not shown) through a glass filter 334 using, for example, a halogen lamp or a xenon lamp as a light source. May be.
- the glass filter 334 irradiates the color of the chart 200 toward the image sensor 100 by, for example, irradiating white light from the backlight 331. Since the glass filter 334 is illuminated from the backlight 331 to which various light sources can be applied, light having a wavelength corresponding to the various illuminated light sources can be emitted to the image sensor.
- the glass filter 334 may include a plurality of glass filters in a spatial direction.
- the glass filter 334 may be configured by applying one glass filter to one patch constituting a color, and including a plurality of glass filters. In this case, the glass filter 334 may periodically change the transmittance of the glass filter.
- the spatial direction may be defined as a rightward direction and an upward direction when the lower left is used as a reference in the chart 200 of FIG. 2.
- the space direction may include a plane direction.
- the spectral sensitivity measuring method of the image sensor 100 of the ninth embodiment of the present technology since the light transmitted through the backlight 331 using the glass filter 334 can be controlled, the spectral sensitivity is measured. Light can be adjusted.
- a spectral sensitivity measuring method for an image sensor according to a tenth embodiment of the present technology includes a method in which a chart includes two or more colors arranged in a spatial direction by predetermined repetition. It is.
- FIG. 12 shows a chart in which two or more colors are arranged in the spatial direction in the spectral sensitivity measuring method for an image sensor according to the tenth embodiment.
- FIG. 12 is an explanatory diagram showing a chart applicable in the spectral sensitivity measuring method of the image sensor according to the tenth embodiment. Unless otherwise specified, “right” means a right direction in FIG. 12, and “down” means a downward direction in FIG.
- FIG. 12A shows a chart 200A in which the local region 210 has a sufficient number of colors.
- the chart 200A of FIG. 12A two or more colors are arranged in a longitudinal direction and a lateral direction by predetermined repetition. That is, the local areas 210 having a sufficient number of colors are repeatedly arranged in the longitudinal direction and the lateral direction of the chart 200A.
- FIG. 12B shows a chart 200B in which two or more colors are arranged in a concentric radial direction by predetermined repetition. Similarly, in the case of FIG. 12B, there is a sufficient number of colors in the local region forming a part of the chart 200B.
- a local region 210 where a sufficient number of colors exists is located in a rightward direction that is a longitudinal direction or a downward direction that is a lateral direction. Suffices if it is provided repeatedly. Further, the method of measuring the spectral sensitivity of the image sensor according to the tenth embodiment is not limited to this.
- a local region having a sufficient number of colors is concentrically formed in a radial direction. It may be provided repeatedly. In this case, the concentric radial direction is also included in the spatial direction.
- spectral sensitivity measuring method for an image sensor since two or more colors are arranged in a chart in a spatial direction by predetermined repetition, spectral measurement is performed with high accuracy. be able to.
- a chart having a plurality of local regions including at least two or more types of colors is captured by an imaging unit that captures an image for each of the local regions. And measuring the pixel value of the local image corresponding to the local region based on the captured local region, and measuring the pixel value of the local image and the spectral sensitivity of the imaging unit based on the spectral sensitivity of the imaging unit.
- Measuring the spectral characteristics determining a threshold value as to whether or not the imaging unit is non-defective based on a predetermined threshold value provided for the measured spectral characteristics, and selecting a spectral sensitivity measurement device including the imaging unit. And a method for inspecting a spectral sensitivity measurement device.
- the inspection method of the spectral sensitivity measuring device of the eleventh embodiment according to the present technology it is possible to inspect a defective image sensor used as a spectral sensitivity measuring device, and to select an image sensor to be used. it can.
- the spectral sensitivity measuring method described in the first embodiment can be applied as a method for measuring the spectral sensitivity of the imaging unit.
- the spectral sensitivity of the imaging unit is measured by the spectral sensitivity measuring method described in the first embodiment, and the spectral sensitivity is used for the image sensor. Defective product inspection can be performed.
- the spectral sensitivity measurement device may be separate from the image sensor or may be integrated with the image sensor. In the eleventh embodiment, a case where the inspection method of the spectral sensitivity measurement device is integrated with an image sensor will be described.
- FIG. 13 shows an example of an inspection method of the spectral sensitivity measurement device of the eleventh embodiment according to the present technology.
- FIG. 13 is a functional block diagram of a spectral sensitivity measurement device used as an inspection method of the spectral sensitivity measurement device of the eleventh embodiment.
- the spectral sensitivity measuring device 101 includes an imaging unit 10, a pixel value measuring unit 20, an illumination information acquiring unit 30, a spectral sensitivity measuring unit 40, a spectral characteristic measuring unit 41, and a threshold determining unit. 60 and a sorting unit 70.
- the imaging unit 10 captures an image of the chart 200 having a plurality of local regions 210 including at least two or more colors for each of the local regions 210.
- the pixel value measurement unit 20 measures the pixel value b of the local image corresponding to the local region based on the local region 210 captured by the imaging unit 10.
- the illumination information acquisition unit 30 acquires, for example, the spectral intensity of the illumination 300, and acquires the spectral characteristic A of the chart 200 from the acquired spectral intensity of the illumination 300 and the spectral reflectance of the chart 200.
- the spectral reflectance of the chart 200 is a value that can be obtained in advance as known.
- the illumination information acquisition unit 30 may cause the spectral sensitivity measurement device 101 to function as a spectrometer and measure and acquire the spectral characteristic A of the chart 200.
- the characteristics of light obtained by the illumination 300 and the chart 200 are also referred to as chart spectrum.
- the spectral sensitivity measuring unit 40 measures the spectral sensitivity x of the local image based on the pixel value b of the local image measured by the pixel value measuring unit 20 and the spectral characteristic A of the local region 210.
- the spectral sensitivity measurement unit 40 applies the following equation, and based on the pixel value b of the local image measured by the pixel value measurement unit 20 and the spectral characteristic A of the local region 210, the local image Is measured.
- the spectral sensitivity x of the local image is obtained, if the number of equations is sufficient, the spectral sensitivity x can be obtained by the least squares method. However, when the number of equations is smaller than the number of unknowns, a so-called bad setting problem occurs. In this case, the spectral sensitivity x cannot be solved by the least square method, but the spectral sensitivity x can be obtained by, for example, Tikhonov regularization, Wiener estimation, quadratic programming, or the like.
- the spectral sensitivity measuring unit 40 uses a nonparametric estimation method that does not depend on the distribution as shown in the following equation. An approximate solution of can be obtained.
- x 0 is a representative value of the spectral sensitivity
- ⁇ 1 is a covariance matrix of the spectral sensitivity
- the spectral characteristic measurement unit 40 determines the pixel value b of the local image measured by the pixel value measurement unit 20 and the spectral value of the local region 210. Based on the characteristic A, the spectral sensitivity x of the local image is measured.
- the inspection method of the spectral sensitivity measurement device 101 according to the eleventh embodiment can treat the measured spectral sensitivity x of the local image as the known spectral sensitivity x of the imaging unit 10. Further, after imaging the local region 210, the spectral sensitivity measurement device 101 can image a local region different from the local region 210 and measure the spectral sensitivity x.
- the spectral sensitivity measurement unit 40 may calculate the spectral sensitivity X on the entire surface of the image sensor from the plurality of spectral sensitivities x, for example, and use the spectral sensitivity X of the imaging unit 10 as the spectral sensitivity X.
- the spectral characteristic measuring unit 41 measures the spectral characteristic A1 of the local region 210 based on the measured pixel value b of the local image and the spectral sensitivity x of the imaging unit 10.
- the spectral characteristic measuring section 41 can measure the spectral characteristic A1 of the local region 210 captured by the image capturing section 10.
- the threshold determination unit 60 determines whether or not the imaging unit 10 is non-defective based on a predetermined threshold provided for the measured spectral characteristic A1. In this case, since the spectral characteristic A of the local region 210 of the chart 200 is known, it is determined whether or not the spectral characteristic A1 of the local region 210 measured by the spectral characteristic measuring unit 40 is within a predetermined threshold.
- the selection unit 70 selects the spectral sensitivity measurement device 101 including the imaging unit 10 based on the determination result of the threshold determination unit 60.
- the imaging method of imaging the chart 200 having a plurality of local regions 210 including at least two or more colors for each local region 210 An image is taken by the unit 10.
- the inspection method of the spectral sensitivity measurement device 101 according to the eleventh embodiment measures a pixel value b of a local image corresponding to the local region 210 based on the local region 210 captured by the imaging unit 10.
- the inspection method of the spectral sensitivity measuring apparatus 101 according to the eleventh embodiment uses the spectral value of the local region 210 based on the measured pixel value b of the local image 210 and the known spectral sensitivity x of the imaging unit 10.
- the characteristic A1 is measured.
- the inspection method of the spectral sensitivity measurement device 100 determines whether or not the imaging unit 10 that has captured the image is a non-defective product based on the predetermined threshold value provided for the measured spectral characteristic A1,
- the spectral sensitivity measuring device 101 including the imaging unit 10 can be sorted.
- the inspection method of the spectral sensitivity measurement device 101 can determine whether or not the imaging unit 10 is non-defective for each spectral characteristic A1 of the local region 210. Sorting of the spectral sensitivity measuring device 100 including the unit 10 can be performed with high accuracy.
- the spectral sensitivity measuring apparatus is configured such that an imaging unit that captures a chart having a plurality of local regions including at least two or more colors for each local region and an imaging unit that captures the chart. Based on the local region, a pixel value measurement unit that measures the pixel value of the local image corresponding to the local region, the pixel value of the local image measured by the pixel value measurement unit, and based on the spectral characteristics of the local region, A spectral sensitivity measuring unit for measuring the spectral sensitivity of the local image.
- the spectral sensitivity measuring device of the twelfth embodiment of the present technology by using the image sensor as a spectroscope, it is possible to avoid an increase in the size of the spectral sensitivity measuring device.
- the spectral sensitivity measuring device determined to be good in the eleventh embodiment can be used as the spectral sensitivity measuring device.
- the spectral sensitivity measurement device of the twelfth embodiment may be separate from or integral with the image sensor. In the twelfth embodiment, a case will be described in which the spectral sensitivity measurement device is integrated with an image sensor.
- FIG. 14 shows an example of the configuration of the spectral sensitivity measurement device of the eleventh embodiment according to the present technology.
- FIG. 14 is a functional block diagram showing an example of the configuration of the spectral sensitivity measurement device 102 according to the twelfth embodiment.
- the spectral sensitivity measuring device 102 includes the imaging unit 10, the pixel value measuring unit 20, the illumination information acquiring unit 30, and the spectral sensitivity measuring unit 40.
- the imaging unit 10 captures an image of the chart 200 having a plurality of local regions 210 including at least two or more colors for each of the local regions 210.
- the pixel value measurement unit 20 measures the pixel value b of the local image corresponding to the local region based on the local region 210 captured by the imaging unit 10.
- the illumination information acquisition unit 30 acquires, for example, the spectral intensity of the illumination 300, and acquires the spectral characteristic A of the chart 200 from the acquired spectral intensity of the illumination 300 and the spectral reflectance of the chart 200.
- the spectral reflectance of the chart 200 is a value that can be obtained in advance as known.
- the illumination information acquisition unit 30 may cause the spectral sensitivity measurement device 102 to function as a spectrometer and measure and acquire the spectral characteristic A of the chart 200.
- the light obtained by the illumination 300 and the chart 200 is referred to as chart spectrum.
- the spectral sensitivity measuring unit 40 measures the spectral sensitivity x of the local image based on the pixel value b of the local image measured by the pixel value measuring unit 20 and the spectral characteristic A of the local region 210.
- the spectral sensitivity measurement unit 41 applies the following formula, and based on the pixel value b of the local image measured by the pixel value measurement unit 20 and the spectral characteristic A of the local region 210, the local image Is measured.
- the spectral sensitivity x of the local image is obtained, if the number of equations is sufficient, the spectral sensitivity x can be obtained by the least squares method. However, when the number of equations is smaller than the number of unknowns, a so-called bad setting problem occurs. In this case, the spectral sensitivity x cannot be solved by the least square method, but the spectral sensitivity x can be obtained by, for example, Tikhonov regularization, Wiener estimation, quadratic programming, or the like.
- the spectral sensitivity measuring unit 40 uses a nonparametric estimation method that does not depend on the distribution as shown in the following equation. An approximate solution of can be obtained.
- x 0 is a representative value of the spectral sensitivity
- ⁇ 1 is a covariance matrix of the spectral sensitivity
- the spectral sensitivity measurement device 102 uses the local image 210 based on the pixel value b of the local image measured by the pixel value measurement unit 20 and the spectral characteristic A of the local region 210. Is measured.
- the spectral sensitivity measurement unit 40 can perform the interpolation process from the spectral sensitivities x of the plurality of local images corresponding to the plurality of local regions 210, it is also possible to calculate the spectral sensitivity X over the entire surface of the image sensor.
- well-known interpolation processing can be applied to the interpolation processing. For example, for example, bilinear interpolation or spline interpolation can be applied.
- the spectral sensitivity measurement device 102 can measure the spectral sensitivity x by dividing the imaging region into smaller areas than the chart 200, and thus can measure the spectral sensitivity x with high accuracy.
- the spectral sensitivity measurement device 102 is configured so that the imaging unit 10 images a plurality of local regions 210. For example, after imaging the local region 201, the spectral sensitivity measurement device 102 can change the imaging region IR in color units (patch units) adjacent to the local region 210 and repeatedly image.
- the spectral sensitivity measurement device 102 of the image sensor includes the imaging unit 10 that captures the chart 200 having the plurality of local regions 210 for each of the local regions 210 and the imaging unit 10 that captures the chart 200.
- a pixel value measuring unit 20 for measuring a pixel value of a local image corresponding to the local region 210 based on the obtained local region 210; a pixel value b of the local image measured by the pixel value measuring unit 20; And a spectral sensitivity measuring section 40 for measuring the spectral sensitivity x of the local image based on the spectral characteristic A of The spectral sensitivity measurement unit 40 can also calculate the spectral sensitivity X over the entire surface of the image sensor from the plurality of spectral sensitivities x.
- the spectral sensitivity measuring device 102 of the image sensor according to the twelfth embodiment of the present technology can use the image sensor 100 as a spectroscope, so that it is possible to avoid an increase in the size of the spectral sensitivity measuring device. .
- the spectral sensitivity measuring device can perform correction on a captured image, and thus can measure spectral sensitivity with higher accuracy.
- the spectral sensitivity measuring device of the thirteenth embodiment according to the present technology is such that the spectral sensitivity measuring device of the twelfth embodiment according to the present technology further includes a correction unit.
- the same components as those of the spectral sensitivity measuring device of the twelfth embodiment are denoted by the same reference numerals, and description thereof will be omitted as appropriate.
- the spectral sensitivity measurement device of the thirteenth embodiment may be separate from or integrated with the image sensor. In the thirteenth embodiment, a case where the spectral sensitivity measurement device is integrated with an image sensor will be described.
- FIG. 15 shows an example of the configuration of the spectral sensitivity measurement device 103 according to the thirteenth embodiment of the present technology.
- FIG. 15 is a functional block diagram illustrating an example of the configuration of the spectral sensitivity measurement device 103 according to the thirteenth embodiment.
- the spectral sensitivity measuring device 103 according to the thirteenth embodiment is such that the spectral sensitivity measuring device 100 according to the twelfth embodiment further includes a correction unit 50.
- the correction unit 50 includes a first correction unit 51 and a second correction unit 52. Note that the correction unit 50 does not need to include both the first correction unit 51 and the second correction unit 52; for example, at least one of the first correction unit 51 and the second correction unit 52 What is necessary is just to have.
- the first correction section 51 corrects the luminance unevenness of the chart image based on the correction chart, using the first correction image corresponding to the correction chart. Note that the first corrected image is simply referred to as an image in FIG.
- the second correction unit 52 is configured to remove the fixed pattern noise of the chart image using the second correction image corresponding to the noise removal image based on the noise removal image.
- the second corrected image is simply referred to as an image in FIG.
- the imaging unit 10A captures a correction chart whose spectral reflectance is substantially constant within the imaging plane where the image is captured, and measures shading.
- the term “spectral reflectance is substantially constant” means that a chart having a spectral reflectance of 48% to 52% with reference to, for example, 50% of the spectral reflectance of the correction chart is substantially constant. That is, for example, the range of ⁇ 2% of the spectral reflectance with respect to a predetermined reference value (for example, 50%) can be defined as substantially constant. Further, that the spectral reflectance is constant is assumed to be substantially constant. The reference value of 50% can be set to a desired value.
- the imaging unit 10A When the imaging unit 10A captures the correction chart, the imaging unit 10A obtains shading correction data by applying the following expression indicating the shading correction function s.
- the imaging unit 10A captures an image for each local region 210 and generates a local image corresponding to the local region 210.
- the pixel value measurement unit 20A measures the pixel value b of the local image corresponding to the local region 210 based on the local region 210.
- the first correction unit 51 corrects the luminance unevenness by applying the shading correction function s to the pixel value b.
- the spectral sensitivity measuring device 100A can apply the Tikhonov regularization to the spectral sensitivity measuring unit 41 to obtain the spectral sensitivity x of the sensor in which the luminance unevenness has been corrected by the following equation.
- ⁇ represents a regularization parameter
- F is a differential matrix composed of a first-order differential equation and a second-order differential equation.
- the imaging unit 10A captures an image for noise removal in a state where the local region 210 is shielded from light.
- the image for noise removal is not particularly limited because it is captured while being shielded from light.
- the imaging unit 10A captures the noise removal image, and measures the fixed pattern noise using the second corrected image corresponding to the noise removal image based on the captured noise removal image.
- the imaging unit 10A captures an image for each local region 210 and generates a local image corresponding to the local region 210.
- the second correction unit 52 removes fixed pattern noise for each pixel of the local image corresponding to the local area 210.
- the spectral sensitivity measurement device 100A can measure the pixel value b of the local image from which the fixed pattern noise has been removed in the pixel value measurement unit 20A.
- the imaging unit 10A may capture the correction chart and the noise removal image a plurality of times. In this case, the imaging unit 10A images the same local region 210 a plurality of times.
- the imaging unit 10A can generate an average image based on a plurality of imagings.
- the imaging unit 10A can also generate an average image for the correction chart and the noise removal image, respectively.
- the spectral sensitivity measurement apparatus 100A corrects the average image of the local image corresponding to the local region 210 by using the average image of the correction chart and the average image of the noise removal image. Is applied, the average spectral sensitivity X over the entire surface of the image sensor can be calculated from the plurality of average spectral sensitivities x.
- the spectral sensitivity measurement device of the thirteenth embodiment of the present technology since it is possible to perform correction on a captured image, it is possible to measure spectral sensitivity with higher accuracy.
- the image sensor 100 is configured to repeatedly image the local area 210 to be imaged by shifting one patch.
- the image sensor 100 may perform the process of shifting the local region 210 by shifting the imaging region IR inside the image sensor 100, or the image sensor 100 itself or the chart 200 itself may be moved.
- the present technology can have the following configurations. [1] imaging a chart having a plurality of local regions composed of at least two or more colors for each of the local regions; Based on the captured local region, measuring a pixel value of a local image corresponding to the local region, Based on the measured pixel values of the local image and the spectral characteristics of the local region, measuring the spectral sensitivity of the local image, And a method for measuring the spectral sensitivity of the image sensor. [2] After capturing the local region, capturing a local region different from the local region, measuring the spectral sensitivities, and calculating spectral sensitivities on the entire surface of the image sensor from a plurality of the spectral sensitivities.
- the method for measuring the spectral sensitivity of an image sensor comprising: [3] imaging the local region a plurality of times and generating an average image from the plurality of local images; Measuring the pixel value of the generated average image; The average spectral sensitivity of the average image is measured based on the measured pixel values of the average image and the spectral characteristics of the local region, and the average spectral sensitivity over the entire surface of the image sensor is measured from a plurality of the average spectral sensitivities.
- the spectral sensitivity measuring method for an image sensor according to [1] or [2], comprising: [4] Any of the above-mentioned [1] to [3], including, after the local region is imaged, changing the imaging region in one or more colors adjacent to the imaged local region and repeatedly imaging.
- [6] capturing an image for noise removal in a state where the local region is shielded from light, Based on the captured noise removal image, using a second correction image corresponding to the noise removal image, removing a fixed pattern noise of the chart image, and performing a second correction.
- the illumination light is LED or laser light
- the colors constituting the chart are generated by at least one or more light sources, The method for measuring the spectral sensitivity of an image sensor according to any one of [1] to [8], including irradiating light of a color generated by the light source to an image sensor for measuring spectral sensitivity.
- the chart is formed as a detectable subject, A marker is provided in a part of the chart, The spectral sensitivity measurement of the image sensor according to any one of [1] to [9], including starting imaging of each of the local regions after the position of the marker is detected by the image sensor.
- Method. [11] The spectral sensitivity measuring method for an image sensor according to any one of [1] to [10], wherein the chart includes continuously changing a wavelength and outputting a predetermined wavelength.
- the chart is formed into a transmission chart, The local region is imaged, and the local image is generated at a position facing the local region,
- the chart is formed into a transmission chart, The local region is imaged, and the local image is generated at a position facing the local region, Any one of the above [1] to [11], including: from the opposite side of the chart where the local image is generated, a backlight light source that emits light emits light to an image sensor that measures spectral sensitivity. 5.
Landscapes
- Physics & Mathematics (AREA)
- Spectroscopy & Molecular Physics (AREA)
- Engineering & Computer Science (AREA)
- Multimedia (AREA)
- Signal Processing (AREA)
- General Physics & Mathematics (AREA)
- Spectrometry And Color Measurement (AREA)
- Color Television Image Signal Generators (AREA)
Abstract
Afin de mesurer la sensibilité spectrale sans nécessiter beaucoup de temps, l'invention concerne un procédé de mesure de sensibilité spectrale pour des capteurs d'image qui comprend : la capture d'images d'un graphique comprenant une pluralité de zones locales comprenant au moins deux couleurs, la capture de celles-ci pour chaque zone locale ; la mesure des valeurs de pixel pour une image locale correspondant aux zones locales, sur la base des zones locales capturées ; et la mesure de la sensibilité spectrale des images locales sur la base des valeurs de pixel mesurées pour les images locales et sur la base des caractéristiques spectrales des zones locales.
Applications Claiming Priority (2)
| Application Number | Priority Date | Filing Date | Title |
|---|---|---|---|
| JP2018120713A JP2020005053A (ja) | 2018-06-26 | 2018-06-26 | イメージセンサの分光感度測定方法、分光感度測定装置の検査方法及び分光感度測定装置 |
| JP2018-120713 | 2018-06-26 |
Publications (1)
| Publication Number | Publication Date |
|---|---|
| WO2020003673A1 true WO2020003673A1 (fr) | 2020-01-02 |
Family
ID=68986996
Family Applications (1)
| Application Number | Title | Priority Date | Filing Date |
|---|---|---|---|
| PCT/JP2019/014410 Ceased WO2020003673A1 (fr) | 2018-06-26 | 2019-04-01 | Procédé de mesure de sensibilité spectrale pour capteurs d'image, procédé d'inspection pour dispositifs de mesure de sensibilité spectrale, et dispositif de mesure de sensibilité spectrale |
Country Status (2)
| Country | Link |
|---|---|
| JP (1) | JP2020005053A (fr) |
| WO (1) | WO2020003673A1 (fr) |
Cited By (1)
| Publication number | Priority date | Publication date | Assignee | Title |
|---|---|---|---|---|
| EP4398591A4 (fr) * | 2021-09-03 | 2025-01-22 | Sony Semiconductor Solutions Corporation | Dispositif de mesure de sensibilité spectrale et procédé de mesure de sensibilité spectrale |
Families Citing this family (1)
| Publication number | Priority date | Publication date | Assignee | Title |
|---|---|---|---|---|
| JP2022117205A (ja) | 2021-01-29 | 2022-08-10 | ソニーセミコンダクタソリューションズ株式会社 | 情報処理装置、撮像システム、情報処理方法及びプログラム |
Citations (3)
| Publication number | Priority date | Publication date | Assignee | Title |
|---|---|---|---|---|
| JP2009141684A (ja) * | 2007-12-06 | 2009-06-25 | Olympus Corp | 色変換係数算出装置、色変換係数算出プログラム、色変換係数算出方法 |
| JP2012010276A (ja) * | 2010-06-28 | 2012-01-12 | Sony Corp | 画像処理装置、画像処理方法及び画像処理プログラム |
| JP2016052112A (ja) * | 2014-08-28 | 2016-04-11 | 株式会社東芝 | 固体撮像装置のテスト装置及びテスト方法 |
-
2018
- 2018-06-26 JP JP2018120713A patent/JP2020005053A/ja active Pending
-
2019
- 2019-04-01 WO PCT/JP2019/014410 patent/WO2020003673A1/fr not_active Ceased
Patent Citations (3)
| Publication number | Priority date | Publication date | Assignee | Title |
|---|---|---|---|---|
| JP2009141684A (ja) * | 2007-12-06 | 2009-06-25 | Olympus Corp | 色変換係数算出装置、色変換係数算出プログラム、色変換係数算出方法 |
| JP2012010276A (ja) * | 2010-06-28 | 2012-01-12 | Sony Corp | 画像処理装置、画像処理方法及び画像処理プログラム |
| JP2016052112A (ja) * | 2014-08-28 | 2016-04-11 | 株式会社東芝 | 固体撮像装置のテスト装置及びテスト方法 |
Cited By (2)
| Publication number | Priority date | Publication date | Assignee | Title |
|---|---|---|---|---|
| EP4398591A4 (fr) * | 2021-09-03 | 2025-01-22 | Sony Semiconductor Solutions Corporation | Dispositif de mesure de sensibilité spectrale et procédé de mesure de sensibilité spectrale |
| US12516977B2 (en) | 2021-09-03 | 2026-01-06 | Sony Semiconductor Solutions Corporation | Spectral sensitivity measuring device and spectral sensitivity measuring method |
Also Published As
| Publication number | Publication date |
|---|---|
| JP2020005053A (ja) | 2020-01-09 |
Similar Documents
| Publication | Publication Date | Title |
|---|---|---|
| JP7200204B2 (ja) | 多重組織検定用の撮像デバイスまたはシステムを較正、構成、および有効性判断するためのシステムおよび方法 | |
| JP6816572B2 (ja) | 色測定装置、色測定方法及びプログラム | |
| JP6676398B2 (ja) | ディスプレイ検査のための測色システム | |
| JP7629437B2 (ja) | 撮像ユニット及び測定装置 | |
| JP2016510408A5 (fr) | ||
| JP5412694B2 (ja) | 光源測定法および光源測定システム | |
| JP2010127739A (ja) | 分光感度特性測定装置および分光感度特性測定方法 | |
| JP2015178995A (ja) | 色調校正装置、撮像装置及び色調検査装置 | |
| WO2020003673A1 (fr) | Procédé de mesure de sensibilité spectrale pour capteurs d'image, procédé d'inspection pour dispositifs de mesure de sensibilité spectrale, et dispositif de mesure de sensibilité spectrale | |
| JP4904377B2 (ja) | ハイパースペクトル画像処理装置及びハイパースペクトル画像処理方法 | |
| WO2017026296A1 (fr) | Appareil de mesure d'échantillon | |
| JP7823065B2 (ja) | 分光感度測定装置及び分光感度測定方法 | |
| JP7491084B2 (ja) | 校正装置、校正方法、校正プログラム、分光カメラ、及び情報処理装置 | |
| US20240240933A1 (en) | Film thickness measurement device and film thickness measurement method | |
| CN100543572C (zh) | 成像系统,成像器件分析系统,成像器件分析方法,和光束发射方法 | |
| KR102022836B1 (ko) | 광 측정 장치, 시스템 및 방법 | |
| JP2005195365A (ja) | 白色校正方法及び2次元測光装置 | |
| JP2022177441A (ja) | 分光計測器、及びコンピュータープログラム |
Legal Events
| Date | Code | Title | Description |
|---|---|---|---|
| 121 | Ep: the epo has been informed by wipo that ep was designated in this application |
Ref document number: 19827259 Country of ref document: EP Kind code of ref document: A1 |
|
| NENP | Non-entry into the national phase |
Ref country code: DE |
|
| 122 | Ep: pct application non-entry in european phase |
Ref document number: 19827259 Country of ref document: EP Kind code of ref document: A1 |