WO2020066052A1 - 監視システム及び監視方法 - Google Patents
監視システム及び監視方法 Download PDFInfo
- Publication number
- WO2020066052A1 WO2020066052A1 PCT/JP2019/004735 JP2019004735W WO2020066052A1 WO 2020066052 A1 WO2020066052 A1 WO 2020066052A1 JP 2019004735 W JP2019004735 W JP 2019004735W WO 2020066052 A1 WO2020066052 A1 WO 2020066052A1
- Authority
- WO
- WIPO (PCT)
- Prior art keywords
- node
- monitored
- structure model
- value
- monitoring system
- Prior art date
- Legal status (The legal status is an assumption and is not a legal conclusion. Google has not performed a legal analysis and makes no representation as to the accuracy of the status listed.)
- Ceased
Links
Images









Classifications
-
- G—PHYSICS
- G05—CONTROLLING; REGULATING
- G05B—CONTROL OR REGULATING SYSTEMS IN GENERAL; FUNCTIONAL ELEMENTS OF SUCH SYSTEMS; MONITORING OR TESTING ARRANGEMENTS FOR SUCH SYSTEMS OR ELEMENTS
- G05B23/00—Testing or monitoring of control systems or parts thereof
- G05B23/02—Electric testing or monitoring
- G05B23/0205—Electric testing or monitoring by means of a monitoring system capable of detecting and responding to faults
- G05B23/0208—Electric testing or monitoring by means of a monitoring system capable of detecting and responding to faults characterized by the configuration of the monitoring system
- G05B23/021—Electric testing or monitoring by means of a monitoring system capable of detecting and responding to faults characterized by the configuration of the monitoring system adopting a different treatment of each operating region or a different mode of the monitored system, e.g. transient modes; different operating configurations of monitored system
-
- G—PHYSICS
- G05—CONTROLLING; REGULATING
- G05B—CONTROL OR REGULATING SYSTEMS IN GENERAL; FUNCTIONAL ELEMENTS OF SUCH SYSTEMS; MONITORING OR TESTING ARRANGEMENTS FOR SUCH SYSTEMS OR ELEMENTS
- G05B23/00—Testing or monitoring of control systems or parts thereof
- G05B23/02—Electric testing or monitoring
- G05B23/0205—Electric testing or monitoring by means of a monitoring system capable of detecting and responding to faults
- G05B23/0218—Electric testing or monitoring by means of a monitoring system capable of detecting and responding to faults characterised by the fault detection method dealing with either existing or incipient faults
- G05B23/0243—Electric testing or monitoring by means of a monitoring system capable of detecting and responding to faults characterised by the fault detection method dealing with either existing or incipient faults model based detection method, e.g. first-principles knowledge model
- G05B23/0245—Electric testing or monitoring by means of a monitoring system capable of detecting and responding to faults characterised by the fault detection method dealing with either existing or incipient faults model based detection method, e.g. first-principles knowledge model based on a qualitative model, e.g. rule based; if-then decisions
- G05B23/0248—Causal models, e.g. fault tree; digraphs; qualitative physics
-
- G—PHYSICS
- G05—CONTROLLING; REGULATING
- G05B—CONTROL OR REGULATING SYSTEMS IN GENERAL; FUNCTIONAL ELEMENTS OF SUCH SYSTEMS; MONITORING OR TESTING ARRANGEMENTS FOR SUCH SYSTEMS OR ELEMENTS
- G05B23/00—Testing or monitoring of control systems or parts thereof
- G05B23/02—Electric testing or monitoring
- G05B23/0205—Electric testing or monitoring by means of a monitoring system capable of detecting and responding to faults
- G05B23/0259—Electric testing or monitoring by means of a monitoring system capable of detecting and responding to faults characterized by the response to fault detection
- G05B23/0275—Fault isolation and identification, e.g. classify fault; estimate cause or root of failure
- G05B23/0281—Quantitative, e.g. mathematical distance; Clustering; Neural networks; Statistical analysis
-
- G—PHYSICS
- G06—COMPUTING OR CALCULATING; COUNTING
- G06N—COMPUTING ARRANGEMENTS BASED ON SPECIFIC COMPUTATIONAL MODELS
- G06N20/00—Machine learning
-
- G—PHYSICS
- G06—COMPUTING OR CALCULATING; COUNTING
- G06Q—INFORMATION AND COMMUNICATION TECHNOLOGY [ICT] SPECIALLY ADAPTED FOR ADMINISTRATIVE, COMMERCIAL, FINANCIAL, MANAGERIAL OR SUPERVISORY PURPOSES; SYSTEMS OR METHODS SPECIALLY ADAPTED FOR ADMINISTRATIVE, COMMERCIAL, FINANCIAL, MANAGERIAL OR SUPERVISORY PURPOSES, NOT OTHERWISE PROVIDED FOR
- G06Q10/00—Administration; Management
- G06Q10/06—Resources, workflows, human or project management; Enterprise or organisation planning; Enterprise or organisation modelling
-
- G—PHYSICS
- G06—COMPUTING OR CALCULATING; COUNTING
- G06Q—INFORMATION AND COMMUNICATION TECHNOLOGY [ICT] SPECIALLY ADAPTED FOR ADMINISTRATIVE, COMMERCIAL, FINANCIAL, MANAGERIAL OR SUPERVISORY PURPOSES; SYSTEMS OR METHODS SPECIALLY ADAPTED FOR ADMINISTRATIVE, COMMERCIAL, FINANCIAL, MANAGERIAL OR SUPERVISORY PURPOSES, NOT OTHERWISE PROVIDED FOR
- G06Q10/00—Administration; Management
- G06Q10/20—Administration of product repair or maintenance
-
- G—PHYSICS
- G06—COMPUTING OR CALCULATING; COUNTING
- G06Q—INFORMATION AND COMMUNICATION TECHNOLOGY [ICT] SPECIALLY ADAPTED FOR ADMINISTRATIVE, COMMERCIAL, FINANCIAL, MANAGERIAL OR SUPERVISORY PURPOSES; SYSTEMS OR METHODS SPECIALLY ADAPTED FOR ADMINISTRATIVE, COMMERCIAL, FINANCIAL, MANAGERIAL OR SUPERVISORY PURPOSES, NOT OTHERWISE PROVIDED FOR
- G06Q50/00—Information and communication technology [ICT] specially adapted for implementation of business processes of specific business sectors, e.g. utilities or tourism
- G06Q50/10—Services
- G06Q50/26—Government or public services
-
- G—PHYSICS
- G06—COMPUTING OR CALCULATING; COUNTING
- G06Q—INFORMATION AND COMMUNICATION TECHNOLOGY [ICT] SPECIALLY ADAPTED FOR ADMINISTRATIVE, COMMERCIAL, FINANCIAL, MANAGERIAL OR SUPERVISORY PURPOSES; SYSTEMS OR METHODS SPECIALLY ADAPTED FOR ADMINISTRATIVE, COMMERCIAL, FINANCIAL, MANAGERIAL OR SUPERVISORY PURPOSES, NOT OTHERWISE PROVIDED FOR
- G06Q50/00—Information and communication technology [ICT] specially adapted for implementation of business processes of specific business sectors, e.g. utilities or tourism
- G06Q50/40—Business processes related to the transportation industry
-
- G—PHYSICS
- G05—CONTROLLING; REGULATING
- G05B—CONTROL OR REGULATING SYSTEMS IN GENERAL; FUNCTIONAL ELEMENTS OF SUCH SYSTEMS; MONITORING OR TESTING ARRANGEMENTS FOR SUCH SYSTEMS OR ELEMENTS
- G05B15/00—Systems controlled by a computer
- G05B15/02—Systems controlled by a computer electric
-
- G—PHYSICS
- G05—CONTROLLING; REGULATING
- G05B—CONTROL OR REGULATING SYSTEMS IN GENERAL; FUNCTIONAL ELEMENTS OF SUCH SYSTEMS; MONITORING OR TESTING ARRANGEMENTS FOR SUCH SYSTEMS OR ELEMENTS
- G05B23/00—Testing or monitoring of control systems or parts thereof
- G05B23/02—Electric testing or monitoring
- G05B23/0205—Electric testing or monitoring by means of a monitoring system capable of detecting and responding to faults
- G05B23/0259—Electric testing or monitoring by means of a monitoring system capable of detecting and responding to faults characterized by the response to fault detection
- G05B23/0283—Predictive maintenance, e.g. involving the monitoring of a system and, based on the monitoring results, taking decisions on the maintenance schedule of the monitored system; Estimating remaining useful life [RUL]
Definitions
- the present invention relates to a monitoring system and a monitoring method.
- the business management system for social infrastructure such as railway, water and sewage, and urban transportation is composed of multiple subsystems.
- a railway operation management system is composed of 100 or more subsystems.
- Such social infrastructure requires continuous business improvement. For example, when focusing on railway maintenance, while maintenance costs tend to increase with the aging of facilities, a decrease in transportation income due to a declining population is expected. Therefore, there is a need for a plan for business improvement that reduces maintenance costs without compromising transportation safety.
- Predictive maintenance is one of the best solutions to reduce maintenance costs. The most important function of predictive maintenance is to estimate what causes the errors, where they occur, and what solutions are possible to prevent problems from occurring.
- Patent Document 1 One way to estimate the causality of the system. For example, it is disclosed in Patent Document 1. Alternatively, another solution for estimating the causal relationship between an error and a running log is disclosed in US Pat. Further, a technique for predicting a potential problem by deep learning is disclosed in Patent Document 3.
- One embodiment of the present invention is a monitoring system that monitors a monitoring target system, including one or more storage devices that store a program, and one or more processors that operate according to the program. Determining an estimated value of a target variable to be monitored of the monitored system based on measurement data included in the inspection data of the monitored system and a causal structure model of the monitored system; It is determined whether an abnormality has occurred in the monitored system based on a comparison result between the measured value of the target variable and the estimated value.
- the cause of a system abnormality can be quickly and accurately estimated.
- 1 schematically illustrates an outline of a process performed by a remote monitoring system according to the present disclosure.
- 1 shows a configuration example of a remote monitoring system.
- An example of a hardware configuration of a computer is schematically shown.
- 2 shows an example of a software configuration of a causal structure model estimation device.
- 3 shows an example of a software configuration of a model management device.
- 3 shows an example of a software configuration of an inspection data deviation determination device.
- 2 shows a configuration example of a test data database. It is a flowchart of the process by an objective variable value estimation program. It is a flowchart of the process by a deviation determination program.
- 4 shows an example of a monitoring image of a monitoring target. 13 shows an image example when a model check button is selected by a user in a monitoring image.
- FIG. 5 shows an example of an image when a button is selected by a user in a monitoring image.
- An example of a method of estimating a node causing an abnormality is schematically shown. It is a flowchart of an abnormal cause node estimation method. An example of a method of estimating a node causing an abnormality is schematically shown. It is a flowchart of an abnormal cause node estimation method. It is a flowchart of the causal structure model estimation by a causal structure model estimation program. This shows how the estimated number of nodes of the causal structure model increases as the learning progresses. 4 shows a flowchart of a process in which a causal structure model estimation program determines a learning period.
- 4 is a graph illustrating a relationship between a temporal change in estimation accuracy and a threshold, for explaining an outline of a threshold setting method.
- 5 shows a flowchart of setting an initial threshold value by a deviation determination program.
- 5 shows a flowchart of threshold update by the deviation determination program. It is a figure explaining estimation of a causal structure model for every operation state of a monitored system.
- 3 shows a configuration example of a learning data database. 9 shows learning data of an operation state. The relationship between the operation state change and the estimation accuracy is schematically shown.
- 4 shows a configuration example of a learning data database that stores learning data for estimating a causal structure model capable of predicting a temporal change of a target variable to be monitored.
- 5 shows an example of a causal structure model capable of predicting a temporal change of a target variable to be monitored.
- 7 shows a display example of a predicted value of an objective variable by a causal structure model.
- 4 shows an example of a monitoring image. An example of a warning message is shown. 4 shows an input image of a maintenance record.
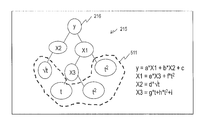
- FIG. 1 schematically shows an outline of processing by the remote monitoring system of the present disclosure.
- the remote monitoring system estimates the causal structure model 215 from the learning data 150 (S11).
- the causal structure model 215 is a model having a directional graph structure indicating a causal relationship between data on the monitored system.
- the causal structure model 215 can be represented by a causal loop diagram (CLD).
- CLD causal loop diagram
- the causal structure model 215 is also called a CLD model.
- the source node of the edge is the cause node (explanatory variable node), and the destination node of the edge is the result node (target variable node).
- the cause node represents an objective variable
- the cause node represents an explanatory variable.
- the variable of the result node is represented by a regression equation of the variable of the cause node. Each term in the regression equation is linear (first order) or non-linear (greater than first order). If explanatory variables are X1, X2, X3, objective variable Y is, for example, aX1 * X2 + bX1 * X3 + cX2 * X3 , or the formula of such aX1 + bx2 + cX3 2.
- a, b, and c are coefficients.
- the causal structure model 215 has a hierarchical structure.
- the cause node (explanatory variable) of the upper result node (object variable) is the result node (object variable) of the lower cause node (explanatory variable).
- a top node 216 following a node according to a directional edge indicates a monitored target variable.
- the remote monitoring system inputs the inspection data 170 of the monitoring target system into the estimated (generated) causal structure model 215, and acquires the estimated value of the monitoring target variable (S12).
- the inspection data 170 is, for example, real-time data, and includes data indicating the current state and status of the monitored system.
- the remote monitoring system compares the estimated value of the target variable to be monitored by the causal structure model 215 with the actually measured value of the target variable to be monitored included in the inspection data 170, and determines the degree of deviation therebetween.
- the remote monitoring system determines whether an abnormality has occurred in the monitored system based on the calculated divergence (S13).
- the causal structure model 215 to which the inspection data 170 has been input searches for a node that causes the abnormality.
- the causal structure model 215 has a directional graph structure indicating the relationship between the cause and the result, and the remote monitoring system can efficiently estimate the potential cause of the abnormality with high accuracy.
- the estimation of the causal structure model may be omitted. By estimating the causal structure model from the learning data, it is not necessary to prepare an appropriate causal structure model in advance.
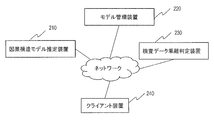
- FIG. 2 schematically illustrates a configuration example of the remote monitoring system.
- the remote monitoring system includes a causal structure model estimation device 210, a model management device 220, a test data deviation determination device 230, and a client device 240, which communicate with each other via a network.
- the network is, for example, a local area network (LAN) or a wide area network (WAN).
- the causal structure model estimating device 210, the model management device 220, the test data divergence determining device 230, and the client device 240 can each be composed of, for example, one or more computers. In addition, a plurality of devices may be realized by one computer.
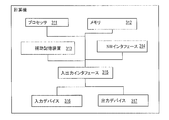
- FIG. 3 schematically shows an example of a hardware configuration of a computer.
- the computer includes one or more storage devices that store the program and one or more processors that operate according to the program.
- the computer includes a processor 311, a memory 312, an auxiliary storage device 313, a network interface 314, an input / output interface 315, an input device 316, and an output device 317. These components are connected to each other by a bus.
- the memory 312, the auxiliary storage device 313, or a combination thereof is a storage device and includes a storage medium for storing software.
- the memory 312 is composed of, for example, a semiconductor memory, and is mainly used for temporarily storing programs and data.
- the processor 311 performs various processes according to a program stored in the memory 312. Various functional units are realized by the processor 311 operating according to the program.
- the auxiliary storage device 313 is composed of a large-capacity storage device such as a hard disk drive or a solid state drive, and is used for holding programs and data for a long period of time.
- the programs and data stored in the auxiliary storage device 313 are loaded into the memory 312 at the time of activation or when necessary, and various processes of the remote monitoring system are executed by the processor 311 executing the programs. Therefore, the processing executed by the program below is processing by the processor 311 or a device including the processor.
- the network (NW) interface 314 is an interface for connection to a network, and the computer communicates with other devices via the network interface 314 and the network.
- the input device 316 and the output device 317 are used for presenting information to a user and for inputting necessary information by the user. Examples of the input device 316 are a keyboard, a mouse, and a touch sensor, and examples of the output device are a display, a printer, and a speaker.
- the input device 316 and the output device 317 communicate with other components of the computer via the input / output interface 315.
- the auxiliary storage device 313 may be omitted.
- the input / output interface 315, the input device 316, and the output device 317 may be omitted in some devices.
- the network interface 314 may be omitted. At least some of the functions of each device may be realized by a logic circuit different from the processor.
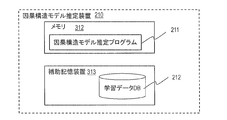
- FIG. 4 shows an example of a software configuration of the causal structure model estimation device 210.
- the causal structure model estimating device 210 stores the causal structure model estimating program 211 in the memory 312 and the learning data database (DB) 212 in the auxiliary storage device 313.
- the learning data database 212 stores learning data for estimating (generating) a causal structure model.
- FIG. 5 shows an example of a software configuration of the model management device 220.
- the model management device 220 stores the model management program 221 in the memory 312, and stores the model database 222 in the auxiliary storage device 313.
- the model database 222 stores the causal structure model estimated by the causal structure model estimating device 210. As will be described later, the model database 222 stores a causal structure model of a plurality of different operating states of the monitored system.
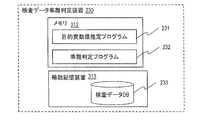
- FIG. 6 shows an example of a software configuration of the inspection data deviation determination device 230.
- the test data deviation determination device 230 stores the target variable value estimation program 231 and the deviation determination program 232 in the memory 312, and stores the test data database 233 in the auxiliary storage device 313.
- the inspection data database 233 stores inspection data for determining an abnormality of the monitored system.
- the processor 311 operates as a functional unit according to a program.
- the processor 311 functions as a causal structure model estimating unit in the causal structure model estimating device 210, and functions as a model managing unit in the model managing device 220. Further, the processor 311 functions as an objective variable value estimation unit and a deviation determination unit in the test data deviation determination device 230.
- the program is stored in the memory 312 and the database is stored in the auxiliary storage device 313 for convenience.
- data of the computer (including the program) is stored in the auxiliary storage device 313.
- data processed by the processor 311 is loaded from the auxiliary storage device 313 to the memory 312.
- the data updated on the memory 312 is stored in the auxiliary storage device 313.
- a user interface program is executed.
- the target variable value estimation program 231 estimates a target variable value to be monitored from the inspection data using a causal structure model.
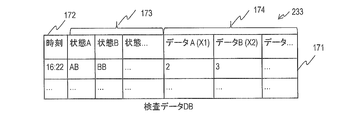
- FIG. 7 shows a configuration example of the inspection data database 233.
- FIG. 7 shows one test data record 171 in the test data database 233.
- the remote monitoring system monitors the monitored system, and periodically adds the test data record 171 to the test data database 233.
- the inspection data record 171 includes information on the state of the monitored system and a value (measured value) obtained from data measured by the sensor.
- the inspection data database 233 includes a time column 172, a column 173 indicating the status (operational status) of the monitored system, and a measurement data column 174.
- the monitored system is an air conditioner.
- the time column 172 indicates the time at which the data of the inspection data record was obtained. In the example of FIG. 7, the date is omitted.
- the column 173 indicating the operation state indicates an element for setting the air conditioner.
- the column 173 indicating the operation state includes a column of power ON / OFF, a column of operation modes such as cooling and heating, a column of wind speed, a column of upper and lower wind directions, and the like.
- the measurement data column 174 includes, for example, a room temperature column of a room where the air conditioner is installed, a column of air temperature taken into the air conditioner, a column of air temperature discharged from the air conditioner, and the like. Including.
- the columns of the learning data database 212 include all the columns of the test data database 233.
- Each node of the causal structure model indicates the value of the measurement data for the monitored system.
- the causal structure model 215 indicates a causal relationship between the measurement data of the monitored system.
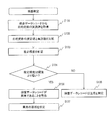
- FIG. 8 is a flowchart of a process performed by the target variable value estimation program 231.
- the objective variable value estimation program 231 calculates an estimated value of the monitored objective variable from the test data record 171 by using the causal structure model 215.
- the target variable that is, the top node 216 of the causal structure model 215 is, for example, the room temperature of the room where the air conditioner is installed.
- the target variable value estimation program 231 acquires the test data record 171 from the test data database 233 (S101). The target variable value estimating program 231 starts this processing when a new test data record 171 is added to the test data database 233, for example. In that case, the target variable value estimation program 231 acquires the added test data record 171 from the test data database 233.
- the target variable value estimation program 231 specifies the operation state of the test data record 171 (S102). Specifically, the objective variable value estimation program 231 acquires the value of the column 173 indicating the operation state of the test data record 171.
- the operation status of the monitored system is represented by a set (vector) of values in a column 173 indicating the operation status. If the value of one column in the column 173 indicating the operation state is different, the operation state is different.
- the target variable value estimation program 231 searches the model database 222 for a causal structure model that matches the operation state of the inspection record (S103). Specifically, the objective variable value estimation program 231 requests the model management device 220 to search for a causal structure model by designating the operation state.
- the model management program 221 searches the model database 222 for a causal structure model having the same operation state as the specified operation state. As described later, the model database 222 stores causal structure models corresponding to a plurality of different operation states. By preparing a causal structure model corresponding to each operation state, more appropriate normal / abnormal judgment and abnormal cause estimation can be performed.
- the model management program 221 transmits a response indicating the causal structure model to the causal structure model estimating device 210.
- the model management program 221 transmits the causal structure model to the causal structure model estimating device 210.
- the objective variable value estimating program 231 issues a warning in the client device 240 indicating that there is no causal structure model corresponding to the test data record. It is displayed (S105). Specifically, the target variable value estimation program 231 transmits the image data of the display to the client device 240. The client device 240 displays the image on the display device.
- the causal structure model that matches the test data record 171 does not need to have their operation state vectors completely matched.
- the causal structure model having the highest similarity of the operation state higher than the predetermined value and the highest similarity may be determined as the causal structure model that matches the test data record.
- the method of calculating the similarity is arbitrary, and for example, a cosine similarity can be used.
- the objective variable value estimating program 231 acquires the causal structure model, and uses the causal structure model to read the causal structure model. Then, the estimated value of the monitoring target variable is calculated (S106). By using the causal structure model that matches the test data record 171, the value of the target variable to be monitored can be accurately estimated.
- the objective variable value estimation program 231 extracts, from the inspection data record 171, a value corresponding to the lowest node of the causal structure model 215. The value of each node of the causal structure model 215 is included in the test data record 171.
- the target variable value estimating program 231 calculates the value of the top node from the value of the node at the lowest layer according to the causal structure model 215. The value of the top node is an estimated value of the monitored target variable.
- the objective variable value estimation program 231 outputs the calculated estimated value to the memory 312 (S107). Further, the objective variable value estimation program 231 transmits the estimated value to the client device 240. The client device 240 displays the estimated value on the display device.
- the objective variable value estimation program 231 stores the calculated estimated value and information for specifying the test data record 171 and the causal structure model 215 used for the calculation of the estimated value in the auxiliary storage device 313 as history information.
- Information on the test data record 171 and the causal structure model 215 can be obtained from the test data database 223 and the model database 222, respectively, by using information for specifying them.
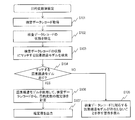
- FIG. 9 is a flowchart of processing by the deviation determination program 232.
- the divergence determination program 232 calculates the divergence between the estimated value of the target variable calculated by the target variable value estimation program 231 and the actually measured value of the target variable included in the inspection data record 171, and based on the divergence, Estimate whether there is any abnormality in the system.
- the divergence determination program 232 calculates the divergence between the estimated value of the room temperature and the actually measured value.
- the deviation determination program 232 acquires the actual measurement value of the objective variable from the test data record 171 (S131).
- the divergence determination program 232 compares the measured value with the estimated value of the objective variable calculated by the objective variable value estimation program 231 (S132), and calculates the estimation accuracy (S133).
- the estimation accuracy is an example of the degree of deviation, and is calculated by, for example, (1 ⁇
- the deviation determination program 232 compares the calculated estimation accuracy with a predetermined threshold (S134). If the estimation accuracy is equal to or greater than the threshold (S134: NO), the deviation determination program 232 determines that the test data record 171 (monitored system) is normal and has no abnormality (S135).
- the deviation determination program 232 determines that an abnormality exists in the inspection data record 171 (monitoring target system), and warns that the inspection data record is abnormal (S136). . Specifically, the divergence determination program 232 transmits a warning indicating that the monitored system has an abnormality to the client and the device 240. The client device 240 displays the warning on a display device.
- the discrepancy determination program 232 stores the calculated estimation accuracy, normal / abnormal determination result, and information for identifying the test data record 171 in the auxiliary storage device 313 as history information.
- the test data record 171 can be obtained from the test data database 223 using the information that identifies it.
- the deviation determination program 232 estimates (searches) for the cause of the abnormality in the causal structure model 215 (S137). Details of the estimation of the cause of the abnormality will be described later.
- the test data divergence determination device 230 inputs the measurement value of the test data record to the lowest node of the causal structure model 215 and converts the estimated value of the upper layer nodes (intermediate nodes) to the causal structure model. The calculation is sequentially performed at 215. The test data deviation determination device 230 determines whether an abnormality has occurred based on the difference between the finally obtained top node value (the value of the target variable) and the actually measured value of the test data record.
- anomalies can be quickly found by estimating node values hierarchically. Specifically, in the hierarchical estimation in the causal structure model 215, an abnormality of any node propagates to an upper layer. Therefore, in the causal structure model 215, when the estimated value is calculated over a plurality of layers, the abnormality of the estimated value (deviation from the actually measured value) increases. Thereby, it is possible to detect an abnormality in the monitoring target system earlier.
- the value of the test data record may be input to a node in a layer different from the lowest layer in the causal structure model 215.
- the node of the monitored target variable may be an intermediate node in the causal structure model stored in the model database 222. That is, there may be an edge from the node of the target variable to be monitored toward the upper layer node. In the calculation of the estimated value, the node of the target variable to be monitored is treated as the top node.
- FIGS. 10, 11 and 12 show examples of graphical user interface (GUI) images displayed by the client device 240.
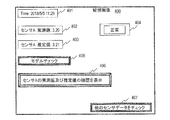
- FIG. FIG. 10 shows an example of a monitoring image 400 to be monitored.
- the monitoring image 400 shows the inspection result of the inspection data record 171.
- the monitoring image 400 includes an acquisition time 401 of the inspection data record, an actual measurement value 402 of the target variable to be monitored, an estimated value 403 of the target variable, and a normal / abnormal judgment result 404.
- the value of the objective variable is measured by the sensor A.
- the determination result 404 is notified from the deviation determination program 232, and other information is transmitted from the objective variable value estimation program 231.
- the surveillance image 400 further includes a model check button 405, a button 406 for displaying the history of measured values and estimated values, and a button 407 for displaying information of other sensor data (objective variables).
- the monitoring image 400 allows the user to know the monitoring information including the information on the normal / abnormal of the monitoring target.
- FIG. 11 shows an image example 410 when the model check button 405 is selected by the user in the monitoring image 400.
- the causal structure model used for calculating the estimated value of the objective variable is displayed.
- the causal structure model estimating device 210 (for example, the objective variable value estimating program 231) transmits to the client device 240 information on the causal structure model used for calculating the estimated value in response to a request from the client device 240.
- the causal structure model is the causal structure model in the operation state 1.
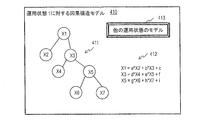
- the image 410 includes a graph image 411 of the causal structure model and a regression equation 412 indicating a relationship between nodes.
- the button 413 enables a model in another operation state to be displayed. Image 410 allows the user to check the causal structure model.
- FIG. 12 shows an image example 420 when the button 406 is selected by the user in the monitoring image 400.
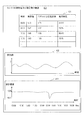
- the image 420 shows the history of the actual measurement value, the estimated value, and the estimation accuracy of the target variable to be monitored. These pieces of information are acquired from the test data deviation determination device 230.
- the image 420 includes a table 421 showing the history of the actually measured values, the estimated values and the estimation accuracy, a graph 422 showing the history of the actually measured values (time change), and a graph 423 showing the history of the estimated values (time change).
- the image 420 allows the user to check the history of measured values, estimated values, and estimation accuracy.
- FIG. 13 schematically illustrates an example of a method of estimating a node that causes an abnormality.
- a node causing an abnormality is searched for from the node 216 of the monitoring target variable to the lower layer along the edge.
- the divergence determination program 232 calculates the rate of change (an example of divergence) from the previous measurement (in the same operation state) of the actually measured value of each of the causal nodes immediately below the top node 216.
- the divergence determination program 232 determines, among the cause nodes of the top node 216, a node whose rate of change from the previous measurement exceeds a threshold, as an abnormal cause node candidate.
- the node 217 is an abnormal cause node candidate.
- the deviation determination program 232 calculates the rate of change of the measured value of each of the cause nodes of the abnormal cause node candidate.
- the divergence determination program 232 determines a node whose change rate exceeds a threshold value as an abnormal cause node candidate.
- the node 218 is an abnormal cause node candidate.
- the discrepancy determination program 232 repeats the above processing up to the layer (in this example, the lowest layer) where the inspection data is input in the calculation of the estimated value.
- the layer in this example, the lowest layer
- the search for a new abnormal cause node candidate ends.
- the divergence determination program 232 presents all the found abnormal cause node candidates to the user.
- the divergence determination program 232 may select a node whose immediate lower node is not the abnormal cause node from the abnormal cause node candidates and present the selected node to the user as the abnormal cause node candidate.
- the divergence determination program 232 may select the node having the largest change rate and present it to the user as an abnormal cause node candidate.
- FIG. 14 is a flowchart of the abnormal cause node estimating method described with reference to FIG.
- the discrepancy determination program 232 acquires the previous test data record (measurement value) of the causal structure model 215 from the test data database 223 (S151).
- the discrepancy determination program 232 compares the measured value in the previous test data record with the measured value in the current test data record, and calculates the rate of change of the measured values of all the cause nodes of the result node (S152).
- the first selected result node is node 216 of the monitored target variable.
- the divergence determination program 232 selects all the cause nodes whose rate of change exceeds the threshold value as the abnormal cause node candidates (S153).
- the threshold value is common to the nodes or set for each node.
- the discrepancy determination program 232 selects an unselected abnormality cause node candidate as a result node (S154), and determines whether the cause node exists (S155).
- the divergence determination program 232 executes steps 152 and 153 for the selected result node. If the cause node does not exist (S155: NO), the divergence determination program 232 determines whether an unselected abnormality cause candidate node exists (S156).
- the divergence determination program 232 When there is an unselected abnormality cause candidate node (S156: YES), the divergence determination program 232 newly selects an unselected abnormality cause candidate node (S154). If there is no unselected abnormality cause candidate node (S156: NO), the deviation determination program 232 outputs the abnormality cause candidate node selected so far (S157). For example, the divergence determination program 232 transmits information on the cause node of the abnormality to the client device 240, and the client device 240 displays the information.
- FIG. 15 schematically illustrates an example of a method of estimating a node that causes an abnormality.
- a node causing an abnormality is searched for from the node 216 of the monitoring target variable to the lower layer along the edge.
- the divergence determination program 232 determines the node having the largest change rate (example of divergence) from the previous measurement among the cause nodes of the node 216 as the abnormal cause node candidate.
- the node 217 is an abnormal cause node candidate.
- the deviation determination program 232 calculates the rate of change of the measured value of each of the cause nodes of the abnormal cause node candidate 217.
- the divergence determination program 232 determines the node having the largest change rate as an abnormal cause node candidate. In the example of FIG. 15, the node 218 is an abnormal cause node candidate.
- the discrepancy determination program 232 repeats the above processing up to the layer (in this example, the lowest layer) where the inspection data is input in the calculation of the estimated value.
- the divergence determination program 232 selects the node with the largest change rate as the most likely abnormality cause node candidate among all the found abnormality cause node candidates.
- the divergence determination program 232 presents the selected abnormal cause node candidate to the user.
- the node 217 is the most likely abnormality cause node candidate.
- the divergence determination program 232 may present all the abnormal cause node candidates to the user.
- FIG. 16 is a flowchart of the abnormal cause node estimating method described with reference to FIG.
- the deviation determination program 232 acquires the previous test data record (measurement value) of the causal structure model 215 from the test data database 223 (S171).
- the discrepancy determination program 232 compares the measured value of the previous test data record with the measured value of the current test data record, and calculates the rate of change of the measured values of all the cause nodes of the result node (S172).
- the first selected result node is node 216 of the monitored target variable.
- the divergence determination program 232 selects the cause node having the largest change rate as an abnormal cause node candidate (S173).
- the divergence determination program 232 selects an abnormal cause node candidate as a result node (S174), and determines whether or not the cause node (the node immediately below) exists (S175). If the cause node exists (S175: YES), the divergence determination program 232 returns to step S172.
- the divergence determination program 232 determines the node with the largest change rate among the abnormal cause node candidates as the most likely abnormal cause node candidate (S176). Further, the divergence determination program 232 transmits, for example, information on the most probable abnormal cause node to the client device 240, and the client device 240 displays the information.
- the abnormal cause node candidate can be quickly and appropriately specified.
- an average value (moving average) of a plurality of immediately preceding measurement values is used instead of the rate of change between the immediately preceding value and the current value. Value) and the rate of change of the current value.
- the estimation accuracy (deviation) between the measured value and the estimated value may be used instead of the rate of change of the measured value.
- the divergence determination program 232 calculates the estimation accuracy of each node, and determines a node whose estimation accuracy is lower than a threshold value as an abnormal cause node candidate. Since the estimated value is not calculated for the lowest node, the rate of change of the actually measured value is used.
- an average value (moving average) of a plurality of immediately preceding measurement values is used instead of the rate of change from the previous value to the current value. Value) to the current value.
- an estimation accuracy (deviation) between the actual measurement value and the estimated value may be used instead of the rate of change of the actual measurement value. Since the estimated value is not calculated for the lowest node, the rate of change of the actually measured value is used. For comparison between the lowest layer node and the middle layer node, the rate of change of the measured value of the lowest layer node is corrected.
- the causal structure model estimating program 211 analyzes the learning data stored in the learning data database 212 and estimates (generates) a causal structure model.
- the causal structure model estimating program 211 may estimate the causal structure model by an arbitrary method. An example will be described below.
- FIG. 17 is a flowchart of estimating a causal structure model by the causal structure model estimating program 211.
- the causal structure model estimation program 211 receives designation of a monitoring target variable (for example, room temperature) in a plurality of measurement values (measurement data) included in learning data from a user via the client device 240 (S201).
- a monitoring target variable for example, room temperature
- measurement values for example, measurement data
- the causal structure model estimation program 211 extracts a measurement value related to the designated monitored target variable from the learning data by a predetermined algorithm (S202).
- the causal structure model estimation program 211 calculates a non-linear value from the related measurement value and adds it as a new related measurement value (S203).
- the non-linear value is, for example, the square of a measured value or a product of different measured values.
- the causal structure model estimation program 211 selects an explanatory variable candidate from the related measurement values (S205). For example, the causal structure model estimation program 211 performs a simple regression analysis between related measurement values, and groups related measurement values such that related value groups having a correlation coefficient larger than a predetermined value are in the same group. Further, one related measurement value is arbitrarily selected for each group and determined as an explanatory variable candidate.
- the causal structure model estimation program 211 executes a multiple regression analysis (for example, a variable increase / decrease method) on the explanatory variable candidate (S206), and calculates a regression equation of the objective variable. As a result of the linear multiple regression analysis, the regression equation of the objective variable is expressed in a linear form of the explanatory variable.
- the causal structure model estimation program 211 may configure the regression equation with a nonlinear term.
- the causal structure model estimation program 211 determines whether the regression equation satisfies a preset completion condition (S207).
- the completion condition is, for example, that a related measurement value set by the user in advance is extracted as an explanatory variable, and that a new node is not generated based on used learning data. If the completion condition is not satisfied (S207: NO), the causal structure model estimation program 211 determines each explanatory variable as a new objective variable, and selects an explanatory variable candidate from unselected related data (S204).
- the causal structure model estimating program 211 determines the regression formula of each objective variable by linear multiple regression analysis of the explanatory variable candidate. By sequentially repeating the multiple regression analysis, the entire causal structure model for the KPI data is automatically estimated.
- the causal structure model estimating program 211 transmits the created causal structure model to the model management device 220 and stores it in the model database 222.
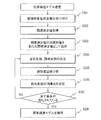
- FIG. 19 shows a flowchart of a process in which the causal structure model estimation program 211 determines a learning period.
- the causal structure model estimating program 211 sets the learning period for the causal structure model of the similar system to [t_0, t_1] (S221).
- the causal structure model estimation program 211 acquires the learning data for the period [t_0, t_1] from the learning data database 212 (S222).
- the causal structure model estimation program 211 estimates a causal structure model using the learning data (S223). The estimation of the causal structure model is as described above.
- the causal structure model estimating program 211 determines whether or not the recall of the causal structure model thus estimated exceeds a threshold (S224). If the recall exceeds the threshold (S224: YES), the causal structure model estimating program 211 counts the number of nodes of the output causal structure model (S225).
- the causal structure model estimation program 211 excludes the period from the learning period (S226).
- the causal structure model estimating program 211 calculates the degree of growth of the causal structure model (S227).
- the growth degree can be calculated by (current number of nodes ⁇ previous number of nodes) / current number of nodes.
- the causal structure model estimation program 211 compares the calculated degree of growth with the threshold (S228).
- the causal structure model estimating program 211 determines a learning period for estimating the causal structure model of the target system based on the period [t_0, t_1]. For example, the period [t_0, t_1] is determined as a learning period for estimating a causal structure model of the target system (S230).
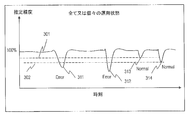
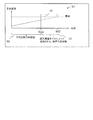
- FIG. 20 is a graph illustrating a relationship between a temporal change in estimation accuracy and a threshold, for explaining an outline of a threshold setting method.
- the estimation accuracy shown in the graph is the estimation accuracy of any operation state when a threshold is set for each operation state, and the estimation accuracy in all operation states when all the thresholds are common to the operation states It is.
- the threshold value 301 matches the bottom point 323 of the estimation accuracy, and the threshold value 302 matches the bottom point 324 of the estimation accuracy.
- the bottom points 321 and 322 are smaller than the bottom point 324, and the bottom point 324 is smaller than the bottom point 323.
- the monitored system indicates an actual abnormality.
- the monitored system is normal.
- the threshold value 302 is more appropriate than the threshold value 301.
- FIG. 21 shows a flowchart of setting an initial threshold value by the deviation determination program 232.
- the divergence determination program 232 calculates the estimation accuracy of each learning data record using the causal structure model (S241).
- the discrepancy determination program 232 selects the learning data record with the lowest estimation accuracy (S242).
- the discrepancy determination program 232 determines whether the selected learning data record includes a maintenance record (S243).
- the deviation determination program 232 selects the learning data record with the lowest estimation accuracy from the non-selected learning data records (S244), and returns to step S243. .
- the deviation determination program 232 sets the estimation accuracy of the selected learning data record as a threshold (S245).
- the fact that the learning data record includes the maintenance record means that an abnormality has occurred in the monitored system.
- FIG. 22 shows a flowchart of updating the threshold value by the deviation determination program 232.
- the deviation determination program 232 calculates the estimation accuracy of the test data record selected from the test data database 233 (S261).
- the divergence determination program 232 determines whether the estimation accuracy is less than the threshold (S262).
- the deviation determination program 232 determines that the test data record is abnormal (S263).
- the deviation determination program 232 determines that the test data record is normal (S264).
- the discrepancy determination program 232 checks the maintenance record of the inspection data record (S265).
- the test data record includes a field for storing a maintenance record for the test data record.
- the deviation determination program 232 determines whether the normality / abnormality determination based on the estimation accuracy is correct based on the presence or absence of a maintenance record (S266).
- the deviation determination program 232 determines whether a maintenance record exists, and the judgment is incorrect if there is no maintenance record. If the determination is correct (S266: YES), the deviation determination program 232 maintains the current threshold (S268). If the determination is not correct (S266: NO), the deviation determination program 232 updates the threshold based on the estimation accuracy of the test data record. For example, the estimation accuracy of the inspection data record is set as a new threshold (S267).
- FIG. 23 is a diagram for explaining estimation of a causal structure model for each operation state of the monitored system.
- the causal structure model estimation program 211 acquires the learning data 331 for each operation state from the learning data database 212, and estimates the causal structure model 215 for each operation state (S31).
- learning data of the operating state 1 to the operating state N exists.
- the learning data of the operating state 1 is indicated by reference numeral 331.
- a causal structure model of each of the operation state 1 to the operation state N is estimated.
- a causal structure model of the operation state 1 is indicated by a reference numeral 215.
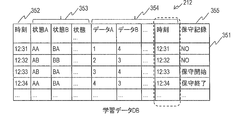
- FIG. 24 shows a configuration example of the learning data database 212.
- the learning data database 212 includes a plurality of learning data records 351.
- one learning record is indicated by reference numeral 351 as an example.
- the learning data record 351 includes information on the state of the monitored system, values obtained from data measured by sensors, and maintenance records.
- the learning data database 212 includes a time column 352, a column 353 indicating the state of the monitored system (operational state), a measurement data column 354, and a maintenance record column 355. In the example of FIG. 24, the date is omitted.
- the contents of the time column 352, the column 353 indicating the state (operational state) of the monitored system, and the measurement data column 354 are the same as those of the test data database 223 described with reference to FIG.
- FIG. 25 shows the learning data 331 in the operating state 1.
- the operation status of the monitored system is defined by a plurality of types of status values (status A, status B). If the value of any one state (column) is different, the operation state is different.
- the learning data 331 of a specific operation state may be selected from the learning data database 212 at the time of estimating the causal structure model, and the learning data for each operation state may be classified in the learning data database 212 in advance.
- the causal structure model estimating program 211 constructs a causal structure model capable of predicting a temporal change of a target variable to be monitored.
- the target variable value estimation program 231 predicts a temporal change of the target variable to be monitored based on the causal structure model and the time information.
- FIG. 26 schematically shows the relationship between the change in the operation state and the estimation accuracy.
- the objective variable value estimating program 231 searches the learning data database 212 for a change in the operation state of a pattern similar to the pattern of the past operation state change 501 in the past, and determines the operation state change after the found operation state change in the predicted operation state change. Apply to 502.
- the operation state change can be represented by a vector, and the target variable value estimation program 231 can select an operation state change of a similar pattern based on the similarity between the vectors. For example, the operation state change of the pattern having the highest similarity or the pattern exceeding the threshold is selected.
- the objective variable value estimation program 231 selects a causal structure model corresponding to each operation state of the predicted operation state change 502, and calculates a predicted value of the objective function to be monitored.
- a range 503 indicates a past actual value
- a range 504 indicates a predicted value.
- the range 503 and the range 504 correspond to the actual operation state change 501 and the predicted operation state change 502, respectively.
- FIG. 27 shows a configuration example of a learning data database 212 that stores learning data for estimating a causal structure model capable of predicting a temporal change of a target variable to be monitored.
- the learning data database 212 includes a time column in the measurement data column 354.
- FIG. 28 shows an example 215 of a causal structure model capable of predicting a temporal change of a target variable to be monitored.
- the lowest node (node where no cause node exists) 511 is represented by a function of time.
- the causal structure model estimating program 211 determines that the node is the lowest node.
- the target variable value estimating program 231 inputs the time to the lowest node 511 and determines the predicted value of the node 216 of the target variable to be monitored.
- FIG. 29 shows a display example of a predicted value of a target variable by the causal structure model 215.
- the client device 240 acquires the image data from the target variable value estimation program 231 and displays the image data on the output device 317.
- the horizontal axis represents time
- the vertical axis represents target variables.
- the range 522 indicates the actual value of the objective variable
- the range 523 indicates the predicted value of the objective variable.
- the value of the objective variable is an output value of the causal structure model 215 that inputs each time.
- the predicted value at time t2 has reached the threshold value 524.
- the target variable value estimating program 231 determines the time when the predicted value reaches the threshold value as the abnormal occurrence predicted time, and presents it to the user.
- FIG. 30 shows a monitoring image example 530.
- the monitoring image 530 displays a location where an abnormality has occurred when an abnormality is detected by the causal structure model, and further displays a deviation between an estimated value and an actually measured value at the abnormal location.
- Monitoring image 530 includes sections 531, 532 and 533.
- the section 531 shows the time change 541 of the actually measured value of the target variable and the time change 542 of the estimated value of the monitoring target system (system 1).
- the time change 541 of the measured value is indicated by a solid line
- the time change 542 of the estimated value is indicated by a broken line.
- the section 531 shows a plurality of operation status values of the monitored system.
- the example of FIG. 30 shows an actual measurement value and an estimated value of the operation state A and the operation state B subsequent thereto.
- Section 531 shows the threshold A545 for normal / abnormal judgment in operation state A and the threshold B546 for normal / abnormal judgment in operation state B by broken lines.
- the section 531 further shows abnormal points 543 in the operation state A and abnormal points 544 in the operation state B by circles filled with a hatching pattern.
- the abnormal part 543 is filled with a dot pattern
- the abnormal part 544 is filled with a hatched pattern.
- the oblique line pattern is more visible than the dot pattern.
- the section 532 allows the user to select an operation state by the list box 551.
- the operation state B is selected.
- Section 532 displays a graph 552 of the change over time of the selected operating state estimate.
- the section 531 shows the abnormal part in the operation state selected in the list box 551 by an image having higher visibility than the abnormal part in the operation state not selected.
- an abnormal part in the operation state selected in the list box 551 is indicated by a hatched pattern, and an abnormal part in the operation state not selected is indicated by a dot pattern. If none of the operation states is selected, the section 531 shows the first abnormal portion in a pattern with high visibility and the other abnormal portions in a pattern with low visibility.
- the section 532 includes a button 553.
- the section 533 displays the causal structure model 561 of the operation state selected in the list box 551.
- the causal structure model 561 further specifies the node of the abnormality cause candidate.
- the abnormality cause candidate nodes (X3 and X5) are indicated by thick lines.
- Section 533 includes buttons 562 and 563.
- buttons 562 and 563 When the button 562 is selected by the user, a warning history of the operation state B is displayed.
- the button 563 is selected, the maintenance history of the system in the operation state B is displayed.
- the monitoring image 530 can easily and appropriately present the detected abnormality and the candidate node of the cause to the user in monitoring the monitoring target system.
- Data for creating the monitoring image 530 is transmitted from the test data deviation determination device 230 to the client device 240.
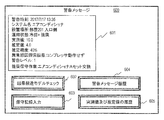
- FIG. 31 shows an example 600 of a warning message.
- the warning message 600 includes a warning content 601 and buttons 602 to 605.
- the warning content 601 indicates details of the warning.
- the button 602 is selected, the causal structure model targeted for the warning message is displayed.
- the button 603 is selected, an input image of the maintenance record is displayed.
- the button 604 is selected, a history of warning messages including the warning message is displayed.
- the button 605 is selected, a history of measured values and estimated values in monitoring the corresponding objective variable is displayed.
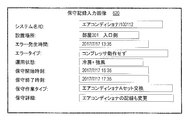
- FIG. 32 shows an input image 620 of the maintenance record.
- the user inputs necessary information in the input image 620 of the maintenance record.
- the input information is transmitted to the test data deviation determination device 230 and stored in the auxiliary storage device 313.
- part of the input information is stored in the test data database 233.
- the present invention is not limited to the above-described embodiments, but includes various modifications.
- the above-described embodiments have been described in detail in order to explain the present invention in an easy-to-understand manner, and are not necessarily limited to those having all the configurations described above.
- a part of the configuration of one embodiment can be replaced with the configuration of another embodiment, and the configuration of one embodiment can be added to the configuration of another embodiment.
- the components, functions, processing units, and the like described above may be partially or entirely realized by hardware, for example, by designing an integrated circuit.
- the above-described configurations, functions, and the like may be realized by software by a processor interpreting and executing a program that realizes each function.
- Information such as a program, a table, and a file for realizing each function can be stored in a memory, a hard disk, a recording device such as an SSD (Solid State Drive), or a recording medium such as an IC card or an SD card.
- control lines and information lines are shown as necessary for the description, and do not necessarily indicate all control lines and information lines on a product. In practice, almost all components may be considered to be interconnected.
Landscapes
- Engineering & Computer Science (AREA)
- Business, Economics & Management (AREA)
- General Physics & Mathematics (AREA)
- Physics & Mathematics (AREA)
- Theoretical Computer Science (AREA)
- Human Resources & Organizations (AREA)
- Strategic Management (AREA)
- Tourism & Hospitality (AREA)
- Economics (AREA)
- General Business, Economics & Management (AREA)
- Marketing (AREA)
- Automation & Control Theory (AREA)
- Entrepreneurship & Innovation (AREA)
- Software Systems (AREA)
- Artificial Intelligence (AREA)
- Evolutionary Computation (AREA)
- Mathematical Physics (AREA)
- Quality & Reliability (AREA)
- Educational Administration (AREA)
- Development Economics (AREA)
- Primary Health Care (AREA)
- Operations Research (AREA)
- General Health & Medical Sciences (AREA)
- Health & Medical Sciences (AREA)
- Computing Systems (AREA)
- Computer Vision & Pattern Recognition (AREA)
- Data Mining & Analysis (AREA)
- Medical Informatics (AREA)
- General Engineering & Computer Science (AREA)
- Mathematical Optimization (AREA)
- Algebra (AREA)
- Probability & Statistics with Applications (AREA)
- Pure & Applied Mathematics (AREA)
- Game Theory and Decision Science (AREA)
- Mathematical Analysis (AREA)
- Testing And Monitoring For Control Systems (AREA)
- Debugging And Monitoring (AREA)
Abstract
監視対象システムを監視する監視システムが開示される。監視システムは、プログラムを格納する1以上記憶装置と、プログラムに従って動作する1以上のプロセッサと、を含む。1以上のプロセッサは、監視対象システムの検査データに含まれる測定データと監視対象システムの因果構造モデルとに基づき、監視対象システムの監視対象目的変数の推定値を決定する。1以上のプロセッサは、検査データに含まれる監視対象目的変数の測定値と推定値との比較結果に基づき、監視対象システムにおいて異常が発生しているか判定する。
Description
本出願は、平成30年(2018年)9月27日に出願された日本出願である特願2018-181281の優先権を主張し、その内容を参照することにより、本出願に取り込む。
本発明は、監視システム及び監視方法に関する。
鉄道、上下水道、都市交通といった社会インフラの業務管理システムは、複数のサブシステムで構成される。例えば、鉄道の業務管理システムは100以上のサブシステムで構成されている。こうした社会インフラには、継続的な業務改善が求められる。例えば、鉄道の保守に着目すると、設備の老朽化に伴って保守費用が増加傾向にある一方で、人口減少による輸送収入の減少が予想されている。そのため、輸送の安全性を損なうことなく保守費用を低減する、業務改善の施策立案が求められている。
保守費用を削減するために、予測保守が最善の解決策の1つである。予測保守の最も重要な機能は、エラーのどのような原因がどこで起き、問題の発生を防ぐために可能な解決策は何か、を推定することである。
システムの因果関係を推定する1つの方法が。例えば、特許文献1に開示されている。あるいは、エラーと実行中のログの因果関係を推定するためのもう1つの解決策は、特許文献2に開示されている。また、深層学習により潜在的な問題を予測する手法が、特許文献3に開示されている。
システムの異常に対して適切かつ迅速に対応するためには、その原因を迅速かつ高い確度で推定することが重要である。しかし、従来の統計及び機械学習技術は、原因を迅速かつ的確に突き止めるのが困難である。
本発明の一態様は、監視対象システムを監視する監視システムであって、プログラムを格納する1以上の記憶装置と、前記プログラムに従って動作する1以上のプロセッサと、を含み、前記1以上のプロセッサは、前記監視対象システムの検査データに含まれる測定データと前記監視対象システムの因果構造モデルとに基づき、前記監視対象システムの監視対象目的変数の推定値を決定し、前記検査データに含まれる前記監視対象目的変数の測定値と前記推定値との比較結果に基づき、前記監視対象システムにおいて異常が発生しているか判定する。
本発明の一態様は、システムの異常の原因を迅速かつ高い確度で推定することができる。
以下、添付図面を参照して本発明の実施例について説明する。添付図面では、機能的に同じ要素は同じ番号で表示されている。なお、添付図面は本発明の原理に則った具体的な実施例を示しているが、これらは本発明の理解のためのものであり、決して本発明を限定的に解釈するために用いられるものではない。
[実施形態の概要]
図1は本開示の遠隔監視システムによる処理の概要を模式的に示す。遠隔監視システムは、学習データ150から因果構造モデル215を推定する(S11)。因果構造モデル215は、監視対象システムについてのデータ間の因果関係を示す有指向グラフ構造を有するモデルである。因果構造モデル215は、因果図(Causal Loop Diagram:CLD)で表わすことができる。因果構造モデル215をCLDモデルとも呼ぶ。
図1は本開示の遠隔監視システムによる処理の概要を模式的に示す。遠隔監視システムは、学習データ150から因果構造モデル215を推定する(S11)。因果構造モデル215は、監視対象システムについてのデータ間の因果関係を示す有指向グラフ構造を有するモデルである。因果構造モデル215は、因果図(Causal Loop Diagram:CLD)で表わすことができる。因果構造モデル215をCLDモデルとも呼ぶ。
因果構造モデル215において、エッジの指向元ノードが原因ノード(説明変数ノード)であり、エッジの指向先ノードが結果ノード(目的変数ノード)である。原因ノードは目的変数を表し、原因ノードは説明変数を表す。結果ノードの変数は、原因ノードの変数の回帰式で表わされる。回帰式の各項は、線形(1次)又は非線形(1次より大きい)である。説明変数がX1、X2、X3である場合、目的変数Yは、例えば、aX1*X2+bX1*X3+cX2*X3、または、aX1+bx2+cX32等の式で表わされる。a、b、cは係数である。
因果構造モデル215は階層構造を有している。上層の結果ノード(目的変数)の原因ノード(説明変数)は、さらに下層の原因ノード(説明変数)の結果ノード(目的変数)である。因果構造モデル215において、有指向エッジに従ってノードを辿ったトップノード216は、監視対象目的変数を示す。
遠隔監視システムは、監視対象システムの検査データ170を、推定(生成した)因果構造モデル215に入力し、監視対象目的変数の推定値を取得する(S12)。検査データ170は例えばリアルタイムデータであり、監視対象システムの現在の状態及び状況を示すデータを含む。遠隔監視システムは、因果構造モデル215による監視対象目的変数の推定値と、検査データ170に含まれる監視対象目的変数の実測値とを比較し、それらの乖離度を決定する。遠隔監視システムは、計算された乖離度に基づいて監視対象システムにおいて異常が発生しているか判定する(S13)。
監視対象システムにおいて異常が発生していると判定された場合、検査データ170が入力された因果構造モデル215において、異常の原因とされるノードを探索する。因果構造モデル215は、原因と結果の関係を示す有指向グラフ構造を有しており、遠隔監視システムは、異常の潜在的原因を効率的に高い確度で推定することができる。なお、因果構造モデル215が予め用意されている場合、因果構造モデルの推定を省略してよい。因果構造モデルを学習データにより推定することで、適切な因果構造モデルを予め用意しておくことが不要となる。
[システム構成]
図2は、遠隔監視システムの構成例を模式的に示す。遠隔監視システムは、因果構造モデル推定装置210、モデル管理装置220、検査データ乖離判定装置230、及びクライアント装置240を含み、これらはネットワークを介して互いに通信する。ネットワークは、例えば、ローカルエリアネットワーク(LAN)又はワイドエリアネットワーク(WAN)である。
図2は、遠隔監視システムの構成例を模式的に示す。遠隔監視システムは、因果構造モデル推定装置210、モデル管理装置220、検査データ乖離判定装置230、及びクライアント装置240を含み、これらはネットワークを介して互いに通信する。ネットワークは、例えば、ローカルエリアネットワーク(LAN)又はワイドエリアネットワーク(WAN)である。
因果構造モデル推定装置210、モデル管理装置220、検査データ乖離判定装置230、及びクライアント装置240は、それぞれ、例えば、1以上の計算機で構成ことができる。また、これらの内に複数の装置が一つの計算機により実現されてもよい。
図3は、計算機のハードウェア構成例を模式的に示す。計算機は、プログラムを格納する1以上の記憶装置及びプログラムに従って動作する1以上のプロセッサを含む。計算機は、プロセッサ311、メモリ312、補助記憶装置313、ネットワークインタフェース314、入出力インタフェース315、入力デバイス316、及び出力デバイス317を含む。これら構成要素は、バスによって互いに接続されている。メモリ312、補助記憶装置313又はこれらの組み合わせは記憶装置であり、ソフトウェアを格納する記憶媒体を含む。
メモリ312は、例えば半導体メモリから構成され、主にプログラムやデータを一時的に保持するために利用される。プロセッサ311は、メモリ312に格納されているプログラムに従って、様々な処理を実行する。プロセッサ311がプログラムに従って動作することで、様々な機能部が実現される。補助記憶装置313は、例えばハードディスクドライブやソリッドステートドライブなどの大容量の記憶装置から構成され、プログラムやデータを長期間保持するために利用される。
補助記憶装置313に格納されたプログラム及びデータが起動時又は必要時にメモリ312にロードされ、プログラムをプロセッサ311が実行することにより、遠隔監視システムの各種処理が実行される。したがって、以下においてプログラムにより実行される処理は、プロセッサ311又は当該プロセッサを含む装置による処理である。
ネットワーク(NW)インタフェース314は、ネットワークとの接続のためのインタフェースであり、計算機は、ネットワークインタフェース314及びネットワークを介して他の装置と通信する。入力デバイス316及び出力デバイス317は、ユーザに情報を提示し、また、ユーザが必要な情報を入力するために使用される。入力デバイス316の例は、キーボード、マウス、及びタッチセンサであり、出力デバイスの例は、ディスプレイ、プリンタ及びスピーカである。入力デバイス316及び出力デバイス317は、入出力インタフェース315を介して、計算機の他の構成要素と通信する。
例えば、補助記憶装置313は省略されていてもよい。入出力インタフェース315、入力デバイス316、及び出力デバイス317は、一部の装置において省略されていてもよい。全ての装置の機能が一つの計算機に実装される場合、ネットワークインタフェース314は省略されてもよい。各装置の少なくとも一部の機能は、プロセッサと異なるロジック回路により実現されてもよい。
図4は、因果構造モデル推定装置210のソフトウェア構成例を示す。因果構造モデル推定装置210は、因果構造モデル推定プログラム211をメモリ312に格納し、学習データデータベース(DB)212を補助記憶装置313に格納している。学習データデータベース212は、因果構造モデルを推定(生成)するための、学習データを格納している。
図5は、モデル管理装置220のソフトウェア構成例を示す。モデル管理装置220は、モデル管理プログラム221をメモリ312に格納し、モデルデータベース222を補助記憶装置313に格納している。モデルデータベース222は、因果構造モデル推定装置210により推定された因果構造モデルを格納している。後述するように、モデルデータベース222は、監視対象システムの異なる複数の運用状態の因果構造モデルを格納している。
図6は、検査データ乖離判定装置230のソフトウェア構成例を示す。検査データ乖離判定装置230は、目的変数値推定プログラム231及び乖離判定プログラム232をメモリ312に格納し、検査データデータベース233を補助記憶装置313に格納している。検査データデータベース233は、監視対象システムの異常判定のための検査データを格納している。
上述のように、プロセッサ311は、プログラムに従って機能部として動作する。例えば、プロセッサ311は、因果構造モデル推定装置210において因果構造モデル推定部として機能し、モデル管理装置220においてモデル管理部として機能する。また、プロセッサ311は、検査データ乖離判定装置230において、目的変数値推定部及び乖離判定部として機能する。
なお、図4、5及び6において、便宜上、プログラムがメモリ312に格納され、データベースが補助記憶装置313に格納されているが、一般に、計算機のデータ(プログラムを含む)は補助記憶装置313に格納され、プロセッサ311により処理されるデータが、補助記憶装置313からメモリ312にロードされる。また、メモリ312上で更新されたデータは、補助記憶装置313に格納される。なお、クライアント装置240においては、ユーザインタフェースプログラムが実行される。
[因果構造モデルを使用した正常/異常判定]
次に、検査データ乖離判定装置230の目的変数値推定プログラム231により実行される処理を説明する。目的変数値推定プログラム231は、因果構造モデルによって、検査データから、監視対象目的変数値を推定する。
次に、検査データ乖離判定装置230の目的変数値推定プログラム231により実行される処理を説明する。目的変数値推定プログラム231は、因果構造モデルによって、検査データから、監視対象目的変数値を推定する。
図7は、検査データデータベース233の構成例を示す。図7は、検査データデータベース233における、一つの検査データレコード171を示す。遠隔監視システムは、監視対象システムをモニタリングしており、定期的に、検査データレコード171を検査データデータベース233に追加する。検査データレコード171は、監視対象システムの状態の情報、及び、センサにより測定されたデータから得られる値(測定値)を含む。
検査データデータベース233は、時刻欄172、監視対象システムの状態(運用状態)を示す欄173、及び、測定データの欄174を含む。例えば、監視対象システムがエアーコンディショナであるとする。時刻欄172は、検査データレコードのデータを取得した時刻を示す。図7の例において、日付は省略されている。
運用状態を示す欄173は、それぞれ、エアーコンディショナの設定の要素を示す。例えば、運用状態を示す欄173は、電源のON/OFFの欄、冷房や暖房などの動作モードの欄、風速の欄、上下の風向きの欄等を含む。測定データの欄174は、例えば、エアーコンディショナが設置されている部屋の室温の欄、エアーコンディショナに吸入される空気の温度の欄、エアーコンディショナから排出される空気の温度の欄等を含む。
後述するように、学習データデータベース212の欄は、検査データデータベース233の全ての欄を含む。因果構造モデルのノードは、それぞれ、監視対象システムについて測定データの値を示す。因果構造モデル215は、監視対象システムについての測定データ間の因果関係を示す。
図8は、目的変数値推定プログラム231による処理のフローチャートである。目的変数値推定プログラム231は、検査データレコード171から、因果構造モデル215によって、監視対象目的変数の推定値を計算する。エアーコンディショナの例において、その目的変数、つまり、因果構造モデル215のトップノード216は、例えば、エアーコンディショナが設置されている部屋の室温である。
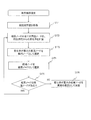
目的変数値推定プログラム231は、検査データデータベース233から、検査データレコード171を取得する(S101)。目的変数値推定プログラム231は、例えば、新たな検査データレコード171が検査データデータベース233に追加されると、本処理を開始する。その場合、目的変数値推定プログラム231は、追加された検査データレコード171を検査データデータベース233から取得する。
目的変数値推定プログラム231は、検査データレコード171の運用状態を特定する(S102)。具体的には、目的変数値推定プログラム231は、検査データレコード171の運用状態を示す欄173の値を取得する。監視対象システムの運用状態は、運用状態を示す欄173の値の組(ベクトル)で表わされる。運用状態を示す欄173における一つの欄の値でも異なる場合、運用状態は異なる。
目的変数値推定プログラム231は、モデルデータベース222において、検査レコードの運用状態とマッチする因果構造モデルを検索する(S103)。具体的には、目的変数値推定プログラム231は、運用状態を指定して、因果構造モデルの検索をモデル管理装置220に依頼する。モデル管理プログラム221は、指定された運用状態と同一の運用状態の因果構造モデルを、モデルデータベース222において検索する。後述するように、モデルデータベース222は、異なる複数の運用状態に対応する因果構造モデルを格納している。運用状態それぞれに対応した因果構造モデルを用意することで、より適切な正常/異常判定及び異常原因の推定が可能となる。
モデル管理プログラム221は、指定された運用状態と一致する因果構造モデルが存在しない場合、それを示す返答を因果構造モデル推定装置210に送信する。指定された運用状態と一致する因果構造モデルが存在する場合、モデル管理プログラム221は、その因果構造モデルを因果構造モデル推定装置210に送信する。
検査データレコード171とマッチする因果構造モデルが存在しない場合(S104:NO)、目的変数値推定プログラム231は、検査データレコードに対応する因果構造モデルが存在しないことを示す警告を、クライアント装置240において表示する(S105)。具体的には、目的変数値推定プログラム231は、上記表示の画像データをクライアント装置240に送信する。クライアント装置240は、その表示デバイスにおいて、上記画像を表示する。
なお、検査データレコード171とマッチする因果構造モデルとは、それらの運用状態ベクトルが完全一致でなくともよい。例えば、運用状態の類似度が所定値より高く、最も類似度が高い因果構造モデルを、検査データレコードにマッチする因果構造モデルと決定してもよい。類似度の計算方法は任意であり、例えば、コサイン類似度を使用できる。
検査データレコード171とマッチする因果構造モデルが存在する場合(S104:YES)、目的変数値推定プログラム231は、当該因果構造モデルを取得し、当該因果構造モデルを使用して、検査データレコード171から、監視対象目的変数の推定値を計算する(S106)。検査データレコード171とマッチする因果構造モデルを使用することで、正確に監視対象目的変数の値を推定することができる。
具体的には、目的変数値推定プログラム231は、検査データレコード171から、因果構造モデル215の最下層のノードに対応する値を抽出する。因果構造モデル215の各ノードの値は、検査データレコード171に含まれる。目的変数値推定プログラム231は、因果構造モデル215に従って、最下層のノードの値から、トップのノードの値を計算する。トップのノードの値は、監視対象目的変数の推定値である。
目的変数値推定プログラム231は、計算した推定値を、メモリ312に出力する(S107)。また、目的変数値推定プログラム231は、推定値をクライアント装置240に送信する。クライアント装置240は、その表示デバイスにおいて、推定値を表示する。
目的変数値推定プログラム231は、計算した推定値、並びに、推定値の計算に使用した検査データレコード171及び因果構造モデル215を特定する情報を、履歴情報として、補助記憶装置313に格納する。検査データレコード171及び因果構造モデル215の情報は、それらを特定する情報により、検査データデータベース223及びモデルデータベース222からそれぞれ取得できる。
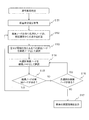
図9は、乖離判定プログラム232による処理のフローチャートである。乖離判定プログラム232は、目的変数値推定プログラム231が計算した目的変数の推定値と、検査データレコード171に含まれる目的変数の実測値の乖離度を計算し、その乖離度に基づいて、監視対象システムにおける異常の有無を推定する。エアーコンディショナの例において、例えば、乖離判定プログラム232は、室内温度の推定値と実測値との間の乖離度を計算する。
図9を参照して、乖離判定プログラム232は、検査データレコード171から目的変数の実測値を取得する(S131)。乖離判定プログラム232は、その実測値と、目的変数値推定プログラム231が計算した目的変数の推定値と、を比較し(S132)、推定精度を計算する(S133)。推定精度は乖離度の例であり、例えば、(1-|実測値-推定値|/実測値)で計算される。
乖離判定プログラム232は、計算した推定精度と所定の閾値とを比較する(S134)。推定精度が閾値以上である場合(S134:NO)、乖離判定プログラム232は、検査データレコード171(監視対象システム)は正常であり、異常がないと判定する(S135)。
推定精度が閾値より小さい場合(S134:YES)、乖離判定プログラム232は、検査データレコード171(監視対象システム)において異常が存在すると判定し、検査データレコードが異常であることを警告する(S136)。具体的には、乖離判定プログラム232は、監視対象システムに異常があることを示す警告をクラインと装置240に送信する。クライアント装置240は、その警告を表示デバイスにおいて表示する。
乖離判定プログラム232は、計算した推定精度、正常/異常判定結果、及び検査データレコード171を同定する情報を、履歴情報として補助記憶装置313に格納する。検査データレコード171は、それを同定する情報を使用して、検査データデータベース223から取得できる。
検査データレコード171において異常があると判定された場合、乖離判定プログラム232は、因果構造モデル215において、異常の原因を推定(探索)する(S137)。異常原因の推定の詳細は後述する。
上述のように、検査データ乖離判定装置230は、因果構造モデル215の最下層のノードに検査データレコードの測定値を入力し、上層の複数層のノード(中間ノード)の推定値を因果構造モデル215において順次計算する。検査データ乖離判定装置230は、最終的に得られるトップノードの値(目的変数の値)と検査データレコードの実測値との乖離に基づいて、異常が発生しているか判定する。
階層構造を有する因果構造モデルにおいて、階層的にノードの値を推定することで、異常を迅速に発見することができる。具体的には、因果構造モデル215における階層的推定において、何れかのノードの異常は、上層に伝播する。したがって、因果構造モデル215において、複数層に渡って推定値の計算を行うことで、推定値の異常(実測値からの乖離)が増大する。これにより、より早く監視対象システムにおける異常を検出することが可能である。
なお、検査データレコードの値は、因果構造モデル215における最下層と異なる層のノードに入力されてもよい。監視対象目的変数のノードと検査データを入力するノードとの間に1又は複数の中間ノードが存在する場合、異常の早期検出が可能となる。監視対象目的変数のノードは、モデルデータベース222に格納されている因果構造モデルにおける、中間ノードであってもよい。つまり、監視対象目的変数のノードから上層ノードに向かうエッジが存在してもよい。推定値の計算においては、監視対象目的変数のノードが、トップノードとして扱われる。
図10、11及び12は、クライアント装置240が表示するグラフィカルユーザインタフェース(GUI)画像の例を示す。図10は、監視対象の監視画像400の例を示す。監視画像400は、検査データレコード171の検査結果を示す。具体的には、監視画像400は、検査データレコードの取得時刻401、監視対象の目的変数の実測値402、目的変数の推定値403、及び正常/異常の判定結果404を含む。本例において、目的変数の値は、センサAにより測定される。判定結果404は乖離判定プログラム232から通知され、それ以外の情報は目的変数値推定プログラム231から送信される。
監視画像400は、さらに、モデルチェックボタン405、実測値及び推定値の履歴を表示するためのボタン406、及び、他のセンサデータ(目的変数)の情報を表示させるためのボタン407を含む。監視画像400により、ユーザは、監視対象の正常/異常の情報を含む、監視情報を知ることができる。
図11は、監視画像400においてモデルチェックボタン405がユーザにより選択された場合の画像例410を示す。モデルチェックボタン405が選択されると、目的変数の推定値の計算に使用された因果構造モデルが表示される。因果構造モデル推定装置210(例えば目的変数値推定プログラム231)は、クライアント装置240からの要求に応答して、推定値の計算に使用した因果構造モデルの情報をクライアント装置240に送信する。
画像410において、因果構造モデルは、運用状態1の因果構造モデルである。画像410は、因果構造モデルのグラフ画像411及びノード間の関係を示す回帰式412を含む。ボタン413は、他の運用状態のモデルの表示を可能とする。画像410により、ユーザは、因果構造モデルをチェックできる。
図12は、監視画像400においてボタン406がユーザにより選択された場合の画像例420を示す。画像420は、監視対象の目的変数の実測値、推定値及び推定精度の履歴を示す。これらの情報は、検査データ乖離判定装置230から取得される。画像420は、実測値、推定値及び推定精度の履歴を示すテーブル421、実測値の履歴(時間変化)を示すグラフ422、及び、推定値の履歴(時間変化)を示すグラフ423を含む。画像420により、ユーザは、実測値、推定値及び推定精度の履歴をチェックできる。
次に、因果構造モデル215において、異常の原因を推定する処理(S137)を説明する。図13は、異常の原因のノードを推定する方法例を模式的に示す。本例は、監視対象目的変数のノード216からエッジに沿って下層に向かって異常原因のノードを探索する。
具体的には、乖離判定プログラム232は、トップノード216の直下のノードである原因ノードそれぞれの実測値の(同一運用状態における)前回測定からの変化率(乖離の例)を計算する。乖離判定プログラム232は、トップノード216の原因ノードにおいて、前回測定からの変化率が閾値を超えるノードを、異常原因ノード候補と決定する。図13の例において、ノード217が異常原因ノード候補である。
乖離判定プログラム232は、異常原因ノード候補の原因ノードそれぞれの実測値の変化率を計算する。乖離判定プログラム232は、変化率が閾値を超えるノードを、異常原因ノード候補と決定する。図13の例において、ノード218が異常原因ノード候補である。
乖離判定プログラム232は、上記処理を、推定値の計算において検査データを入力した層(本例において最下層)まで繰り返す。途中の層において、全ての原因ノードの変化率が閾値以下である場合、新たな異常原因ノード候補の探索は、終了する。乖離判定プログラム232は、発見された全ての異常原因ノード候補を、ユーザに提示する。
乖離判定プログラム232は、異常原因ノード候補において、その直下のノードが異常原因ノードではないノードを選択して、異常原因ノード候補としてユーザに提示してもよい。乖離判定プログラム232は、変化率が最大のノードを選択して、異常原因ノード候補としてユーザに提示してもよい。
図14は、図13を参照して説明した異常原因ノード推定方法のフローチャートである。乖離判定プログラム232は、因果構造モデル215の前回の検査データレコード(測定値)を、検査データデータベース223から取得する(S151)。乖離判定プログラム232は、前回の検査データレコードにおける測定値と今回の検査データレコードの測定値とを比較して、結果ノードの全ての原因ノードの測定値の変化率を計算する(S152)。最初に選択される結果ノードは、監視対象目的変数のノード216である。
乖離判定プログラム232は、変化率が閾値を超える全ての原因ノードを異常原因ノード候補として選択する(S153)。閾値はノードに共通又はノード毎に設定されている。乖離判定プログラム232は、未選択の異常原因ノード候補を結果ノードとして選択し(S154)、その原因ノードが存在するか判定する(S155)。
原因ノードが存在する場合(S155:YES)、乖離判定プログラム232は、選択している結果ノードについて、ステップ152及び153を実行する。原因ノードが存在していない場合(S155:NO)、乖離判定プログラム232は、未選択の異常原因候補ノードが存在するか判定する(S156)。
未選択の異常原因候補ノードが存在する場合(S156:YES)、乖離判定プログラム232は、新たに、未選択の異常原因候補ノードを選択する(S154)。未選択の異常原因候補ノードが存在しない場合(S156:NO)、乖離判定プログラム232は、これまでに選択した異常原因候補ノードを出力する(S157)。例えば、乖離判定プログラム232は異常原因候補ノードの情報をクライアント装置240に送信し、クライアント装置240はその情報を表示する。
異常の原因のノードを推定する他の方法例を説明する。図15は、異常の原因のノードを推定する方法例を模式的に示す。本例は、監視対象目的変数のノード216からエッジに沿って下層に向かって異常原因のノードを探索する。乖離判定プログラム232は、ノード216の原因ノードにおいて、前回測定からの変化率(乖離の例)が最大のノードを、異常原因ノード候補と決定する。図15の例において、ノード217が異常原因ノード候補である。
乖離判定プログラム232は、異常原因ノード候補217の原因ノードそれぞれの実測値の変化率を計算する。乖離判定プログラム232は、変化率が最大のノードを、異常原因ノード候補と決定する。図15の例において、ノード218が異常原因ノード候補である。
乖離判定プログラム232は、上記処理を、推定値の計算において検査データを入力した層(本例において最下層)まで繰り返す。乖離判定プログラム232は、発見された全ての異常原因ノード候補において、変化率が最大のノードを最も可能性が高い異常原因ノード候補として選択する。乖離判定プログラム232は、選択した異常原因ノード候補を、ユーザに提示する。図15の例において、ノード217が最も可能性が高い異常原因ノード候補である。なお、乖離判定プログラム232は、全ての異常原因ノード候補をユーザに提示してもよい。
図16は、図15を参照して説明した異常原因ノード推定方法のフローチャートである。乖離判定プログラム232は、因果構造モデル215の前回の検査データレコード(測定値)を、検査データデータベース223から取得する(S171)。乖離判定プログラム232は、前回の検査データレコードにおける測定値と今回の検査データレコードの測定値とを比較して、結果ノードの全ての原因ノードの測定値の変化率を計算する(S172)。最初に選択される結果ノードは、監視対象目的変数のノード216である。
乖離判定プログラム232は、変化率が最大の原因ノードを異常原因ノード候補として選択する(S173)。乖離判定プログラム232は、異常原因ノード候補を結果ノードとして選択し(S174)、その原因ノード(直下のノード)が存在するか判定する(S175)。原因ノードが存在する場合(S175:YES)、乖離判定プログラム232は、ステップS172に戻る。
原因ノードが存在しない場合(S175:NO)、乖離判定プログラム232は、異常原因ノード候補のうち、最も変化率が大きいノードを、最も可能性が高い、異常原因ノード候補と決定する(S176)。さらに、乖離判定プログラム232は、例えば、最も可能性が高い、異常原因候補ノードの情報をクライアント装置240に送信し、クライアント装置240はその情報を表示する。
上述のように、因果構造モデルにおいて監視対象目的変数のノードからエッジに沿って異常原因ノード候補を探索することで、迅速かつ適切に異常原因ノード候補を特定することができる。
図13及び14を参照して説明した方法において、異常原因ノード候補の決定のために、直前の値と現在の値との変化率に代えて、直前の複数の測定値の平均値(移動平均値)と現在の値の変化率を使用してもよい。他の例において、実測値の変化率に代わり、実測値と推定値の間の推定精度(乖離)を使用してもよい。乖離判定プログラム232は、各ノードの推定精度を計算し、推定精度が閾値より低いノードを異常原因ノード候補と決定する。最下層のノードは推定値が計算されないため、実測値の変化率を使用する。
図15及び16を参照して説明した方法において、異常原因ノード候補の決定のために、直前の値から現在の値への変化率に代えて、直前の複数の測定値の平均値(移動平均値)から現在の値への変化率を使用してもよい。他に例において、実測値の変化率に代わり、実測値と推定値の間の推定精度(乖離度)を使用してもよい。最下層のノードは推定値が計算されないため、実測値の変化率を使用する。最下層のノードと中間層のノードの比較のため、最下層のノードの実測値の変化率は補正される。
[因果構造モデルの推定]
次に、因果構造モデル推定装置210が因果構造モデルを推定(生成)する処理を説明する。因果構造モデル推定プログラム211は、学習データデータベース212に格納されている学習データを分析し、因果構造モデルを推定(生成)する。因果構造モデル推定プログラム211は、任意の方法で因果構造モデルを推定してよい。以下において、その一例を説明する。
次に、因果構造モデル推定装置210が因果構造モデルを推定(生成)する処理を説明する。因果構造モデル推定プログラム211は、学習データデータベース212に格納されている学習データを分析し、因果構造モデルを推定(生成)する。因果構造モデル推定プログラム211は、任意の方法で因果構造モデルを推定してよい。以下において、その一例を説明する。
図17は、因果構造モデル推定プログラム211による因果構造モデルの推定のフローチャートである。因果構造モデル推定プログラム211は、ユーザから、クライアント装置240を介して、学習データに含まれる複数の測定値(測定データ)における、監視対象目的変数(例えば室温)の指定を受け付ける(S201)。
因果構造モデル推定プログラム211は、指定された監視対象目的変数に関連する測定値を、学習データから、所定のアルゴリズムにより抽出する(S202)。因果構造モデル推定プログラム211は、関連する測定値から、非線形値を計算し、新たな関連測定値として追加する(S203)。非線形値は、例えば、測定値の2乗や、異なる測定値の積である。
因果構造モデル推定プログラム211は、関連測定値から、説明変数候補を選択する(S205)。例えば、因果構造モデル推定プログラム211は、関連測定値の間の単回帰分析を行い、相関係数が所定値より大きい関連値群が同一グループとなるように、関連測定値をグループ化する。さらに、グループ毎に1つの関連測定値を任意に選択し、説明変数候補と決定する。
因果構造モデル推定プログラム211は、説明変数候補に関する重回帰分析(例えば変数増減法)を実行し(S206)、目的変数の回帰式を算出する。この線形重回帰分析の結果、目的変数の回帰式は、説明変数の線形式で表わされる。因果構造モデル推定プログラム211は、回帰式を非線形項で構成してもよい。
次に、因果構造モデル推定プログラム211は、その回帰式が予め設定した完了条件を満たしているかを判定する(S207)。完了条件は、例えば、ユーザが予め設定した関連測定値が説明変数として抽出されることや、使用している学習データにより新たなノードが生成されないことである。完了条件が満たされていない場合(S207:NO)、因果構造モデル推定プログラム211は、説明変数それぞれを新たな目的変数と決定し、未選択の関連データから説明変数候補を選択する(S204)。
因果構造モデル推定プログラム211は、説明変数候補の線形重回帰分析により、目的変数それぞれの回帰式を決定する。重回帰分析を逐次的に繰り返すことで、KPIデータに関する因果構造モデルの全体が自動推定される。
完了条件が満たされている場合(S207:YES)、因果構造モデル推定プログラム211は、作成した因果構造モデルをモデル管理装置220に送信し、モデルデータベース222に格納する。
[学習期間の設定]
次に、因果構造モデルを推定するために使用する学習データの期間を決定する方法を説明する。学習期間が短いと、その分得られるデータ点数が少ないため、滅多に起きない事象が捉えることができない。また、全ての事象が起こる期間を事前に特定することは困難である。したがって、適切な期間の学習データを使用することが重要である。図18に示すように、学習が進むと、推定される因果構造モデル219のノード数が増加する(成長する)。以下に説明する例は、因果関係の成長度合いを測定し、所定の成長の伸びが見られなくなった期間を適切な学習期間と決定する。
次に、因果構造モデルを推定するために使用する学習データの期間を決定する方法を説明する。学習期間が短いと、その分得られるデータ点数が少ないため、滅多に起きない事象が捉えることができない。また、全ての事象が起こる期間を事前に特定することは困難である。したがって、適切な期間の学習データを使用することが重要である。図18に示すように、学習が進むと、推定される因果構造モデル219のノード数が増加する(成長する)。以下に説明する例は、因果関係の成長度合いを測定し、所定の成長の伸びが見られなくなった期間を適切な学習期間と決定する。
以下で説明する例においては、類似システムの因果構造モデルの成長度が閾値未満となる学習期間を、対象システムの学習期間と決定する。類似システムはユーザにより選択される。図19は、因果構造モデル推定プログラム211が学習期間を決定する処理のフローチャートを示す。
因果構造モデル推定プログラム211は、類似システムの因果構造モデルのための学習期間を[t_0、t_1]と設定する(S221)。因果構造モデル推定プログラム211は、期間[t_0、t_1]の学習データを、学習データデータベース212から取得する(S222)。因果構造モデル推定プログラム211は、学習データを使用して、因果構造モデルを推定する(S223)。因果構造モデルの推定は上述の通りである。
因果構造モデル推定プログラム211は、推定した因果構造モデルの再現率が、閾値を超えるか判定する(S224)。再現率が閾値を超える場合(S224:YES)、因果構造モデル推定プログラム211は、出力された因果構造モデルのノード数をカウントする(S225)。
再現率が閾値以下である場合(S224:NO)、追加されたΔT部分は異常値を含むので、因果構造モデル推定プログラム211は、当該期間を学習期間から除く(S226)。因果構造モデル推定プログラム211は、因果構造モデルの成長度を計算する(S227)。成長度は、(今回のノード数-前回のノード数)/今回のノード数で計算できる。因果構造モデル推定プログラム211は、計算した成長度と閾値とを比較する(S228)。
成長度が閾値以上である場合(S228:NO)、因果構造モデル推定プログラム211は、学習期間を延ばし(t_1=t_1+ΔT)(S229)、ステップS202に戻る。成長度が閾値未満である場合(S228:YES)、因果構造モデル推定プログラム211は、期間[t_0、t_1]に基づき、対象システムの因果構造モデルを推定するための学習期間を決定する。例えば、期間[t_0、t_1]を対象システムの因果構造モデルを推定するための学習期間と決定する(S230)。
[正常/異常判定の閾値の設定]
次に、因果構造モデルによる目的変数の推定値と実測値とを比較して正常/異常の判定を行うための閾値の設定方法を説明する。適切な閾値を設定することで、監視対象システムの異常を適切に発見することができる。
次に、因果構造モデルによる目的変数の推定値と実測値とを比較して正常/異常の判定を行うための閾値の設定方法を説明する。適切な閾値を設定することで、監視対象システムの異常を適切に発見することができる。
図20は、閾値設定方法の概要を説明するための、推定精度の時間変化と閾値との関係を示すグラフである。グラフにおいて示されている推定精度は、個々の運用状態に閾値が設定される場合にいずれかの運用状態の推定精度であり、閾値が全て運用状態に共通の場合に全ての運用状態における推定精度である。
閾値301は推定精度の底点323と一致し、閾値302は推定精度の底点324と一致している。底点321及び322は底点324より小さく、底点324は底点323より小さい。底点321及び322において、監視対象システムは実際の異常を示している。底点323及び324において、監視対象システムは正常である。
閾値301よりも低い値を示す底点324において、監視対象システムは正常である。一方、閾値302より低い全ての底点321及び322において、監視対象システムは実際の異常を示している。したがって、閾値302は閾値301よりも適切である。閾値を閾値302に設定する又は閾値301から閾値302に更新することで、より適切な判定が可能となる。
図21は、乖離判定プログラム232による初期閾値設定のフローチャートを示す。乖離判定プログラム232は、因果構造モデルによる学習データレコードそれぞれの推定精度を計算する(S241)。乖離判定プログラム232は、最も低い推定精度の学習データレコードを選択する(S242)。乖離判定プログラム232は、選択した学習データレコードが保守記録を含むか判定する(S243)。
選択した学習データレコードが保守記録を含まない場合(S243:NO)、乖離判定プログラム232は、非選択の学習データレコードから最も低い推定精度の習データレコードを選択し(S244)、ステップS243に戻る。選択した学習データレコードが保守記録を含む場合(S243:YES)、乖離判定プログラム232は、選択した学習データレコードの推定精度を閾値に設定する(S245)。学習データレコードが保守記録を含むことは、監視対象システムにおいて異常が発生したことを意味する。
図22は、乖離判定プログラム232による閾値更新のフローチャートを示す。乖離判定プログラム232は、検査データデータベース233から選択した検査データレコードの推定精度を計算する(S261)。乖離判定プログラム232は、推定精度が閾値未満であるか判定する(S262)。
推定精度が閾値未満である場合(S262:YES)、乖離判定プログラム232は、当該検査データレコードは異常と判定する(S263)。推定精度が閾値以上である場合(S262:NO)、乖離判定プログラム232は、当該検査データレコードは正常と判定する(S264)。
乖離判定プログラム232は、当該検査データレコードの保守記録をチェックする(S265)。本例において、検査データレコードは、当該検査データレコードに対する保守記録を格納するフィールドを含む。乖離判定プログラム232は、推定精度に基づく正常/異常判定が正しいか、保守記録の有無に基づき判定する(S266)。
具体的には、推定精度に基づく判定が異常である場合、保守記録が存在すればその判定は正しく、保守記録がない場合その判定は正しくない。判定が正しい場合(S266:YES)、乖離判定プログラム232は、現在の閾値を維持する(S268)。判定が正しくない場合(S266:NO)、乖離判定プログラム232は、閾値を当該検査データレコードの推定精度に基づき閾値を更新する。例えば、当該検査データレコードの推定精度が新たな閾値とされる(S267)。
[運用状態に応じた因果構造モデルの推定]
次に、監視対象システムの運用状態それぞれに応じた因果構造モデルの推定を説明する。運用状態それぞれに応じた因果構造モデルにより、より適切な正常/異常判定が可能となる。
次に、監視対象システムの運用状態それぞれに応じた因果構造モデルの推定を説明する。運用状態それぞれに応じた因果構造モデルにより、より適切な正常/異常判定が可能となる。
図23は、監視対象システムの運用状態毎の因果構造モデルの推定を説明する図である。因果構造モデル推定プログラム211は、学習データデータベース212から、運用状態毎に学習データ331を取得し、運用状態それぞれの因果構造モデル215を推定する(S31)。
図23において、運用状態1~運用状態Nの学習データが存在し、例として、運用状態1の学習データが符号331で指示されている。また、運用状態1~運用状態Nそれぞれの因果構造モデルが推定され、例として、運用状態1の因果構造モデルが符号215で指示されている。
図24は、学習データデータベース212の構成例を示す。学習データデータベース212は複数の学習データレコード351を含む。図24においては、一つの学習レコードが例として符号351で指示されている。学習データレコード351は、監視対象システムの状態の情報、センサにより測定されたデータから得られる値、及び保守記録を含む。
学習データデータベース212は、時刻欄352、監視対象システムの状態(運用状態)を示す欄353測定データの欄354、及び保守記録の欄355を含む。図24の例において、日付は省略されている。時刻欄352、監視対象システムの状態(運用状態)を示す欄353及び測定データの欄354の内容は、図7を参照して説明した検査データデータベース223と同様である。
図25は、運用状態1の学習データ331を示す。監視対象システムの運用状態は、複数種類の状態(状態A、状態B・・・)の値で定義される。いずれか一つの状態(欄)の値が異なると、運用状態は異なる。特定の運用状態の学習データ331は、因果構造モデルの推定時に学習データデータベース212から選択されてもよく、運用状態毎の学習データが、学習データデータベース212において、予め分類されていてもよい。
[未来における目的変数値の予測]
次に、未来の時刻を入力すると、該当時刻の目的変数の予測値を出力する因果構造モデルを説明する。これにより、監視対象のシステムにおける、将来の異常の発生を予測することができる。ユーザは、異常の発生を防止することができる。因果構造モデル推定プログラム211は、監視対象の目的変数の時間変化を予測可能な因果構造モデルを構築する。目的変数値推定プログラム231は、当該因果構造モデルと時刻情報に基づき、監視対象の目的変数の時間変化を予測する。
次に、未来の時刻を入力すると、該当時刻の目的変数の予測値を出力する因果構造モデルを説明する。これにより、監視対象のシステムにおける、将来の異常の発生を予測することができる。ユーザは、異常の発生を防止することができる。因果構造モデル推定プログラム211は、監視対象の目的変数の時間変化を予測可能な因果構造モデルを構築する。目的変数値推定プログラム231は、当該因果構造モデルと時刻情報に基づき、監視対象の目的変数の時間変化を予測する。
図26は、運用状態変化と推定精度の関係を模式的に示す。目的変数値推定プログラム231は、過去の実績運用状態変化501のパターンに類似するパターンの運用状態変化を学習データデータベース212において捜し、見つけた運用状態変化の後の運用状態変化を、予測運用状態変化502に適用する。運用状態変化は、ベクトルで表わすことができ、目的変数値推定プログラム231は、ベクトル間の類似度により、類似するパターンの運用状態変化を選択できる。例えば、類似度が最も高いパターン又は閾値を超えるパターンの運用状態変化が選択される。
目的変数値推定プログラム231は、予測運用状態変化502の運用状態それぞれに対応する因果構造モデルを選択し、監視対象の目的関数の予測値を計算する。推定精度の時間変化のグラフ505において、範囲503は過去の実績値を示し、範囲504は予測値を示す。範囲503及び範囲504は、それぞれ、実績運用状態変化501及び予測運用状態変化502に対応している。
図27は、監視対象の目的変数の時間変化を予測可能な因果構造モデルを推定するための学習データを格納する学習データデータベース212の構成例を示す。学習データデータベース212は、測定データの欄354に、時刻の欄を含む。
図28は、監視対象の目的変数の時間変化を予測可能な因果構造モデルの例215を示す。因果構造モデル215において、最下層のノード(原因ノードが存在しないノード)511は、時刻の関数で表わされる。図17を参照して説明した因果構造モデルの推定において、因果構造モデル推定プログラム211は、説明変数のノードの測定値が時刻である場合に、そのノードを最下層のノードと決定する。目的変数値推定プログラム231は、最下層ノード511に時刻を入力して、監視対象の目的変数のノード216の予測値を決定する。
図29は、因果構造モデル215による目的変数の予測値の表示例を示す。クライアント装置240は、目的変数値推定プログラム231から、当該画像データを取得し、出力デバイス317において表示する。
グラフ521において、横軸は時刻、縦軸は目的変数を示す。範囲522は、目的変数の実績値を示し、範囲523は目的変数の予測値を示す。範囲523において、目的変数の値は、各時刻を入力とする因果構造モデル215の出力値である。時刻t2の予測値は、閾値524に達している。目的変数値推定プログラム231は、予測値が閾値に達する時刻を異常発生予測時刻と決定し、ユーザに提示する。
[監視画像]
次に、クライアント装置240において表示される監視画像例を説明する。図30は、監視画像例530を示す。監視画像530は、因果構造モデルによって異常検出された場合に異常発生個所を表示し、さらに、異常個所における推定値と実測値との間の乖離を表示する。監視画像530は、セクション531、532及び533を含む。
次に、クライアント装置240において表示される監視画像例を説明する。図30は、監視画像例530を示す。監視画像530は、因果構造モデルによって異常検出された場合に異常発生個所を表示し、さらに、異常個所における推定値と実測値との間の乖離を表示する。監視画像530は、セクション531、532及び533を含む。
セクション531は、監視対象システム(システム1)の監視多少の目的変数の実測値の時間変化541及び推定値の時間変化542を示す。実測値の時間変化541は実線で表わされ、推定値の時間変化542は破線で表わされている。セクション531は、監視対象システムの複数の運用状態の値を示す。図30の例は、運用状態A及びその次の運用状態Bの実測値及び推定値を示す。
セクション531は、運用状態Aにおける正常/異常判定の閾値A545及び運用状態Bにおける正常/異常判定の閾値B546を破線で示す。セクション531は、さらに、運用状態Aにおける異常個所543及び運用状態Bにおける異常個所544を、ハッチングパターンで埋められた円で示す。異常個所543はドットパターンで埋められ、異常個所544は斜線パターンで埋められている。斜線パターンはドットパターンよりも視認されやすい。
セクション532は、リストボックス551によってユーザに運用状態の選択を可能とする。図30の例において、運用状態Bが選択されている。セクション532は、選択された運用状態の推定値の時間変化のグラフ552を表示する。
セクション531は、リストボックス551で選択された運用状態の異常個所を、選択されていない運用状態の異常個所よりも視認性が高い画像で示す。図30の例において、リストボックス551で選択された運用状態の異常個所を斜線パターンで示し、選択されていない運用状態の異常個所をドットパターンで示す。いすれの運用状態も選択されていない場合、セクション531は、最初の異常個所を視認性が高いパターンで示し、それ以外の異常個所を視認性が低いパターンで示す。
セクション532は、ボタン553を含む。ユーザによってボタン553が選択されると、セクション533は、リストボックス551で選択されている運用状態の因果構造モデル561を表示する。因果構造モデル561は、さらに、異常原因候補のノードを明示する。図30の例において、異常原因候補ノード(X3及びX5)は太線で示されている。
セクション533は、ボタン562及び563を含む。ユーザによってボタン562が選択されると、運用状態Bの警告履歴が表示される。また、ボタン563が選択されると、運用状態Bにおけるシステムの保守履歴が表示される。
上述のように、監視画像530は、監視対象システムの監視において、検出された異常及びその原因候補ノードをユーザに容易かつ適切に提示することができる。監視画像530を作成するためのデータは、検査データ乖離判定装置230からクライアント装置240に送信される。
図31は、警告メッセージの例600を示す。警告メッセージ600は、警告内容601及びボタン602~605を含む。警告内容601は、警告の詳細を示す。ボタン602が選択されると、警告メッセージの対象の因果構造モデルが表示される。ボタン603が選択されると、保守記録の入力画像が表示される。ボタン604が選択されると、当該警告メッセージを含む警告メッセージの履歴が表示される。ボタン605が選択されると、対応する目的変数の監視における実測値及び推定値の履歴が表示される。
図32は、保守記録の入力画像620を示す。ユーザは、保守記録の入力画像620において必要な情報を入力する。入力された情報は、検査データ乖離判定装置230に送信され、補助記憶装置313に格納される。また、入力された情報の一部は、検査データデータベース233に格納される。
なお、本発明は上記した実施例に限定されるものではなく、様々な変形例が含まれる。例えば、上記した実施例は本発明を分かりやすく説明するために詳細に説明したものであり、必ずしも説明したすべての構成を備えるものに限定されるものではない。また、ある実施例の構成の一部を他の実施例の構成に置き換えることが可能であり、また、ある実施例の構成に他の実施例の構成を加えることも可能である。また、各実施例の構成の一部について、他の構成の追加・削除・置換をすることが可能である。
また、上記の各構成・機能・処理部等は、それらの一部又は全部を、例えば集積回路で設計する等によりハードウェアで実現してもよい。また、上記の各構成、機能等は、プロセッサがそれぞれの機能を実現するプログラムを解釈し、実行することによりソフトウェアで実現してもよい。各機能を実現するプログラム、テーブル、ファイル等の情報は、メモリや、ハードディスク、SSD(Solid State Drive)等の記録装置、または、ICカード、SDカード等の記録媒体に置くことができる。また、制御線や情報線は説明上必要と考えられるものを示しており、製品上必ずしも全ての制御線や情報線を示しているとは限らない。実際には殆どすべての構成が相互に接続されていると考えてもよい。
Claims (14)
- 監視対象システムを監視する監視システムであって、
プログラムを格納する1以上の記憶装置と、
前記プログラムに従って動作する1以上のプロセッサと、を含み、
前記1以上のプロセッサは、
前記監視対象システムの検査データに含まれる測定データと前記監視対象システムの因果構造モデルとに基づき、前記監視対象システムの監視対象目的変数の推定値を決定し、
前記検査データに含まれる前記監視対象目的変数の測定値と前記推定値との比較結果に基づき、前記監視対象システムにおいて異常が発生しているか判定する、監視システム。 - 請求項1に記載の監視システムであって、
前記因果構造モデルは、前記測定データに対応する下層ノードと、前記下層ノードより上層における前記監視対象目的変数に対応する監視対象目的変数ノードと、前記下層ノードと前記監視対象目的変数ノードとの間の中間ノードと、を含み、
前記1以上のプロセッサは、前記下層ノードに前記測定データを入力して得られる前記監視対象目的変数ノードの値を、前記推定値と決定する、監視システム。 - 請求項1に記載の監視システムであって、
前記1以上のプロセッサは、前記監視対象システムの測定データを含む学習データに基づき前記因果構造モデルを推定する、監視システム。 - 請求項2に記載の監視システムであって、
前記1以上のプロセッサは、
前記因果構造モデルにおいて、前記監視対象目的変数のノードからエッジに沿って異常原因ノード候補の探索を行い、
前記探索において、異常判定ノード候補と判定されたノードを目的変数ノードとする説明変数ノードそれぞれが、異常判定ノード候補であるか判定する、監視システム。 - 請求項2に記載の監視システムであって、
前記1以上のプロセッサは、前記推定値を決定するための前記検査データに含まれるに前記中間ノードの測定値と、前記中間ノードの過去の測定値から得られる値との間の乖離に基づき、前記中間ノードが異常原因ノード候補であるか判定する、監視システム。 - 請求項2に記載の監視システムであって、
前記1以上のプロセッサは、前記推定値を決定するための前記検査データに含まれるに前記中間ノードの測定値と、前記測定データを前記下層ノードに入力して得られる前記中間ノードの推定値との間の乖離に基づき、前記中間ノードが異常原因ノード候補であるか判定する、監視システム。 - 請求項5に記載の監視システムであって、
前記1以上のプロセッサは、前記推定値を決定するための前記検査データに含まれるに前記下層ノードの測定値と、前記下層ノードの過去の測定値から得られる値との間の乖離に基づき、前記下層ノードが異常原因ノード候補であるか判定する、監視システム。 - 請求項5に記載の監視システムであって、
前記1以上のプロセッサは、前記乖離が最も大きいノードを異常原因ノード候補と判定する、監視システム。 - 請求項3に記載の監視システムであって、
前記1以上のプロセッサは、
前記監視対象システムと異なる第2システムの第2因果構造モデルの学習期間を、前記第2因果構造モデルの成長度に基づき決定し、
前記学習期間に基づき、前記監視対象システムの前記因果構造モデルを推定するための使用する学習データを選択する、監視システム。 - 請求項1に記載の監視システムであって、
前記1以上のプロセッサは、
前記監視対象目的変数の測定値と前記推定値との間の乖離と閾値との比較結果に基づき、前記監視対象システムにおいて異常が発生しているか判定し、
前記乖離が前記閾値より大きく、前記監視システムの保守が実行されない場合、前記閾値を前記乖離に基づき変更する、監視システム。 - 請求項1に記載の監視システムであって、
前記検査データは、前記監視対象システムの運用状態を示し、
前記因果構造モデルは前記運用状態に対応する因果構造モデルである、監視システム。 - 請求項2に記載の監視システムであって、
前記1以上のプロセッサは、第2因果構造モデルによって、未来における特定時刻における前記監視対象目的変数の予測値を決定し、
前記第2因果構造モデルは、時間の関数で表わされる時間関数ノードと、前記時間関数ノードより上層における前記監視対象目的変数に対応する第2監視対象目的変数ノードと、前記時間関数ノードと前記第2監視対象目的変数ノードとの間の第2中間ノードと、を含み、
前記1以上のプロセッサは、前記時間関数ノードに前記特定時刻を入力して得られる前記第2監視対象目的変数ノードの値を前記予測値と決定する、監視システム。 - 請求項1に記載の監視システムであって、
監視画像を出力する出力デバイスをさらに含み、
前記出力デバイスにおいて、前記監視対象目的変数の測定値の履歴及び推定値の履歴、並びに、前記因果構造モデルにおける異常原因ノード候補を出力する、監視システム。 - 監視システムが監視対象システムを監視する方法であって、
前記監視システムが、前記監視対象システムの検査データに含まれる測定データと前記監視対象システムの因果構造モデルとに基づき、前記監視対象システムの監視対象目的変数の推定値を決定し、
前記監視システムが、前記検査データに含まれる前記監視対象目的変数の測定値と前記推定値との比較結果に基づき、前記監視対象システムにおいて異常が発生しているか判定する、ことを含む方法。
Priority Applications (2)
| Application Number | Priority Date | Filing Date | Title |
|---|---|---|---|
| US17/050,654 US11796989B2 (en) | 2018-09-27 | 2019-02-08 | Monitoring system and monitoring method |
| EP19867453.3A EP3859472B1 (en) | 2018-09-27 | 2019-02-08 | Monitoring system and monitoring method |
Applications Claiming Priority (2)
| Application Number | Priority Date | Filing Date | Title |
|---|---|---|---|
| JP2018181281A JP7036697B2 (ja) | 2018-09-27 | 2018-09-27 | 監視システム及び監視方法 |
| JP2018-181281 | 2018-09-27 |
Publications (1)
| Publication Number | Publication Date |
|---|---|
| WO2020066052A1 true WO2020066052A1 (ja) | 2020-04-02 |
Family
ID=69951310
Family Applications (1)
| Application Number | Title | Priority Date | Filing Date |
|---|---|---|---|
| PCT/JP2019/004735 Ceased WO2020066052A1 (ja) | 2018-09-27 | 2019-02-08 | 監視システム及び監視方法 |
Country Status (4)
| Country | Link |
|---|---|
| US (1) | US11796989B2 (ja) |
| EP (1) | EP3859472B1 (ja) |
| JP (1) | JP7036697B2 (ja) |
| WO (1) | WO2020066052A1 (ja) |
Families Citing this family (18)
| Publication number | Priority date | Publication date | Assignee | Title |
|---|---|---|---|---|
| US11532132B2 (en) * | 2019-03-08 | 2022-12-20 | Mubayiwa Cornelious MUSARA | Adaptive interactive medical training program with virtual patients |
| JP7593005B2 (ja) * | 2020-08-06 | 2024-12-03 | オムロン株式会社 | 表示システム、表示方法、及び表示プログラム |
| JP7593004B2 (ja) * | 2020-08-06 | 2024-12-03 | オムロン株式会社 | 表示システム、表示方法、及び表示プログラム |
| CN111950936B (zh) * | 2020-08-31 | 2023-08-18 | 平安国际智慧城市科技股份有限公司 | 空气质量监测方法、装置、设备及介质 |
| JP7188470B2 (ja) * | 2021-01-28 | 2022-12-13 | 横河電機株式会社 | 分析方法、分析プログラムおよび情報処理装置 |
| JP7506960B2 (ja) * | 2021-06-02 | 2024-06-27 | 株式会社Tmeic | データ管理装置 |
| US20230040564A1 (en) * | 2021-08-03 | 2023-02-09 | International Business Machines Corporation | Learning Causal Relationships |
| CN114297034B (zh) * | 2021-12-31 | 2024-10-18 | 联想(北京)有限公司 | 云平台监控方法及云平台 |
| JP7843648B2 (ja) * | 2022-05-30 | 2026-04-10 | 三菱電機株式会社 | データ解析装置、データ解析方法およびプログラム |
| CN115310567B (zh) * | 2022-10-12 | 2022-12-20 | 合肥凯泉电机电泵有限公司 | 一种基于大数据的污水处理设备运行监测系统及方法 |
| CN115422555B (zh) * | 2022-11-04 | 2023-02-28 | 北京华云安信息技术有限公司 | 后门程序检测方法、装置、电子设备及存储介质 |
| JPWO2024117019A1 (ja) * | 2022-11-29 | 2024-06-06 | ||
| JP7541675B1 (ja) | 2023-02-21 | 2024-08-29 | 国立研究開発法人海洋研究開発機構 | 異常検出システム及び異常検出方法 |
| CN120569679A (zh) * | 2023-03-14 | 2025-08-29 | 三菱电机株式会社 | 流程生成程序、流程生成装置及流程生成方法 |
| JP7781345B2 (ja) * | 2023-04-19 | 2025-12-05 | 三菱電機株式会社 | 監視制御装置 |
| WO2025225041A1 (ja) * | 2024-04-25 | 2025-10-30 | 三菱電機株式会社 | 情報処理装置、情報処理方法および情報処理プログラム |
| CN119249312B (zh) * | 2024-09-02 | 2025-04-11 | 浙江九州拓新信息服务有限公司 | 基于大数据的办公数据综合分析系统 |
| CN119090369B (zh) * | 2024-11-04 | 2025-02-14 | 北京普瑞斯玛电气技术有限公司 | 一种基于机器学习的配电系统智能管理方法 |
Citations (8)
| Publication number | Priority date | Publication date | Assignee | Title |
|---|---|---|---|---|
| JPH09269217A (ja) | 1996-03-29 | 1997-10-14 | Kawasaki Heavy Ind Ltd | 鉄道用軌道の異常検知方法および異常検知装置 |
| JPH10238920A (ja) * | 1997-02-24 | 1998-09-11 | Sanyo Electric Co Ltd | 機器の運転状態管理装置 |
| US7181374B1 (en) * | 2001-05-31 | 2007-02-20 | Vanderbilt University | Qualitative diagnosis system and method |
| JP2009116842A (ja) * | 2007-03-09 | 2009-05-28 | Omron Corp | 要因推定支援装置およびその制御方法、ならびに要因推定支援プログラム |
| WO2010082322A1 (ja) | 2009-01-14 | 2010-07-22 | 株式会社日立製作所 | 装置異常監視方法及びシステム |
| JP2011517807A (ja) * | 2008-03-08 | 2011-06-16 | 東京エレクトロン株式会社 | 生物学に基づく自律学習ツール |
| JP2016045556A (ja) | 2014-08-20 | 2016-04-04 | 日本電信電話株式会社 | ログ間因果推定装置、システム異常検知装置、ログ分析システム、及びログ分析方法 |
| JP2018181281A (ja) | 2017-04-21 | 2018-11-15 | 富士通株式会社 | ストレージシステム、制御装置及びストレージ装置 |
Family Cites Families (10)
| Publication number | Priority date | Publication date | Assignee | Title |
|---|---|---|---|---|
| EP1724717A3 (en) | 2001-03-08 | 2009-07-22 | California Institute Of Technology | Real-time spatio-temporal coherence estimation for autonomous mode identification and invariance tracking |
| JP5297272B2 (ja) * | 2009-06-11 | 2013-09-25 | 株式会社日立製作所 | 装置異常監視方法及びシステム |
| JP5431235B2 (ja) * | 2009-08-28 | 2014-03-05 | 株式会社日立製作所 | 設備状態監視方法およびその装置 |
| JP5150590B2 (ja) * | 2009-09-25 | 2013-02-20 | 株式会社日立製作所 | 異常診断装置及び異常診断方法 |
| JP5427107B2 (ja) * | 2010-05-20 | 2014-02-26 | 株式会社日立製作所 | 監視診断装置および監視診断方法 |
| JP6181589B2 (ja) * | 2014-03-31 | 2017-08-16 | 株式会社Ihi | 計測値解析装置及び計測値解析方法 |
| JP2020507157A (ja) | 2017-01-24 | 2020-03-05 | シーメンス アクチエンゲゼルシヤフトSiemens Aktiengesellschaft | システムの自動化および制御に対するコグニティブエンジニアリング技術のためのシステムおよび方法 |
| JP6661559B2 (ja) | 2017-02-03 | 2020-03-11 | 株式会社東芝 | 異常検出装置、異常検出方法およびプログラム |
| JP7010641B2 (ja) * | 2017-09-27 | 2022-01-26 | パナソニック インテレクチュアル プロパティ コーポレーション オブ アメリカ | 異常診断方法および異常診断装置 |
| JP7063022B2 (ja) * | 2018-03-14 | 2022-05-09 | オムロン株式会社 | 異常検知システム、サポート装置およびモデル生成方法 |
-
2018
- 2018-09-27 JP JP2018181281A patent/JP7036697B2/ja active Active
-
2019
- 2019-02-08 US US17/050,654 patent/US11796989B2/en active Active
- 2019-02-08 EP EP19867453.3A patent/EP3859472B1/en active Active
- 2019-02-08 WO PCT/JP2019/004735 patent/WO2020066052A1/ja not_active Ceased
Patent Citations (8)
| Publication number | Priority date | Publication date | Assignee | Title |
|---|---|---|---|---|
| JPH09269217A (ja) | 1996-03-29 | 1997-10-14 | Kawasaki Heavy Ind Ltd | 鉄道用軌道の異常検知方法および異常検知装置 |
| JPH10238920A (ja) * | 1997-02-24 | 1998-09-11 | Sanyo Electric Co Ltd | 機器の運転状態管理装置 |
| US7181374B1 (en) * | 2001-05-31 | 2007-02-20 | Vanderbilt University | Qualitative diagnosis system and method |
| JP2009116842A (ja) * | 2007-03-09 | 2009-05-28 | Omron Corp | 要因推定支援装置およびその制御方法、ならびに要因推定支援プログラム |
| JP2011517807A (ja) * | 2008-03-08 | 2011-06-16 | 東京エレクトロン株式会社 | 生物学に基づく自律学習ツール |
| WO2010082322A1 (ja) | 2009-01-14 | 2010-07-22 | 株式会社日立製作所 | 装置異常監視方法及びシステム |
| JP2016045556A (ja) | 2014-08-20 | 2016-04-04 | 日本電信電話株式会社 | ログ間因果推定装置、システム異常検知装置、ログ分析システム、及びログ分析方法 |
| JP2018181281A (ja) | 2017-04-21 | 2018-11-15 | 富士通株式会社 | ストレージシステム、制御装置及びストレージ装置 |
Non-Patent Citations (1)
| Title |
|---|
| YANO KOJIN; SUZUKI TETSUSHI; OKADA KENICHIRO; WEI WANG; TAKAYANAGI TAISUKE: "Creating Smart Rail Services Using Digital Technologies 'Data Modeling Technology in Railway Operation and Maintenance", HITACHI REVIEW, vol. 100, no. 5, 20 September 2018 (2018-09-20), pages 96 - 100, XP009523635, ISSN: 0367-5874 * |
Also Published As
| Publication number | Publication date |
|---|---|
| US11796989B2 (en) | 2023-10-24 |
| EP3859472A4 (en) | 2022-06-15 |
| JP7036697B2 (ja) | 2022-03-15 |
| EP3859472A1 (en) | 2021-08-04 |
| EP3859472B1 (en) | 2023-10-25 |
| US20210240174A1 (en) | 2021-08-05 |
| JP2020052714A (ja) | 2020-04-02 |
Similar Documents
| Publication | Publication Date | Title |
|---|---|---|
| JP7036697B2 (ja) | 監視システム及び監視方法 | |
| JP2020052714A5 (ja) | ||
| JP6777069B2 (ja) | 情報処理装置、情報処理方法、及び、プログラム | |
| JP6521096B2 (ja) | 表示方法、表示装置、および、プログラム | |
| JP6489235B2 (ja) | システム分析方法、システム分析装置、および、プログラム | |
| US20160342903A1 (en) | Systems and/or methods for dynamic anomaly detection in machine sensor data | |
| JP2019185422A (ja) | 故障予知方法、故障予知装置および故障予知プログラム | |
| JP6280862B2 (ja) | イベント分析システムおよび方法 | |
| JP2018180759A (ja) | システム分析装置、及びシステム分析方法 | |
| WO2018104985A1 (ja) | 異常分析方法、プログラムおよびシステム | |
| JP2023520066A (ja) | 産業用機械学習のためのデータ処理 | |
| JP5413240B2 (ja) | イベント予測システムおよびイベント予測方法、ならびにコンピュータ・プログラム | |
| US20250231558A1 (en) | System, apparatus and method for monitoring condition of an asset in technical installation | |
| JP7587472B2 (ja) | 機械学習システム及び機械学習システムによる機械学習モデル管理方法 | |
| JPWO2016136198A1 (ja) | システム監視装置、システム監視方法、及び、システム監視プログラム | |
| US10657199B2 (en) | Calibration technique for rules used with asset monitoring in industrial process control and automation systems | |
| JP6915693B2 (ja) | システム分析方法、システム分析装置、および、プログラム | |
| JP6973445B2 (ja) | 表示方法、表示装置、および、プログラム | |
| KR20160053977A (ko) | 모델 적응을 위한 장치 및 방법 | |
| US20230152759A1 (en) | Information processing apparatus, information processing method, and computer program product | |
| CN120958402A (zh) | 监视控制装置以及监视控制系统 | |
| JP7814225B2 (ja) | 監視制御装置、監視制御方法および監視制御プログラム | |
| CN111095868A (zh) | 软件定义网络中的数据流量管理 | |
| RU2777950C1 (ru) | Обнаружение нештатных ситуаций для прогнозного технического обслуживания и определения конечных результатов и технологических процессов на основании качества данных | |
| KR20250040892A (ko) | 프로세스 처리 장치의 진단 장치, 진단 시스템, 및 진단 방법 |
Legal Events
| Date | Code | Title | Description |
|---|---|---|---|
| 121 | Ep: the epo has been informed by wipo that ep was designated in this application |
Ref document number: 19867453 Country of ref document: EP Kind code of ref document: A1 |
|
| NENP | Non-entry into the national phase |
Ref country code: DE |
|
| ENP | Entry into the national phase |
Ref document number: 2019867453 Country of ref document: EP Effective date: 20210428 |