WO2020071050A1 - Dispositif d'affichage - Google Patents
Dispositif d'affichageInfo
- Publication number
- WO2020071050A1 WO2020071050A1 PCT/JP2019/034888 JP2019034888W WO2020071050A1 WO 2020071050 A1 WO2020071050 A1 WO 2020071050A1 JP 2019034888 W JP2019034888 W JP 2019034888W WO 2020071050 A1 WO2020071050 A1 WO 2020071050A1
- Authority
- WO
- WIPO (PCT)
- Prior art keywords
- display
- damage
- risk
- information
- damage occurrence
- Prior art date
- Legal status (The legal status is an assumption and is not a legal conclusion. Google has not performed a legal analysis and makes no representation as to the accuracy of the status listed.)
- Ceased
Links
Images


Classifications
-
- A—HUMAN NECESSITIES
- A01—AGRICULTURE; FORESTRY; ANIMAL HUSBANDRY; HUNTING; TRAPPING; FISHING
- A01G—HORTICULTURE; CULTIVATION OF VEGETABLES, FLOWERS, RICE, FRUIT, VINES, HOPS OR SEAWEED; FORESTRY; WATERING
- A01G7/00—Botany in general
-
- G—PHYSICS
- G08—SIGNALLING
- G08B—SIGNALLING SYSTEMS, e.g. PERSONAL CALLING SYSTEMS; ORDER TELEGRAPHS; ALARM SYSTEMS
- G08B31/00—Predictive alarm systems characterised by extrapolation or other computation using updated historic data
Definitions
- the present invention relates to a display device.
- Patent Documents 1 and 2 Techniques for supporting agricultural work using pesticides are disclosed in, for example, Patent Documents 1 and 2. Specifically, Patent Literature 1 discloses a technique for calculating a pesticide spraying plan for maximizing the crop yield. Patent Literature 2 discloses a technique for calculating a spraying date of a pesticide in consideration of “days before harvest”.
- the present invention has been made in view of the above problems, and an object of the present invention is to present a user with a more easily understandable damage occurrence risk and information relating to the damage occurrence risk. To provide a new and improved display device.
- the present invention indicates a possibility that damage to a crop due to an event of interest may occur, and damage estimated based on environmental information about an environment around the crop.
- the first display indicating the occurrence risk, the second display indicating the damage occurrence information on the occurrence of the damage, and the third display indicating the activity information on the activity for suppressing the damage occurrence risk correspond to the same time axis.
- a display device arranged side by side in a display area.
- the damage occurrence risk, the information on the damage occurrence, and the information on the activity for suppressing the damage occurrence risk are arranged side by side in correspondence with the same time axis, so that each information can be viewed in a time series at a glance. You can check.
- the present invention it is possible to present the damage occurrence risk and information related to the damage occurrence risk to the user in a more understandable manner.
- FIG. 1 is an overall view for explaining a technical outline of the present invention.
- 1 is a block diagram illustrating an example of an information processing system to which the present invention has been applied.
- FIG. 3 is a diagram illustrating an example of a display layout in a display area of a display device to which the present invention has been applied.
- FIG. 14 is a diagram illustrating an example of a modification of a display layout in a display area of a display device to which the present invention has been applied.
- FIG. 1 is a diagram showing an entire information processing system 1 to which the present invention is applied.
- the information processing system 1 to which the present invention is applied estimates the risk of damage caused by the event of interest as infection of the pest to the crop, and presents the risk of damage occurrence and information related to the risk of damage occurrence. I do.
- Damage risk refers to the risk that includes the possibility of infection or infection with a pest and the possibility of damage to the infected crop.
- Infection with a pest means that the disease is transmitted to a crop or, in the case of a pest, is parasitic on a crop.
- Damage to a crop means that the crop is infected with the disease, and the disease manifests itself in the crop by completing the incubation period after the infection.
- the incubation period of the insect damage refers to the period from when the insect lays eggs, when the larva hatches to the egg, when the crop is eaten, and the occurrence of the damage is recognized. It is recognized by farmers confirming that they can be eaten by insects.
- the risk of damage occurrence of the present invention is within the period specified by the user, based on the possibility of past infection or future infection, and the effects of pesticides sprayed in the past or pesticides that can be sprayed from now on. It is estimated that crops may be damaged.
- the information processing system 1 of the present invention presents the estimated damage occurrence risk and information related to the damage occurrence risk to the user in an easily understandable manner.
- the information processing system 1 includes a weather server 20, a cultivation sensor 30, an estimation server 40, and a display device 1000.
- the information processing system 1 estimates the damage occurrence risk by processing the information acquired using the weather server 20, the cultivation sensor 30, the display device 1000, and the like in the estimation server 40, and estimates the estimated damage.
- the occurrence risk and information related to the damage occurrence risk are presented on the display device 1000.
- the functional configuration of the information processing system 1 will be described with reference to FIG.
- the information processing system 1 includes the weather server 20, the cultivation sensor 30, the estimation server 40, and the display device 1000, as described above.
- the weather server 20 has a function of outputting environmental information relating to weather in a region where crops are cultivated, which is used by the estimation server 40.
- the environmental information output by the weather server 20 includes temperature, humidity, solar radiation, rainfall, and the like.
- the environment information output by the weather server 20 may be a past value such as a past weather history, or may be a current value. Further, the environmental information may be a predicted value such as a weather forecast.
- the cultivation sensor 30 has a function of outputting environmental information of a space where a crop is cultivated, which is used by the estimation server 40.
- the space where the crop is cultivated may be a space surrounding the place where the crop is cultivated, and may be, for example, an agricultural facility for cultivating the crop such as a greenhouse. As long as the crop is cultivated, it may not be surrounded, and may be an open space such as a field or a rice field.
- Examples of the environmental information include temperature, humidity, solar radiation, carbon dioxide concentration, and moisture content of the soil in which the crop is cultivated.
- the environment information acquired by the cultivation sensor 30 includes not only a current value but also a predicted value and a past value.
- the estimation server 40 includes an acquisition unit 41, an estimation unit 42, and a display information generation unit 43.
- the estimation server 40 has a function of estimating a damage occurrence risk within a period designated by the user based on the environment information and the medicine information acquired by the acquisition unit 41, and generating display information including the damage occurrence risk.
- the acquisition unit 41 has a function of acquiring environmental information, drug information, and the like used for estimating the risk of damage occurrence.
- the acquiring unit 41 acquires environmental information from the weather server 20 or the cultivation sensor 30.
- the acquisition unit 41 may acquire cultivation information that cannot be obtained from the weather server 20 or the cultivation sensor 30 via the display device 1000 described below.
- the cultivation information may be used when estimating the damage occurrence risk, similarly to the environmental information.
- Cultivation information includes, for example, crop varieties, crop cultivation altitude, soil type, soil nutrient status, crop sowing date and time, planting date and time, crop leaf removal status, pesticide spraying history, pesticide Includes information such as aftereffect status, weeding status, tree vigor status, and crop growth stage.
- the above drug information can be used to take the pesticide effect into account when estimating the risk of damage occurrence.
- the drug information may be obtained from literature or a survey.
- the medicine information includes information indicating a temporal effect of the medicine obtained by using the medicine.
- the medicine information may be information indicating a preventive effect or a therapeutic effect on a crop against pests and the like.
- the estimating unit 42 estimates a risk of damage to the crop based on the environmental information and the drug information acquired by the acquiring unit 41.
- the estimating unit 42 creates a damage occurrence risk model using, for example, the record of the occurrence of the disease and the pest of the crop, the history of the application of the pesticide to the crop, the environmental information until the occurrence of the pest and the disease in the crop, and the like.
- the estimating unit 42 estimates the damage risk of the crop by inputting pesticide application information to the crop for which the damage risk is to be newly estimated, environmental information of the crop, and the like. .
- the display information generation unit 43 has a function of generating display information for realizing the presentation of the damage occurrence risk estimated by the estimation unit 42 and the information related to the damage occurrence risk on the display device 1000.
- the information related to the damage occurrence risk includes damage occurrence information and activity information on activities for suppressing the damage occurrence risk.
- the damage occurrence information includes the type of disease and insect damage that has occurred, the date and time of damage occurrence, and the like.
- examples of the types of pests caused by pests include gray mold, leaf mold, powdery mildew, and plague.
- Activities to reduce the risk of damage include activities such as spraying pesticides and other chemicals on crops.
- the activity is not limited to the application of the drug, but also includes an activity other than the application of the drug, such as adjusting the cultivation environment of the crop, for suppressing the risk of causing damage.
- the adjustment of the cultivation environment specifically includes activities such as adjusting the temperature and humidity in the house in house cultivation.
- the pesticide spraying input to the user as an activity for suppressing the damage occurrence risk is described as an example, but information such as machine measurement data that can be obtained without the user may be used.
- the display information generation unit 43 associates the damage occurrence risk, the damage occurrence information, and the activity information with the same time axis so that a display layout is arranged in the display area of the display device 1000. Generate display information. Then, the display information generation unit 43 outputs display information for realizing a display layout in the display area of the display device 1000 to the display device 1000. A specific example of the display layout will be described later.
- the display device 1000 includes a display information acquisition unit 1100, a display unit 1200, and an operation unit 1300.
- the display device 1000 has a function of acquiring display information from the estimation server 40 and displaying the information on the display unit.
- the display device 1000 also has a function that allows the user to make various inputs to the information processing system 1 via the operation unit 1300.
- the display information obtaining unit 1100 has a function of obtaining display information from the estimation server 40 and outputting the display information to the display unit 1200.
- the display unit 1200 has a function of performing a display including a risk of damage occurrence based on the display information.
- the display unit 1200 has a display area, and can display a damage occurrence risk and information related to the damage occurrence risk in the display area.
- the operation unit 1300 has a function that allows a user to perform various inputs to the information processing system 1.
- the user inputs and operates environmental information that is not acquired by the weather server 20 or the cultivation sensor 30, for example, cultivation information.
- the period for estimating the damage occurrence risk may be input by the user.
- the display device 1000 is formed of a device that can visually notify the user of the acquired display information.
- display devices such as CRT (Cathode Ray Tube) display devices, liquid crystal display devices, plasma display devices, EL (electroluminescence) display devices, laser projectors, LED projectors, and lamps.
- the display device 1000 visually displays the display information including the damage occurrence risk obtained by the various processes performed by the estimation server 40 in various formats such as a text, an image, a table, and a graph.
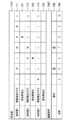
- FIG. 3 is a diagram illustrating an example of a display layout in a display area of the display unit 1200 of the display device 1000.
- the display area is rectangular, and the long side direction is the up-down direction and the short side direction is the left-right direction.
- the display area is rectangular is described as an example.
- the present invention is not limited to such an example, and the display area may have various shapes such as a circular shape and an elliptical shape.
- a main display area 100 in which damage occurrence risk and information related to the damage occurrence risk are displayed, an input display area 200 in which other information is displayed, a pesticide spraying history display area 300, and a pest and disease history display area 400.
- a menu display area 500 capable of shifting the display in the display area to another screen and a page selection display area are arranged vertically.
- a display band 110 to a display band 112 indicating a damage occurrence risk In the main display area 100, a display band 110 to a display band 112 indicating a damage occurrence risk, a display band 120 to a display band 122 indicating a damage occurrence information, a display band 130 indicating activity information for suppressing the damage occurrence risk, are arranged in order from the top in the display area corresponding to the same time axis 140.
- a display band 110 indicating the title of the damage occurrence risk is arranged along the short side direction of the display region, and a lower portion of the display band 110 indicates the damage occurrence risk for each type of pest and disease.
- a display band 111 and a display band 112 are sequentially arranged. At one end (left end) of the display band 111 of the pest 1 is displayed the name of the pest 1 which is the name of the type of the pest.
- the risk display item 111A and the risk display item 111B for displaying the degree are arranged at positions corresponding to the date and time indicated by the time axis 140.
- a display band 112 of the pest 2 is arranged.
- the present invention is not limited to such an example, and may be one type, three or more types, or three or more types.
- a new display band may be displayed below the display band 112 by type.
- the character start position of the type of pest and disease shown in the display band 111 and the display band 112 may be different from the character start position of the title display shown in the display band 110, and may be different from the character start position of the title display shown in the display band 110. It may be started from the right side.
- the risk display item 111A and the risk display item 111B indicating the risk of each day of the damage occurrence risk are represented by a graphic, and the size of the graphic is larger as the damage risk is higher.
- the figure has a circular shape, and the size of the circle is indicated in three stages.
- the circle with the lowest risk of damage occurrence has the smallest diameter
- the circle with the highest risk of damage occurrence has the largest diameter.
- the diameter is shown as a reference for the size of the figure.
- the diameter may be determined as appropriate depending on the figure used.
- the size of the graphic may be determined according to the length of the diameter of a circumscribed circle or an inscribed circle of the graphic.
- the figure not only shows the risk of damage occurrence as the figure is enlarged and reduced, but also, for example, the figure has a plurality of squares, and the area where the squares are painted changes, thereby causing damage.
- the risk may be displayed. Specifically, a plurality of squares are arranged vertically, and the squares to be filled may change according to the risk of damage occurrence. For example, as the risk of occurrence of damage increases, the cells may be painted in order from the bottom in the vertical direction.
- the risk display item 111A has a circular shape, and the inside of the circle is painted black.
- the risk display item 111B has a circular shape, is not painted, and is surrounded by a frame. Such a difference between the risk display item 111A and the risk display item 111B can be determined based on whether the damage occurrence risk is estimated based on a predicted value of the environmental information or based on a past value (including an actually measured value).
- the risk display item 111A indicates the damage occurrence risk estimated using the past value of the environmental information
- the risk display item 111B uses the predicted value of the environmental information, for example, a weather forecast or the like. It shows the estimated risk of damage occurrence.
- the graphic is filled with respect to the past value and the frame of the graphic is displayed with respect to the predicted value.
- the present invention is not limited to such an example, and the display mode may be reversed.
- the risk display item may indicate the damage occurrence risk not only by the size of the graphic, but also by the density of the graphic such as the brightness, saturation, and transparency of the risk display item.
- the brightness of the risk display item may decrease as the damage occurrence risk increases.
- the saturation of the risk display item may decrease as the damage occurrence risk increases.
- the lower the risk of damage occurrence the higher the transparency, the lower the discrimination between the risk display item and the background of the risk display item, and the lower the risk of damage occurrence, the lower the transparency, The discrimination may be increased. In this manner, the damage occurrence risk may be displayed by changing the density at which the figure is painted.
- the risk display item may be not only a figure but also a character. That is, the risk display item may be a display of characters corresponding to the damage occurrence risk. For example, when the damage occurrence risk is in three levels of low, medium, and high, the risk display items may be displayed as characters L, M, and H, respectively.
- a display indicating the title of the damage occurrence information is displayed as a second display.
- a band 120 is arranged.
- a display band 121 for the pest 1 and a display band 122 for the pest 2 which indicate the date and time of occurrence of damage in chronological order for each type of pest, are arranged.
- the type name of the pest and disease are shown, and an occurrence date and time display item 121A for displaying the date and time of the damage occurrence is shown following the type name of the pest and disease.
- the occurrence date and time display item 121A is arranged at a position on the time axis 140 corresponding to the date and time of occurrence of the pest and disease.
- FIG. 3 it is displayed that the pest 1 has occurred on June 17 and that the pest 2 has occurred on June 14.
- damage has occurred in the display band 121 at the date and time when the occurrence date display item 121A is arranged, and no damage has occurred at the date and time when the display of the display item is not arranged. From these displays, for example, the disease and pest 1 that occurred on June 17 is caused by infection around June 10 when the risk of causing the disease and pest 1 is the largest in the display band 111 that displays the damage occurrence risk. It can be considered that damage has occurred.
- the case where the occurrence date and time display item 121A is an asterisk is shown, but the display mode is not limited to this example.
- the display may be different from the risk display item 111A and the risk display item 111B.
- the character start position of the type of pest and disease shown in the display band 121 and the display band 122 may be different from the character start position of the title display shown in the display band 120, and may be different from the character start position of the title display shown in the display band 120. It may be started from the right side.
- a display band 130 indicating an activity for suppressing the risk of causing damage is arranged as a third display.
- a title of an activity for suppressing the risk of damage occurrence is shown, and an activity date / time display item 130A for displaying an activity date / time is shown following the title.
- activity display items are arranged at locations corresponding to June 7 and June 19, respectively.
- a time axis 140 is arranged at the bottom of the main display area 100. Specifically, on the time axis 140, the display band 110, the display band 120, and the display band 130 are arranged in order from the top, and are arranged at the bottom along the display band 130.
- the time axis 140 represents a time change in a short side direction in the display area.
- the time axis 140 is delimited in units of date and time, and indicates from June 4, 2018 to June 21 two days after the current date and time every day.
- the time axis 140 is shown in units of date and time, but may be shown in units of time.
- the time axis 140 can change the displayed time range.
- the time axis from 4 days to 21 days is displayed, and the damage occurrence risk for 18 days is displayed.
- the time axis 140 can be changed by making the displayed time range smaller or larger than 18 days.
- a time before the currently displayed time range can be displayed, or a time after the currently displayed time range can be displayed.
- the user may tap the time axis 140 in the display area and scroll to change the displayed time range by scrolling the displayed range.
- a highlight 150 indicating the position of the current date and time on the time axis 140 is displayed.
- the highlighted display 150 surrounds a display group indicating the same date and time from the display band 111 to the time axis 140 with a rectangular frame. By surrounding it with a rectangular frame, it is easier to grasp the current date and time.
- the figure surrounded by the frame need not be a rectangle.
- the shape may be an ellipse or may be emphasized by hatching or the like without being a rectangular frame.
- a display 160 and a display 170 different from the display of the damage occurrence risk and the like may be displayed above the main display area 100.
- the display 160 may be, for example, a display that displays a title that includes the entire information displayed in the display area. For example, in FIG. 3, since the presentation of the damage occurrence risk is the main display, the display 160 indicates “damage occurrence risk”.
- the display 170 is a display in which the display standard of the time axis 140 can be selected and the displayed time range can be changed.
- June 19, 2018 is displayed on the display 170
- the display band 110 to the display band 130 and the time axis 140 are based on June 19, 15 days before the reference, and The last two days are displayed.
- the date and time of the displayed time axis 140 can be changed by the user tapping the display 170 or the like and selecting the display reference of the time axis 140.
- the reason that the predicted value after the reference date is shown only for about two days is due to the accuracy of the predicted value of the environmental information, and the reliability of the predicted value two days after the current date and time is reduced.
- the range is set to about two days from the current date and time.
- the estimated damage occurrence risk and the time range in which the information related to the damage occurrence risk is presented may be changed based on the accuracy of the predicted value.
- an input display area 200 that allows a user to input activity information and damage occurrence information and includes an input display 210 and an input display 220 is arranged.
- an input display 210 for inputting a pesticide application record of a pesticide application history described later is arranged on the leftmost side, and is arranged rightward of the input display 210 to input a record of a pest and insect occurrence history described later.
- Input display 220 is arranged.
- an example in which two types of input displays are presented has been described. However, the present invention is not limited to such an example, and three or more types of new input displays are input according to information that needs to be input by the user. Following the display 220, they may be sequentially arranged on the right side.
- a pesticide spraying history display area 300 for performing a detailed display of the display band 130 indicating the spraying date and time of the pesticide spraying is arranged.
- a title display 310 indicating the activity content
- an activity date display 311 and an activity type display 312 can be displayed.
- the title display 310 indicates the pesticide spraying record
- the activity date display 311 indicates the pesticide spraying date
- the activity type display 312 indicates the type of the sprayed pesticide. ing.
- an activity day display 311 is shown at the leftmost position in a direction orthogonal to the time axis 140 of the main display area 100.
- the activity day display 311 may display activity days in a wider range than the time range shown on the time axis 140.
- June 4 to 21 are displayed, and June 7 and June 19 are shown as pesticide application days.
- the spraying on June 19 is shown at the top from the top, and the date and time when the pesticide was sprayed is traced back to the date and time when the pesticide was sprayed.
- One day is displayed.
- the four most recent pesticide application days are shown, but the number is not limited to four and may be determined as appropriate.
- the type display 312 of the applied agricultural chemical is shown along with the activity date display 311 in the direction in which the time axis 140 is arranged. That is, in the type display 312, the types of the pesticides sprayed on the activity day display 311 are displayed side by side to the right of the activity day display 311.
- FIG. 3 shows that pesticide 1 was sprayed on June 19, pesticide 2 on June 7, pesticide 3 on May 4, and pesticide 2 on April 1.
- pesticides include, for example, potash green, M7: Bergutto flowable, 17, 12: Justmeat granule wettable powder, and the like.
- the type of the pesticide to be displayed may be any name that allows the user to identify the pesticide, such as the name of the main component of the pesticide, the product name of the sprayed pesticide, and the like.
- a pest and disease history display area 400 that displays details from the display band 120 indicating the occurrence of damage to the display band 122 is arranged.
- a title display 410 indicating the occurrence of damage
- a damage occurrence date display 411 indicating the date and time when the pest damage occurs
- the type display 412 indicates the damage to the crop. The type is displayed.
- a damage occurrence date display 411 is shown at the leftmost position in a direction orthogonal to the direction in which the time axis 140 of the main display area 100 is arranged.
- the damage occurrence date display 411 may display a damage occurrence date in a range wider than the time range indicated on the time axis 140.
- FIG. 3 on the time axis 140 of the main display area 100, June 4 to 21 are displayed, and June 14 and June 17 are shown as damage occurrence dates.
- the damage occurrence on June 17 is shown at the top from the top, and the dates and times when the damage occurred are June 14, January 29, and November 3, 2017, which are the dates and times when the damage occurred. Is shown.
- the last four damage occurrence dates are shown, but the number is not limited to four and may be determined as appropriate.
- a pest and disease type display 412 is shown alongside the damage occurrence date display 411 in the direction in which the time axis 140 is arranged. That is, in the type display 412, the types of the pests displayed on the damage occurrence date display 411 are displayed side by side to the right of the damage occurrence date display 411.
- FIG. 3 shows that the pest 1 on June 17, the pest 2 on June 14, the pest 1 on January 29, and the pest 4 on November 3, 2017 are displayed.
- the main display area 100, the input display area 200, the pesticide application history display area 300, and the pest and disease history display area 400 in the display area are arranged in order from the upper part of the display area to the lower part.
- a menu display area 500 and a page selection display area 600 that allow selection of presenting other display information may be further arranged.
- the display unit 1200 of the display device 1000 may have a function of presenting various information in addition to the above-described display information, and may be capable of selecting display contents in order to appropriately display various information.
- the menu display area 500 may display a display that allows selection to return to a menu display in which various information is summarized as a list.
- the screen can be changed to a menu display screen by, for example, tapping the menu display area 500 by a user or the like.
- the display displayed in the display area can be shifted to the previous screen. For example, a selection is made to display an overview display of a house including environmental information and the like obtained by the cultivation sensor 30.
- FIG. 4 is a diagram showing an example of a modification of the display from the display band 110 to the time axis 140 in the main display area 100 of the display according to the embodiment.
- the display area shown in FIG. 4 is different from the above embodiment in that display items indicating the risk of damage occurrence and display items indicating the occurrence of pests are arranged for each pest, and the display band indicating the application of pesticides is one display for all pests. It corresponds with the display of the belt. Since pesticide spraying can show an effect on each pest, by displaying it in one display band, the display can be presented in a manner that is easy for the user to understand while simplifying the display.
- a display band indicating the damage occurrence risk and the pest and disease occurrence is displayed in each pest and disease item.
- a display band 711 indicating the risk of occurrence of damage and a display band 721 indicating the occurrence of pest are arranged vertically.
- a display band 712 indicating the risk of the occurrence of the pest 2 and a display band 722 indicating the occurrence of the pest are arranged vertically, and below the pest 2, the pest 3 is displayed.
- a display band 713 indicating a damage occurrence risk and a display band 723 indicating a pest occurrence are arranged vertically.
- the risk of damage occurrence is indicated to the user in three stages in terms of characters.
- the letter notation of L, M, and H is displayed, the letter notation of low risk indicates L, the letter notation of high risk indicates H, and the low risk level and the high risk level are displayed.
- the middle-level letter notation in between indicates M.
- a display band 730T indicating the title display of pesticide spraying is shown in the display area further below the damage occurrence risk and the pest damage occurrence of each pest, and a display indicating the pesticide spraying date and time is displayed below the display band 730T.
- a band 730 is arranged.
- a time axis 740 corresponding to the display bands 710T to 730 is arranged along the display band 730.
- the time axis 740 indicates the date and time from the left, and the time axis 740 indicates 4 days to 10 days.
- pesticide spraying was performed on the 5th, the risk of damage to pests 1 was medium level M, the risk of damage to pests 2 was low L, and the risk of damage to pests 3 was low L. It can be seen that it is.
- the damage occurrence risk for each pest and the pest occurrence are shown, and the display of the pesticide spraying corresponding to all the pests is one, and the time axis corresponding to the damage occurrence risk, the pest occurrence and the pesticide spraying is shown. Is displayed, when the types of pests increase, the risk of damage occurrence and information related to the risk of damage damage can be presented to the user more easily.
Landscapes
- Life Sciences & Earth Sciences (AREA)
- Biodiversity & Conservation Biology (AREA)
- Botany (AREA)
- Ecology (AREA)
- Forests & Forestry (AREA)
- Environmental Sciences (AREA)
- Business, Economics & Management (AREA)
- Engineering & Computer Science (AREA)
- Computing Systems (AREA)
- Emergency Management (AREA)
- Physics & Mathematics (AREA)
- General Physics & Mathematics (AREA)
- Catching Or Destruction (AREA)
Abstract
La présente invention permet de présenter un risque d'apparition de dommages, et des informations concernant le risque d'apparition de dommages, d'une manière qui est plus facilement compréhensible pour un utilisateur. L'invention concerne un dispositif d'affichage qui affiche l'éventualité que se produisent des dommages provoqués par un phénomène d'intérêt sur une culture, de telle sorte qu'un premier affichage montrant le risque d'apparition des dommages estimé sur la base d'informations environnementales relatives à l'environnement entourant la culture, un deuxième affichage montrant des informations d'apparition des dommagesrelatiîes à l'apparition des dommages, et un troisième affichage montrant des informations d'activité relatives à une activité supprimant le risque d'apparition des dommages, sont agencés alignés dans une zone d'affichage correspondant au même axe temporel.
Applications Claiming Priority (2)
| Application Number | Priority Date | Filing Date | Title |
|---|---|---|---|
| JP2018188524 | 2018-10-03 | ||
| JP2018-188524 | 2018-10-03 |
Publications (1)
| Publication Number | Publication Date |
|---|---|
| WO2020071050A1 true WO2020071050A1 (fr) | 2020-04-09 |
Family
ID=70055139
Family Applications (1)
| Application Number | Title | Priority Date | Filing Date |
|---|---|---|---|
| PCT/JP2019/034888 Ceased WO2020071050A1 (fr) | 2018-10-03 | 2019-09-05 | Dispositif d'affichage |
Country Status (1)
| Country | Link |
|---|---|
| WO (1) | WO2020071050A1 (fr) |
Citations (4)
| Publication number | Priority date | Publication date | Assignee | Title |
|---|---|---|---|---|
| US20160202227A1 (en) * | 2015-01-14 | 2016-07-14 | Accenture Global Services Limited | Precision agriculture system |
| JP2016202157A (ja) * | 2015-04-21 | 2016-12-08 | アスザック株式会社 | ピーマン炭疽病発生予察アルゴリズムと判定システム |
| US20180018414A1 (en) * | 2016-07-12 | 2018-01-18 | Tata Consultancy Services Limited | Systems and methods for pest forecasting using historical pesticide usage information |
| WO2018047726A1 (fr) * | 2016-09-07 | 2018-03-15 | ボッシュ株式会社 | Dispositif et système de traitement d'informations |
-
2019
- 2019-09-05 WO PCT/JP2019/034888 patent/WO2020071050A1/fr not_active Ceased
Patent Citations (4)
| Publication number | Priority date | Publication date | Assignee | Title |
|---|---|---|---|---|
| US20160202227A1 (en) * | 2015-01-14 | 2016-07-14 | Accenture Global Services Limited | Precision agriculture system |
| JP2016202157A (ja) * | 2015-04-21 | 2016-12-08 | アスザック株式会社 | ピーマン炭疽病発生予察アルゴリズムと判定システム |
| US20180018414A1 (en) * | 2016-07-12 | 2018-01-18 | Tata Consultancy Services Limited | Systems and methods for pest forecasting using historical pesticide usage information |
| WO2018047726A1 (fr) * | 2016-09-07 | 2018-03-15 | ボッシュ株式会社 | Dispositif et système de traitement d'informations |
Non-Patent Citations (1)
| Title |
|---|
| 9 June 2017 (2017-06-09), Retrieved from the Internet <URL:https://monoist.atmarkit.co.jp/mn/articles/1706/09/news041.html#1_ys_170> [retrieved on 20191115] * |
Similar Documents
| Publication | Publication Date | Title |
|---|---|---|
| US20210349933A1 (en) | Farm work support device and method, program, recording medium, and farm work support system | |
| US11793119B2 (en) | Information processing device and information processing method | |
| KR102253523B1 (ko) | 영농 시스템 및 농작업기 | |
| JP7014620B2 (ja) | 営農システム | |
| JP5525555B2 (ja) | 栽培支援装置、栽培支援システム、栽培支援方法及びプログラム | |
| JP6760069B2 (ja) | 情報処理装置、情報処理方法、及び、プログラム | |
| JP6760068B2 (ja) | 情報処理装置、情報処理方法、及び、プログラム | |
| JP6295452B2 (ja) | 農作物育成支援装置、及びそのプログラム | |
| US20220076014A1 (en) | Information processing device, and information processing system | |
| WO2015173875A1 (fr) | Procédé de génération de plan de culture, dispositif de génération de plan de culture, et programme de génération de plan de culture | |
| JP2023150886A (ja) | 情報処理装置、情報処理システム、情報処理プログラムおよび情報処理方法 | |
| JP2016170814A (ja) | 営農システム及び農作業機 | |
| US20140009600A1 (en) | Mobile device, computer product, and information providing method | |
| WO2020071050A1 (fr) | Dispositif d'affichage | |
| WO2016039175A1 (fr) | Dispositif de traitement d'informations, procédé de traitement d'informations et programme | |
| JP7327791B2 (ja) | 農作物の生産支援システム及びほ場別アドバイス表示プログラム | |
| JP2022040342A (ja) | 営農システム | |
| Gopinath et al. | An IoT Based Innovative Agri-Crop Care System | |
| RU2023128459A (ru) | Системы и способы обеспечения представлений полей, содержащих улучшенные сельскохозяйственные карты, имеющие слой данных и данные изображений | |
| JP2025013869A (ja) | 収穫された製品内における作物保護製品残留量の予測 | |
| JP2023097383A (ja) | 作物の管理方法、管理装置、およびプログラム | |
| JP2024085487A (ja) | 栽培支援装置、栽培支援方法及びプログラム | |
| JP2024061133A (ja) | 営農支援システム及び営農支援プログラム |
Legal Events
| Date | Code | Title | Description |
|---|---|---|---|
| 121 | Ep: the epo has been informed by wipo that ep was designated in this application |
Ref document number: 19869547 Country of ref document: EP Kind code of ref document: A1 |
|
| NENP | Non-entry into the national phase |
Ref country code: DE |
|
| 122 | Ep: pct application non-entry in european phase |
Ref document number: 19869547 Country of ref document: EP Kind code of ref document: A1 |
|
| NENP | Non-entry into the national phase |
Ref country code: JP |