WO2020071430A1 - Dispositif de traitement d'informations, système de traitement d'informations, procédé de traitement d'informations, et support non temporaire lisible par ordinateur dans lequel un programme est stocké - Google Patents
Dispositif de traitement d'informations, système de traitement d'informations, procédé de traitement d'informations, et support non temporaire lisible par ordinateur dans lequel un programme est stockéInfo
- Publication number
- WO2020071430A1 WO2020071430A1 PCT/JP2019/038940 JP2019038940W WO2020071430A1 WO 2020071430 A1 WO2020071430 A1 WO 2020071430A1 JP 2019038940 W JP2019038940 W JP 2019038940W WO 2020071430 A1 WO2020071430 A1 WO 2020071430A1
- Authority
- WO
- WIPO (PCT)
- Prior art keywords
- data
- sample
- parameter
- information
- observation
- Prior art date
- Legal status (The legal status is an assumption and is not a legal conclusion. Google has not performed a legal analysis and makes no representation as to the accuracy of the status listed.)
- Ceased
Links
Images


Classifications
-
- G—PHYSICS
- G01—MEASURING; TESTING
- G01W—METEOROLOGY
- G01W1/00—Meteorology
- G01W1/10—Devices for predicting weather conditions
-
- G—PHYSICS
- G05—CONTROLLING; REGULATING
- G05B—CONTROL OR REGULATING SYSTEMS IN GENERAL; FUNCTIONAL ELEMENTS OF SUCH SYSTEMS; MONITORING OR TESTING ARRANGEMENTS FOR SUCH SYSTEMS OR ELEMENTS
- G05B17/00—Systems involving the use of models or simulators of said systems
- G05B17/02—Systems involving the use of models or simulators of said systems electric
-
- G—PHYSICS
- G05—CONTROLLING; REGULATING
- G05B—CONTROL OR REGULATING SYSTEMS IN GENERAL; FUNCTIONAL ELEMENTS OF SUCH SYSTEMS; MONITORING OR TESTING ARRANGEMENTS FOR SUCH SYSTEMS OR ELEMENTS
- G05B13/00—Adaptive control systems, i.e. systems automatically adjusting themselves to have a performance which is optimum according to some preassigned criterion
- G05B13/02—Adaptive control systems, i.e. systems automatically adjusting themselves to have a performance which is optimum according to some preassigned criterion electric
- G05B13/04—Adaptive control systems, i.e. systems automatically adjusting themselves to have a performance which is optimum according to some preassigned criterion electric involving the use of models or simulators
- G05B13/048—Adaptive control systems, i.e. systems automatically adjusting themselves to have a performance which is optimum according to some preassigned criterion electric involving the use of models or simulators using a predictor
-
- G—PHYSICS
- G06—COMPUTING OR CALCULATING; COUNTING
- G06Q—INFORMATION AND COMMUNICATION TECHNOLOGY [ICT] SPECIALLY ADAPTED FOR ADMINISTRATIVE, COMMERCIAL, FINANCIAL, MANAGERIAL OR SUPERVISORY PURPOSES; SYSTEMS OR METHODS SPECIALLY ADAPTED FOR ADMINISTRATIVE, COMMERCIAL, FINANCIAL, MANAGERIAL OR SUPERVISORY PURPOSES, NOT OTHERWISE PROVIDED FOR
- G06Q10/00—Administration; Management
- G06Q10/04—Forecasting or optimisation specially adapted for administrative or management purposes, e.g. linear programming or "cutting stock problem"
Definitions
- the present invention relates to an information processing device, an information processing method, and a program.
- Patent Literature 1 discloses a weather forecast system that periodically performs weather forecast using a weather forecast model. This weather forecast system performs weather forecast by assimilating observation data with a weather forecast model, and changes calculation parameters used for calculation of weather forecast according to the forecast time.
- the prediction device described in Patent Literature 2 creates a plurality of prediction models, and creates a residual prediction model for predicting a residual for each prediction model. Then, the prediction device combines a prediction value for each prediction model with a residual prediction value based on the residual prediction model to calculate a prediction value as the prediction device.
- one of the objects to be achieved by the embodiments disclosed in the present specification is to provide an information processing device or the like that can efficiently calculate parameters.
- the information processing device includes: A plurality of observation information observed when an input is given to an observation target, and a simulator that simulates the observation target based on a sample of parameters is created for a plurality of the samples and a first type of data representing the input. Corresponding data for determining the importance of each sample according to the difference from the second type of data and the degree of contribution of each observation information in the plurality of observation information, and calculating data corresponding to the parameter distribution Calculating means; New parameter sample generating means for generating a new sample of the parameter according to a predetermined process using data corresponding to the distribution of the parameter.
- the information processing method Depending on the information processing device, A plurality of observation information observed when an input is given to an observation target, and a simulator that simulates the observation target based on a sample of parameters is created for a plurality of the samples and a first type of data representing the input. According to the difference from the second type of data, and the contribution of each observation information in the plurality of observation information, determine the importance of each of the samples, calculate data corresponding to the distribution of the parameters, Using the data corresponding to the parameter distribution, a new sample of the parameter is generated according to a predetermined process.
- the program according to the third aspect includes: A plurality of observation information observed when an input is given to an observation target, and a simulator that simulates the observation target based on a sample of parameters is created for a plurality of the samples and a first type of data representing the input. Corresponding data for determining the importance of each sample according to the difference from the second type of data and the degree of contribution of each observation information in the plurality of observation information, and calculating data corresponding to the parameter distribution A calculating step; Using a data corresponding to the distribution of the parameters, a new parameter sample generating step of generating a new sample of the parameter according to a predetermined process.
- FIG. 1 is a block diagram illustrating an example of a configuration of an information processing system according to an embodiment.
- FIG. 2 is a block diagram illustrating an example of a hardware configuration of an information amount criterion calculation device according to the embodiment.
- FIG. 2 is a block diagram illustrating an example of a functional configuration of the information amount criterion calculation device according to the first embodiment;
- 5 is a flowchart illustrating an example of an operation of the information amount criterion calculation device according to the first embodiment;
- FIG. 9 is a block diagram illustrating an example of a functional configuration of an information amount criterion calculation device according to a second embodiment. 9 is a flowchart illustrating an example of an operation of the information amount criterion calculation device according to the second embodiment.
- FIG. 14 is a block diagram illustrating an example of a functional configuration of an information processing device according to another embodiment.
- the distance can be defined mathematically, such as a Euclidean norm or a 1 norm.
- the distance may be a value obtained by adding 1 to such a value. That is, the terms used in the following embodiments need not be mathematically defined terms.
- FIG. 1 is a block diagram illustrating an example of a configuration of an information processing system 10 according to the embodiment.
- the information processing system 10 includes an information amount criterion calculation device 100 and a simulator server (simulator) 200.
- the information amount criterion calculation device 100 may be referred to as an information processing device.
- the simulator server 200 is a simulator that receives a first type of data and outputs a second type of data. That is, the simulator server 200 performs a simulation process of predicting the second type of data from the first type of data according to the model defined by the parameter ⁇ . For example, the simulator server 200 executes a process of simulating a process (operation) on the observation target based on a sample of the parameter ⁇ . The sample represents the value of the parameter ⁇ . Therefore, the plurality of samples represent a plurality of examples (data) set as the value of the parameter ⁇ .
- the first type of data is referred to as data X
- the second type of data is referred to as data Y.
- the number of observation data is set to n (n is a positive integer)
- the observation data of data X (first type of observation data) is expressed as observation data Xn
- the observation data of data Y (second type of observation data) is expressed.
- data) is denoted as the observation data Y n.
- the elements of the observation data Y n Y 1 denoted ..., and Y n.
- the information amount criterion calculation apparatus 100 obtains observation data in which data X i (i is an integer of 1 ⁇ i ⁇ n) and data Y i are associated with each other one-to-one (thus, observation data that can be plotted on the XY plane). Data).
- observation data may be referred to as observation information.
- observation information also represent the observed data Y n and a plurality of observation information.
- each of the elements Y 1 ,..., Y n may be expressed as observation information.
- Observation data X n and Y n may be a particular type of invention is not limited to data actually measured various data.
- the actual measurement method for obtaining observation data is not limited to a specific method, and various methods such as counting or measurement by a user such as a user, or sensing using a sensor can be adopted.
- the element of the observation data Xn may represent the state of a component constituting the observation target.
- Elements of observation data Y n may be one representing the observed status with respect to the observation target by using a sensor or the like.
- the observation data Xn may indicate the operation status of each facility in the manufacturing factory.
- Observation data Y n may be one representing the number of products to be manufactured at constituted lines of a plurality of facilities. Further, the observation data Xn may represent a raw material of a product in a manufacturing factory. In this case, the material represented by the observation data Xn is processed into a product through one or more processing steps.
- the product is not limited to one type of product, and may be a plurality of products (for example, product A, product B, and by-product C).
- Observation data Y n for example, the number of product A, the number of product B, and represent the number of products C (or, production, etc.).
- the observation target and the observation data are not limited to the examples described above, and may be, for example, equipment in a processing factory or a construction system for constructing a certain facility.
- x) can be expressed as p (y
- x) represents the probability that event y will occur when event x occurs.
- x)” represents “q (x) ⁇ q (y
- the operator “ ⁇ ” representing multiplication is omitted according to mathematical convention.
- the regression model r (x, ⁇ ) used by the simulator server 200 outputs the value of the data Y in response to the setting of the value of the parameter ⁇ and the input of the value of the data X to the variable x.
- simulator server 200 outputs a value of data Y by performing an operation including a sample of parameter ⁇ on data X (the value of x). Note that a differentiable function need not necessarily be used for the model.
- the simulator server 200 simulates processing or operation in the observation target.
- the simulator server 200 calculates the data Y by performing an operation on the value of the data X in accordance with the value represented by the parameter ⁇ , thereby obtaining each of the data at the manufacturing factory. Simulate the process.
- the parameter ⁇ represents, for example, the relationship between input and output in each process. Can be said to represent the state in the process.
- the parameter ⁇ is not limited to one, but may be plural. That is, it can be said that the regression model r (x, ⁇ ) generically represents the entire processing executed by the simulator server 200 using the symbol r.
- WBIC Widely / Applicable / Bayesian / Information / Criterion
- WBIC is known as a criterion for evaluating the goodness of the model. For example, when selecting an appropriate model from a plurality of models, it is possible to check which model is appropriate by calculating the WBIC of each model.
- WBIC is a type of information criterion using Bayes free energy. If the statistical model is a singular model, the WBIC asymptotically approximates the Bayesian free energy event, and if the statistical model is a regular model, it matches the BIC (Bayesian Information Criterion). Bayes free energy is defined by the following equation (1). Note that ⁇ ( ⁇ ) is a prior distribution of the parameter ⁇ .
- x, ⁇ ) is represented by the following equation (3).
- x, ⁇ ) is a model showing the statistical properties of the regression model r (x, ⁇ ).
- the regression model r (x, ⁇ ) is not always explicitly expressed using a mathematical formula. For example, when x and ⁇ are input, r (x, ⁇ ) ) May be used to represent a process such as a simulation that outputs.
- coefficients of a mathematical expression are determined so as to match given data.
- the regression model r (x, ⁇ ) in the present embodiment may be a case where such a mathematical expression is not given. That is, the regression model r (x, ⁇ ) in the present embodiment only needs to represent information in which the inputs x and ⁇ are associated with the output r (x, ⁇ ).
- ⁇ (where ⁇ > 0) is the standard deviation of Gaussian noise. That is, ⁇ is the standard deviation of the Gaussian noise in the model defined by the regression function involving the Gaussian noise.
- r (x, ⁇ ) is a value calculated by the simulator server 200 according to a process represented by a regression model.
- d is the number of dimensions of X (that is, the number of observation data described above). exp represents an exponential function based on the Napier number.
- ⁇ represents the pi.
- WBIC is defined as in the following equation (4). here, Is the expected value of the posterior distribution of ⁇ . ⁇ (where ⁇ > 0) is a parameter called reverse temperature.
- Equation (5) For any integrable function G ( ⁇ ), the expected value of the posterior distribution of ⁇ can be expressed as in equation (5) below.
- WBIC can be calculated by substituting nL n ( ⁇ ) for G ( ⁇ ) and calculating the right side of equation (5).
- x, ⁇ ) cannot be analytically expressed as a mathematical expression, that is, when the likelihood function p (y
- Equation (6) holds regardless of whether the statistical model is a singular model or a regular model.
- the term denoted by the Laudau symbol can be ignored. That is, Bayes free energy is approximated by WBIC.
- Expression (7) is an expression obtained by expanding the definition expression of Bayes free energy so as to include the inverse temperature. Further, a function F ′ n ( ⁇ ) obtained by differentiating F n ( ⁇ ) with respect to ⁇ can be expressed as the following equation (9).
- ⁇ ⁇ 0 / log n.
- ⁇ is a positive constant.
- ⁇ is a real log threshold (RLCT).
- ⁇ 0 is a true parameter of the statistical model, that is, a parameter satisfying q (y
- x) p (y
- equation (11) is known as an asymptotic expansion of the definition equation of Bayes free energy.
- the WBIC can be calculated by calculating the following equation (13) using sample data that follows the posterior distribution of the parameter ⁇ of the model that predicts the second type of data.
- the sample data following the posterior distribution is Is represented.
- j is an integer satisfying 1 ⁇ j ⁇ m, and m is the number of sample data following the posterior distribution.
- the posterior distribution is unknown. For this reason, it is required to use a predetermined technique for acquiring a sample according to the posterior distribution.
- a method using an MCMC Markov Chain Monte Carlo method such as the Metropolis-Hastings algorithm is known.
- m sample data of the parameter ⁇ are acquired by the MCMC according to the posterior distribution p ( ⁇
- ⁇ indicates a proportional relationship.
- sample data of the parameter ⁇ is obtained by using a kernel ABC (Kernel Approximate Bayesian Computation) and a predetermined process (Kernel ⁇ ⁇ Harding).
- kernel ABC Kernel Approximate Bayesian Computation
- predetermined process Kernel ⁇ ⁇ Harding
- the kernel ABC is an algorithm for estimating a posterior distribution by calculating a kernel average.
- a simulation is performed based on m sample data, and the posterior distribution is obtained by determining the weight (importance) of the m parameter sample data based on the observation data observed for the observation target.
- the weight (importance) of the m parameter sample data is calculated.
- the more the simulation result is not similar to the observation data the more the weight that disregards the parameters used for the simulation result is calculated.
- Kernel harding is an algorithm for acquiring a sample according to the posterior distribution from the kernel mean indicating the posterior distribution.
- kernel harding a sample that is closest to the obtained kernel average is determined sequentially.
- m samples are newly calculated for m samples by the processes in the kernel ABC and kernel hardening, so it can be said that the values of the samples are adjusted. .
- Kernel harding is a method of sequentially determining samples, but a predetermined process of acquiring a sample according to a posterior distribution (in the present embodiment, an estimated posterior distribution) is not limited to kernel hardening. That is, the predetermined process may be any method that creates a sample according to the posterior distribution (in the present embodiment, the estimated posterior distribution).
- sample data of the parameter ⁇ using the kernel ABC and the above-described predetermined processing for example, kernel hardening
- m simulations that is, the second type of model model
- Data prediction the calculation cost can be suppressed.
- sample data of the parameter ⁇ according to the posterior distribution including the inverse temperature ⁇ is obtained using the kernel ABC and kernel hardening, and the information amount criterion calculation for calculating the WBIC based on the sample data is performed.
- the device 100 is shown.
- the inverse temperature ⁇ can be said to represent a value indicating a level at which the distribution calculated based on each sample equalizes the influence on the estimated distribution in the process of estimating the posterior distribution.
- the leveling level is lower as the reverse temperature ⁇ is higher.
- the lower the inverse temperature ⁇ is, the less likely the estimated distribution is to be affected by some distributions.
- FIG. 2 is a block diagram illustrating an example of a hardware configuration of the information amount criterion calculation device 100.
- the information criterion calculation device 100 includes an input / output interface 101, a memory 102, and a processor 103.
- the input / output interface 101 is an interface for inputting and outputting data.
- the input / output interface 101 is used to communicate with another device.
- the input / output interface 101 is used to communicate with the simulator server 200.
- Output interface 101 may be used to communicate with an external device such as a sensor device for outputting the observation data X n or observed data Y n.
- the input / output interface 101 may further include an interface for connecting to input devices such as a keyboard and a mouse. In this case, the input / output interface 101 acquires data input by a user operation.
- the input / output interface 101 may further include an interface for connecting to a display. In this case, for example, the calculation result of the information amount criterion calculation device 100 is displayed on the display via the input / output interface 101.
- the memory 102 is constituted by, for example, a combination of a volatile memory and a nonvolatile memory.
- the memory 102 is used to store, in addition to various data used for the processing of the information amount criterion calculation apparatus 100, software (computer program) including one or more instructions executed by the processor 103, and the like.
- the processor 103 reads out software (computer program) from the memory 102 and executes the software to perform processing of each configuration illustrated in FIG. 3 described below.
- the processor 103 may be, for example, a microprocessor, an MPU (Micro Processor Unit), a CPU (Central Processing Unit), or the like.
- Processor 103 may include a plurality of processors.
- the above-described program may be stored using various types of non-transitory computer readable media and supplied to a computer.
- Non-transitory computer-readable media include various types of tangible storage media.
- non-transitory computer-readable medium examples include a magnetic recording medium (eg, a flexible disk, a magnetic tape, a hard disk drive), a magneto-optical recording medium (eg, a magneto-optical disk), a CD-ROM (Read Only Memory) CD-R, and a CD. -R / W, semiconductor memory (eg, mask ROM, PROM (Programmable ROM), EPROM (Erasable PROM), flash ROM, RAM (Random Access Memory)).
- the program may be supplied to a computer by various types of transitory computer readable media. Examples of transitory computer readable media include electrical signals, optical signals, and electromagnetic waves. Transitory computer readable media can provide the program to a computer via a wired communication line such as an electric wire and an optical fiber, or a wireless communication line.
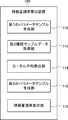
- FIG. 3 is a block diagram illustrating an example of a functional configuration of the information amount criterion calculation device 100.
- the information amount criterion calculation device 100 includes a first parameter sample generation unit 110, a second type sample data acquisition unit 112, a kernel average calculation unit 114, a second parameter sample generation unit 116, and an information amount criterion calculation unit. 118.
- the first parameter sample generator 110 is also called a prior parameter sample generator
- the kernel average calculator 114 is also called a corresponding data calculator
- the second parameter sample generator 116 is a new parameter sample generator. Also called.
- the first parameter sample generator 110 receives the input of the first type of data (data X) and outputs the second type of data (data Y), and the prior distribution of the parameter ⁇ of the regression model r (x, ⁇ )
- the sample data of the parameter ⁇ is generated based on ⁇ ( ⁇ ).
- the prior distribution ⁇ ( ⁇ ) is, for example, a uniform distribution. In the case of a uniform distribution, sample data is randomly selected from a domain in which the value of ⁇ is defined. If a distribution estimated to be close to the posterior distribution to some extent is obtained, the distribution may be set to the prior distribution ⁇ ( ⁇ ). In this case, sample data is selected from the domain according to the prior distribution ⁇ ( ⁇ ).
- the prior distribution ⁇ ( ⁇ ) is not limited to the example described above, nor is it necessarily given explicitly. If the prior distribution ⁇ ( ⁇ ) is not explicitly given, the prior distribution ⁇ ( ⁇ ) is set to, for example, a uniform distribution. In addition, as described later, the prior distribution ⁇ ( ⁇ ) may be set by the user.
- the sample data of the parameter ⁇ is expressed by the following equation. It is represented as (14).
- d ⁇ indicates the number of dimensions of the parameter (that is, the number of types of the parameter ⁇ ). That is, Expression (14) indicates that the number of sets including the parameters of d ⁇ types is m.
- R indicates a real number.
- the sample data of the parameter ⁇ is shown as a real number in the d ⁇ dimension, and follows a prior distribution ⁇ ( ⁇ ).
- the prior distribution ⁇ ( ⁇ ) is stored in the memory 102 in advance.
- the prior distribution ⁇ ( ⁇ ) is set in advance, for example, with an accuracy according to the knowledge that the user has about the simulation target.
- the second type sample data acquisition unit 112 receives the parameters ⁇ generated by the first parameter sample generation unit 110, and supplies the received m parameters ⁇ with observation data (observation data X n ) of the first type of data. To the simulator server 200. The simulator server 200 receives the m parameters ⁇ and the observation data (observation data X n ) of the first type of data.
- the simulator server 200 performs a simulation calculation based on the observation data (observation data X n ) of the first type of data for each of the input m parameters ⁇ . That is, the simulator server 200 executes m types of simulation calculations on the observation target according to the input m parameters ⁇ . The simulator server 200 executes m kinds of simulation calculations, thereby obtaining m kinds of simulation results ( ) Is calculated.
- the second type sample data acquisition unit 112 acquires m types of simulation results from the simulator server 200 as second type sample data.
- the above processing can be mathematically expressed as follows.
- the second type sample data acquisition unit 112 converts the sample data having n elements (the same number as the number of elements of the observation data Xn ) represented by Expression (15) into model data for each parameter sample data. (Simulator server 200).
- the sample data obtained by the second type sample data obtaining unit 112 is represented as an n-dimensional real number, and the likelihood function p (y
- the kernel average calculation unit 114 estimates a kernel average indicating a posterior distribution of parameters according to the kernel ABC. That is, the kernel average calculation unit 114 calculates the kernel average indicating the posterior distribution of the parameters based on the sample data of the parameters and the second type of sample data. In particular, the kernel average calculation unit 114 calculates a kernel average using a kernel function including the inverse temperature.
- the kernel ABC will be described. Using the sample data represented by the equation (14) and the sample data represented by the equation (15), the kernel ABC calculates a kernel average represented by the following equation (16).
- the kernel mean corresponds to a posterior distribution expressed on a reproducing kernel Hilbert space (RKHS) by kernel mean embedding (Kernel Mean Embeddings).
- the kernel average is an example of data corresponding to a parameter distribution (posterior distribution).
- the weight w j is represented as in the following Expression (17).
- H indicates a regenerative nuclear Hilbert space. That is, the larger the weight (importance) w j is, the larger the sample This means that the kernel has a strong effect on the average. The smaller the weight w j is, the more samples Indicates that the kernel has a small effect on the average.
- a superscript T indicates transposition of a matrix or a vector.
- I represents a unit matrix
- ⁇ (where ⁇ > 0) is a regularization constant.
- the vector k y (Y n) and the Gram matrix (Gramm Matrix) G is the kernel k y for the data vector Y n consisting of real elements, is represented by the following formula (18), formula (19) .
- k y (Y n) is the observed data Y n, proximity of the sample data of formula (15) corresponding to the observation data Y n (norm), i.e. a function for calculating the degree of similarity.
- the kernel average is a weighted average that determines the weight of each parameter using the calculated degree of similarity and is calculated according to the processing shown in Expression (16).
- Equation (18) is obtained from a plurality of pieces of observation information observed when an input is given to the observation target, and a second type of data created by the simulator server 200 for the first type of data representing a plurality of samples and inputs. It can be said that the difference from the above is calculated.
- Expression (16) also indicates a process of calculating a large weight for data similar to observed data actually observed for an observation target among m types of simulation results. You can also.
- the processing for calculating a small weight is represented. That is, it can be said that Expression (17) calculated using Expression (18) represents a process of calculating a weight according to the degree of similarity between the simulation result and the observation data. This can be said to be a process using a covariate shift.
- the distribution q 0 (x) that the training dataset ⁇ X n , Y n ⁇ follows is different from the distribution q 1 (x) that the test or prediction dataset follows.
- x) is the same.
- the covariate shift is a process of calculating y for a given x, it is constant for a plurality of x, but the distribution as an input is different between training and testing. It represents that.
- the probability densities q 0 (x) and q 1 (x) are known, or their ratio q 0 (x) / q 1 (x) is known.
- the ratio is closer to 1, it means that q 0 (x) during training and q 1 (x) during testing occur with similar probability.
- the index is not limited to the ratio, and may be any index that represents the difference between the distribution at the time of training and the distribution at the time of testing, such as the difference between the two distributions.
- Equation (20) corresponds to equation (25) described below, except for the difference in whether the inverse temperature depends on the training data (observation data).
- (Y n , Y n ′) on the left side of Expression (20) is expressed by a kernel function represented by an n-dimensional vector (a data set having n elements (that is, including n elements)).
- n-dimensional vector a data set having n elements (that is, including n elements)
- the function is a two-variable function for the second type of data. That, Y n is the left side, shows the first variable in the function of two variables, Y n 'is in the left side, shows a second variable in the function of two variables.
- the right side of the Y i indicates the i-th element of the n-dimensional vector that is input to the variable determined as the first variable.
- Y i ′ on the right side indicates the i-th element of the n-dimensional vector input to the two-variable function as the second variable.
- ⁇ is the standard deviation of Gaussian noise for the second type of data. More specifically, in equation (20), ⁇ is the standard deviation of the distribution of the entire observation data of the second type of data used for calculating equation (20). In particular, the meaning of ⁇ in equation (20) can be a value indicating a scale for measuring the similarity between the distribution of the second type of observation data and the distribution of the second type of sample data. Further, n is the number of data of the second type of data, ⁇ i is the reverse temperature, and Y i and Y i ′ are the values of the second type of data.
- each element (for example, the type of observation data) included in the second type of data set is weighted by the inverse temperature ⁇ i .
- ⁇ i the reverse temperature
- ⁇ i is the inverse temperature depending on the training data (observed data) ⁇ X i , Y i ⁇ . That is, the reverse temperature values can be set to be different for each data. That is, the inverse temperature ⁇ i can be set for each type of observation data (ie, the elements included in Y n ). For example, a larger value is set as the inverse temperature for the type of observation data with a higher importance, and a smaller value is set as the inverse temperature for the observation data with a lower importance. Therefore, ⁇ i can also be expressed as a contribution indicating the importance of the type of observation data (that is, the element included in Y n ). In other words, the inverse temperature can be said to be the contribution of each piece of observation information to the plurality of pieces of observation information.
- the kernel average is calculated for a constant inverse temperature that does not depend on the training data (observation data) ⁇ X i , Y i ⁇ .
- the kernel average calculator 114 calculates a kernel average represented by the following equation (21).
- (Y n , Y n ′) on the left side of Expression (25) is a kernel function represented by an n-dimensional vector (a data set having n elements (that is, including n elements)).
- n-dimensional vector a data set having n elements (that is, including n elements)
- the function is a two-variable function for the second type of data. That, Y n is the left side, shows the first variable in the function of two variables, Y n 'is in the left side, shows a second variable in the function of two variables.
- the right side of the Y i indicates the i-th element of the n-dimensional vector that is input to the variable determined as the first variable.
- Y i ′ on the right side indicates the i-th element of the n-dimensional vector input to the two-variable function as the second variable.
- the elements for example, the observation data
- the elements are weighted by the inverse temperature ⁇ i .
- the elements (for example, types of observation data) included in the second type of data set are weighted at a constant inverse temperature. That is, in the processing shown in the equation (25), the degree of contribution of the elements included in the second type of data set is constant.
- the contribution is assumed to be constant in this example, the contribution is not limited to a constant defined mathematically, but may be substantially constant.
- the substantially constant value indicates a value calculated by adding a noise having an average of 0 standard deviation s to the average value a. In this case, the standard deviation s is, for example, a value of about 0% to 10% of the magnitude of a.
- ⁇ is the standard deviation of Gaussian noise for the second type of data. More specifically, in Expression (25), ⁇ is a standard deviation of a distribution including the entire observation data of the second type of data used for calculating Expression (25).
- the meaning of ⁇ in equation (25) can be a value indicating a scale for measuring the similarity between the distribution of the second type of observation data and the distribution of the second type of sample data.
- n is the number of data of the second type of data
- ⁇ is the reverse temperature
- Y i and Y i ′ are the values of the second type of data.
- ⁇ is a constant that does not depend on observation data.
- the second parameter sample generator 116 generates sample data of parameters according to the posterior distribution defined using the inverse temperature based on the kernel average calculated by the kernel average calculator 114.
- the posterior distribution defined using the inverse temperature is a posterior distribution defined based on Bayes' theorem by a prior distribution and a likelihood function controlled by the inverse temperature.
- the posterior distribution is the distribution according to exp (- ⁇ nL n ( ⁇ ) + log ⁇ ( ⁇ )).
- the second parameter sample generation unit 116 generates sample data of parameters according to the posterior distribution using kernel hardening.
- kernel hardening m pieces of sample data ⁇ 1 ,..., ⁇ m according to the posterior distribution are generated by the update equations shown in the following equations (26) and (27).
- h j 0,..., M ⁇ 1.
- Argmax ⁇ h j ( ⁇ ) indicates the value of ⁇ that maximizes the value of h j ( ⁇ ).
- h j are sequentially represented by Expression (27).
- the initial values h 0 and ⁇ of h j kernel average values calculated according to the processing shown in Expression (21) are used. That is, the second parameter sample generation unit 116 uses the kernel average calculated by the kernel average calculation unit 114 and performs m processes of m pieces of sample data ⁇ suitable for representing the kernel average by a predetermined process such as kernel hardening. 1, ..., to generate the ⁇ m.
- the information amount criterion calculation device 100 executes a process of calculating m sample data according to the estimated posterior distribution for m sample data according to the prior distribution. Therefore, it can be said that the process in the information amount criterion calculation device 100 is a process of adjusting the values of m sample data.
- the information amount criterion calculation unit 118 calculates the WBIC for the model based on the parameter sample data generated by the second parameter sample generation unit 116. Specifically, the information amount criterion calculation unit 118 calculates the WBIC using the sample data of the parameters generated by the second parameter sample generation unit 116 and Expression (13).
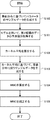
- FIG. 4 is a flowchart illustrating an example of the operation of the information amount criterion calculation device 100. Hereinafter, the operation will be described with reference to FIG.
- step S100 the first parameter sample generation unit 110 generates sample data of the parameter ⁇ based on the prior distribution ⁇ ( ⁇ ).
- the sample data generated by the first parameter sample generator 110 is input to the simulator server 200.
- the generated sample data is input to the simulator server 200 by the second type sample data acquisition unit 112, for example.
- the second type sample data acquisition unit 112 acquires the second type sample data calculated by the simulator server 200 according to the model in which the sample data generated in step S100 is set as a parameter. That is, the second type sample data acquisition unit 112, the training data set ⁇ X n, Y n ⁇ , which is obtained in advance of, the X n is a first type of data input to the model, the output from the model get.
- the training data set ⁇ X n , Y n ⁇ is information in which X n being the first type of data and Y n being the second type of data are associated with each other.
- the second type of data Yn is, for example, information obtained by actually performing processing (operation) on the first type of data Xn by the observation target.
- the simulator server 200 calculates the data Y by performing an operation according to the value represented by the parameter ⁇ on the value of the data X. Thereby, the processing (operation) in the observation target is simulated.
- the parameter ⁇ represents, for example, the relationship between input and output in each process (operation).
- step S101 the simulator server 200 receives, as an input, Xn that is a first type of data representing an input given to the observation target, and performs a process according to the input parameter ⁇ with the first type of data.
- the observation object is simulated by applying to a certain Xn .
- the simulator server 200 generates a simulation result ( ) To create.
- the processing in the simulator server 200 may be executed in advance.
- the second type sample data acquisition unit 112 reads information in which the sample data of the parameter ⁇ is associated with the simulation result calculated when the sample data is set.
- the kernel average calculation unit 114 calculates the kernel average indicating the posterior distribution of the parameters by the kernel ABC using the sample data obtained in steps S100 and S101. Note that this posterior distribution is a posterior distribution defined using the inverse temperature as described above.
- the kernel average calculation unit 114 calculates a kernel average using a kernel function including the inverse temperature represented by Expression (25). In other words, the kernel average calculation unit 114 determines the importance of each sample of the parameter according to the difference between the observation data and the sample data for the second type of data and the contribution of each observation data. , Data corresponding to the parameter distribution is calculated.
- step S103 the second parameter sample generation unit 116 generates parameter sample data according to the posterior distribution defined using the inverse temperature, based on the kernel average calculated in step S102.
- step S104 the information amount criterion calculation unit 118 calculates the WBIC for the model using Expression (13) based on the sample data of the parameters generated in step S103.
- the kernel average calculation unit 114 calculates a kernel average corresponding to the posterior distribution defined using the inverse temperature. Therefore, even when a value other than 1 is set as the value of the inverse temperature, sample data of the posterior distribution can be obtained by using a method such as kernel ABC and kernel hardening.
- the second type sample data acquisition unit 112 converts the sample data represented by Expression (15) into a model (simulator server 200) for each parameter sample data. Just get from. That is, the number of times of executing the simulation can be suppressed as compared with the case where the posterior distribution sample data is obtained by the method using MCMC. That is, according to the present embodiment, parameters can be calculated efficiently. Therefore, the WBIC can be calculated efficiently.
- the sample data generated in step S103 is used only for calculating the WBIC, but may be used for simulation by the simulator server 200. That is, the information amount criterion calculation device 100 may input the sample data generated in step S103 (that is, the sample data of the parameter ⁇ ) to the simulator server 200.
- the simulator server 200 receives the m pieces of the sample data and executes a simulation calculation on the observation target based on the received sample data. Specifically, the simulator server 200 executes m types of simulation processes on Xn that is given first type of data in accordance with the sample data. As a result, the simulator server 200 calculates m types of simulation results for the given first type of data Xn .
- the m types of simulation results are not necessarily different from each other, and may include the same results.
- the information amount criterion calculation device 100 receives m types of simulation results. Then, the information amount criterion calculation device 100 calculates a simulation result obtained by integrating the m types of simulation results. For example, the information amount criterion calculation device 100 calculates an average of m types of simulation results. That is, the information amount criterion calculation device 100 calculates a simulation result for the given first type of data Xn . The information amount criterion calculation device 100 may calculate the simulation result for the given first type of data Xn, for example, by calculating a weighted average of m types of simulation results.
- Information criterion calculation device 100 by executing the processing described above with reference to FIG. 4, and the simulation result of the simulator server 200 calculates the observation information Y n matches (conforms) manner, the parameters ⁇ Calculate sample data. Since the calculated sample data is data according to the posterior distribution, the above-described simulation result calculated by the information amount criterion calculation device 100 is a simulation result according to the sample data according to the posterior distribution. In other words, the information amount criterion calculation device 100 can calculate a simulation result that matches the observation information based on the simulation result created by the simulator server 200. Therefore, for the sample data of the parameter ⁇ given to the simulator server 200, by creating a value that matches the observation information, the information amount criterion calculation device 100 can calculate a simulation result suitable for the observation information. it can.
- Embodiment 2 a second embodiment will be described. Due to the characteristics of the kernel ABC, the WBIC calculation method described in Embodiment 1 may have a different result from the WBIC calculation using the MCMC method. This is considered to be due to the following reasons.
- ⁇ is a hyperparameter of the standard deviation of Gaussian noise in equation (3). Then, nL n ( ⁇ ) is calculated using this hyperparameter.
- ⁇ k may be larger than the true standard deviation ⁇ 0 of Gaussian noise. Due to the difference between ⁇ 0 and ⁇ k , the WBIC value calculated using the kernel ABC differs from the WBIC value calculated using the likelihood function directly, such as the MCMC method.
- ⁇ k is used instead of ⁇ 0 as a specific value of ⁇ in equation (25). Therefore, there is a possibility that an accurate WBIC value cannot be calculated in the first embodiment. is there.
- the model is modeled by a regression function involving Gaussian noise.
- ⁇ 0 can be said to be the value of the standard deviation of the Gaussian noise with respect to the regression function.
- ⁇ k can be said to be a value indicating a scale for measuring the similarity between the distribution of the second type of observation data and the distribution of the second type of sample data.
- Embodiment 1 a method for calculating WBIC more accurately than the method for calculating WBIC shown in Embodiment 1 will be described.
- the standard deviation ⁇ 0 of Gaussian noise is known. That is, before performing the correction described below, the standard deviation ⁇ 0 of the Gaussian noise is estimated by a known method and is known.
- Equation (7) F n ( ⁇ ) rather than to be expressed as F n ( ⁇ , ⁇ ).
- ⁇ and ⁇ mean variables. such as beta 1, code subscript is given to beta represents a specific constant. Similarly, a code with a subscript attached to ⁇ , such as ⁇ 0 , indicates a specific constant.
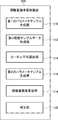
- FIG. 5 is a block diagram illustrating an example of a functional configuration of the information amount criterion calculation device 300 according to the second embodiment.
- the information amount criterion calculation device 300 is different from the information amount criterion calculation device 100 according to the first embodiment in further including a correction unit 120.
- the information amount criterion calculation device 300 also has a hardware configuration as shown in FIG. 2 similarly to the information amount criterion calculation device 100, and the processor 103 reads out software from the memory 102 and executes the software. The processing of each configuration shown in FIG.
- the correction unit 120 corrects the WBIC calculated by the information amount criterion calculation unit 118.
- the correction unit 120 performs correction using the fact that different ⁇ s are represented by different inverse temperatures ⁇ in the relational expressions derived from Expressions (7) and (3).
- the relationship of F n ( ⁇ , ⁇ ) between different ⁇ and ⁇ is represented by the following equation (28).
- Equation (28) C k and ⁇ k are defined as shown in the following equations (29) and (30). ⁇ Equation (29)>
- Equation (28) is a WBIC when the inverse temperature value in equation (7) is 1 and the standard deviation value is ⁇ k, and the inverse temperature value in equation (7) is a predetermined value ⁇ other than 1 It shows the relationship with WBIC when k is set and the value of the standard deviation is set to ⁇ 0 .
- Expression (7) is an expression obtained by expanding the definition expression of Bayes free energy so as to include the inverse temperature.
- the correction unit 120 corrects the WBIC calculated by the information amount criterion calculation unit 118 using the relationship represented by Expression (28). Specifically, the correction unit 120 performs the correction by one of the two correction methods described below.
- F n ( ⁇ , ⁇ ) that is, an asymptotically developed mathematical expression of the mathematical expression (7) is shown.
- Equation (31) is an equation asymptotically expanded for F n ( ⁇ , ⁇ ).
- the correction unit 120 calculates the relationship expressed by excluding the real logarithmic threshold ⁇ obtained from the two mathematical expressions in which different values of ⁇ are set in Expression (31), and the relationship expressed by Expression (28). Is used, the WBIC calculated by the information amount criterion calculation unit 118 is corrected. Since the relationship excluding the real logarithmic threshold ⁇ is used, the first method can correct the value without calculating the real logarithmic threshold ⁇ , which is generally difficult to calculate.
- the relational expression indicating the relationship expressed by excluding the real logarithmic threshold value ⁇ is obtained by deleting the term of the real logarithmic threshold value ⁇ from the simultaneous equations including Expressions (32) and (33).
- the entropy (minus log likelihood function) L n ( ⁇ 0 ) is (However, Is sufficiently approximated by the average (posterior mean) calculated from the sample data of the parameters according to the posterior distribution, the following equation (34) is satisfied.
- Expression (34) is obtained by a relational expression indicating a relationship expressed by excluding the real logarithmic threshold value ⁇ and a relational expression expressed by Expression (28).
- F n (1, ⁇ k ) corresponds to the WBIC calculated by the information amount criterion calculation unit 118. Therefore, the correction unit 120 generates the post-correction WBIC from the pre-correction WBIC calculated by the information amount criterion calculation unit 118 by calculating Expression (34). In other words, the correction unit 120 calculates the first type of data (that is, the input to the observation target) and the observation information observed with respect to the observation target in the case of the first type regarding the parameter set according to the estimated posterior distribution.
- the correction unit 120 may perform the correction by the above-described first correction method. However, when the calculation by approximation of L n ( ⁇ 0 ) cannot be performed, the first correction method cannot be used. In this case, the correction unit 120 may perform the correction by the second correction method.
- the correction unit 120 calculates the relationship expressed by excluding the real logarithmic threshold value and entropy obtained from three mathematical expressions in which different values of ⁇ are set in Expression (31), and Expression (28)
- the WBIC calculated by the information amount criterion calculation unit 118 is corrected by using the relationship indicated by. Since not only the real logarithmic threshold but also the relationship from which entropy is excluded is used, the second correction method can correct even if calculation by approximation of L n ( ⁇ 0 ) is not possible.
- the correction unit 120 can calculate the corrected WBIC F n (1, ⁇ 0 ). This is because the value of F n ( ⁇ 1 , ⁇ 0 ) can be calculated as the value of F n (1, ⁇ 1 ), and the value of F n ( ⁇ 2 , ⁇ 0 ) is F n (1, ⁇ 0 ). This is because it can be calculated as the value of ⁇ 2 ) (see equation (28)). That is, F n ( ⁇ 1 , ⁇ 0 ) and F n ( ⁇ 2 , ⁇ 0 ) are the two uncorrected WBICs calculated by the information amount criterion calculation unit 118.
- the correction unit 120 calculates the corrected WBIC from the WBIC calculated by the information amount criterion calculation unit 118 by calculating Expression (38).
- the information amount criterion calculation unit 118 calculates the WBIC for each of two different contributions (reverse temperatures), and the correction unit 120 causes the information amount criterion calculation unit 118 It can also be said that a description is given of a process of calculating a weighted average according to the degree of contribution (reverse temperature) for the calculated WBIC.
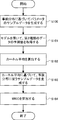
- FIG. 6 is a flowchart illustrating an example of the operation of the information amount criterion calculation device 300.
- the flowchart shown in FIG. 6 differs from the flowchart shown in FIG. 4 in that step S105 is added after step S104.
- step S105 is added after step S104.
- step S104 the process proceeds to step S105.
- the correction unit 120 corrects the WBIC before correction calculated in step S104 according to the above-described first correction method or second correction method.
- step S102 when the correction is performed by the second correction method, two types of kernel averages are calculated in step S102. One is the kernel average calculated by the kernel average calculation unit 114 using ⁇ 1 as ⁇ in equation (25), and the other is the kernel average calculation unit 114 using ⁇ 2 as ⁇ in equation (25) This is the kernel average calculated as follows.
- step S103 parameter sample data is generated for each of the two types of kernel averages.
- step S104 two WBICs are calculated in step S104 using the two sets of sample data generated in step S103.
- WBIC is corrected by correction section 120. Therefore, a more accurate WBIC value can be obtained.
- FIG. 7 is a block diagram illustrating a configuration of the information processing device 1.
- the information processing device 1 includes a correspondence data calculation unit 2 and a new parameter sample generation unit 3.
- the correspondence data calculation unit 2 calculates a plurality of pieces of observation information (Y n ) observed when an input (X n ) is given to the observation target and a second type of data (Y n ). ) And the contribution ( ⁇ ) of each piece of observation information to the plurality of pieces of observation information, the importance of each sample of the parameter is determined.
- the second type of data is data created by a simulator that simulates an observation target based on a sample of parameters for a plurality of samples and the first type of data representing the input. Then, the correspondence data calculation unit 2 calculates data corresponding to the parameter distribution.
- the new parameter sample generation unit 3 generates a new parameter sample according to a predetermined process (for example, kernel hardening) using data corresponding to the parameter distribution calculated by the correspondence data calculation unit 2. According to such a configuration, the information processing device 1 can efficiently calculate the parameters.
- a predetermined process for example, kernel hardening
- Appendix 1 A plurality of observation information observed when an input is given to an observation target, and a simulator that simulates the observation target based on a sample of parameters is created for a plurality of the samples and a first type of data representing the input. Corresponding data for determining the importance of each sample according to the difference from the second type of data and the degree of contribution of each observation information in the plurality of observation information, and calculating data corresponding to the parameter distribution Calculating means;
- An information processing apparatus comprising: a new parameter sample generation unit configured to generate a new sample of the parameter according to a predetermined process using data corresponding to the distribution of the parameter.
- the data corresponding to the distribution of the parameters is a kernel mean
- the correspondence data calculation means calculates the kernel average using a kernel function including the degree of contribution as an inverse temperature, 4.
- the information processing apparatus according to claim 1 wherein the new parameter sample generation unit generates the sample using the kernel average calculated by the correspondence data calculation unit.
- the correspondence data calculation means calculates the kernel average by a kernel ABC (Kernel Approximate Bayesian Computation) using the kernel function represented by the following equation.
- ⁇ is the standard deviation of Gaussian noise for the second type of data
- n is the number of elements of the second type of data
- ⁇ is the inverse temperature
- Y i and Y i ′ is the value of the second type of data.
- the correction means is a relation expressed by excluding a real logarithmic threshold, which is obtained from two mathematical expressions in which different inverse temperature values are set in a second mathematical expression which is an asymptotically developed mathematical expression of the first mathematical expression.
- the information processing device according to claim 7, wherein the WBIC calculated by the information amount criterion calculating unit is corrected by using a certain second relationship and the first relationship.
- the correction means is expressed by excluding a real logarithmic threshold and entropy obtained from three mathematical expressions in which different inverse temperature values are set in a second mathematical expression which is an asymptotically developed mathematical expression of the first mathematical expression.
- the information processing device wherein the WBIC calculated by the information amount criterion calculation unit is corrected by using a third relationship, which is a relationship, and the first relationship. (Appendix 10) Using the input and the observation information when the input is given, a likelihood of the new sample calculated by the new parameter sample generation unit is calculated, and the WBIC is calculated based on the calculated likelihood. 4.
- the information processing device further comprising: a correction unit configured to perform correction.
- a correcting unit for correcting the WBIC The information amount criterion calculation means calculates the WBIC for each of two different contributions, and the correction means calculates a weight according to the contribution for the WBIC calculated by the information amount criterion calculation means.
- the information processing device which calculates an average.
- Appendix 12 An information processing apparatus according to any one of Supplementary Notes 1 to 11, and the simulator, The information processing system, wherein the simulator executes a process based on the sample generated by the new parameter sample generation unit.
- Appendix 13 Depending on the information processing device, A plurality of observation information observed when an input is given to an observation target, and a simulator that simulates the observation target based on a sample of parameters is created for a plurality of the samples and a first type of data representing the input.
- Corresponding data for determining the importance of each sample according to the difference from the second type of data and the degree of contribution of each observation information in the plurality of observation information, and calculating data corresponding to the parameter distribution A calculating step;
- a non-transitory computer-readable medium storing a program for causing a computer to execute a new parameter sample generating step of generating a new sample of the parameter according to a predetermined process using data corresponding to the parameter distribution.
Landscapes
- Engineering & Computer Science (AREA)
- General Physics & Mathematics (AREA)
- Physics & Mathematics (AREA)
- Automation & Control Theory (AREA)
- Business, Economics & Management (AREA)
- Environmental & Geological Engineering (AREA)
- Strategic Management (AREA)
- Economics (AREA)
- Human Resources & Organizations (AREA)
- Ecology (AREA)
- Evolutionary Computation (AREA)
- Biodiversity & Conservation Biology (AREA)
- Atmospheric Sciences (AREA)
- Life Sciences & Earth Sciences (AREA)
- Environmental Sciences (AREA)
- Software Systems (AREA)
- Medical Informatics (AREA)
- Health & Medical Sciences (AREA)
- Artificial Intelligence (AREA)
- Computer Vision & Pattern Recognition (AREA)
- Game Theory and Decision Science (AREA)
- Theoretical Computer Science (AREA)
- General Business, Economics & Management (AREA)
- Tourism & Hospitality (AREA)
- Quality & Reliability (AREA)
- Operations Research (AREA)
- Marketing (AREA)
- Entrepreneurship & Innovation (AREA)
- Development Economics (AREA)
- Management, Administration, Business Operations System, And Electronic Commerce (AREA)
Abstract
La présente invention calcule efficacement des paramètres. L'invention concerne un dispositif de traitement d'informations (1) comprenant : une unité de calcul de données correspondantes (2) qui détermine l'importance de chaque échantillon en fonction d'une pluralité d'ensembles d'informations d'observation qui sont observées lorsqu'une entrée a été faite à une cible d'observation, une différence à partir d'un second type de données créé par un simulateur qui simule la cible d'observation sur la base d'un échantillon de paramètres par rapport à un premier type de données représentant une pluralité des échantillons et des entrées, et la contribution de chaque ensemble d'informations d'observation parmi la pluralité d'ensembles d'informations d'observation, et calcule ensuite des données qui correspondent à la distribution des paramètres ; et une unité de génération de nouvel échantillon de paramètre (3) qui génère un nouvel échantillon pour les paramètres en fonction d'un traitement prescrit à l'aide de données qui correspondent à la distribution des paramètres.
Priority Applications (2)
| Application Number | Priority Date | Filing Date | Title |
|---|---|---|---|
| JP2020550507A JP7198439B2 (ja) | 2018-10-03 | 2019-10-02 | 情報処理装置、情報処理システム、情報処理方法及びプログラム |
| US17/282,707 US20210389502A1 (en) | 2018-10-03 | 2019-10-02 | Information processing apparatus, information processing system, information processing method, and non-transitory computer readable medium storing program |
Applications Claiming Priority (2)
| Application Number | Priority Date | Filing Date | Title |
|---|---|---|---|
| JP2018-188190 | 2018-10-03 | ||
| JP2018188190 | 2018-10-03 |
Publications (1)
| Publication Number | Publication Date |
|---|---|
| WO2020071430A1 true WO2020071430A1 (fr) | 2020-04-09 |
Family
ID=70055213
Family Applications (1)
| Application Number | Title | Priority Date | Filing Date |
|---|---|---|---|
| PCT/JP2019/038940 Ceased WO2020071430A1 (fr) | 2018-10-03 | 2019-10-02 | Dispositif de traitement d'informations, système de traitement d'informations, procédé de traitement d'informations, et support non temporaire lisible par ordinateur dans lequel un programme est stocké |
Country Status (3)
| Country | Link |
|---|---|
| US (1) | US20210389502A1 (fr) |
| JP (1) | JP7198439B2 (fr) |
| WO (1) | WO2020071430A1 (fr) |
Citations (1)
| Publication number | Priority date | Publication date | Assignee | Title |
|---|---|---|---|---|
| JP2018049390A (ja) * | 2016-09-20 | 2018-03-29 | 株式会社東芝 | 特性値推定装置および特性値推定方法 |
Family Cites Families (3)
| Publication number | Priority date | Publication date | Assignee | Title |
|---|---|---|---|---|
| US8781782B2 (en) * | 2010-09-30 | 2014-07-15 | Siemens Aktiengesellschaft | System and method for conditional multi-output regression for machine condition monitoring |
| EP3000053A4 (fr) * | 2013-05-30 | 2017-10-04 | President and Fellows of Harvard College | Systèmes et procédés pour effectuer une optimisation bayésienne |
| EP3440543A4 (fr) * | 2016-04-05 | 2019-08-28 | Deakin University | Systèmes et procédés de fabrication d'un produit |
-
2019
- 2019-10-02 WO PCT/JP2019/038940 patent/WO2020071430A1/fr not_active Ceased
- 2019-10-02 US US17/282,707 patent/US20210389502A1/en not_active Abandoned
- 2019-10-02 JP JP2020550507A patent/JP7198439B2/ja active Active
Patent Citations (1)
| Publication number | Priority date | Publication date | Assignee | Title |
|---|---|---|---|---|
| JP2018049390A (ja) * | 2016-09-20 | 2018-03-29 | 株式会社東芝 | 特性値推定装置および特性値推定方法 |
Non-Patent Citations (2)
| Title |
|---|
| KISAMORI, KEIICHI ET AL.: "Integration of Machine Learning and Simulation", JOURNAL OF THE JAPAN SOCIETY FOR COMPUTATIONAL ENGINEERING AND SCIENCE, 30 April 2017 (2017-04-30), pages 11 - 15 * |
| TAKAFUMI KAJIHARA: "Kernel Recusive ABC: Point Estimation with Intractable Likelihood", ARXIV, vol. 2, 12 June 2018 (2018-06-12), pages 1 - 18, XP081235860, Retrieved from the Internet <URL:https://arxiv.org/abs/1802.08404> [retrieved on 20191120] * |
Also Published As
| Publication number | Publication date |
|---|---|
| US20210389502A1 (en) | 2021-12-16 |
| JPWO2020071430A1 (ja) | 2021-09-02 |
| JP7198439B2 (ja) | 2023-01-04 |
Similar Documents
| Publication | Publication Date | Title |
|---|---|---|
| Wan et al. | Stochastic model updating utilizing Bayesian approach and Gaussian process model | |
| Manfren et al. | Calibration and uncertainty analysis for computer models–a meta-model based approach for integrated building energy simulation | |
| Ling et al. | Integration of structural health monitoring and fatigue damage prognosis | |
| Li et al. | Role of calibration, validation, and relevance in multi-level uncertainty integration | |
| JP5768834B2 (ja) | プラントモデル管理装置及び方法 | |
| JP2020086778A (ja) | 機械学習モデル構築装置および機械学習モデル構築方法 | |
| CN116187153B (zh) | 基于层次贝叶斯的水工结构数字孪生模型更新方法 | |
| US12086697B2 (en) | Relationship analysis device, relationship analysis method, and recording medium for analyzing relationship between a plurality of types of data using kernel mean learning | |
| JP2021022051A (ja) | 機械学習プログラム、機械学習方法および機械学習装置 | |
| JP2013061768A (ja) | 最適モデル推定装置、方法、及びプログラム | |
| JP7097541B2 (ja) | 情報処理装置、情報処理システム、情報処理方法及びプログラム | |
| Sankararaman et al. | Inference of equivalent initial flaw size under multiple sources of uncertainty | |
| Zhang et al. | Bayesian updating of geotechnical parameters with polynomial chaos Kriging model and Gibbs sampling | |
| CN114564487B (zh) | 预报预测相结合的气象栅格数据更新方法 | |
| Sadia et al. | Bayesian change-point modeling with segmented ARMA model | |
| JP7198439B2 (ja) | 情報処理装置、情報処理システム、情報処理方法及びプログラム | |
| JP2025012787A (ja) | 外れ値除去方法及び装置 | |
| JP7359287B2 (ja) | 情報処理装置、制御方法及びプログラム | |
| JP6558861B2 (ja) | 生存確率推定装置、方法、及びプログラム | |
| JP2024029816A (ja) | 状態推定装置、状態推定方法及びプログラム | |
| CN105389406B (zh) | 基于故障的单位加权累计数的整车设计可靠性评估方法 | |
| JP6558862B2 (ja) | 生存確率推定装置、方法、及びプログラム | |
| US20250284987A1 (en) | Combining test and computational model data for predicting object performance | |
| Pak et al. | Inference for exponential parameter under progressive type-ii censoring from imprecise lifetime | |
| JP2021043813A (ja) | 状態推定評価装置、方法、及び、プログラム |
Legal Events
| Date | Code | Title | Description |
|---|---|---|---|
| 121 | Ep: the epo has been informed by wipo that ep was designated in this application |
Ref document number: 19868926 Country of ref document: EP Kind code of ref document: A1 |
|
| ENP | Entry into the national phase |
Ref document number: 2020550507 Country of ref document: JP Kind code of ref document: A |
|
| NENP | Non-entry into the national phase |
Ref country code: DE |
|
| 122 | Ep: pct application non-entry in european phase |
Ref document number: 19868926 Country of ref document: EP Kind code of ref document: A1 |