WO2020091201A1 - Système d'évaluation de fonction visuelle de poissons, procédé de criblage de médicament toxique oculaire faisant appel à celui-ci, procédé de classement de vision de poissons, et support d'enregistrement lisible par ordinateur - Google Patents
Système d'évaluation de fonction visuelle de poissons, procédé de criblage de médicament toxique oculaire faisant appel à celui-ci, procédé de classement de vision de poissons, et support d'enregistrement lisible par ordinateur Download PDFInfo
- Publication number
- WO2020091201A1 WO2020091201A1 PCT/KR2019/010224 KR2019010224W WO2020091201A1 WO 2020091201 A1 WO2020091201 A1 WO 2020091201A1 KR 2019010224 W KR2019010224 W KR 2019010224W WO 2020091201 A1 WO2020091201 A1 WO 2020091201A1
- Authority
- WO
- WIPO (PCT)
- Prior art keywords
- fish
- water flow
- difference
- visual function
- visual
- Prior art date
- Legal status (The legal status is an assumption and is not a legal conclusion. Google has not performed a legal analysis and makes no representation as to the accuracy of the status listed.)
- Ceased
Links
Images




Classifications
-
- A—HUMAN NECESSITIES
- A61—MEDICAL OR VETERINARY SCIENCE; HYGIENE
- A61B—DIAGNOSIS; SURGERY; IDENTIFICATION
- A61B3/00—Apparatus for testing the eyes; Instruments for examining the eyes
-
- A—HUMAN NECESSITIES
- A61—MEDICAL OR VETERINARY SCIENCE; HYGIENE
- A61B—DIAGNOSIS; SURGERY; IDENTIFICATION
- A61B5/00—Measuring for diagnostic purposes; Identification of persons
Definitions
- the present invention relates to a system for evaluating the visual function of fish, an eye toxicity drug screening method using the same, a method for grading fish, and a computer-readable storage medium.
- Contrast sensitivity testing one of the methods of evaluating visual function used in the ophthalmic area, can evaluate the function of a wider retina by evaluating the ability to detect light of different intensity (difference in brightness) existing between adjacent objects in space. have. This is a more sensitive evaluation method than visual function evaluation using text.
- Non-Patent Document 1 a visual inspection method using zebrafish contrast sensitivity is disclosed. However, Non-Patent Document 1 only quantifies the visual performance of zebrafish laba that is genetically modified and lacks mobility.
- the present inventors continue to study how to evaluate visual function using a difference in contrast sensitivity, as well as confirming an abnormal visual function that could not be confirmed by a general examination, as well as an objective and quantified time to distinguish the visual function abnormality level in stages.
- the ability evaluation method was developed and the present invention was completed.
- Non-Patent Document 1 Rinner, Oliver, Rick, Jens M, Neuhauss, Stephan C F. Contrast sensitivity, spatial and temporal tuning of the larval zebrafish optokinetic response Investigative Ophthalmology & Visual Science , January 2005, Vol. 46, No.
- An object of the present invention is to provide a visual function evaluation system for fish.
- Another object of the present invention is to provide a method for evaluating eye toxicity screening of drugs.
- Another object of the present invention is to provide a method for grading fish eyesight.
- the present invention provides a visual function evaluation system for fish.
- the fish visual function evaluation system may include:
- a display unit on which a video having a preset water flow visual stimulation pattern is displayed
- a moving unit positioned on an upper side of the display device to enable movement of a plurality of fish visually responding to the moving image
- a photographing unit installed to be spaced a predetermined distance from an upper side of the moving unit, and photographing the moving unit;
- An analysis unit that analyzes the fish movement pattern by receiving and analyzing the captured image.
- the display unit may display a video having a water flow visual stimulation pattern with a difference in sensitivity (brightness) from each stage.
- the fish visual function evaluation system a display unit; Moving part; And a photographing unit.
- a support may be included under the display unit.
- contrast sensitivity refers to light (brightness difference) of different intensities existing between adjacent objects in the inspection space
- contrast sensitivity test refers to the ability to detect the difference in contrast sensitivity. Say evaluation.
- the difference in contrast sensitivity for each step may mean a difference in color contrast sensitivity.
- the contrast sensitivity may be set in various stages for each color, and contrast sensitivity may be determined by a combination of various colors such as gray / black and white / blue as well as white / gray.
- the display unit may be any device that can display a video having a water flow visual stimulation pattern with a difference in contrast sensitivity.
- any display-implemented device such as a smartphone or tablet can be used.
- the "water flow time stimulation pattern” refers to a video pattern that shows a water flow and has a time stimulation pattern of a repeat pattern of a certain color at the same time.
- Mainnstream refers to the movement of cells or animals in response to stimulation of running water.
- the present invention introduces the mainstream properties of such fish into visual function evaluation. Specifically, when a video of a stimulation pattern having a repeating pattern of a certain light (color) is reproduced, the video of a stimulation pattern of the repeating pattern is recognized as a flow of light opposite to the flow of water, and fish with normal vision react to it. Will move in the direction of the visual stimulation pattern.
- a video having a water flow visual stimulation pattern (visual stimulus rating table) with a difference in contrast sensitivity is produced step by step in the display unit.
- RGB color table see https://en.wikipedia.org/wiki/Web_colors, etc.
- Gray color When gray color is expressed in RGB, it can be distinguished from 0 to 255 in 256 steps.
- the dark color is more concentrated. This is because a person reacts nonlinearly to the brightness of color. Therefore, it is necessary to correct the gamma to nonlinearly transform the brightness of the color using the nonlinear transfer function (green in the middle of FIG. 3).
- Gamma correction was performed with reference to "Adobe® RGB (1998) Color Image Encoding”. After gamma correction, we can see that the distribution of bright colors is more.
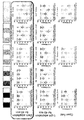
- the present invention was prepared and used as a visual stimulation rating table having a difference in contrast sensitivity reflecting the gamma correction value displayed as shown at the far right of FIG. 3.
- FIG. 4 is a visual stimulation rating table of the present invention, which is shown separately by separating the rightmost rating table of FIG. 3.
- the difference in contrast sensitivity for each stage may be based on the color difference in the color table shown in FIG. 4.
- the contrast sensitivity difference may be a difference from the G4 color to G7, G8, G9, G10, G11, G12, G13 or G14 color.
- the water flow video having the color of step G4 in FIG. 4 is reproduced, and then the water flow video having the color of step G7 is played, and then the movement pattern of the fish is analyzed. Then, the water flow video having the G4 level color is played back, and then the water flow video having the G8 level color is played to analyze the movement pattern of the fish. Then, the next step is to play the G4 color water flow video and then the G9 color water flow video.
- the display unit on which the video having the water flow visual stimulation pattern is displayed plays back a water flow image having a flow in one direction for a certain time, and after a certain time stops, has a difference in contrast sensitivity with the reproduced image while in the opposite direction.
- the water flow image with the flow can be reproduced for a certain period of time.
- the water flow image having the flow in one direction is reproduced for 5 to 25 seconds, and after 1 to 5 second stop, the water flow having the flow in the opposite direction while having a difference in contrast sensitivity with the reproduced image Images can be played back for 5 to 25 seconds.
- the reason for giving a pause is to solve a problem in which it is difficult to accurately analyze when the pom is located in a dark color part of the visual stimulation pattern and it is not possible to identify the pom. That is, the purpose of this is to evaluate the distance traveled by fish in the absence of a visual stimulation pattern image in the background.
- the moving part may include a plurality of lanes of transparent material through which fish can move. This is to ensure that shooting can be done clearly.
- an arrow displayed on the moving part indicates a water flow direction.
- the analysis unit may be implemented with various computing devices such as a desktop, laptop, and smartphone.
- the analysis unit can analyze the movement pattern of the fish as follows:
- the analysis of the movement pattern of the fish in the analysis unit may be performed through automated object tracking.
- the automated object tracking may be implemented by a method such as an automated high-throughput tracking system.
- the automated high performance tracking system is well known in the art. Examples include DanioVision from Nodulus and ZebraLab and VisioBox from ViewPoint.
- the water flow video of the G4 stage is played as a starting point, and when the G7 stage video is played after the G4 stage water flow video is played, the proportion of the population moved from the starting point to the opposite side is analyzed due to the mainstream nature of the fish.
- the fish's visual function is normal, it will move in the opposite direction when the video of water flow stimulation pattern video of G7 is played after G4 due to mainstream nature. However, if the fish's vision function is impaired, it will not be able to move in the opposite direction.
- the compound to be tested is treated with fish and then applied to the above-mentioned visual function evaluation system to evaluate whether the drug treated with the test compound causes ocular abnormalities.
- the present invention provides an objective and quantified evaluation method to identify visual dysfunction that could not be confirmed by a general examination, and to distinguish the degree of visual dysfunction step by step.
- the fish may be zebrafish, but is not necessarily limited thereto.
- the zebrafish may be at least 4 days after fertilization.
- a method for screening ocular toxicity of a drug comprising a step is provided.
- the water flow visual stimulation with a difference in contrast sensitivity means a water flow visual stimulation with a visual stimulation class difference based on the visual stimulation rating table disclosed in FIG. 4. For example, if the water flow time stimulation of the G4 stage is given followed by the water flow time stimulation of the G7 stage, it will be "water flow time stimulation with contrast sensitivity difference".
- the fish will move in the opposite direction.
- the ratio of the number of individuals moving in the opposite direction of the drug-treated fish was analyzed.
- the difference in sensitivity compared to that of the normal fish.
- the proportion of individuals moving in the opposite direction at a certain level compared to the rate of individuals moving in the opposite direction in response to water flow stimulation. If reduced, the drug could be evaluated as a drug with eye toxicity.
- the fish may be zebrafish.
- the zebrafish may be at least 4 days after fertilization.
- the drug may be any drug that requires evaluation of eye toxicity. Specifically, it may be any one selected from the group consisting of natural compounds, synthetic compounds, RNA, DNA, polypeptides, enzymes, and proteins, but is not limited thereto.
- the dark acclimation can be performed for 20 to 60 minutes.
- the system for evaluating the visual function of fish of the present invention is performed in a dark room, in order to minimize other visual stimulation in addition to the water flow stimulation. Therefore, if dark adaptation is performed before the reaction of fish to the water flow stimulation, there is an effect of increasing the sensitivity to water flow stimulation.
- the detecting step may be a step of evaluating the visual function of the animal using the aforementioned visual function evaluation system of fish of the present invention.
- the visual function evaluation system of fish provides an effect of classifying the visual function abnormality level in stages.
- the eye toxicity screening method of the present invention using the visual function evaluation system of the fish provides an effect capable of a rapid and efficient large-scale screening technique for evaluating eye toxicity and safety of a new drug.
- the method for grading the eyesight of a fish according to the present invention can quantify the degree of damage to the visual function by grading the eyesight of the fish.
- FIG. 1 is a schematic diagram of a visual function evaluation system for fish according to the present invention.
- RGB color table 2 is a typical RGB color table.
- Figure 3 shows the manufacturing process of the rating table of the present invention.
- 4 is a visual stimulation rating table of the present invention.
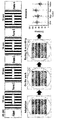
- FIG. 5 is a schematic diagram showing a video realization method having a water flow visual stimulation pattern.
- Figure 6 shows the results of the zebrafish reaction experiment according to dark adaptation (top), light adaptation (middle), non-adaptation (bottom).
- FIG. 9 is a flow chart of a method for grading fish in accordance with an embodiment of the present invention.
- FIG. 10 is a graph for explaining the initial reaction characteristics according to an embodiment of the present invention.
- 11 is a view showing a result of comparing the average initial reaction rate and the maximum initial reaction rate according to the difference in sensitivity compared to each step of the water stimulation pattern according to an embodiment of the present invention.
- FIG. 12 is a view showing a result of comparing the initial reaction rate according to the difference in sensitivity of each step of the water stimulation pattern in accordance with an embodiment of the present invention.
- FIG. 13 is a view showing a result of averaging an area under a curve of an initial reaction rate according to one or more water flow visual stimulation patterns having a plurality of contrast sensitivity differences according to an embodiment of the present invention.
- 15 is a view showing a result of comparing the average reaction termination rate according to the difference in sensitivity of each step of the water flow stimulation pattern according to an embodiment of the present invention.
- FIG. 16 is a view showing a result of averaging an area under a curve of an overall reaction rate according to one or more water flow visual stimulation patterns having a plurality of step contrast sensitivity differences according to an embodiment of the present invention.
- Example 1 Construction of a zebrafish visual function evaluation system
- a 4 day old zebrafish pom was used.
- a display unit displaying a video with a water flow visual stimulation pattern below the moving part in the darkroom after dark acclimation or light acclimation for a certain period of time (e.g., 45 minutes)
- the video recording was performed through the playback unit (FIG. 1).
- the video having the water flow visual stimulation pattern is schematically shown in FIG. 5.
- a certain amount of time e.g., 15 seconds
- DPF post fertilization
- the contrast sensitivity difference is based on the visual stimulation rating table in Figure 4 G4 to G7; G4 to G8; G4 to G9; G4 to G10; G4 to G11; From the G4 to the G12 and the G4 to the G13, a video having a water flow visual stimulation pattern with different contrast sensitivity was reproduced on the display.
- the zebrafish which has normal visual function, gathers to the left when it receives the G4 level visual stimulation and moves to the right (opposite) when it receives the G7, G8, G9, G10, G11, G12 or G13 visual stimulation. If the zebrafish has abnormal visual function, it will not move well to the right (opposite side), the direction of movement of the visual stimulation with reduced contrast sensitivity.
- the proportion of zebrafish moving individuals is analyzed and shown in FIG. 7.
- FIG. 9 is a flow chart of a method for grading fish in accordance with an embodiment of the present invention.
- an image of a moving fish may be acquired as a video having a preset water flow visual stimulation pattern is displayed (S110).
- a video having a water flow visual stimulation pattern having a difference in contrast sensitivity for each step may be displayed, and an image of a moving fish may be obtained in response thereto.
- one or more water flow visual stimuli having a difference in contrast sensitivity by giving a difference from any one of the G4 to G12 steps in the color table divided into 16 steps of G1 to G16 Patterns can be used.
- the initial reaction characteristics may include at least one of an average initial reaction rate, a maximum initial reaction rate, and an initial reaction rate.
- FIG. 10 is a graph for explaining the initial reaction characteristics according to an embodiment of the present invention.
- the incubation period represents the time it takes for the first individual to cross the starting point boundary line after the start of stimulation, and the average initial reaction rate can be calculated according to the following formula, and the maximum initial reaction rate is illustrated in FIG. 10. It can be calculated as the slope of the tangent line at the time that shows the fastest rate of population reduction in the population change curve.
- the initial reaction rate can be calculated according to the following formula.
- FIG. 11 is a view showing a result of comparing the average initial reaction rate and the maximum initial reaction rate according to the difference in sensitivity of each step of the water flow stimulation pattern according to an embodiment of the present invention,
- Figure 11 (a) is an average The initial reaction rate is shown, and (b) represents the maximum initial reaction rate.
- FIG. 11 is the average initial reaction rate when the difference in sensitivity compared to each of the control fish (ie, normal fish, control) and Gentamicin treatment concentration (5uM, 10uM, 15uM) fish in the color of G7 to G12 steps
- the control fish ie, normal fish, control
- Gentamicin treatment concentration 5uM, 10uM, 15uM
- FIG. 12 is a view showing a result of comparing the initial reaction rate according to the difference in sensitivity of each step of the water stimulation pattern in accordance with an embodiment of the present invention.
- Figure 12 also shows the initial reaction rate when the difference in sensitivity compared to the control fish (control) and Gentamicin treatment concentration (5uM, 10uM, 15uM) fish color G7 to G12, respectively, the color of the G7 and G8 steps In the case of, it can be seen that the classification of reaction characteristics by concentration is relatively clear.
- FIG. 13 is a view showing a result of averaging the area under the curve of the initial reaction rate according to one or more water flow time stimulation pattern with a plurality of step contrast sensitivity difference according to an embodiment of the present invention, (a) is Digoxigenin treatment The color of the G7 to G12 stages for each concentration indicates the result of averaging the area under the curve of the initial reaction rate when the contrast sensitivity is different, and (b) shows the difference in contrast sensitivity with the color of the G10 to G12 stage for each concentration of Digoxigenin treatment. The result of averaging the area under the curve of the initial reaction rate in the quasi case is shown.
- the degree of impairment of visual function may be increased, and the initial reaction characteristics may be differentiated according to the degree of impairment of visual function.
- the present invention proposes a method for grading the visual acuity of fish based on the result of comparing the initial reaction characteristics with the normal group.
- the reaction termination property may include at least one of an average reaction termination rate, a maximum reaction termination rate, and an overall reaction rate.
- the minimum response time represents the time it takes for the first individual to cross the arrival point boundary line after the stimulation starts
- the average response termination rate can be calculated according to the following formula, and the maximum response termination rate is illustrated in FIG. 14. It can be calculated as the slope of the tangent line at the time that shows the fastest rate of increase in the population in the population change curve shown in.
- the total reaction rate can be calculated according to the following formula.
- 15 is a view showing a result of comparing the average reaction termination rate according to the difference in sensitivity of each step of the water flow stimulation pattern according to an embodiment of the present invention.
- Figure 15 shows the average reaction termination rate when the difference in sensitivity compared to each of the control fish (control) and Gentamicin treatment concentration (5uM, 10uM, 15uM) fish color G7 to G12 steps, G7 And in the case of the color of the G8 step, it can be seen that the distinction of the reaction characteristics for each concentration is relatively clear.
- FIG. 16 is a view showing the result of averaging the area under the curve of the overall reaction rate according to one or more water flow visual stimulation pattern with a plurality of contrast sensitivity differences according to an embodiment of the present invention, (a) is Digoxigenin treatment The results of averaging the area under the curve of the overall reaction rate when the contrast sensitivity is different for each color in the G7 to G12 steps for each concentration, and (b) shows the difference in contrast sensitivity for each of the concentrations of the G10 to G12 for each concentration of Digoxigenin treatment. It shows the result of averaging the area under the curve of the total reaction rate in the quasi case.
- the degree of impairment of the visual function may be severe, and the termination characteristics of the reaction may be differentiated according to the degree of impairment of the visual function.
- the present invention proposes a method for grading the visual acuity of fish based on the result of comparing the reaction termination characteristics with the normal group.
- the visual acuity of the fish may be graded based on at least one of the calculated initial reaction characteristics and the reaction termination characteristics (S130).
- the ratio of the characteristic value of the fish to the characteristic value of the control fish may be compared with a preset grading criterion to classify the eyesight of the fish.
- the method of grading the eyesight described above with reference to FIG. 9 may be performed by a processing device capable of image processing and calculation.
- a computer readable storage medium in which instructions executable by a processor for executing each step of the method for grading fish sight described above with reference to FIG. 9 may be provided. .
Landscapes
- Life Sciences & Earth Sciences (AREA)
- Health & Medical Sciences (AREA)
- General Health & Medical Sciences (AREA)
- Molecular Biology (AREA)
- Veterinary Medicine (AREA)
- Engineering & Computer Science (AREA)
- Biomedical Technology (AREA)
- Heart & Thoracic Surgery (AREA)
- Medical Informatics (AREA)
- Biophysics (AREA)
- Surgery (AREA)
- Animal Behavior & Ethology (AREA)
- Physics & Mathematics (AREA)
- Public Health (AREA)
- Ophthalmology & Optometry (AREA)
- Pathology (AREA)
- Farming Of Fish And Shellfish (AREA)
Abstract
La présente invention concerne un système d'évaluation d'une fonction visuelle de poissons et un procédé de criblage d'un médicament toxique oculaire faisant appel à celui-ci. Le système d'évaluation de la fonction visuelle des poissons selon la présente invention fournit un effet de tri des degrés d'anomalies de fonctions visuelles sur une base d'étape par étape.
Applications Claiming Priority (4)
| Application Number | Priority Date | Filing Date | Title |
|---|---|---|---|
| KR10-2018-0131826 | 2018-10-31 | ||
| KR1020180131826A KR102120159B1 (ko) | 2018-10-31 | 2018-10-31 | 어류의 시기능 평가 시스템 및 이를 이용한 안구 독성 약물 스크리닝 방법 |
| KR1020190098246A KR102223999B1 (ko) | 2019-08-12 | 2019-08-12 | 어류의 시력 등급화 방법 및 컴퓨터 판독 가능한 저장매체 |
| KR10-2019-0098246 | 2019-08-12 |
Publications (1)
| Publication Number | Publication Date |
|---|---|
| WO2020091201A1 true WO2020091201A1 (fr) | 2020-05-07 |
Family
ID=70464159
Family Applications (1)
| Application Number | Title | Priority Date | Filing Date |
|---|---|---|---|
| PCT/KR2019/010224 Ceased WO2020091201A1 (fr) | 2018-10-31 | 2019-08-12 | Système d'évaluation de fonction visuelle de poissons, procédé de criblage de médicament toxique oculaire faisant appel à celui-ci, procédé de classement de vision de poissons, et support d'enregistrement lisible par ordinateur |
Country Status (1)
| Country | Link |
|---|---|
| WO (1) | WO2020091201A1 (fr) |
Citations (5)
| Publication number | Priority date | Publication date | Assignee | Title |
|---|---|---|---|---|
| KR101476355B1 (ko) * | 2014-01-22 | 2014-12-24 | 강원대학교산학협력단 | 제브라피쉬 약물 행동 검사장치 |
| KR101533573B1 (ko) * | 2012-07-02 | 2015-07-06 | 지노믹디자인 주식회사 | 어류의 시각 인식을 이용한 생리 활성 물질의 스크리닝 방법 |
| KR101638596B1 (ko) * | 2014-11-28 | 2016-07-11 | 기초과학연구원 | 실험체의 사회성 실험장치 및 실험방법 |
| KR20170086678A (ko) * | 2012-05-21 | 2017-07-26 | 디씨비-유에스에이 엘엘씨 | 제브라피시 모델을 사용한 약물 스크리닝 방법 및 이 방법으로 스크린된 화합물 |
| US20180279921A1 (en) * | 2015-10-14 | 2018-10-04 | President And Fellows Of Harvard College | Automatically classifying animal behavior |
-
2019
- 2019-08-12 WO PCT/KR2019/010224 patent/WO2020091201A1/fr not_active Ceased
Patent Citations (5)
| Publication number | Priority date | Publication date | Assignee | Title |
|---|---|---|---|---|
| KR20170086678A (ko) * | 2012-05-21 | 2017-07-26 | 디씨비-유에스에이 엘엘씨 | 제브라피시 모델을 사용한 약물 스크리닝 방법 및 이 방법으로 스크린된 화합물 |
| KR101533573B1 (ko) * | 2012-07-02 | 2015-07-06 | 지노믹디자인 주식회사 | 어류의 시각 인식을 이용한 생리 활성 물질의 스크리닝 방법 |
| KR101476355B1 (ko) * | 2014-01-22 | 2014-12-24 | 강원대학교산학협력단 | 제브라피쉬 약물 행동 검사장치 |
| KR101638596B1 (ko) * | 2014-11-28 | 2016-07-11 | 기초과학연구원 | 실험체의 사회성 실험장치 및 실험방법 |
| US20180279921A1 (en) * | 2015-10-14 | 2018-10-04 | President And Fellows Of Harvard College | Automatically classifying animal behavior |
Similar Documents
| Publication | Publication Date | Title |
|---|---|---|
| WO2014163375A1 (fr) | Procédé de recherche d'une substance étrangère sur un substrat | |
| WO2022145614A1 (fr) | Système et procédé d'estimation du poids du bétail utilisant une image d'étable de bétail | |
| WO2021091021A1 (fr) | Système de détection d'incendie | |
| WO2017039259A1 (fr) | Appareil et procédé pour le diagnostic d'un équipement électrique à l'aide d'une caméra thermique | |
| WO2016163755A1 (fr) | Procédé et appareil de reconnaissance faciale basée sur une mesure de la qualité | |
| WO2024112121A1 (fr) | Logiciel d'intelligence artificielle de lecture d'image de tissu pathologique de cancer gastrique | |
| WO2020226455A1 (fr) | Dispositif de prédiction de neuropathie optique à l'aide d'une image de fond d'œil et procédé de fourniture d'un résultat de prédiction de neuropathie optique | |
| WO2017008320A1 (fr) | Procédé de détection de qualité de couche mince en polysilicium et système l'utilisant | |
| WO2018088760A2 (fr) | Procédé et dispositif d'ajustement de conditions de détermination de qualité pour un corps d'essai | |
| WO2020256407A1 (fr) | Procédé et système d'apprentissage automatique pour inspection de produits | |
| WO2021132813A1 (fr) | Procédé d'évaluation de douleur et dispositif d'analyse utilisant un modèle d'apprentissage profond | |
| CN107219229B (zh) | 一种面板灰尘过滤方法及装置 | |
| WO2009119983A2 (fr) | Système de vérification d'un substrat fpd et de tranches à semi-conducteurs utilisant des images dupliquées | |
| WO2019103186A1 (fr) | Procédé et système d'estimation de l'âge du cerveau par analyse d'ondes cérébrales | |
| WO2016167499A1 (fr) | Appareil de photographie et procédé permettant de commander un appareil de photographie | |
| WO2023027494A1 (fr) | Procédé et appareil pour déterminer l'épaisseur de la couche de fibres nerveuses rétiniennes à partir d'une image de fond d'œil en couleurs pour un test de glaucome sur la base d'un apprentissage profond | |
| WO2019221586A1 (fr) | Système et procédé de gestion d'image médicale, et support d'enregistrement lisible par ordinateur | |
| WO2015105324A1 (fr) | Procédé pour détecter une zone défaillante d'une couche de fibre de nerf rétinien | |
| WO2021112436A1 (fr) | Dispositif et procédé de calcul automatique de la propreté des intestins | |
| WO2020226273A1 (fr) | Boîtier de capteurs d'image pour compter des particules fines à l'aide d'une ligne de grille virtuelle, et système et procédé de comptage de particules fines | |
| WO2023132676A1 (fr) | Procédé, appareil et programme de diagnostic interactif sans contact pour la croissance et le développement de nourrissons et fonction de diagnostic de santé | |
| WO2019103188A1 (fr) | Système et procédé d'évaluation de lésion cérébrale traumatique par analyse d'ondes cérébrales | |
| WO2018062963A2 (fr) | Procédé d'évaluation de caractéristiques d'écoulement de fluide d'un module de boîtier de capteur de réseau optique cmos sans lentille ayant un canal d'écoulement | |
| WO2012023681A1 (fr) | Procédé de détection de réaction indésirable à un médicament sur la base d'une étude rétrospective de cohorte au moyen d'un dossier médical électronique, procédé de détection de réaction indésirable à une intervention et procédé de détection de réaction indésirable à un médicament ou à une intervention sur la base d'une étude rétrospective de cohorte au moyen d'un dossier médical électronique et de données d'électrocardiogramme | |
| WO2018088649A1 (fr) | Procédé de détection de reflet |
Legal Events
| Date | Code | Title | Description |
|---|---|---|---|
| 121 | Ep: the epo has been informed by wipo that ep was designated in this application |
Ref document number: 19877958 Country of ref document: EP Kind code of ref document: A1 |
|
| NENP | Non-entry into the national phase |
Ref country code: DE |
|
| 122 | Ep: pct application non-entry in european phase |
Ref document number: 19877958 Country of ref document: EP Kind code of ref document: A1 |