WO2020144754A1 - サイズ分布計測装置、サイズ分布計測方法、サンプル容器 - Google Patents
サイズ分布計測装置、サイズ分布計測方法、サンプル容器 Download PDFInfo
- Publication number
- WO2020144754A1 WO2020144754A1 PCT/JP2019/000281 JP2019000281W WO2020144754A1 WO 2020144754 A1 WO2020144754 A1 WO 2020144754A1 JP 2019000281 W JP2019000281 W JP 2019000281W WO 2020144754 A1 WO2020144754 A1 WO 2020144754A1
- Authority
- WO
- WIPO (PCT)
- Prior art keywords
- light
- sample
- particles
- size distribution
- size
- Prior art date
- Legal status (The legal status is an assumption and is not a legal conclusion. Google has not performed a legal analysis and makes no representation as to the accuracy of the status listed.)
- Ceased
Links
Images








Classifications
-
- G—PHYSICS
- G01—MEASURING; TESTING
- G01N—INVESTIGATING OR ANALYSING MATERIALS BY DETERMINING THEIR CHEMICAL OR PHYSICAL PROPERTIES
- G01N15/00—Investigating characteristics of particles; Investigating permeability, pore-volume or surface-area of porous materials
- G01N15/02—Investigating particle size or size distribution
- G01N15/0205—Investigating particle size or size distribution by optical means
- G01N15/0227—Investigating particle size or size distribution by optical means using imaging; using holography
-
- G—PHYSICS
- G01—MEASURING; TESTING
- G01N—INVESTIGATING OR ANALYSING MATERIALS BY DETERMINING THEIR CHEMICAL OR PHYSICAL PROPERTIES
- G01N15/00—Investigating characteristics of particles; Investigating permeability, pore-volume or surface-area of porous materials
- G01N15/02—Investigating particle size or size distribution
- G01N15/0205—Investigating particle size or size distribution by optical means
- G01N15/0211—Investigating a scatter or diffraction pattern
-
- G—PHYSICS
- G01—MEASURING; TESTING
- G01N—INVESTIGATING OR ANALYSING MATERIALS BY DETERMINING THEIR CHEMICAL OR PHYSICAL PROPERTIES
- G01N15/00—Investigating characteristics of particles; Investigating permeability, pore-volume or surface-area of porous materials
- G01N15/10—Investigating individual particles
- G01N15/14—Optical investigation techniques, e.g. flow cytometry
- G01N15/1429—Signal processing
- G01N15/1433—Signal processing using image recognition
-
- G—PHYSICS
- G01—MEASURING; TESTING
- G01N—INVESTIGATING OR ANALYSING MATERIALS BY DETERMINING THEIR CHEMICAL OR PHYSICAL PROPERTIES
- G01N15/00—Investigating characteristics of particles; Investigating permeability, pore-volume or surface-area of porous materials
- G01N15/10—Investigating individual particles
- G01N15/14—Optical investigation techniques, e.g. flow cytometry
- G01N15/1434—Optical arrangements
-
- G—PHYSICS
- G01—MEASURING; TESTING
- G01N—INVESTIGATING OR ANALYSING MATERIALS BY DETERMINING THEIR CHEMICAL OR PHYSICAL PROPERTIES
- G01N21/00—Investigating or analysing materials by the use of optical means, i.e. using sub-millimetre waves, infrared, visible or ultraviolet light
- G01N21/17—Systems in which incident light is modified in accordance with the properties of the material investigated
- G01N21/47—Scattering, i.e. diffuse reflection
- G01N21/49—Scattering, i.e. diffuse reflection within a body or fluid
- G01N21/51—Scattering, i.e. diffuse reflection within a body or fluid inside a container, e.g. in an ampoule
-
- G—PHYSICS
- G01—MEASURING; TESTING
- G01N—INVESTIGATING OR ANALYSING MATERIALS BY DETERMINING THEIR CHEMICAL OR PHYSICAL PROPERTIES
- G01N15/00—Investigating characteristics of particles; Investigating permeability, pore-volume or surface-area of porous materials
- G01N2015/0042—Investigating dispersion of solids
- G01N2015/0053—Investigating dispersion of solids in liquids, e.g. trouble
-
- G—PHYSICS
- G01—MEASURING; TESTING
- G01N—INVESTIGATING OR ANALYSING MATERIALS BY DETERMINING THEIR CHEMICAL OR PHYSICAL PROPERTIES
- G01N15/00—Investigating characteristics of particles; Investigating permeability, pore-volume or surface-area of porous materials
- G01N15/10—Investigating individual particles
- G01N15/14—Optical investigation techniques, e.g. flow cytometry
- G01N15/1434—Optical arrangements
- G01N2015/144—Imaging characterised by its optical setup
- G01N2015/1445—Three-dimensional imaging, imaging in different image planes, e.g. under different angles or at different depths, e.g. by a relative motion of sample and detector, for instance by tomography
-
- G—PHYSICS
- G01—MEASURING; TESTING
- G01N—INVESTIGATING OR ANALYSING MATERIALS BY DETERMINING THEIR CHEMICAL OR PHYSICAL PROPERTIES
- G01N15/00—Investigating characteristics of particles; Investigating permeability, pore-volume or surface-area of porous materials
- G01N15/10—Investigating individual particles
- G01N15/14—Optical investigation techniques, e.g. flow cytometry
- G01N15/1434—Optical arrangements
- G01N2015/1452—Adjustment of focus; Alignment
-
- G—PHYSICS
- G01—MEASURING; TESTING
- G01N—INVESTIGATING OR ANALYSING MATERIALS BY DETERMINING THEIR CHEMICAL OR PHYSICAL PROPERTIES
- G01N15/00—Investigating characteristics of particles; Investigating permeability, pore-volume or surface-area of porous materials
- G01N15/10—Investigating individual particles
- G01N15/14—Optical investigation techniques, e.g. flow cytometry
- G01N2015/1493—Particle size
Definitions
- the present invention relates to a technique for measuring the size distribution of particles contained in a liquid sample.
- biopharmaceuticals are macromolecules, they are likely to aggregate, and aggregation may cause toxicity.
- US Food and Drug Administration is trying to tighten regulations on the concentration control of aggregates. Therefore, there is a need for a technique for quantitatively measuring the size distribution of a desired density for aggregates in the submicron region of 0.1 to 1 ⁇ m.
- Patent Document 1 describes a technique for detecting particles using optical measurement.
- a single particle detection technique by a scanning molecule counting method that individually detects single particles using optical measurement using a confocal microscope or a multiphoton microscope, light emission in a plurality of specific wavelength bands is performed.
- the technique for detecting a single particle in a sample solution according to the present invention is based on the position of a photodetection region of a microscope in a sample solution containing plural kinds of single particles that do not emit in different wavelength bands.
- the light in the specific wavelength band from the light detection area is detected to generate the time-series light intensity data, and the single particle that does not emit light in the specific wavelength band in the time-series light intensity data
- the decrease in light intensity that occurs when the light enters the detection region is individually detected as a signal indicating the presence of each single particle.
- Patent Document 2 Provides a technology capable of reducing a measurement error when measuring a test object using light.
- the correspondence relation describing the correspondence relation between the intensity of the reflected light and the size of the test subject when the test subject is irradiated with light. Data is acquired, and the size of the test object is acquired using the correspondence data and the intensity of the reflected light.
- the optical measurement method according to the present invention by subtracting a component due to the inclination of the container of the test object from the detection signal representing the intensity of the reflected light when the light is irradiated to the test object, Correct the tilt of the container. ] Technology is described (see summary).
- Patent Document 1 the position of the light detection region is moved faster than the Brownian motion of the particles to follow the Brownian motion of the particles (0016 of the same document).
- the measurement light is not scanned in the depth direction (direction along the optical axis), it is considered difficult to measure the size of particles even if the presence of particles is detected.
- the particle size is calculated by referring to the correspondence data using the reflected light intensity.
- the reflected light from the stopped particles is used, and it is considered not to calculate the size of the particles that undergo Brownian motion in the depth direction.
- the present invention has been made in view of the above problems, and an object thereof is to provide an optical measurement technique capable of quantitatively measuring the size distribution of particles that undergo Brownian motion in a sample.
- the size distribution measuring device measures the reflected light intensity while scanning the focal position along the optical axis direction of the measurement light, and calculates the particle size distribution according to the largest reflected light intensity.
- the size distribution measuring device of the present invention it is possible to quantitatively measure the size distribution of particles that undergo Brownian motion in three dimensions.
- 1 is a configuration diagram of a size distribution measuring device 100 according to the first embodiment. It is a conceptual diagram explaining the outline
- 10 is a flowchart illustrating details of the procedure described in FIG. 9.
- 7 is a flowchart illustrating another operation example of the size distribution measuring device 100. It is a figure which shows the experimental result which the size distribution measuring apparatus 100 calculated the size distribution about the sample 110 containing the particle of the same size.
- FIG. 6 is a configuration diagram of a size distribution measuring apparatus 100 according to the second embodiment.
- FIG. FIG. 9 is a diagram showing a modified example of the size distribution measuring apparatus 100 according to the second embodiment.
- FIG. 9 is a configuration diagram of a size distribution measuring device 100 according to a third embodiment. It is a figure explaining the procedure which switches a measuring method according to a particle diameter. It is a block diagram of the sample container 1900 which concerns on this Embodiment 5.
- FIG. 11 is a diagram illustrating a procedure for forming a reference particle storage hole 1906. It is a block diagram of the sample container 2100 which concerns on Embodiment 6. It is a figure explaining the structure of the sample container 2200 which concerns on Embodiment 7. It is a side sectional view explaining the procedure which introduces sample 110 in sample container 2200. It is a side sectional view explaining the usage of the sample container 2200 concerning Embodiment 7. It is an example of correspondence data describing the correspondence between the reflected light intensity and the particle size.
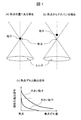
- FIG. 1 is a schematic diagram illustrating the relationship between the focal position of measurement light and the reflected light intensity (detection signal). Comparing the case where the focus position of the measurement light coincides with the position of the particle (FIG. 1A) and the case where it does not coincide (FIG. 1B), the reflected light intensity is the same even if the irradiation intensity is the same. Is different. The intensity of reflected light decreases as the positions of the two shift. In other words, when the focus position and the particle position match, the reflected light intensity becomes maximum. Further, the larger the particle size, the higher the reflected light intensity tends to be (Fig. 1(c)). By using these correspondence relationships, the particle size can be calculated using the reflected light intensity.
- the reflected light intensity from particles with different sizes may be the same depending on the correspondence between particle size and focus position (see the dotted line in Fig. 1(c)). Therefore, in order to accurately calculate the particle size, it can be said that it is important to use the reflected light intensity from the focal position of the measurement light.
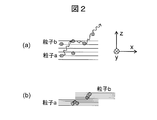
- FIG. 2 is a schematic diagram for explaining Brownian motion of particles and scanning speed of measurement light.
- the scanning speed of the measurement light is slower than the Brownian motion speed of the particle, the measurement light cannot follow the movement of the particle, and thus it is difficult to distinguish the particles (FIG. 2A).
- the scanning speed of the measurement light is sufficiently fast with respect to the Brownian motion, the movement can be traced for each particle, so that individual particles can be distinguished (FIG. 2B). Specific set values will be described later.
- the design parameters of the optical system of the size distribution measuring device will be described.
- the spot size of the measurement light be slightly larger than the upper limit size of the particle to be measured. Therefore, when the wavelength of the measurement light is ⁇ and the numerical aperture of the objective lens is NA, the light spot diameter R particle can be expressed by the following equation 1.
- ⁇ z can be defined as the distance at which the reflected signal intensity decreases from a maximum value to a certain threshold value (for example, half the maximum value) when the focal position is scanned in the z direction.
- the image acquisition speed can be defined as the number of image acquisitions per second.
- this numerical value is referred to as a frame rate. Since the particles in the liquid to be measured are in Brownian motion, it is necessary to acquire an image at a frame rate that can follow Brownian motion in order to obtain a correct particle size distribution.
- the required frame rate will be described using an equation. Here, for simplicity of explanation, only Brownian motion in the z direction is considered.
- the average moving amount L of the Brownian particles during the time t is given by the following expression 3.
- Equation 3 is a particle diffusion constant, and is given by Equation 4 below using Boltzmann's constant k, absolute temperature T, fluid viscosity ⁇ , and particle diameter a.
- n is a natural number of 1 or more, and is the average number of times a particle stays in the z resolution range.
- Equation 8 can also be said to be a condition for being able to continuously detect the reflected light from the particles n times or more on average. Substituting equation 7 into equation 8 and rearranging yields equation 9 below.
- n is expressed by the following formula 11 using a proportional coefficient ⁇ of 1 or less.
- Formula 12 is a condition that the frame rate must meet in order to accurately measure the particle size distribution, which is predicted based on theoretical considerations.
- the fact that the right side is proportional to the diffusion constant D means that the faster the movement of particles, the higher the frame rate required to follow the movement.
- the right side is inversely proportional to the z resolution ⁇ z because the higher the z resolution, the smaller the amount of deviation from the focus position of the particle that is allowable in detecting reflected light, so a higher frame rate is required.
- the fact that the right side is inversely proportional to the z-pitch ⁇ d indicates that a higher frame rate is required because the measurement speed in the z-direction decreases as the z-pitch becomes finer. Since it is difficult to predict the value of ⁇ only by theoretical consideration, it is desirable to determine it based on simulation or experiment.
- the required frame rate becomes lower as ⁇ z and ⁇ d are increased.
- ⁇ z is too large, the probability that a plurality of particles are present within the range of z resolution becomes high, and as a result, it becomes difficult to measure a sample having a high particle concentration.
- the z-resolution should be determined by considering the particle concentration range of interest.
- ⁇ d must be smaller than ⁇ z. Even if the range is smaller than ⁇ z, if ⁇ d is made too large, the probability that the particles are substantially focused is reduced, and as a result, the measurement accuracy of the particle size is reduced.
- ⁇ d should be determined in consideration of particle size measurement accuracy.
- the inventors further conducted a simulation study to verify the validity of the condition of Expression 12.
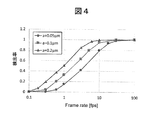
- the simulation it is assumed that there is one Brownian-moving particle in the measurement area, and the reflection signal waveform from the particle obtained when the measurement area is measured at frame rate FR, z resolution ⁇ z, and z pitch ⁇ d is repeated 10,000 times.
- the detection success rate of particles (the number of times one particle was detected/10,000) was evaluated by calculating and processing the obtained waveform with a predetermined algorithm.
- the signal strength is standardized by the value when the positions of the particle and the focus match.
- the frame rate is 0.1 fps to 10 fps, a plurality of maximum peaks are observed even though only one particle is present. This is because when the frame rate is low, the scanning speed in the z direction becomes equal to or lower than the Brownian motion speed of the particle, and the reflected light from the same particle is detected at a plurality of z positions.
- the maximum peaks are interpreted as signals corresponding to different particles and the data is analyzed, the same particles are counted multiple times and the number of particles is overestimated.
- the particle is a particle only when a reflection signal intensity equal to or higher than a threshold value is obtained at z positions consecutive a certain number of times (first number of times) or more, and then
- the analysis method of determining that the measurement of the particle is completed can be effective when the reflected signal intensity equal to or less than the threshold value is obtained at z positions consecutive for a certain number of times (second number) or more.
- the first number and the second number may be the same or different.
- the threshold value is 0.1 and the first and second times are 5, the number of detected particles is 1 at 0.1 fps, 0 at 1 fps, 1 at 10 fps, and 1 at 100 fps. .. From this example, it can be seen that an accurate measurement result cannot be obtained if the frame rate is insufficient.
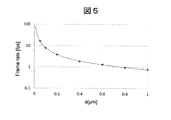
- the broken line is the result of fitting the simulation result using the following Expression 13.
- FIGS. 5, 6 and 7 are the results of plotting the minimum frame rate at which the detection success rate is 0.9 or more against ⁇ z and ⁇ d, respectively.
- the broken line is a line drawn by using the equation 13 with the same value of ⁇ as in FIG. This result shows that the required frame rate is inversely proportional to ⁇ z and ⁇ d.
- the simulation results of FIGS. 5, 6 and 7 are all substantially in agreement with the equation 12, and the validity of the equation 12 was confirmed from the above examination results.
- the value of ⁇ in Expression 12 varies depending on the analysis algorithm and the experimental (simulation) conditions, but in most cases, ⁇ >4 is necessary for the detection success rate to exceed 0.9.
- a large frame rate is preferable to bring the detection rate close to 1 as described above, but if the frame rate is increased more than necessary, noise increases and the particle size measurement accuracy decreases. This is because the frequency band of the signal increases as the frame rate increases. Considering the performance of a typical detector, it is desirable to keep the frame rate below 100 fps. Converting this to the value of ⁇ , the upper limit of ⁇ is about 10,000.
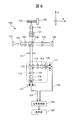
- FIG. 8 is a configuration diagram of the size distribution measuring apparatus 100 according to the first embodiment of the present invention.
- the laser light emitted from the light source 101 is converted into parallel light by the collimator lens 102, and the polarization is adjusted to 45 degree linear polarization by the ⁇ /2 plate 103 whose optical axis is set to about 22.5 degrees with respect to the horizontal direction.
- the polarized beam splitter 104 splits the polarized light into the measurement light and the reference light.
- the reference light After the polarization state of the reference light is adjusted by the ⁇ /2 plate 105, the reference light is reflected by the reference light mirror 106 and enters the polarization beam splitter 104 again.
- the measurement light is condensed by the objective lens 108 so that the focal position matches the measurement position of the sample 110.
- the XY-axis drive mechanism 107 scans the focal position of the measurement light on the XY plane (plane perpendicular to the depth direction of the sample 110).
- the Z-axis drive mechanism 109 scans the focal position of the measurement light along the Z-axis direction (optical axis direction of the measurement light).
- the reflected light reflected from the sample 110 enters the polarization beam splitter 104 again.
- the reflected light and the reference light are combined by the polarization beam splitter 104 to be combined light.
- the combined light is guided to the interference optical system 112 via the pinhole 111.
- the combined light is split by the polarization beam splitter 113 into transmitted light and reflected light.
- the reflected light passes through the ⁇ /4 plate 114 whose optical axis is set to about 45 degrees with respect to the horizontal direction, and then is condensed by the condenser lens 115 and is branched into two by the Wollaston prism 116. , The first interference light and the second interference light having a phase relationship different from each other by 180 degrees are generated.
- the current differential type photodetector 117 detects the first and second interference lights and outputs a signal 122 proportional to the difference in their intensity.
- the transmitted light after passing through the ⁇ /2 plate 118 whose optical axis is set to approximately 22.5 degrees with respect to the horizontal direction, is condensed by the condenser lens 119 and is branched into two by the Wollaston prism 120.
- the current differential type photodetector 121 detects the third and fourth interference lights and outputs a signal 123 proportional to the difference in their intensities.
- the signal processing unit 124 calculates the size distribution of particles contained in the sample 110 based on the signals 122 and 123. The principle of calculating the size distribution is as described above. Details of the calculation procedure will be described later.
- the display unit 125 displays the calculation result of the signal processing unit 124.
- FIG. 9 is a conceptual diagram illustrating an outline of a procedure in which the size distribution measuring apparatus 100 measures the size distribution of particles included in the sample 110. Each step of FIG. 9 will be described below, and then details of each step will be described using a flowchart described later.
- the signal processing unit 124 acquires a plane image (observation image on the XY plane) of the sample 110 while scanning the focal position of the measurement light along the z-axis direction (step 1 in FIG. 9). For example, XY images are acquired at 100 different focal positions along the z-axis direction. The conditions regarding the scanning interval (z pitch) of the focus positions in the z-axis direction are as described above.
- the signal processing unit 124 specifies the individual particles included in the XY image by comparing adjacent XY images with each other (step 2 in FIG. 9). For example, a light spot in the search window can be traced by setting a partial area in the XY image as a search window and comparing light spots contained therein in adjacent XY images. For example, as described with reference to FIG. 4, when the reflected light intensity is equal to or higher than the determination threshold in the three adjacent XY images, it can be determined that particles are present at that position. It is desirable that the size of the search window be set so that one particle is included.
- the XY image number corresponds to the focus position in the z direction.
- the reflected light intensity becomes maximum when the focus position and the particle position match. Therefore, when the correspondence relationship between the image number and the reflected light intensity is plotted, the signal waveform as shown in the middle part of FIG. 9 is obtained. Can be obtained.
- the signal processing unit 124 acquires this signal waveform for each identified particle.
- the signal processing unit 124 identifies the particle size by referring to the correspondence data in which the correspondence between the reflected light intensity and the particle size is defined in advance. Specifically, the size of each particle is acquired by referring to the correspondence data using the maximum reflected light intensity acquired in step 2.
- the signal processing unit 124 calculates the particle size distribution, and the display unit 125 displays the calculation result. For example, as shown in the lower part of FIG. 9, a particle size number distribution can be output.
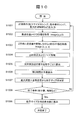
- FIG. 10 is a flowchart explaining the details of the procedure described in FIG.
- the size distribution measuring apparatus 100 calculates the size distribution of particles contained in the sample 110 according to this flowchart. Each step of FIG. 10 will be described below.
- Step S1001 The user inputs measurement conditions to the size distribution measuring device 100.
- the signal processor 124 receives the input.
- the measurement conditions for example, the size range of particles to be measured, the range of the number of particles contained in the sample 110, the maximum measurement time, and the like can be considered.
- the signal processing unit 124 scans the focal position in the z-axis direction and acquires the XY image at each focal position (S1002 to S1003).
- the signal processing unit 124 may appropriately perform image sharpening processing such as gain correction and noise processing when tracking individual particles in the XY image (S1004).
- the signal processing unit 124 identifies each particle in the XY image.
- the signal processing unit 124 calculates a plot (corresponding to the plot in the middle part of FIG. 9) showing the correspondence between the focal position in the z-axis direction and the reflected light intensity for each specified particle (S1005). Since this processing requires a certain amount of time, the estimated remaining processing time may be displayed (S1006).
- the signal processing unit 124 identifies the particle size by referring to the correspondence data using the maximum reflected light intensity (S1007).
- Steps S1008 to S1009 If the measurement end condition is reached, the process proceeds to step S1009. If not, the process returns to step S1001 and the same process is repeated (S1008).
- the measurement end condition here is, for example, the range of the number of particles or the maximum measurement time input in step S1001.
- the signal processing unit 124 calculates the particle size distribution and displays it on the screen via the display unit 125 (S1009).
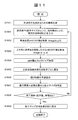
- FIG. 11 is a flowchart illustrating another operation example of the size distribution measuring device 100.
- This flowchart is the same as FIG. 10 except that step S1101 is performed before step S1001.
- the size distribution measurement apparatus 100 performs a simple measurement for generally understanding the number of particles in the sample 110. For example, a small number of XY images are acquired using predetermined measurement conditions, and the number of particles is calculated using this. For example, when a clearly abnormal measurement result is obtained, it can be estimated that the actual number of particles is far from the specified measurement condition. As a result, the operator can roughly predict appropriate measurement conditions to be set in step S1001.
- the steps after step S1001 are the same as those in FIG.
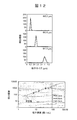
- FIG. 12 is a figure which shows the experimental result which the size distribution measuring apparatus 100 calculated the size distribution about the sample 110 containing the particle of the same size.
- the experimental results shown in the upper part of FIG. 12 show the results of measuring three types of particles having diameters of 0.2 ⁇ m, 0.5 ⁇ m, and 1.0 ⁇ m at a particle concentration of 1.5 ⁇ 10 7 particles/mL. Only a single particle size was detected at any particle size.
- the lower part of FIG. 12 shows the result of similarly calculating the size distribution by changing the particle concentration variously. For all particle sizes, the experimental results in agreement with the calculated values were obtained when the particle concentration was within the range of approximately 10 7 to 10 8 particles/mL.
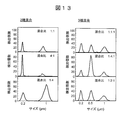
- FIG. 13 is a diagram showing an experimental result in which the size distribution measuring apparatus 100 calculates the size distribution for the sample 110 containing particles of different sizes.
- the left diagram of FIG. 13 shows the experimental results for the sample 110 in which two types of particle sizes are mixed.
- the right diagram of FIG. 13 shows the experimental results for the sample 110 in which three types of particle sizes are mixed.
- the mixing ratio of each particle size is also shown in FIG. It can be seen that the particle sizes can be accurately distinguished in all the experimental results.
- FIG. 14 is a diagram showing the results of similarly calculating the size distribution by changing the particle concentration variously for the sample 110 containing particles of different sizes.
- the left diagram of FIG. 14 shows the experimental results for the sample 110 in which two types of particle sizes are mixed.
- the right diagram of FIG. 14 shows the experimental results for the sample 110 in which three types of particle sizes are mixed. At each particle concentration, good measurement results are obtained that are in good agreement with the calculated values.
- the size distribution measuring apparatus 100 acquires an XY image of the sample 110 at each focus position while scanning the focus position of the measurement light along the optical axis direction.
- the size distribution measuring apparatus 100 further specifies each particle on the XY image individually, and obtains the particle size using the reflected light intensity obtained from the position where the reflected light intensity is the largest among the focal positions in the z-axis direction. This makes it possible to accurately obtain the size distribution of particles that undergo Brownian motion along the z-axis direction.
- the size distribution measuring apparatus 100 scans the measurement light in the z-axis direction at a speed faster than the Brownian motion velocity of the particles. This makes it possible to accurately count the number of particles by following the Brownian motion of the particles in the z-axis direction.
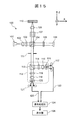
- FIG. 15 is a configuration diagram of the size distribution measuring apparatus 100 according to the second embodiment of the present invention.
- the Z-axis drive mechanism 109 scans the focal position of the measurement light in the z direction.
- a variable focus lens 126 is provided instead of the objective lens 108 and the Z-axis drive mechanism 109.
- the variable focus lens 126 can change the focal position in the z-axis direction. Therefore, also in the configuration example shown in FIG. 15, the same operation as that of the first embodiment can be performed.
- FIG. 16 is a diagram showing a modified example of the size distribution measuring apparatus 100 according to the second embodiment.
- an XYZ axis drive mechanism 127 is provided instead of the XY axis drive mechanism 107 and the Z axis drive mechanism 109.
- the XYZ axis drive mechanism 127 can change the focal position in each of the xyz axis directions. Therefore, also in the configuration example shown in FIG. 16, the same operation as that of the first embodiment can be performed.
- FIG. 17 is a configuration diagram of the size distribution measuring apparatus 100 according to the third embodiment of the present invention.
- the size distribution measuring device 100 according to the third embodiment is configured as a confocal microscope.
- the light emitted from the laser light source 1701 passes through the pinhole 1702, is converted into parallel light by the collimator lens 1703, and reaches the optical path separation element 1704 and the scanning mechanism 1705.
- the scanning mechanism 1705 scans the focus position of the measurement light with respect to the sample 110.
- the measurement light is applied to the sample 110 via the projection lens 1706, the imaging lens 1707, and the objective lens 1708.
- the reflected light reflected from the sample 110 propagates through the optical path in the opposite direction and reaches the pinhole 1709 via the optical path separation element 1704.
- the optical system is designed so that when the focal position of the measurement light in the z-axis direction is in focus with respect to the measurement position of the sample 110, the reflected light is also focused on the measurement surface of the measuring instrument 1710.
- the size distribution measuring apparatus 100 according to the third embodiment can also perform the same operation as in the first and second embodiments by changing the focus position of the measurement light in each of the xyz axis directions.
- Slits may be used instead of the pinholes 1702 and 1709.
- An LED Light Emitting Diode
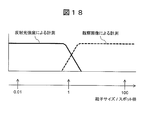
- FIG. 18 is a diagram illustrating a procedure of switching the measurement method according to the particle diameter.
- the particle size distribution can be measured by the method using the reflected light intensity described in the first to third embodiments.
- the method using reflected light intensity is not desirable. This is because even if the measurement light is scanned, the reflected light intensity does not change significantly as in the middle part of FIG. Therefore, when the particle size is sufficiently large, it is possible to measure the particle size using the observation image of the sample 110. This is because if the particle size is sufficiently large, the particles can be identified on the observed image.
- the ratio of particle size to spot size can be used as a standard for switching the measurement method.
- a threshold value for example, 2 or less
- the measurement result is adopted. If it is equal to or more than the threshold value, the particle size is measured again using the observed image.
- the particle size/spot diameter is equal to or larger than the threshold value
- the measurement result is adopted, and if the particle size/spot diameter is equal to or smaller than the threshold value, the particle size is measured again using the reflected light intensity. Any measuring method may be used at the boundary between the two methods.
- the signal processing unit 124 can acquire an observation image of the sample 110 based on the same principle as that of a scanning optical microscope, for example. This is because the size distribution measuring device 100 uses an optical system that scans the measurement light.
- the threshold for switching from the measurement based on the reflected light intensity to the measurement based on the observation image is the same as the threshold for switching the measurement based on the observation image to the measurement based on the reflected light intensity, but these thresholds may be different.
- Embodiment 5 the method of calculating the particle size distribution by following the Brownian motion of the particles has been described.
- the Brownian motion of particles can be suppressed to some extent depending on the structure of the sample container that houses the sample 110. From the viewpoint of measurement accuracy, it is desirable that air bubbles do not enter the sample 110. Depending on the structure of the sample container, the inclusion of bubbles can be suppressed to some extent. Therefore, in Embodiments 5 to 7 of the present invention, structural examples of the sample container suitable for use in Embodiments 1 to 4 will be described.
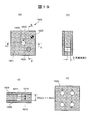
- FIG. 19 is a configuration diagram of a sample container 1900 according to the fifth embodiment.
- 19A is a top view
- FIG. 19B is a BB sectional view
- FIG. 19C is an AA sectional view
- FIG. 19D is a top view of a modified example.
- the sample container 1900 is a container that holds the sample 110.
- the sample container 1900 includes a base material 1901, a bubble storage portion 1902, a storage hole 1904, a horizontal reference marker 1905, and a reference particle storage hole 1906.
- the accommodation hole 1904 is a hole for accommodating the sample 110, and is formed so as to penetrate the base material 1901.
- the depth of the accommodation hole 1904 is, for example, about 300 ⁇ m to 1.5 mm.
- the bubble containing portion 1902 is a void portion protruding from the side surface of the containing hole 1904, and communicates with the containing hole 1904. Even if bubbles are generated when the sample 110 is introduced into the containing hole 1904, the bubbles can be released to the bubble containing portion 1902 (gas discharge port). This makes it possible to prevent bubbles from interfering with the measurement when measuring the sample 110 in the accommodation hole 1904.
- the inner wall of the accommodation hole 1904 be rounded.
- one bubble containing portion 1902 is arranged on the side wall of the containing hole 1904, but two bubble containing portions 1902 may be arranged.
- the bubble accommodating portions 1902 may be arranged at positions facing each other with the center of the hole in between. If there are too many bubble containing portions 1902, it may be difficult for the bubbles to move, so one or two bubble containing portions 1902 are desirable for each containing hole 1904.
- the width of the bubble accommodation portion 1902 is 0.5 mm and the length is 1. It was confirmed that the bubbles move smoothly from the accommodation hole 1904 to the bubble accommodation portion 1902 by setting the distance to about 5 mm.
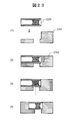
- FIG. 19D shows an example in which a storage hole 1904 to which one bubble storage portion 1902 is connected and a storage hole 1904 to which two bubble storage portions 1902 are connected are shown.
- the horizontal reference marker 1905 can be used as a reference when the sample container 1900 is installed horizontally.
- water containing bubbles may be contained in the horizontal reference marker 1905, and the sample container 1900 may be installed so that the center of the bubble is located at the center of the horizontal reference marker 1905.
- the reference particle accommodating hole 1906 accommodates the reference particles approximately in the center in the depth direction.
- the position of the reference particle can be used as a reference for the focus position of the measurement light in the z-axis direction. The procedure for sealing the reference particles will be described later.
- the upper surface of the base material 1901 is sealed by a sealing substrate 1908, and the lower surface is sealed by a transparent substrate 1909. That is, the upper surface and the bottom surface of the accommodation hole 1904 are also sealed by these substrates.
- the measurement light is applied to the sample 110 in the accommodation hole 1904 via the transparent substrate 1909. Due to the influence of the interface reflection from the substrates, the portion 1910 near the surface of each substrate in the space inside the accommodation hole 1904 is excluded from the measurement target. Therefore, the area 1911 is actually measured.
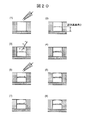
- FIG. 20 is a diagram illustrating a procedure for forming the reference particle storage hole 1906.
- a sealing material for example, an ultraviolet curable resin
- the sealing material is injected into the empty hole (1).
- the measurement reference height for example, the center in the depth direction of the hole
- the sealing material is cured by ultraviolet irradiation or heating according to the property of the sealing material (2).
- Standard particles for example, poly beads having a diameter of 1 ⁇ m
- the reference particles are covered with the encapsulant (6) and similarly cured (7).
- the reference particle accommodation hole 1906 in which the reference particles are arranged at the measurement reference height is completed (8).
- the sample container 1900 according to the fifth embodiment includes a bubble container 1902 connected to the container hole 1904. Accordingly, even if bubbles are generated when the sample 110 is introduced into the storage hole 1904, the bubbles can be released to the bubble storage portion 1902. Accordingly, when the measurement is performed on the accommodation hole 1904, it is possible to prevent bubbles from hindering the measurement, and thus the measurement accuracy is improved.
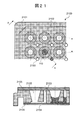
- FIG. 21 is a configuration diagram of a sample container 2100 according to the sixth embodiment of the present invention.
- the upper stage is a top view and the lower stage is a sectional view taken along line AA.
- a plurality of wells 2102 are arranged on the plate 2101, and an interval (pitch) between the wells 2102 is determined by, for example, a product standard.
- the well 2102 is an accommodation hole for accommodating the sample 110.
- the well 2102 is formed in a tapered shape from the top surface to the bottom surface.
- An outlet 2103 is formed near the well 2102.
- the bottom of the well 2102 and the bottom of the outlet 2103 are connected by a flow path 2104.
- the upper surface of the well 2102 and the upper surface of the outlet 2103 are formed on the same plane as the upper surface of the plate 2101. After introducing the sample 110 into the well 2102, air bubbles can be released via the flow path 2104 and the outlet 2103.
- the bottom surface of the plate 2101 is sealed by the transparent substrate 2106, so that the bottom of the well 2102 is also sealed.
- the measurement light is applied to the sample 110 in the well 2102 via the transparent substrate 2106.
- the top surface of the well 2102 is covered with a seal 2105 (eg, sealing tape).
- a seal 2105 eg, sealing tape
- the introduction port of the well 2102 is formed in a tapered shape, so that the sample 110 can be smoothly introduced. Accordingly, it is possible to suppress the generation of bubbles when introducing the sample 110. Further, even if bubbles are generated in the well 2102, the bubbles can be released via the flow path 2104 and the outlet 2103. With these structures, the particle size distribution can be calculated accurately even when the well 2102 having a regulated pitch is used.
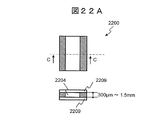
- FIG. 22A is a diagram illustrating the configuration of the sample container 2200 according to the seventh embodiment of the present invention.
- the upper section of FIG. 22A is a side sectional view, and the lower section of FIG. 22A is a CC sectional view.
- the sample container 2200 has a structure in which a member having a flow channel 2204 is sandwiched between transparent substrates 2209.
- the depth of the flow path 2204 is, for example, about 300 ⁇ m to 1.5 mm, similar to the accommodation hole 1904 of the fifth embodiment.
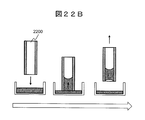
- FIG. 22B is a side sectional view for explaining the procedure of introducing the sample 110 into the sample container 2200.
- the procedure proceeds from left to right in Figure 22B.
- the sample 110 is housed in an appropriate member (eg, beaker or petri dish), and one end of the flow channel 2104 is brought into contact with the liquid surface.
- the sample 110 is introduced into the channel 2104 by capillarity.
- the sample container 2200 is pulled up from the liquid surface. Even if bubbles are introduced into the flow channel 2104, the bubbles can be escaped from the opposite end (gas discharge port) of the flow channel 2104.
- FIG. 23 is a side sectional view illustrating a method of using the sample container 2200 according to the seventh embodiment.
- the sample container 2200 includes a frame member 2301.
- the frame member 2301 may be configured as a part of the sample container 2200, or may be configured as a member different from the sample container 2200.
- the cassette member that holds the sample container 2200 can be configured as the frame member 2301.
- the frame member 2301 is a member to which the sample container 2200 is attached. After introducing the sample 110 into the sample container 2200, the sample container 2200 is attached to the frame member 2301.
- the frame member 2301 has a wall portion 2302 that covers one end of the flow path 2204.
- the wall 2302 may cover either one end or both ends of the flow channel 2204 depending on how to handle the sample container 2200.
- FIG. 23(4) is an example of covering both ends.
- the wall portion 2302 can prevent the sample 110 contained in the sample container 1900 from being dried.
- the present invention is not limited to the above-described embodiment, but includes various modifications.
- the above-described embodiments have been described in detail in order to explain the present invention in an easy-to-understand manner, and are not necessarily limited to those including all the configurations described.
- a part of the configuration of one embodiment can be replaced with the configuration of another embodiment, and the configuration of another embodiment can be added to the configuration of one embodiment.
- FIG. 24 is an example of correspondence data describing the correspondence between reflected light intensity and particle size. This correspondence may differ depending on the photorefractive index of the sample solution. Therefore, as shown in FIG. 24, the correspondence relationship can be described for each refractive index of the sample solution.
- the user specifies the refractive index of the sample solution to the size distribution measuring device 100, and the signal processing unit 124 acquires the particle size from the correspondence relationship corresponding to the refractive index.
- the refractive index of the sample solution generally differs depending on the sample type, but if the samples of the same type have different refractive indices, the correspondence relationship may be described for each refractive index.
- the XY axis drive mechanism 107 in the first embodiment for example, an acousto-optic deflection element (AOD), a polygon mirror, a co-vibration galvanometer mirror (MEMS mirror), or the like can be used.
- AOD acousto-optic deflection element
- MEMS mirror co-vibration galvanometer mirror
- the same configuration can be used for the XY axis drive in the second to third embodiments.
- the Z-axis drive mechanism 109 in the first embodiment for example, a mechanism that drives a stage on which the sample 110 is placed can be used.
- variable focus lens 126 in the second embodiment for example, an ultrasonic variable focus lens, a liquid crystal variable focus mirror, a deformable mirror, or the like can be used.
- the same configuration can be used when the XYZ axis drive mechanism 127 in the third embodiment scans the focal point in the z axis direction.
- the signal processing unit 124 can be configured by using hardware such as a circuit device that implements the function, or is configured by executing software that implements the function by an arithmetic unit (Central Processing Unit: CPU, etc.). You can also do it.
- hardware such as a circuit device that implements the function, or is configured by executing software that implements the function by an arithmetic unit (Central Processing Unit: CPU, etc.). You can also do it.
- CPU Central Processing Unit
- Size distribution measuring device 110 Sample 112: Interference optical system 124: Signal processing unit 1900: Sample container 2100: Sample container 2200: Sample container 2300: Sample container 2301: Frame member 2302: Wall part
Landscapes
- Chemical & Material Sciences (AREA)
- General Health & Medical Sciences (AREA)
- Immunology (AREA)
- Health & Medical Sciences (AREA)
- Analytical Chemistry (AREA)
- Biochemistry (AREA)
- Physics & Mathematics (AREA)
- General Physics & Mathematics (AREA)
- Life Sciences & Earth Sciences (AREA)
- Pathology (AREA)
- Dispersion Chemistry (AREA)
- Engineering & Computer Science (AREA)
- Signal Processing (AREA)
- Length Measuring Devices By Optical Means (AREA)
- Investigating Or Analysing Materials By Optical Means (AREA)
Abstract
Description
以下では本発明の理解を容易にするため、まず粒子のサイズを計測する基本原理について説明する。その後の本発明の実施形態に係るサイズ分布計測装置の具体的な構成例について説明する。



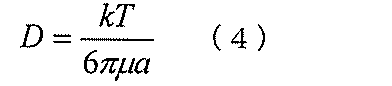




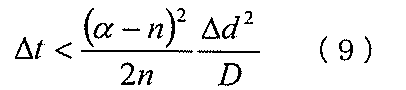
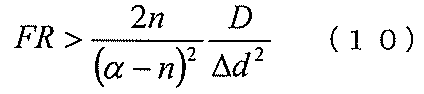
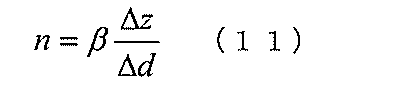
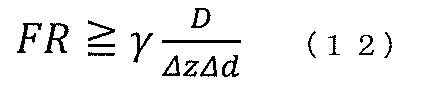
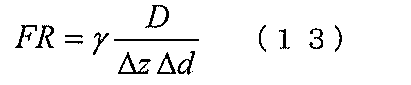
図8は、本発明の実施形態1に係るサイズ分布計測装置100の構成図である。光源101から出射されたレーザ光はコリメートレンズ102によって平行光に変換され、光学軸が水平方向に対して約22.5度に設定されたλ/2板103によって偏光を45度直線偏光に調整された後、偏光ビームスプリッタ104によって計測光と参照光とに偏光分離される。
ユーザは、サイズ分布計測装置100に対して計測条件を入力する。信号処理部124はその入力を受け取る。計測条件としては例えば、計測する粒子のサイズ範囲、サンプル110内に含まれる粒子数の範囲、最大計測時間、などが考えられる。
信号処理部124は、z軸方向における焦点位置を走査しながら、各焦点位置におけるXY画像をそれぞれ取得する(S1002~S1003)。焦点位置の初期値はz=0とする。信号処理部124は、XY画像内において個々の粒子を追跡する際に、ゲイン補正やノイズ処理などの画像鮮明化処理などを適宜実施してもよい(S1004)。
信号処理部124は、XY画像内の各粒子を特定する。信号処理部124は、z軸方向における焦点位置と反射光強度との間の対応関係を表すプロット(図9中段のプロットに対応する)を、特定した粒子ごとに算出する(S1005)。この処理はある程度の時間を要するので、予測される残り処理時間を表示するなどしてもよい(S1006)。信号処理部124は、最大反射光強度を用いて対応関係データを参照することにより、粒子サイズを特定する(S1007)。
計測終了条件に到達した場合はステップS1009へ進み、到達していない場合はステップS1001へ戻って同様の処理を繰り返す(S1008)。ここでいう計測終了条件は、例えばステップS1001において入力した粒子数の範囲や最大計測時間である。信号処理部124は、粒子のサイズ分布を算出し、表示部125を介して画面表示する(S1009)。
本実施形態1に係るサイズ分布計測装置100は、計測光の焦点位置を光軸方向に沿って走査しながら、各焦点位置におけるサンプル110のXY画像を取得する。サイズ分布計測装置100はさらに、XY画像上の各粒子を個別に特定し、z軸方向の各焦点位置のうち反射光強度が最も大きい位置から得られる反射光強度を用いて粒子サイズを求める。これにより、z軸方向に沿ってブラウン運動する粒子のサイズ分布を正確に求めることができる。
図15は、本発明の実施形態2に係るサイズ分布計測装置100の構成図である。実施形態1においては、Z軸駆動機構109が計測光の焦点位置をz方向において走査することを説明した。図15においては対物レンズ108とZ軸駆動機構109に代えて、焦点可変レンズ126を備える。焦点可変レンズ126は、z軸方向における焦点位置を変化させることができる。したがって図15に示す構成例においても、実施形態1と同様の動作を実施することができる。
図17は、本発明の実施形態3に係るサイズ分布計測装置100の構成図である。本実施形態3に係るサイズ分布計測装置100は、共焦点顕微鏡として構成されている。レーザ光源1701から出射された光は、ピンホール1702を通過した後、コリメートレンズ1703によって平行光に変換され、光路分離素子1704と走査機構1705に到達する。走査機構1705は、サンプル110に対する計測光の焦点位置を走査する。計測光は、投影レンズ1706、結像レンズ1707、対物レンズ1708を介してサンプル110に対して照射される。サンプル110から反射した反射光は、光路を反対向きに伝搬し、光路分離素子1704を介してピンホール1709に到達する。z軸方向における計測光の焦点位置がサンプル110の計測位置に対して合焦しているとき、反射光も計測器1710の計測面上に焦点が合うように、光学系が設計されている。
図18は、粒子径に応じて計測方法を切り替える手順を説明する図である。計測光のスポットサイズが粒子サイズに対して比較的大きい場合、実施形態1~3で説明した反射光強度を用いる方法により、粒子サイズ分布を計測することができる。これに対して粒子サイズがスポットサイズよりも十分大きい場合、反射光強度を用いる方法は望ましくない。計測光を走査しても反射光強度は図9中段のように大きく変化しないからである。そこで粒子サイズが十分大きい場合は、サンプル110の観察画像を用いて粒子サイズを計測することが考えられる。粒子サイズが十分大きければ、観察画像上で粒子を識別することができるからである。
以上の実施形態においては、粒子のブラウン運動に追従して粒子サイズ分布を算出する手法を説明した。他方で計測精度の観点からは、粒子のブラウン運動をできる限り抑制することが望ましい。サンプル110を収容するサンプル容器の構造によっては、粒子のブラウン運動をある程度抑制することができる。また計測精度の観点からは、サンプル110内に気泡が混入しないようにすることが望ましい。サンプル容器の構造によっては気泡混入もある程度抑制することができる。そこで本発明の実施形態5~7では、実施形態1~4において用いるのに適したサンプル容器の構造例について説明する。
本実施形態5に係るサンプル容器1900は、収容穴1904と接続された気泡収容部1902を備える。これにより、サンプル110を収容穴1904へ導入する際に気泡が生じたとしても、その気泡を気泡収容部1902へ逃がすことができる。これにより、収容穴1904に対して測定を実施する際に、気泡が測定を阻害しないようにすることができるので、測定精度が向上する。
図21は、本発明の実施形態6に係るサンプル容器2100の構成図である。上段は上面図、下段はAA断面図である。プレート2101上に複数のウェル2102が配置されており、ウェル2102間の間隔(ピッチ)は例えば製品規格によって定められている。ウェル2102は、サンプル110を収容する収容穴である。ウェル2102は、上面から底面に向かって先細り形状に形成されている。
本実施形態6に係るサンプル容器2100は、ウェル2102の導入口がテーパ形状に形成されているので、サンプル110をスムーズに導入することができる。これにより、サンプル110を導入するときの気泡発生を抑制することができる。またウェル2102内に気泡が発生したとしても、流路2104と流出口2103を介して気泡を逃がすことができる。これらの構造により、ピッチが規定されているウェル2102を用いる場合においても、粒子サイズ分布を精度よく算出することができる。
図22Aは、本発明の実施形態7に係るサンプル容器2200の構成を説明する図である。図22A上段は側断面図、図22A下段はCC断面図である。サンプル容器2200は、流路2204が形成された部材を透過性基板2209によって挟んだ構造を備えている。流路2204の深さは実施形態5の収容穴1904と同様に例えば300μm~1.5mm程度である。
本発明は、前述した実施形態に限定されるものではなく、様々な変形例が含まれる。例えば、上記した実施形態は本発明を分かりやすく説明するために詳細に説明したものであり、必ずしも説明した全ての構成を備えるものに限定されるものではない。また、ある実施形態の構成の一部を他の実施形態の構成に置き換えることが可能であり、また、ある実施形態の構成に他の実施形態の構成を加えることも可能である。また、各実施形態の構成の一部について、他の構成の追加・削除・置換をすることが可能である。
110:サンプル
112:干渉光学系
124:信号処理部
1900:サンプル容器
2100:サンプル容器
2200:サンプル容器
2300:サンプル容器
2301:枠部材
2302:壁部
Claims (15)
- 粒子を含む液体のサンプルにおける前記粒子のサイズ分布を計測するサイズ分布計測装置であって、
光を出射する光源、
前記光の光軸方向に沿って前記光の焦点位置を走査する走査部、
前記サンプルから反射された前記光の強度を検出する検出部、
前記強度を用いて前記粒子のサイズを算出する演算部、
を備え、
前記走査部は、前記サンプルのなかで前記粒子が前記光軸方向に移動する過程において前記粒子の前記光軸方向におけるそれぞれ異なる位置から前記光が反射するように前記光の焦点位置を走査し、
前記演算部は、前記光軸方向に沿った前記光の焦点位置ごとの前記光の強度のうち最も大きい最大光強度を用いて、前記粒子のサイズを算出する
ことを特徴とするサイズ分布計測装置。 - 前記走査部は、前記光軸方向に沿った前記光の焦点位置ごとに、前記光軸方向に対して直交する平面内において前記光の焦点位置を走査し、
前記演算部は、前記平面上の所定範囲内の座標領域において、前記粒子が存在するか否かを前記光の強度にしたがって判定することにより、前記平面上における前記粒子の個数を特定する
ことを特徴とする請求項1記載のサイズ分布計測装置。 - 前記演算部は、前記座標領域上において、前記光軸方向に沿って前記光の強度を連続してサンプリングし、
前記演算部は、前記連続してサンプリングした強度が前記光軸方向に沿って第1回数以上連続して判定閾値以上である場合は前記座標領域上に前記粒子が存在すると判定し、
前記演算部は、前記粒子が存在すると判定した場合は、前記連続してサンプリングした強度が前記第1回数以上連続して前記判定閾値以上に到達してから第2回数以上連続して前記判定閾値未満になるまでの間において最も大きい前記光の強度を用いて、前記粒子のサイズを算出する
ことを特徴とする請求項2記載のサイズ分布計測装置。 - 前記演算部はさらに、前記最大光強度を用いて前記粒子のサイズを算出するか、それとも前記粒子を撮像することにより取得した画像を用いて前記粒子のサイズを算出するかを切り替える切替ステップを実施し、
前記演算部は、前記切替ステップにおいては、前記最大光強度を用いて算出した前記粒子のサイズを前記光のスポット径で除算した値が第1切替閾値以上である場合は前記画像を用いて改めて前記粒子のサイズを算出し、
前記演算部は、前記画像を用いて算出した前記粒子のサイズが第2切替閾値以下である場合は前記最大光強度を用いて改めて前記粒子のサイズを算出する
ことを特徴とする請求項1記載のサイズ分布計測装置。 - 前記走査部は、前記光軸方向における前記光の走査間隔をΔd、前記光軸方向における前記サイズ分布計測装置の分解能をΔz、前記粒子の拡散係数をD、前記光軸方向における前記光の焦点位置の毎秒走査個数をフレームレートとして定義したとき、(γ×D)/(Δz×Δd)(γは定数)以上の前記フレームレートで前記焦点位置を走査する
ことを特徴とする請求項1記載のサイズ分布計測装置。 - 前記演算部は、前記サンプルから反射された前記光の強度と前記粒子のサイズとの間の対応関係を記述した対応関係データを用いて、前記粒子のサイズを算出し、
前記対応関係データは、前記サンプルの種類ごとに前記対応関係を記述しており、
前記演算部は、前記サンプルの種類と前記サンプルから反射された前記光の強度を用いて前記対応関係データを参照することにより、前記粒子のサイズを算出する
ことを特徴とする請求項1記載のサイズ分布計測装置。 - 前記サイズ分布計測装置はさらに、前記光源が出射する光を分岐して測定光と参照光を生成する光分岐部を備え、
前記サイズ分布計測装置はさらに、前記測定光が前記サンプルから反射することにより生じた信号光を前記参照光と合波することにより互いに位相関係が異なる3つ以上の干渉光を生成する、干渉光学系を備え、
前記検出部は、前記干渉光を検出して電気信号として出力する
ことを特徴とする請求項1記載のサイズ分布計測装置。 - 前記演算部は、前記粒子のサイズの個数分布を記述したデータを出力する
ことを特徴とする請求項1記載のサイズ分布計測装置。 - 粒子を含む液体のサンプルにおける前記粒子のサイズ分布を計測するサイズ分布計測方法であって、
前記サンプルに対して光源から光を照射するステップ、
前記光の光軸方向に沿って前記光の焦点位置を走査する走査ステップ、
前記サンプルから反射された前記光の強度を検出するステップ、
前記強度を用いて前記粒子のサイズを算出する算出ステップ、
を有し、
前記走査ステップにおいては、前記光軸方向における前記光の走査間隔をΔd、前記光軸方向における前記サイズ分布計測方法の分解能をΔz、前記粒子の拡散係数をD、前記光軸方向における前記光の焦点位置の毎秒走査個数をフレームレートとして定義したとき、(γ×D)/(Δz×Δd)(γは定数)以上の前記フレームレートで前記焦点位置を走査する
ことを特徴とするサイズ分布計測方法。 - 光を照射することによりサイズを計測する粒子を含む液体のサンプルを収容するサンプル容器であって、
前記サンプルを収容する収容穴、
前記収容穴が収容している前記サンプルに含まれる気体を前記収容穴から逃がす気体放出部、
を備え、
前記収容穴の底面は光を透過する透過性基板によって封止されている
ことを特徴とするサンプル容器。 - 前記気体放出部は、前記収容穴の内壁から前記サンプル容器の基材に対して突出した空隙部によって構成されており、
前記収容穴の内壁は、湾曲形状を有しており、
前記空隙部は、前記収容穴の内壁に対して1つまたは2つ形成されている
ことを特徴とする請求項10記載のサンプル容器。 - 前記サンプル容器はさらに、前記粒子を封止材によって封止した第2収容穴を備える
ことを特徴とする請求項11記載のサンプル容器。 - 前記サンプル容器はさらに、前記収容穴と前記気体放出部を接続する気体放出流路を備え、
前記収容穴に対して前記サンプルを導入する部位は、先細り形状に形成されており、
前記収容穴の上面と前記気体放出部の放出面は、前記サンプル容器の同じ側の表面上に形成されており、
前記気体放出流路は、
前記収容穴の底部から、前記収容穴の深さ方向に対して直交する方向に沿って延伸する第1部分、
前記第1部分の終端から、前記収容穴の深さ方向に沿って前記気体放出部の放出面まで延伸する第2部分、
を備える
ことを特徴とする請求項10記載のサンプル容器。 - 前記収容穴は、前記サンプル容器に対して前記サンプルを導入する流路の一部として構成されており、
前記収容穴の上面は光を透過する透過性基板によって封止されており、
前記流路は、前記収容穴の深さ方向に対して直交する方向に延伸しており、
前記収容穴の深さ方向におけるサイズは、300μm以上1.5mm以下である
ことを特徴とする請求項11記載のサンプル容器。 - 前記サンプル容器はさらに、前記流路に対して前記サンプルを導入する導入口を覆うことにより封止する枠部材を備える
ことを特徴とする請求項14記載のサンプル容器。
Priority Applications (5)
| Application Number | Priority Date | Filing Date | Title |
|---|---|---|---|
| US17/419,396 US20220065766A1 (en) | 2019-01-09 | 2019-01-09 | Size distribution measurement device, size distribution measurement method, and sample container |
| PCT/JP2019/000281 WO2020144754A1 (ja) | 2019-01-09 | 2019-01-09 | サイズ分布計測装置、サイズ分布計測方法、サンプル容器 |
| JP2020565061A JP7246413B2 (ja) | 2019-01-09 | 2019-01-09 | サイズ分布計測装置、サイズ分布計測方法 |
| EP19908097.9A EP3910315B1 (en) | 2019-01-09 | 2019-01-09 | Size distribution measurement device and size distribution measurement method |
| CN201980087117.9A CN113227759B (zh) | 2019-01-09 | 2019-01-09 | 尺寸分布计测装置、尺寸分布计测方法、样品容器 |
Applications Claiming Priority (1)
| Application Number | Priority Date | Filing Date | Title |
|---|---|---|---|
| PCT/JP2019/000281 WO2020144754A1 (ja) | 2019-01-09 | 2019-01-09 | サイズ分布計測装置、サイズ分布計測方法、サンプル容器 |
Publications (1)
| Publication Number | Publication Date |
|---|---|
| WO2020144754A1 true WO2020144754A1 (ja) | 2020-07-16 |
Family
ID=71521564
Family Applications (1)
| Application Number | Title | Priority Date | Filing Date |
|---|---|---|---|
| PCT/JP2019/000281 Ceased WO2020144754A1 (ja) | 2019-01-09 | 2019-01-09 | サイズ分布計測装置、サイズ分布計測方法、サンプル容器 |
Country Status (5)
| Country | Link |
|---|---|
| US (1) | US20220065766A1 (ja) |
| EP (1) | EP3910315B1 (ja) |
| JP (1) | JP7246413B2 (ja) |
| CN (1) | CN113227759B (ja) |
| WO (1) | WO2020144754A1 (ja) |
Cited By (6)
| Publication number | Priority date | Publication date | Assignee | Title |
|---|---|---|---|---|
| WO2023139777A1 (ja) * | 2022-01-24 | 2023-07-27 | 株式会社日立ハイテク | 粒子計測装置、粒子計測方法、サンプル容器 |
| WO2024157566A1 (ja) * | 2023-01-27 | 2024-08-02 | 株式会社日立ハイテク | 粒子計測装置、粒子計測方法、反射率基準サンプル |
| WO2024157573A1 (ja) * | 2023-01-25 | 2024-08-02 | 株式会社日立ハイテク | 光計測装置、光計測方法 |
| WO2025088958A1 (ja) * | 2023-10-25 | 2025-05-01 | 株式会社日立ハイテク | 粒子計測装置、粒子計測方法 |
| WO2025105293A1 (ja) * | 2023-11-13 | 2025-05-22 | 株式会社東芝 | 微小粒子測定システム、および、微小粒子測定方法 |
| EP4657043A1 (en) | 2024-05-31 | 2025-12-03 | Hitachi High-Tech Analysis Corporation | Particle measurement apparatus |
Families Citing this family (1)
| Publication number | Priority date | Publication date | Assignee | Title |
|---|---|---|---|---|
| US20240410811A1 (en) * | 2022-01-21 | 2024-12-12 | Hitachi High-Tech Corporation | Particle Measuring Apparatus |
Citations (14)
| Publication number | Priority date | Publication date | Assignee | Title |
|---|---|---|---|---|
| US5141868A (en) * | 1984-06-13 | 1992-08-25 | Internationale Octrooi Maatschappij "Octropa" Bv | Device for use in chemical test procedures |
| JPH1194730A (ja) * | 1997-09-17 | 1999-04-09 | Zen Kubohara | 凹面付きマイクロプレート用透明蓋 |
| JP2004069431A (ja) * | 2002-08-05 | 2004-03-04 | Plant Technos:Kk | 液中粒子の画像解析装置 |
| JP2004257909A (ja) * | 2003-02-27 | 2004-09-16 | Horiba Ltd | 粒径分布測定装置 |
| JP2004283828A (ja) * | 2003-03-21 | 2004-10-14 | Steag Microparts Gmbh | 粒子を含む液体から液体成分を分離するための微細構造型分離装置およびマイクロ流体方法 |
| JP2005504317A (ja) * | 2001-09-28 | 2005-02-10 | イビディ ゲムベーハー | フロー・チャンバー |
| JP2009008602A (ja) * | 2007-06-29 | 2009-01-15 | Hokuto Denshi Kogyo Kk | 液体中の粒子のサイズの検出方法および装置 |
| WO2009014060A1 (ja) * | 2007-07-20 | 2009-01-29 | Arkray, Inc. | 検体供給具およびそれを用いた検体分析用具 |
| JP2012181124A (ja) * | 2011-03-02 | 2012-09-20 | New Industry Research Organization | 液体中の粒子のサイズの検出方法および装置 |
| JP2014153063A (ja) * | 2013-02-05 | 2014-08-25 | Pulstec Industrial Co Ltd | 動的光散乱測定装置及び動的光散乱測定装置の光路長調整方法 |
| JP2015083922A (ja) | 2012-02-07 | 2015-04-30 | オリンパス株式会社 | 光分析を用いた単一粒子検出装置、単一粒子検出方法及び単一粒子検出用コンピュータプログラム |
| WO2017060105A1 (en) * | 2015-10-08 | 2017-04-13 | Koninklijke Philips N.V. | Particle sensor for particle detection |
| JP2017102032A (ja) | 2015-12-02 | 2017-06-08 | 株式会社日立エルジーデータストレージ | 光計測方法および装置 |
| JP2018087770A (ja) * | 2016-11-29 | 2018-06-07 | 株式会社リコー | 液滴分注装置、液滴分注方法、及び被着対象物 |
Family Cites Families (9)
| Publication number | Priority date | Publication date | Assignee | Title |
|---|---|---|---|---|
| US7990524B2 (en) * | 2006-06-30 | 2011-08-02 | The University Of Chicago | Stochastic scanning apparatus using multiphoton multifocal source |
| EP2543990B1 (en) * | 2010-03-01 | 2019-06-26 | Olympus Corporation | Optical analysis device, optical analysis method, and computer program for optical analysis |
| US10598609B2 (en) * | 2011-03-14 | 2020-03-24 | Battelle Memorial Institute | Universal liquid sample device and process for high resolution transmission electron microscope imaging and multimodal analyses of liquid sample materials |
| JP5904996B2 (ja) * | 2011-03-29 | 2016-04-20 | オリンパス株式会社 | 単一発光粒子検出を用いた光分析装置、光分析方法並びに光分析用コンピュータプログラム |
| JP2012247385A (ja) * | 2011-05-31 | 2012-12-13 | Olympus Corp | 単一発光粒子検出を用いた光分析装置、光分析方法並びに光分析用コンピュータプログラム |
| EP2746748B1 (en) * | 2011-08-15 | 2017-12-06 | Olympus Corporation | Photometric analysis device using single light emitting particle detection, photometric analysis method and computer program for photometric analysis, |
| JP2014149195A (ja) * | 2013-01-31 | 2014-08-21 | Olympus Corp | 単一発光粒子検出を用いた光分析装置、光分析方法及び光分析用コンピュータプログラム |
| EP3029505A4 (en) * | 2013-07-31 | 2017-03-15 | Olympus Corporation | Optical microscope device, microscopy method, and computer program for microscopy using single-light-emitting-particle detection technology |
| JP6549747B2 (ja) * | 2017-04-14 | 2019-07-24 | リオン株式会社 | 粒子測定装置および粒子測定方法 |
-
2019
- 2019-01-09 EP EP19908097.9A patent/EP3910315B1/en active Active
- 2019-01-09 JP JP2020565061A patent/JP7246413B2/ja active Active
- 2019-01-09 WO PCT/JP2019/000281 patent/WO2020144754A1/ja not_active Ceased
- 2019-01-09 US US17/419,396 patent/US20220065766A1/en active Pending
- 2019-01-09 CN CN201980087117.9A patent/CN113227759B/zh active Active
Patent Citations (14)
| Publication number | Priority date | Publication date | Assignee | Title |
|---|---|---|---|---|
| US5141868A (en) * | 1984-06-13 | 1992-08-25 | Internationale Octrooi Maatschappij "Octropa" Bv | Device for use in chemical test procedures |
| JPH1194730A (ja) * | 1997-09-17 | 1999-04-09 | Zen Kubohara | 凹面付きマイクロプレート用透明蓋 |
| JP2005504317A (ja) * | 2001-09-28 | 2005-02-10 | イビディ ゲムベーハー | フロー・チャンバー |
| JP2004069431A (ja) * | 2002-08-05 | 2004-03-04 | Plant Technos:Kk | 液中粒子の画像解析装置 |
| JP2004257909A (ja) * | 2003-02-27 | 2004-09-16 | Horiba Ltd | 粒径分布測定装置 |
| JP2004283828A (ja) * | 2003-03-21 | 2004-10-14 | Steag Microparts Gmbh | 粒子を含む液体から液体成分を分離するための微細構造型分離装置およびマイクロ流体方法 |
| JP2009008602A (ja) * | 2007-06-29 | 2009-01-15 | Hokuto Denshi Kogyo Kk | 液体中の粒子のサイズの検出方法および装置 |
| WO2009014060A1 (ja) * | 2007-07-20 | 2009-01-29 | Arkray, Inc. | 検体供給具およびそれを用いた検体分析用具 |
| JP2012181124A (ja) * | 2011-03-02 | 2012-09-20 | New Industry Research Organization | 液体中の粒子のサイズの検出方法および装置 |
| JP2015083922A (ja) | 2012-02-07 | 2015-04-30 | オリンパス株式会社 | 光分析を用いた単一粒子検出装置、単一粒子検出方法及び単一粒子検出用コンピュータプログラム |
| JP2014153063A (ja) * | 2013-02-05 | 2014-08-25 | Pulstec Industrial Co Ltd | 動的光散乱測定装置及び動的光散乱測定装置の光路長調整方法 |
| WO2017060105A1 (en) * | 2015-10-08 | 2017-04-13 | Koninklijke Philips N.V. | Particle sensor for particle detection |
| JP2017102032A (ja) | 2015-12-02 | 2017-06-08 | 株式会社日立エルジーデータストレージ | 光計測方法および装置 |
| JP2018087770A (ja) * | 2016-11-29 | 2018-06-07 | 株式会社リコー | 液滴分注装置、液滴分注方法、及び被着対象物 |
Non-Patent Citations (1)
| Title |
|---|
| See also references of EP3910315A4 |
Cited By (12)
| Publication number | Priority date | Publication date | Assignee | Title |
|---|---|---|---|---|
| WO2023139777A1 (ja) * | 2022-01-24 | 2023-07-27 | 株式会社日立ハイテク | 粒子計測装置、粒子計測方法、サンプル容器 |
| JPWO2023139777A1 (ja) * | 2022-01-24 | 2023-07-27 | ||
| JP7610732B2 (ja) | 2022-01-24 | 2025-01-08 | 株式会社日立ハイテク | 粒子計測装置、粒子計測方法、サンプル容器 |
| US12510459B2 (en) | 2022-01-24 | 2025-12-30 | Hitachi High-Tech Corporation | Particle measurement device, particle measurement method, sample container |
| WO2024157573A1 (ja) * | 2023-01-25 | 2024-08-02 | 株式会社日立ハイテク | 光計測装置、光計測方法 |
| JP2024105017A (ja) * | 2023-01-25 | 2024-08-06 | 株式会社日立ハイテク | 光計測装置、光計測方法 |
| EP4657013A1 (en) | 2023-01-25 | 2025-12-03 | Hitachi High-Tech Corporation | Light measurement device and light measurement method |
| WO2024157566A1 (ja) * | 2023-01-27 | 2024-08-02 | 株式会社日立ハイテク | 粒子計測装置、粒子計測方法、反射率基準サンプル |
| JP2024106602A (ja) * | 2023-01-27 | 2024-08-08 | 株式会社日立ハイテク | 粒子計測装置、粒子計測方法、反射率基準サンプル |
| WO2025088958A1 (ja) * | 2023-10-25 | 2025-05-01 | 株式会社日立ハイテク | 粒子計測装置、粒子計測方法 |
| WO2025105293A1 (ja) * | 2023-11-13 | 2025-05-22 | 株式会社東芝 | 微小粒子測定システム、および、微小粒子測定方法 |
| EP4657043A1 (en) | 2024-05-31 | 2025-12-03 | Hitachi High-Tech Analysis Corporation | Particle measurement apparatus |
Also Published As
| Publication number | Publication date |
|---|---|
| EP3910315A1 (en) | 2021-11-17 |
| JPWO2020144754A1 (ja) | 2021-12-16 |
| EP3910315A4 (en) | 2022-12-07 |
| EP3910315B1 (en) | 2025-04-16 |
| CN113227759B (zh) | 2024-10-01 |
| JP7246413B2 (ja) | 2023-03-27 |
| US20220065766A1 (en) | 2022-03-03 |
| CN113227759A (zh) | 2021-08-06 |
Similar Documents
| Publication | Publication Date | Title |
|---|---|---|
| WO2020144754A1 (ja) | サイズ分布計測装置、サイズ分布計測方法、サンプル容器 | |
| US5080484A (en) | Method of measuring the contact angle of wetting liquid on a solid surface | |
| JP5841475B2 (ja) | 低コヒーレンス光源を用いた動的光散乱測定法及び動的光散乱測定装置 | |
| US20090103076A1 (en) | Transmitted light refractometer | |
| US20100231911A1 (en) | Circular Birefringence Refractometer: Method And Apparatus For Measuring Optical Activity | |
| CN105699315B (zh) | 太赫兹波测量装置、测量方法以及测量仪器 | |
| US20060012800A1 (en) | Refractive index determination by micro interferometric reflection detection | |
| WO2021112080A1 (ja) | 蛍光x線分析装置 | |
| EP1535048B1 (en) | Refractive index determination by micro interferometric reflection detection | |
| US5572321A (en) | Detector for measuring the luminous intensity scattered by thin films of colloidal media | |
| US20080144006A1 (en) | Method for Measuring Topographic Structures on Devices | |
| US8339599B2 (en) | Measuring arrangement for an optical spectrometer | |
| US5900933A (en) | Apparatus for measuring particle dimensions in fluids | |
| EP3673256B1 (en) | A fluorescence measurement apparatus, a system and a method for determining composition of a sample | |
| JP2018533014A (ja) | 試料媒質の波長依存性屈折率を決定するための光学顕微鏡及び方法 | |
| RU2460988C1 (ru) | Способ измерения распределения частиц по размерам в расширенном диапазоне концентраций и устройство для реализации способа (варианты) | |
| EP4471402A1 (en) | Particle measurement device, particle measurement method, sample container | |
| US20240410811A1 (en) | Particle Measuring Apparatus | |
| MXPA01013108A (es) | Aparato para medir el volumen de celulas de sangre roja individuales. | |
| CN108885168B (zh) | 一种检测系统及信号增强装置 | |
| JP2005227098A (ja) | 分析装置及びそのプログラム | |
| RU2416803C2 (ru) | Лазерный доплеровский анализатор | |
| JP5498308B2 (ja) | 光散乱強度測定方法 | |
| US10295463B2 (en) | Device and method for investigating one or a plurality of phase objects | |
| EP4657013A1 (en) | Light measurement device and light measurement method |
Legal Events
| Date | Code | Title | Description |
|---|---|---|---|
| 121 | Ep: the epo has been informed by wipo that ep was designated in this application |
Ref document number: 19908097 Country of ref document: EP Kind code of ref document: A1 |
|
| ENP | Entry into the national phase |
Ref document number: 2020565061 Country of ref document: JP Kind code of ref document: A |
|
| NENP | Non-entry into the national phase |
Ref country code: DE |
|
| ENP | Entry into the national phase |
Ref document number: 2019908097 Country of ref document: EP Effective date: 20210809 |
|
| WWG | Wipo information: grant in national office |
Ref document number: 2019908097 Country of ref document: EP |