WO2020171173A1 - 顕微鏡システム、焦点調整プログラム、および焦点調整システム - Google Patents
顕微鏡システム、焦点調整プログラム、および焦点調整システム Download PDFInfo
- Publication number
- WO2020171173A1 WO2020171173A1 PCT/JP2020/006837 JP2020006837W WO2020171173A1 WO 2020171173 A1 WO2020171173 A1 WO 2020171173A1 JP 2020006837 W JP2020006837 W JP 2020006837W WO 2020171173 A1 WO2020171173 A1 WO 2020171173A1
- Authority
- WO
- WIPO (PCT)
- Prior art keywords
- unit
- fluorescence
- measurement target
- region
- light
- Prior art date
- Legal status (The legal status is an assumption and is not a legal conclusion. Google has not performed a legal analysis and makes no representation as to the accuracy of the status listed.)
- Ceased
Links
Images


Classifications
-
- G—PHYSICS
- G02—OPTICS
- G02B—OPTICAL ELEMENTS, SYSTEMS OR APPARATUS
- G02B21/00—Microscopes
- G02B21/24—Base structure
- G02B21/241—Devices for focusing
- G02B21/244—Devices for focusing using image analysis techniques
-
- G—PHYSICS
- G01—MEASURING; TESTING
- G01N—INVESTIGATING OR ANALYSING MATERIALS BY DETERMINING THEIR CHEMICAL OR PHYSICAL PROPERTIES
- G01N21/00—Investigating or analysing materials by the use of optical means, i.e. using sub-millimetre waves, infrared, visible or ultraviolet light
- G01N21/62—Systems in which the material investigated is excited whereby it emits light or causes a change in wavelength of the incident light
- G01N21/63—Systems in which the material investigated is excited whereby it emits light or causes a change in wavelength of the incident light optically excited
- G01N21/64—Fluorescence; Phosphorescence
- G01N21/645—Specially adapted constructive features of fluorimeters
- G01N21/6456—Spatial resolved fluorescence measurements; Imaging
- G01N21/6458—Fluorescence microscopy
-
- G—PHYSICS
- G02—OPTICS
- G02B—OPTICAL ELEMENTS, SYSTEMS OR APPARATUS
- G02B21/00—Microscopes
- G02B21/06—Means for illuminating specimens
- G02B21/08—Condensers
-
- G—PHYSICS
- G02—OPTICS
- G02B—OPTICAL ELEMENTS, SYSTEMS OR APPARATUS
- G02B21/00—Microscopes
- G02B21/16—Microscopes adapted for ultraviolet illumination ; Fluorescence microscopes
-
- G—PHYSICS
- G02—OPTICS
- G02B—OPTICAL ELEMENTS, SYSTEMS OR APPARATUS
- G02B21/00—Microscopes
- G02B21/24—Base structure
- G02B21/241—Devices for focusing
- G02B21/245—Devices for focusing using auxiliary sources, detectors
-
- G—PHYSICS
- G02—OPTICS
- G02B—OPTICAL ELEMENTS, SYSTEMS OR APPARATUS
- G02B27/00—Optical systems or apparatus not provided for by any of the groups G02B1/00 - G02B26/00, G02B30/00
- G02B27/30—Collimators
-
- G—PHYSICS
- G02—OPTICS
- G02B—OPTICAL ELEMENTS, SYSTEMS OR APPARATUS
- G02B7/00—Mountings, adjusting means, or light-tight connections, for optical elements
- G02B7/28—Systems for automatic generation of focusing signals
- G02B7/36—Systems for automatic generation of focusing signals using image sharpness techniques, e.g. image processing techniques for generating autofocus signals
-
- G—PHYSICS
- G01—MEASURING; TESTING
- G01N—INVESTIGATING OR ANALYSING MATERIALS BY DETERMINING THEIR CHEMICAL OR PHYSICAL PROPERTIES
- G01N21/00—Investigating or analysing materials by the use of optical means, i.e. using sub-millimetre waves, infrared, visible or ultraviolet light
- G01N21/62—Systems in which the material investigated is excited whereby it emits light or causes a change in wavelength of the incident light
- G01N21/63—Systems in which the material investigated is excited whereby it emits light or causes a change in wavelength of the incident light optically excited
- G01N21/64—Fluorescence; Phosphorescence
- G01N21/645—Specially adapted constructive features of fluorimeters
- G01N2021/6463—Optics
Definitions
- the present disclosure relates to a microscope system, a focus adjustment program, and a focus adjustment system.
- a technique is disclosed in which light having an asymmetrical shape with respect to the optical axis is condensed on a sample and a variation in the distance between the condenser lens and the sample is detected as displacement of a light receiving position of reflected light (for example, Patent Document 1). .. Further, there is disclosed a technique in which the focus of the condenser lens is easily adjusted by using the displacement amount of the light receiving position to easily adjust the focus to the sample.
- the present disclosure proposes a microscope system, a focus adjustment program, and a focus adjustment system that can easily focus on a measurement target region arranged via a glass plate.
- a microscope system provides an irradiation unit that irradiates excitation light having an asymmetrical shape with respect to the optical axis, and a measurement target member including a glass member and a measurement target region.
- a derivation unit for deriving a movement amount and a movement direction of at least one of the objective lens and the measurement target member, based on the fluorescence signal, and a derivation unit that derives the movement amount and A movement control unit that moves at least one of the objective lens and the measurement target member in the movement direction.
- FIG. 3 is a schematic diagram illustrating an example of a detection unit according to the first embodiment of the present disclosure.
- FIG. 3 is a schematic diagram illustrating an example of a detection unit according to the first embodiment of the present disclosure. It is a figure showing an example of functional composition of focus adjusting device 12 concerning a 1st embodiment of this indication. It is a schematic diagram which shows an example of the fluorescence signal which concerns on 1st Embodiment of this indication.
- FIG. 3 is a schematic diagram showing an example of a profile of fluorescence intensity values according to the first embodiment of the present disclosure.
- FIG. 5 is an explanatory diagram of Example 1 according to the first embodiment of the present disclosure. It is a schematic diagram which shows an example of the fluorescence signal which concerns on 1st Embodiment of this indication.
- FIG. 3 is a schematic diagram showing an example of a captured image according to the first embodiment of the present disclosure.
- FIG. 5 is an explanatory diagram of deriving a movement amount and a movement direction according to the first embodiment of the present disclosure.
- 3 is a flowchart showing an example of the flow of information processing according to the first embodiment of the present disclosure.
- FIG. 8 is an explanatory diagram of Example 2 according to the first embodiment of the present disclosure. It is a schematic diagram which shows an example of the fluorescence signal which concerns on 1st Embodiment of this indication.
- FIG. 3 is a schematic diagram showing an example of a captured image according to the first embodiment of the present disclosure.
- FIG. 8 is a schematic diagram showing an example of a microscope system according to Modification 1 of the present disclosure.
- FIG. 13 is a schematic diagram showing an example of a microscope system according to Modification 2 of the present disclosure. It is a schematic diagram which shows an example of the microscope system which concerns on the modification 3 of this indication. It is a figure showing an example of functional composition of a focus adjusting device concerning a 2nd embodiment of this indication. It is a schematic diagram which shows an example of the fluorescence signal which concerns on 2nd Embodiment of this indication.
- FIG. 8 is a schematic diagram showing an example of a microscope system according to Modification 1 of the present disclosure.
- FIG. 13 is a schematic diagram showing an example of a microscope system according to Modification 2 of the present disclosure. It is a schematic diagram which shows an example of the microscope system which concerns on the modification 3 of this indication. It is a figure showing an example of functional composition
- FIG. 11 is an explanatory diagram showing an example of derivation of a movement direction and a movement amount according to the second embodiment of the present disclosure.
- FIG. 11 is an explanatory diagram showing an example of derivation of a movement direction and a movement amount according to the second embodiment of the present disclosure.
- 9 is a flowchart showing an example of the flow of information processing according to the second embodiment of the present disclosure. It is a schematic diagram which shows an example of the detection part which concerns on the 3rd Embodiment of this indication. It is a figure showing an example of functional composition of a focus adjusting device concerning a 3rd embodiment of this indication. It is an image figure of the measuring object field concerning a 3rd embodiment of this indication.
- FIG. 11 is an explanatory diagram of selection of a unit area according to the third embodiment of the present disclosure.
- 9 is a flowchart showing an example of the flow of information processing according to the third embodiment of the present disclosure.
- FIG. 16 is a hardware configuration diagram according to an embodiment and a modified example of the present disclosure.
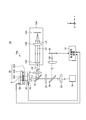
- FIG. 1 is a schematic diagram showing an example of a microscope system 1 of this embodiment.
- the microscope system 1 is a system that irradiates the sample S with the excitation light LB and receives the fluorescence emitted from the sample S.
- the microscope system 1 includes a measurement unit 10 and a focus adjustment device 12.
- the measurement unit 10 and the focus adjustment device 12 are connected so as to be able to exchange data or signals.
- the measurement unit 10 has an optical mechanism that measures the fluorescence emitted from the sample S.
- the measurement unit 10 is applied to, for example, an optical microscope.
- the measurement unit 10 includes an irradiation unit 14, an excitation filter 16, a dichroic mirror 18, an objective lens 20, a measurement target member 22, an emission filter 24, a half mirror 26, an imaging lens 28, and a detection unit 30.
- the irradiation unit 14 emits the excitation light LB.
- the excitation light LB is light having an asymmetric shape with respect to the optical axis.
- the optical axis indicates the optical axis (optical axis A1 and optical axis A2) from the irradiation unit 14 to the measurement target member 22.
- the asymmetrical shape with respect to the optical axis means that the shape of the light flux in the orthogonal cross section orthogonal to the optical axis is asymmetrical with respect to the optical axis.
- the wavelength range of the excitation light LB may be any wavelength range including the wavelength range in which the sample S emits fluorescence.
- the irradiation unit 14 includes a light emitting unit 14A, a collimating lens 14B, and a light shielding unit 14C.
- the light emitting unit 14A emits the irradiation light LA.
- the light emitting unit 14A emits the irradiation light LA including at least the wavelength region in which the sample S emits fluorescence.
- the light emitting unit 14A is any one of a light source that emits spot-shaped (point-shaped) light, a light source that emits linear light, and a light source that emits linear light through a slit or the like. Good.
- the spot shape and the line shape refer to the shape of the cross section of the irradiation light LA emitted from the light emitting unit 14A, which is orthogonal to the optical axis A1.
- the optical axis A1 represents the optical axis from the irradiation unit 14 to the dichroic mirror 18. In other words, the optical axis A1 indicates the optical axis of the collimator lens 14B.
- the light emitting unit 14A is a light source that emits the irradiation light LA having a linear shape. Further, in the present embodiment, a case will be described as an example in which the longitudinal direction of the linearly-shaped irradiation light LA coincides with the X-axis direction in FIG. 1. Details of the X-axis direction will be described later.
- the irradiation light LA emitted from the light emitting unit 14A reaches the light shielding unit 14C after being made into substantially parallel light by the collimator lens 14B.
- the light shielding unit 14C shields a part of the irradiation light LA and outputs it as the excitation light LB having an asymmetric shape with respect to the optical axis.
- the light blocking portion 14C may be a member that blocks a part of the irradiation light LA.
- the light shielding portion 14C is, for example, a plate-shaped member that does not transmit the irradiation light LA.
- the light shielding portion 14C shields one end in a direction (Z-axis direction in the drawing) intersecting the longitudinal direction (X-axis direction) of the linear irradiation light LA.
- the light-shielding range of the light-shielding portion 14C is not limited.
- the light shielding portion 14C may be arranged so as to shield the irradiation light LA from the one end to the center in the Z-axis direction in the cross section orthogonal to the optical axis A1.
- a part of the irradiation light LA is shielded by the light shielding portion 14C to become the excitation light LB that is asymmetric with respect to the optical axis A1.
- the excitation filter 16 selectively transmits light in the wavelength region where the sample S to be measured emits fluorescence.
- the excitation light LB is narrowed by passing through the excitation filter 16 and then reflected by the dichroic mirror 18 to reach the objective lens 20.
- the excitation filter 16 may be omitted.
- the dichroic mirror 18 reflects the excitation light LB and transmits light in the wavelength region other than the excitation light LB. In this embodiment, the dichroic mirror 18 transmits fluorescence.
- the objective lens 20 focuses the excitation light LB on the measurement target member 22.
- the objective lens 20 is a lens for focusing the excitation light LB on the measurement target member 22 and irradiating the measurement target region 22B with the excitation light LB via the glass member 22A of the measurement target member 22.
- the objective lens 20 is provided with a second drive unit 38.
- the second driving unit 38 moves the objective lens 20 in a direction toward or away from the measurement target member 22.
- the measurement target member 22 is provided with a first drive unit 36.
- the first drive unit 36 moves the measurement target member 22 in a direction toward or away from the objective lens 20.
- the focus of the objective lens 20 is adjusted by adjusting the distance between the objective lens 20 and the measurement target member 22 (details will be described later).
- the measurement unit 10 may be configured to include at least one of the first drive unit 36 and the second drive unit 38, and is not limited to the configuration including both of them.
- the distance between the objective lens 20 and the measurement target member 22 may be referred to as the distance, the distance in the Z-axis direction, or the distance between the objective lens 20 and the measurement target member 22.
- a direction along which the objective lens 20 and the measurement target member 22 approach and leave each other is referred to as a Z-axis direction for description.
- description will be made assuming that the Z-axis direction and the optical axis A2 of the objective lens 20 are parallel to each other.
- the two-dimensional plane that is the light-receiving surface of the excitation light LB in the measurement target member 22 is a plane represented by two axes that are orthogonal to the Z-axis direction (X-axis direction and Y-axis direction that is orthogonal to the X-axis direction). I shall.
- the longitudinal direction of the linear irradiation light LA coincides with the X-axis direction.
- the longitudinal direction of the irradiation light LA (that is, the longitudinal direction of the excitation light LB) may not match the X-axis direction.
- the measurement target member 22 includes a glass member 22A, a measurement target region 22B, and a glass member 22C.
- the glass member 22C is a member on which the sample S is placed.
- the glass member 22C is, for example, a slide glass.
- the glass member 22C is not limited to a member made of glass, as long as the sample S can be placed on the glass member 22C.
- the glass member 22A is a glass for holding the sample S with the glass member 22C.
- the glass member 22A may be referred to as a cover glass.
- the glass member 22A may be a member that transmits the excitation light LB and the fluorescence emitted from the sample S. "Transmitting" means that the transmittance of light to be transmitted is 80% or more.
- the measurement target area 22B is an area between the glass member 22A and the glass member 22C.
- the sample S is placed on the measurement target region 22B.
- the sample S is the measurement target.
- the sample S emits fluorescence upon irradiation with the excitation light LB.
- the sample S is, for example, microorganisms, cells, liposomes, red blood cells in blood, white blood cells, platelets, vascular endothelial cells, microcellular debris of epithelial tissue, and pathological tissue sections of various organs.
- the sample S may be an object such as a cell that is labeled with a fluorescent dye that emits fluorescence upon irradiation with the excitation light LB.
- the sample S in the state of being enclosed by the encapsulating material may be placed in the measurement target region 22B.
- a known material that transmits the excitation light LB incident on the measurement target region 22B and the fluorescence emitted from the sample S may be used as the encapsulating material.
- the encapsulating material may be either liquid or solid.
- the specimen S irradiated with the excitation light LB emits fluorescence.
- the encapsulant present in the measurement target region 22B may also emit fluorescence. Therefore, in the following description, it may be described that fluorescence is emitted from the measurement target region 22B.
- Fluorescence emitted from the measurement target region 22B by irradiation of the excitation light LB passes through the objective lens 20 and the dichroic mirror 18 and reaches the emission filter 24.
- the emission filter 24 selectively transmits the fluorescence emitted from the measurement target region 22B. Therefore, the excitation light LB does not pass through the emission filter 24, and only the fluorescence emitted from the measurement target region 22B selectively passes through the emission filter 24.
- Fluorescence that has passed through the emission filter 24 reaches the half mirror 26.
- the half mirror 26 distributes a part of the fluorescence to the detection unit 30 and the rest to the image detection unit 34. Note that the distribution ratio of fluorescence to the detection unit 30 and the image detection unit 34 by the half mirror 26 may be the same ratio (for example, 50% or 50%) or may be different ratios. Therefore, a dichroic mirror may be used instead of the half mirror 26.
- Fluorescence reflected by the half mirror 26 is focused on the detection unit 30 by the imaging lens 28.
- the fluorescence that has passed through the half mirror 26 is condensed on the image detection unit 34 by the imaging lens 32.
- the light emitting unit 14A of the irradiation unit 14 and the measurement target member 22 are in an optically conjugate relationship. Further, it is assumed that the light emitting unit 14A, the measurement target member 22, the detection unit 30, and the image detection unit 34 are in an optically conjugate relationship. That is, the measuring unit 10 is assumed to be a coaxial epi-illumination type microscope optical system.
- the image detection unit 34 receives fluorescence and outputs a fluorescence image showing the received fluorescence.
- the fluorescence image is used for analyzing the type of the sample S and the like.
- the image detection unit 34 is, for example, a known line sensor or area sensor.
- the image detection unit 34 outputs the fluorescence image to, for example, an analyzer that analyzes the fluorescence image.
- the detection unit 30 includes a plurality of light receiving units, receives the fluorescence emitted from the measurement target region 22B, and outputs the fluorescence signal.
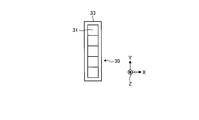
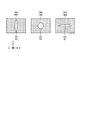
- FIG. 2A is a schematic diagram showing an example of the detection unit 30.
- the detection unit 30 includes a plurality of light receiving units 31.
- the light receiving unit 31 is an element that converts the received fluorescence into an electric charge.
- the light receiving unit 31 is, for example, a photodiode.
- FIG. 2A shows, as an example, a detection unit 30 in which a plurality of light receiving units 31 are two-dimensionally arranged along a light receiving surface 33 that receives fluorescence.
- the detection unit 30 is, for example, a CMOS (Complementary Metal-Oxide Semiconductor) image sensor or a CCD (Charge Coupled Device) image sensor.
- CMOS Complementary Metal-Oxide Semiconductor
- CCD Charge Coupled Device
- the detection unit 30 may have a form in which a plurality of light receiving units 31 are arranged one-dimensionally.
- FIG. 2B is a schematic diagram showing an example of the detection unit 30.
- the detection unit 30 may have a form in which a plurality of light receiving units 31 are one-dimensionally arranged along the light receiving surface 33.
- the detection unit 30 may include at least two light receiving units 31.
- the detection unit 30 has a configuration in which a plurality of light receiving units 31 are two-dimensionally arranged along the light receiving surface 33 will be described as an example.
- the detection unit 30 may have a configuration in which a plurality of block regions 31A including a plurality of types of light receiving units 31 having at least one of gain and charge accumulation time are arranged along the light receiving surface 33 (see FIG. 2A). ..
- the gain indicates at least one of an analog-digital conversion gain and an amplification gain.
- the charge storage time refers to the charge storage time per output of the fluorescence signal when the detection unit 30 is the charge storage type detection unit 30 such as CMOS or CCD.
- one block area 31A may be treated as one pixel.
- the detection unit 30 receives fluorescence and outputs a fluorescence signal.
- the fluorescence signal output from the detection unit 30 is a signal indicating the intensity value of the fluorescence received by each of the plurality of light receiving units 31.
- the fluorescence signal is a signal that defines the fluorescence intensity value for each of the plurality of light receiving units 31.
- the fluorescence intensity value may be referred to as a fluorescence intensity value for description.
- the fluorescence intensity value is a value indicating the intensity of received fluorescence.
- the detection unit 30 outputs the fluorescence signal to the focus adjustment device 12.
- the fluorescence signal is a fluorescence image in which the fluorescence intensity value is defined for each pixel corresponding to each of the plurality of light receiving units 31.
- the fluorescence intensity value corresponds to the pixel value.
- the measurement unit 10 irradiates the measurement target member 22 with the excitation light LB by scanning along the direction (Y-axis direction) orthogonal to the longitudinal direction (X-axis direction) of the irradiation light LA.
- the scanning method of the excitation light LB is not limited.
- the scanning method is, for example, a method of moving the measurement target member 22 in the Y-axis direction by the first driving unit 36, or a portion of the measurement unit 10 other than the measurement target member 22 is moved in the Y-axis direction with respect to the measurement target member 22.
- a deflection mirror may be arranged between the dichroic mirror 18 and the objective lens 20, and the excitation light LB may be scanned by the polarization mirror.
- the focus adjustment device 12 is an example of an information processing device.
- the focus adjustment device 12 adjusts the focus of the objective lens 20 based on the fluorescence signal received from the detection unit 30.
- the focus adjustment device 12 and each of the detection unit 30, the first drive unit 36, and the second drive unit 38 are connected so as to be able to exchange data or signals.
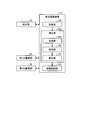
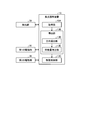
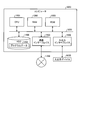
- FIG. 3 is a diagram showing an example of a functional configuration of the focus adjustment device 12. Note that FIG. 3 also illustrates the detection unit 30, the first drive unit 36, and the second drive unit 38 for the sake of explanation.
- the focus adjustment device 12 includes an acquisition unit 12A, a derivation unit 12B, and a movement control unit 12C.
- the derivation unit 12B includes a generation unit 12D, an identification unit 12E, and a calculation unit 12F.
- Part or all of the acquisition unit 12A, the derivation unit 12B, the movement control unit 12C, the generation unit 12D, the identification unit 12E, and the calculation unit 12F causes a processing device such as a CPU (Central Processing Unit) to execute the program. That is, it may be realized by software, hardware such as IC (Integrated Circuit), or both software and hardware.
- a processing device such as a CPU (Central Processing Unit) to execute the program. That is, it may be realized by software, hardware such as IC (Integrated Circuit), or both software and hardware.
- the acquisition unit 12A acquires a fluorescence signal from the detection unit 30.
- the deriving unit 12B derives the movement amount and the movement direction of at least one of the objective lens 20 and the measurement target member 22 based on the fluorescence signal acquired from the detection unit 30. Specifically, the deriving unit 12B derives the movement amount and the movement direction for adjusting the focus of the objective lens 20 to the measurement target region 22B based on the fluorescence signal.
- the derivation unit 12B has a generation unit 12D, a specification unit 12E, and a calculation unit 12F.
- the generation unit 12D generates a profile of the fluorescence intensity value included in the fluorescence signal. Specifically, the generation unit 12D generates a profile of the fluorescence intensity value with respect to the direction in which the blur of the fluorescence receiving region included in the fluorescence signal is generated.
- the profile of the fluorescence intensity value is represented by a diagram showing the relationship between the direction of blurring and the fluorescence intensity value, where the horizontal axis represents the blurring direction and the vertical axis represents the fluorescence intensity value.
- the fluorescent light receiving region is a light receiving region of the fluorescence emitted from the measurement target region 22B included in the fluorescent signal, and has a larger fluorescence intensity value than other regions.
- the generation unit 12D may specify in advance the blurring direction of the fluorescence receiving region included in the fluorescence signal and use it for generating the profile.
- FIG. 4 is a schematic diagram showing an example of the fluorescence signal 40.
- the fluorescence signal 40 includes the fluorescence receiving region E.
- the distance between the measurement target member 22 and the objective lens 20 is changed stepwise from a short distance to a long distance, and the fluorescence signal 40 obtained by the detection unit 30 at each step is shown.
- the plurality of fluorescence signals 40 (fluorescence signal 40A to fluorescence signal 40E) shown in FIG. 4 are obtained when the distance between the measurement target member 22 and the objective lens 20 is gradually increased from the fluorescence signal 40A toward the fluorescence signal 40E.
- the fluorescence signal 40C is an example of the fluorescence signal 40 when the objective lens 20 is focused on the measurement target region 22B.
- the vertical axis direction (Y′ axis direction) of the fluorescence signal 40 shown in FIG. 4 corresponds to the Y axis direction on the measurement target member 22.
- the horizontal axis direction (X′ axis direction) of the fluorescence signal 40 shown in FIG. 4 corresponds to the X axis direction in the measurement target member 22.
- the Z′-axis direction of the fluorescence signal 40 shown in FIG. 4 corresponds to the Z-axis direction that is the direction in which the measurement target member 22 and the objective lens 20 approach or leave.
- the direction of blurring of the fluorescence receiving region E included in the fluorescence signal 40 is one side on the light receiving surface 33 of the detection unit 30. Shift to (arrow YA' side).
- the blurring direction of the fluorescence receiving area E is displaced from the center line 41 toward the arrow YA'. This is because the measurement target member 22 is located closer to the objective lens 20 than the focus of the objective lens 20 as the measurement target member 22 and the objective lens 20 are closer to each other.
- the center line 41 is a line passing through the fluorescence receiving area E, which is included in the fluorescence signal 40C obtained when the objective lens 20 is focused on the measurement target area 22B.
- the generation unit 12D changes the distance between the measurement target member 22 and the objective lens 20 in a stepwise manner, and from the fluorescence signal 40 obtained at each step, blurring of the fluorescence receiving area E included in the fluorescence signal 40 occurs.
- the direction of occurrence is specified in advance.
- the generation unit 12D identifies the Y′-axis direction in the fluorescence signal 40 as the blurring direction of the fluorescence receiving area E.
- the generation unit 12D generates a profile of the fluorescence intensity value with respect to the blurring direction (Y'-axis direction) of the fluorescence receiving area E included in the fluorescence signal 40.
- the profile of the fluorescence intensity value is represented by f(y').
- y′ indicates the position in the Y′-axis direction, which is the direction of occurrence of blurring, of the fluorescence receiving region E included in the fluorescence signal 40.
- the position in the Y'axis direction is represented by, for example, position coordinates indicating the pixel position in the Y'axis direction.
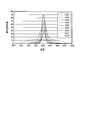
- FIG. 5 is a schematic diagram showing an example of a profile of fluorescence intensity values.
- the horizontal axis represents the position in the blurring direction (Y′ axis direction) of the fluorescence signal 40.
- the vertical axis represents the fluorescence intensity value.
- the value shown in each diagram indicates that the larger the value is, the closer the distance between the objective lens 20 and the measurement target member 22 is.
- the generation unit 12D generates a profile of the fluorescence intensity value of the fluorescence signal 40 each time one fluorescence signal 40 is acquired. Therefore, when the generation unit 12D acquires one fluorescence signal 40, for example, the generation unit 12D generates a profile represented by any one of the plurality of diagrams shown in FIG.
- the generation unit 12D may generate a profile of the fluorescence intensity value by using the fluorescence intensity value of the fluorescence receiving area E included in the fluorescence signal 40. That is, the generation unit 12D may generate the profile of the fluorescence intensity value for the fluorescence receiving region E that is a part of the fluorescence signal 40 instead of the entire fluorescence signal 40. In this case, for example, the generation unit 12D may specify a region in the fluorescence signal 40 that exhibits a fluorescence intensity value equal to or higher than a threshold value for determining that the fluorescence has been received, as the fluorescence reception region E, and generate a profile.
- the identification unit 12E identifies the barycentric position of the fluorescence intensity value in the fluorescence signal 40 based on the profile generated by the generation unit 12D.
- the specifying unit 12E calculates the position of the center of gravity using the following formula (1).
- g indicates the position of the center of gravity.
- f(y') indicates the profile of the fluorescence intensity value, as described above.
- y′ indicates the position in the Y′ axis direction, which is the blurring direction of the fluorescence receiving region E included in the fluorescence signal 40.
- the identifying unit 12E uses the profile obtained by performing at least one of binning processing and threshold processing on the fluorescence intensity value profile f(y′) instead of the fluorescence intensity value profile f(y′). May be calculated.
- the identifying unit 12E may calculate the barycentric position by using the profile f(y′) after the binning process on the profile f(y′) of the fluorescence intensity value.
- the identifying unit 12E uses a profile F(y′) obtained by extracting a portion having a threshold value that is a predetermined fluorescence intensity value or more with respect to the profile f(y′) after the binning process. , The center of gravity position may be calculated.
- the calculation unit 12F identifies the target center-of-gravity position and calculates the movement amount and the movement direction based on the difference between the center-of-gravity position and the target center-of-gravity position. In the present embodiment, the calculation unit 12F determines the movement amount and the movement direction of at least one of the objective lens 20 and the measurement target member 22 based on the difference between the barycentric position specified by the specifying unit 12E and the target barycentric position. Derive.
- the target barycentric position is the barycentric position of the fluorescence intensity value when the objective lens 20 is focused on the measurement target region 22B.
- the target center-of-gravity position corresponds to a position where the difference between adjacent pixel values (luminance values) in the captured image of the measurement target member 22 irradiated with the excitation light LB is the largest. This position may be a position in the Y'-axis direction, which is the direction in which the blur occurs.
- the calculation unit 12F may specify the target center-of-gravity position in advance and use it to calculate the movement amount movement direction.
- the calculation unit 12F identifies the target barycentric position using a known contrast method.
- the calculation unit 12F may specify the target barycentric position by receiving or reading the target barycentric position specified by an external device or the like using the contrast method.
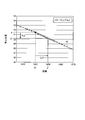
- FIG. 6 is an explanatory diagram of Example 1 according to the present embodiment. The identification of the target center-of-gravity position will be described taking the first embodiment as an example.
- the horizontal axis indicates the distance (distance in the Z-axis direction) between the measurement target member 22 and the objective lens 20.
- the horizontal axis indicating the distance indicates that the larger the value, the shorter the distance (the shorter the distance between the measurement target member 22 and the objective lens 20).
- the vertical axis indicates the contrast or the position of the center of gravity.
- the contrast shown in FIG. 6 indicates an average value of differences between pixel values (brightness values) of adjacent pixels in a captured image.
- the distance between the measurement target member 22 and the objective lens 20 is changed within a range of ⁇ 20 ⁇ m with reference to the time when the focus of the objective lens 20 is in the measurement target region 22B. Further, in the measurement target region 22B, a measurement target stained with DAPI (4',6-diamidino-2-phenylindole), which is a fluorescent dye, is arranged as the sample S.
- DAPI 4,6-diamidino-2-phenylindole
- the line diagram 44A is specified by using the fluorescence signal 40 obtained by irradiating the excitation light LB having an asymmetrical shape with respect to the optical axis at each stage where the distance is changed stepwise.
- the center-of-gravity position specified by the section 12E is shown.
- FIG. 7A shows an example of the fluorescence signal 40F when the distance is at a certain stage.
- the identifying unit 12E identifies the barycentric position using the profile f(y′) in the region B1 including the fluorescence receiving region E in the fluorescence signal 40F.
- the line diagram 44A is a line diagram showing the result of performing the center-of-gravity position identification process using the region B1 using each of the fluorescence signals 40 corresponding to each of the distances at a plurality of stages.
- a diagram 46A is a diagram showing the result by the contrast method.
- the line diagram 46A shows the result of calculating the contrast by the known method for each of the above distances, using the captured image when the measurement target region 22B is irradiated with the light having the target shape with respect to the optical axis. ..
- FIG. 7B shows an example of the captured image 48 when the distance is at a certain stage.
- 46A shows the result of calculating the average value of the differences between the pixel values (luminance values) of the adjacent pixels in the specific area B2 in the captured image 48 as the contrast.
- the relationship between the distance between the objective lens 20 and the measurement target member 22 and the position of the center of gravity is represented by a linear function.
- the relationship between the distance between the objective lens 20 and the measurement target member 22 and the contrast shows a peak at a specific distance.
- the calculation unit 12F identifies the distance indicating the peak obtained by the contrast method shown in the diagram 46A. Then, the calculation unit 12F may specify the barycentric position corresponding to the specified distance in the diagram 44A as the target barycentric position g'.
- the calculation unit 12F derives the movement amount and the movement direction of at least one of the objective lens 20 and the measurement target member 22 based on the difference between the barycentric position specified by the specifying unit 12E and the target barycentric position g′. To do.
- FIG. 8 is an explanatory diagram of derivation of the movement amount and the movement direction.
- the vertical axis represents the position of the center of gravity.
- the horizontal axis represents the distance between the measurement target member 22 and the objective lens 20. Similar to FIG. 6, the horizontal axis in FIG. 8 indicates that the larger the value, the shorter the distance (the shorter the distance between the measurement target member 22 and the objective lens 20).
- the calculation unit 12F calculates the difference ⁇ g between the center of gravity position g specified by the specifying unit 12E and the target center of gravity position g′. Then, the movement amount and the movement direction of at least one of the objective lens 20 and the measurement target member 22 are calculated so as to bring the barycentric position g close to or match the target barycentric position g′ so that the difference ⁇ g becomes “0”. To do.
- the calculation unit 12F calculates the movement amount and movement direction of the objective lens 20.
- the diagram 42 in FIG. 8 corresponds to the diagram 44A shown in FIG.
- the calculation unit 12F calculates the distance Z1 and the distance Z′ so that the distance Z1 corresponding to the identified center-of-gravity position g in the diagram 42 matches the distance Z′ corresponding to the target center-of-gravity position g′.
- the difference is calculated as the amount of movement of the objective lens 20.
- the horizontal axis of FIG. 8 indicates that the larger the value, the shorter the distance (the shorter the distance between the measurement target member 22 and the objective lens 20). Therefore, when the value of the distance Z1 is smaller than the value of the distance Z′ (Z1 ⁇ Z′), the calculation unit 12F sets the direction in which the measurement target member 22 and the objective lens 20 are closer to each other (direction in which the distance is shortened), Calculate as the moving direction. Further, when the value of the distance Z1 is larger than the value of the distance Z′ (Z1>Z′), the calculation unit 12F moves in the direction in which the measurement target member 22 and the objective lens 20 are further apart (the direction in which the distance is increased). Calculate as the direction.
- the calculation unit 12F prepares a function T for deriving a vector indicating a movement amount and a movement direction from the difference ⁇ g between the specified center-of-gravity position g and the target center-of-gravity position g′, and uses the function T using the function T.
- the movement amount and the movement direction may be derived.
- the function T for example, the one obtained by approximating the diagram 42 shown in FIG. 8 by a linear function may be used.
- the function T may be a function obtained by approximating the diagram 42 with a higher-order function other than the linear function.
- a function table such as a lookup table may be used as the function T.
- the movement control unit 12C moves at least one of the objective lens 20 and the measurement target member 22 in the movement amount and the movement direction derived by the derivation unit 12B. Specifically, the movement control unit 12C at least the first drive unit 36 and the second drive unit 38 so as to move the movement amount derived by the derivation unit 12B in the movement direction derived by the derivation unit 12B. One of them is drive-controlled.
- the movement control unit 12C can adjust the position of at least one of the objective lens 20 and the measurement target member 22 so that the focus of the objective lens 20 is within the measurement target region 22B of the measurement target member 22.
- the functional configuration shown in FIG. 3 is an example, and the movement control unit 12C may have a derivation unit 12B.
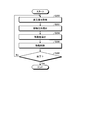
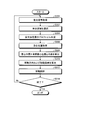
- FIG. 9 is a flowchart showing an example of the flow of information processing.
- the acquisition unit 12A acquires the fluorescence signal 40 from the detection unit 30 (step S100).
- the generation unit 12D generates a profile of the fluorescence intensity value included in the fluorescence signal 40 acquired in step S100 (step S102). In step S102, the generation unit 12D generates a fluorescence intensity value profile in the blurring direction (Y'-axis direction) of the fluorescence receiving region E included in the fluorescence signal 40.
- the identifying unit 12E identifies the barycentric position g of the fluorescence intensity value in the fluorescence signal 40 based on the profile generated in step S102 (step S104).
- the calculation unit 12F calculates the difference ⁇ g between the barycentric position g specified in step S104 and the target barycentric position g'(step S106).
- the calculation unit 12F calculates the movement amount and the movement direction of at least one of the objective lens 20 and the measurement target member 22 using the difference ⁇ g calculated in step S106 (step S108).
- the movement control unit 12C moves at least one of the objective lens 20 and the measurement target member 22 in the movement amount and the movement direction derived by the derivation unit 12B (step S110).
- the movement control unit 12C drives and controls at least one of the first drive unit 36 and the second drive unit 38 to move at least one of the objective lens 20 and the measurement target member 22. Therefore, the positions of the objective lens 20 and the measurement target member 22 are adjusted so that the focus of the objective lens 20 is aligned with the measurement target region 22B of the measurement target member 22.
- the focus adjustment device 12 determines whether or not to end the information processing (step S112). For example, the focus adjustment device 12 determines in step S112 by determining whether or not an instruction signal indicating the end of processing has been received. When it is determined that the processing is to be continued (step S112: No), the process returns to step S100. On the other hand, when it is determined that the processing is completed (step S112: Yes), this routine is ended.
- the microscope system 1 of this embodiment includes the irradiation unit 14, the objective lens 20, the detection unit 30, the derivation unit 12B, and the movement control unit 12C.
- the irradiation unit 14 irradiates the excitation light LB having a shape asymmetric with respect to the optical axis.
- the objective lens 20 focuses the excitation light LB on the measurement target member 22 including the glass member 22A and the measurement target region 22B.
- the detection unit 30 includes at least one or more light receiving unit 31 that receives the fluorescence emitted from the measurement target region 22B by the excitation light LB, and indicates the intensity value (fluorescence intensity value) of the fluorescence received by each light receiving unit 31.
- the fluorescence signal 40 shown is output.
- the movement control unit 12C includes a derivation unit 12B that derives a movement amount and a movement direction of at least one of the objective lens 20 and the measurement target member 22 based on the fluorescence signal 40, and the objective is set in the derived movement amount and movement direction. At least one of the lens 20 and the measurement target member 22 is moved.
- the asymmetrical excitation light LB is condensed on the measurement target member 22 and the fluorescence signal 40 indicating the fluorescence intensity value of the fluorescence emitted from the measurement target region 22B is output. To do. Then, in the microscope system 1, using the fluorescence signal 40, the movement amount and the movement direction of at least one of the objective lens 20 and the measurement target member 22 are derived, and the movement is controlled.
- the sample S is irradiated with light having an asymmetrical shape with respect to the optical axis, and focus control is performed based on the light receiving position of the reflected light from the sample S.
- a sample sandwiched between glass plates may be used for measuring the sample S such as cells.
- the light applied to the sample S is reflected by the surface of the glass member 22A and the sample S arranged via the glass member 22A. Therefore, the reflected light from the interface between the air and the glass member 22A becomes dominant as compared with the reflected light from the sample S.
- focus control is performed using reflected light, the surface of the glass member 22A is focused, and it is difficult to easily focus on the measurement target region 22B arranged via the glass member 22A. there were.
- the fluorescence emitted from the measurement target region 22B is selectively received. Then, in the microscope system 1, focus control is performed by controlling the movement of at least one of the objective lens 20 and the measurement target member 22 using the fluorescence signal 40 indicating the fluorescence intensity value of the received fluorescence.
- the wavelength range of the fluorescence emitted from the measurement target area 22B does not include the wavelength range of the reflected light of the excitation light LB reflected on the surface of the glass member 22A. Therefore, in the microscope system 1, the focus control can be performed by selectively using the fluorescence emitted from the measurement target region 22B. Therefore, in the microscope system 1 of the present embodiment, it is possible to easily focus on the measurement target area 22B arranged via the glass member 22A, not on the surface of the glass member 22A.
- the microscope system 1 of the present embodiment it is possible to easily focus on the measurement target area 22B arranged via the glass (glass member 22A).
- the microscope system 1 of the present embodiment when the sample S does not exist in the measurement target region 22B, or when there is a low density (sparser density) region of the sample S in the measurement target region 22B. Even if there is, it is possible to easily focus on the measurement target region 22B.
- FIG. 10 is an explanatory diagram of Example 2 in this embodiment.
- the horizontal axis indicates the distance (distance in the Z-axis direction) between the measurement target member 22 and the objective lens 20.
- the vertical axis indicates the contrast or the position of the center of gravity.
- the distance between the measurement target member 22 and the objective lens 20 is changed within a range of ⁇ 20 ⁇ m with reference to when the focus of the objective lens 20 is in the measurement target region 22B.
- the sample S was not included in the measurement target region 22B, and only the encapsulating material was present.
- a line 44B is specified by using the fluorescence signal 40 obtained by irradiating the excitation light LB having an asymmetrical shape with respect to the optical axis at each stage where the distance is changed stepwise.
- the center-of-gravity position specified by the section 12E is shown.
- FIG. 11A shows an example of the fluorescence signal 40G when the distance is at a certain stage.
- the identifying unit 12E identifies the barycentric position using the profile f(y′) in the region B3 including the fluorescence receiving region E in the fluorescence signal 40G.
- the line diagram 44B is a line diagram showing the result of performing the center-of-gravity position specifying process using the region B3 using each of the fluorescence signals 40 corresponding to each of the distances at a plurality of stages.
- a diagram 46B is a diagram showing the result by the contrast method.
- the line diagram 46B shows the result of calculating the contrast by the known method for each of the above distances, using the captured image when the measurement target region 22B is irradiated with the light of the target shape with respect to the optical axis. ..
- FIG. 11B shows an example of the captured image 49 when the distance is at a certain stage.
- the line diagram 46B shows the result of calculating the average value of the differences between the pixel values (luminance values) of the adjacent pixels in the specific region B4 in the captured image 49 as the contrast.
- the specific area B4 is an area in which a contrasted area is selectively specified in the captured image 49.
- the microscope system 1 of the present embodiment it can be said that the measurement target region 22B can be easily focused even when the sample S does not exist in the measurement target region 22B. Even when the measurement target region 22B includes a region where the sample S is sparse, the microscope system 1 can easily focus on the measurement target region 22B.
- the diagram 46B of FIG. 10 which is the conventional contrast method is a diagram obtained by using the region B4 where the contrast is generated in the captured image 49 (see FIG. 11B). Therefore, with the conventional method shown in the diagram 46B, it can be said that it is difficult to adjust the focus when the sample S is a sparse region or when the sample S is not included in the measurement target region 22B.
- the microscope system 1 of the present embodiment can easily measure the measurement target even when the sample S does not exist in the measurement target region 22B or when the measurement target region 22B includes a sparse region of the sample S.
- the area 22B can be focused.
- the derivation unit 12B has a generation unit 12D, a specification unit 12E, and a calculation unit 12F.
- the generation unit 12D generates a profile of the fluorescence intensity value included in the fluorescence signal 40.
- the identifying unit 12E identifies the barycentric position g of the fluorescence intensity value in the fluorescence signal 40 based on the profile.
- the calculation unit 12F identifies the target center-of-gravity position, and calculates the movement amount and the movement direction based on the difference ⁇ g between the center-of-gravity position and the target center-of-gravity position g'.
- the fluorescence intensity value of the fluorescence signal 40 has a correlation with the intensity of the excitation light LB. Therefore, the obtained fluorescence signal 40 has an optical characteristic that reflects the asymmetry of the excitation light LB. Therefore, the derivation unit 12B calculates the movement amount and the movement direction based on the barycentric position g specified based on the profile of the fluorescence intensity value included in the fluorescence signal 40, thereby accurately focusing on the measurement target region 22B. Can be matched.
- the generation unit 12D also generates a profile using the fluorescence intensity value of the fluorescence receiving region E included in the fluorescence signal 40.
- the microscope system 1 can shorten the processing time and simplify the processing in addition to the above effects. Can be planned.
- the irradiation unit 14 also includes a light shielding unit 14C that shields a part of the irradiation light LA emitted from the light emitting unit 14A and outputs the light as the excitation light LB.
- a light shielding unit 14C that shields a part of the irradiation light LA emitted from the light emitting unit 14A and outputs the light as the excitation light LB.
- the detection unit 30 is configured by arranging a plurality of block regions 31A including a plurality of types of light receiving units 31 having different gains and/or charge accumulation times along the light receiving surface 33.
- a plurality of types of light receiving units 31 having at least one of gain and charge accumulation time may be arranged in a mosaic pattern.
- the highly accurate fluorescence signal 40 for deriving the movement amount and the movement direction of at least one of the objective lens 20 and the measurement target member 22. can be obtained.
- the focus adjustment device 12 of the present embodiment also includes an acquisition unit 12A that acquires the fluorescence signal 40 from the detection unit 30 of the measurement unit 10, a derivation unit 12B, and a movement control unit 12C.
- the deriving unit 12B derives the movement amount and the movement direction of at least one of the objective lens 20 and the measurement target member 22 for adjusting the focus of the objective lens 20 to the measurement target region 22B based on the fluorescence signal 40.
- the movement control unit 12C moves at least one of the objective lens 20 and the measurement target member 22 in the derived movement amount and movement direction.
- the movement amount and the movement direction of at least one of the objective lens 20 and the measurement target member 22 are derived using the fluorescence signal 40 to control the movement. Therefore, in the focus adjustment device 12 of the present embodiment, it is possible to easily focus on the measurement target region 22B arranged via the glass (glass member 22A).
- FIG. 12 is a schematic diagram showing an example of a microscope system 1A of this modification.
- the microscope system 1A includes a measurement unit 10A and a focus adjustment device 12.
- the focus adjustment device 12 is the same as that in the above embodiment.
- the measurement unit 10A includes a detection unit 35 instead of the detection unit 30 and the image detection unit 34 of the above embodiment. That is, the measurement unit 10A is the same as the measurement unit 10 of the above embodiment except that the detection unit 35 includes the detection unit 35 instead of the detection unit 30 and the image detection unit 34 and does not include the half mirror 26 and the imaging lens 28. (See Figure 1).
- the detection unit 35 is used as both the detection unit 30 and the image detection unit 34. Therefore, in this case, the detection unit 35 and the focus adjustment device 12 may be connected so that data or a signal can be exchanged. In this case, the half mirror 26 and the imaging lens 28 may not be provided.
- the excitation light LB having an asymmetrical shape with respect to the optical axis is emitted by partially shielding the irradiation light LA by the light shielding unit 14C.
- the method for realizing the excitation light LB is not limited to the above embodiment.
- the excitation light LB may be realized by separating the irradiation light LA.
- FIG. 13 is a schematic diagram showing an example of a microscope system 1B of this modification.
- the microscope system 1B includes a measurement unit 10B and a focus adjustment device 12.
- the focus adjustment device 12 is the same as that in the above embodiment.
- the measurement unit 10B is the same as the measurement unit 10 except that it includes an irradiation unit 15A instead of the irradiation unit 14 (see FIG. 1).
- the irradiation unit 15A includes a light emitting unit 14A, a collimator lens 14B, and a separation unit 14D.
- the light emitting unit 14A and the collimator lens 14B are the same as those in the above embodiment.
- the light emitting unit 14A emits the irradiation light LA having a linear shape that is long in the X-axis direction.
- the separating unit 14D separates the irradiation light LA emitted from the light emitting unit 14A into an asymmetric shape with respect to the optical axis. Specifically, the separation unit 14D outputs one light beam obtained by separating the irradiation light LA into two light beams with the peak of the Gaussian distribution of the irradiation light LA as a boundary, as the excitation light LB.
- the separation unit 14D is, for example, a triangular prism.
- the separation unit 14D may be arranged in advance at a position where the irradiation light LA is separated into two with the peak of the Gaussian distribution of the irradiation light LA as a boundary.
- the measurement unit 10B irradiates the measurement target region 22B with the excitation light LB that is one of the light beams separated by the separation unit 14D in the irradiation light LA, and detects the fluorescence generated in the measurement target region 22B by the irradiation.
- Light may be received by the unit 30.
- the other light flux of the irradiation light LA may be irradiated to the measurement target area 22B, and the fluorescence generated in the measurement target area 22B by the irradiation may be received by the image detection unit 34.
- the irradiation unit 15A includes the separation unit 14D.
- the separation unit 14D separates the irradiation light LA emitted from the light emitting unit 14A into an asymmetric shape with respect to the optical axis, and outputs the excitation light LB.
- a part of the irradiation light LA emitted from the irradiation unit 15A is separated without being discarded, one light beam is used as the excitation light LB for the detection unit 30, and the other light beam is used.
- FIG. 14 is a schematic diagram showing an example of a microscope system 1C of this modification.
- the microscope system 1C includes a measurement unit 10C and a focus adjustment device 12.
- the focus adjustment device 12 is the same as that in the above embodiment.
- the measurement unit 10C is the same as the measurement unit 10 except that the irradiation unit 15 is replaced by the irradiation unit 15B (see FIG. 1).
- the irradiation unit 15B includes a light emitting unit 14F and a collimating lens 14B.
- the collimator lens 14B is the same as that in the above embodiment.
- the light emitting unit 14F emits the irradiation light LA including the wavelength region in which the sample S emits fluorescence, similarly to the light emitting unit 14A of the above embodiment.
- the light emitting unit 14F is any one of a light source that emits spot-shaped (dot-shaped) light, a light source that emits linear light, and a light source that emits linear light through a slit or the like. Good.
- the light emitting position 14E at which the light emitting unit 14F emits light is arranged at a position deviated from the optical axis A1 of the collimator lens 14B. That is, the arrangement positions of the light emitting position 14E and the collimating lens 14B are adjusted in advance so that the light emitting position 14E, which is the aperture squeezing of the light emitting unit 14F, has a positional relationship deviating from the focus position of the collimating lens 14B. Therefore, the collimator lens 14B constitutes a non-telecentric optical system with respect to the light emitting position 14E.
- the irradiation unit 15B has the collimator lens 14B that outputs a light as the excitation light LB by collimating a part of the irradiation light LA emitted from the light emitting unit 14F.
- the light emitting position 14E of the light emitting portion 14F is arranged at a position deviated from the optical axis A1 of the collimator lens 14B.
- the excitation light LB having a shape asymmetric with respect to the optical axis can be realized without using the light shielding portion 14C or the separation portion 14D.
- the configuration for realizing the excitation light LB having an asymmetrical shape with respect to the optical axis which is realized in the above-described embodiment and the above-described modification, is the irradiation light from the light source that emits the irradiation light LA into the measurement unit 10. It may be realized in a space up to the LA output start position. That is, the configuration may be such that the excitation light LB is emitted from an optical member that emits the excitation light LB having an asymmetrical shape, and the excitation light LB may be irradiated into each of the measurement unit 10, the measurement unit 10A, the measurement unit 10B, and the measurement unit 10C. ..
- the pumping light LB having an asymmetrical shape with respect to the optical axis As the pumping light LB having an asymmetrical shape with respect to the optical axis, the pumping light LB in which astigmatism is generated is used.
- the microscope system 1D of this embodiment is similar to the microscope system 1 of the first embodiment (see FIG. 1). However, the microscope system 1D includes an irradiation unit 17 instead of the irradiation unit 14. Further, the microscope system 1D includes a focus adjustment device 13 instead of the focus adjustment device 12.
- the focus adjustment device 13 is an example of an information processing device.
- the irradiation unit 17 irradiates the excitation light LB having an asymmetrical shape with respect to the optical axis, similarly to the irradiation unit 14 of the first embodiment. However, the irradiation unit 17 irradiates the excitation light LB by generating astigmatism in the irradiation light LA emitted from the light emitting unit 14A that emits the spot-shaped irradiation light LA.
- the irradiation unit 14 may be configured not to include the light shielding unit 14C, and the astigmatism lens may be disposed on the light emitting side of the collimator lens 14B.
- An astigmatism lens is a lens which has a plurality of focal lengths and produces astigmatism.
- the astigmatic lens is, for example, a normal objective lens to which a Lindrill lens is added.
- the excitation light LB in which astigmatism has occurred is emitted from the irradiation unit 17 to the measurement target region 22B.
- the focus adjustment device 13 adjusts the focus of the objective lens 20 based on the fluorescence signal 40 acquired from the detection unit 30, similarly to the focus adjustment device 12 of the first embodiment.
- the focus adjustment device 13, the detection unit 30, the first drive unit 36, and the second drive unit 38 are connected so as to be able to exchange data or signals.
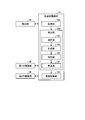
- FIG. 15 is a diagram showing an example of a functional configuration of the focus adjustment device 13. Note that FIG. 15 also illustrates the detection unit 30, the first drive unit 36, and the second drive unit 38 for the sake of explanation.
- the focus adjustment device 13 includes an acquisition unit 13A, a derivation unit 13B, and a movement control unit 13C.
- the derivation unit 13B includes a direction derivation unit 13D and a movement amount derivation unit 13E.
- Some or all of the acquisition unit 13A, the derivation unit 13B, the movement control unit 13C, the direction derivation unit 13D, and the movement amount derivation unit 13E are realized by, for example, causing a processing device such as a CPU to execute a program. It may be realized by hardware such as an IC, or may be realized by using software and hardware together.
- the movement control unit 13C is similar to the movement control unit 12C.
- the acquisition unit 13A acquires the fluorescence signal 40 from the detection unit 30.
- the derivation unit 13B based on the fluorescence signal 40 acquired from the detection unit 30, a movement amount and a movement direction of at least one of the objective lens 20 and the measurement target member 22 for adjusting the focus of the objective lens 20 to the measurement target region 22B. Derive.
- the derivation unit 13B has a direction derivation unit 13D and a movement amount derivation unit 13E.
- the excitation light LB irradiated on the measurement target member 22 has astigmatism.
- the fluorescence intensity value of the fluorescence signal 40 has a correlation with the intensity of the excitation light LB. Therefore, the fluorescence signal 40 obtained in this embodiment has an optical characteristic that reflects the asymmetry of the excitation light LB due to astigmatism.
- the direction of occurrence of blurring due to the change in the distance between the objective lens 20 and the measurement target member 22 in the fluorescence receiving region E included in the fluorescence signal 40 that reflects the asymmetry due to the astigmatism of the excitation light LB is the same as in the above embodiment. And behave differently from the modification.
- FIG. 16 is a schematic diagram showing an example of the fluorescence signal 40 obtained in this embodiment.
- the fluorescence signal 40 includes the fluorescence receiving region E.
- FIG. 16 shows the fluorescence signal 40 obtained by the detection unit 30 at each stage by gradually changing the distance between the measurement target member 22 and the objective lens 20 from a short distance to a long distance.
- a plurality of fluorescence signals 40 (fluorescence signal 40H, fluorescence signal 40I, and fluorescence signal 40J) shown in FIG. 16 are arranged such that the distance between the measurement target member 22 and the objective lens 20 is gradually increased from the fluorescence signal 40H toward the fluorescence signal 40J. It is an example of the fluorescence signal 40 detected at each stage when it is increased.
- the fluorescence signal 40I is an example of the fluorescence signal 40 when the focus of the objective lens 20 matches the measurement target region 22B.
- the vertical axis direction (Y′ axis direction) of the fluorescence signal 40 shown in FIG. 16 corresponds to the Y axis direction on the measurement target member 22.
- the horizontal axis direction (X′ axis direction) of the fluorescence signal 40 shown in FIG. 16 corresponds to the X axis direction in the measurement target member 22.
- the Z′-axis direction of the fluorescence signal 40 shown in FIG. 16 corresponds to the Z-axis direction that is the direction in which the measurement target member 22 and the objective lens 20 approach or leave.
- the fluorescence receiving area E is used depending on whether the distance between the measurement target member 22 and the objective lens 20 is shorter or longer than the distance at the time of focusing. The direction of spread is different. Specifically, when the measurement target region 22B is in focus, as shown in the fluorescence signal 40I, the fluorescence receiving region E included in the fluorescence signal 40I has a substantially circular shape.
- the fluorescence receiving region E has a shape that is spread in the Y′-axis direction.
- the fluorescence signal 40J for example, the fluorescence receiving area E is spread in the X′-axis direction. ..
- the derivation unit 13B divides the fluorescence signal 40 into a plurality of areas according to the spreading direction of the fluorescence receiving area E included in the fluorescence signal 40. Then, the moving direction and the moving amount are derived using the fluorescence intensity values in the respective divided areas.
- FIG. 17 is an explanatory diagram showing an example of derivation of the movement direction and the movement amount.
- the acquisition unit 13A has acquired the fluorescence signal 40J shown in FIG.
- the direction deriving unit 13D derives the moving direction of at least one of the objective lens 20 and the measurement target member 22 based on the spreading direction of the fluorescence receiving region E3 included in the fluorescence signal 40J.
- the direction deriving unit 13D defines the spread direction of the fluorescence receiving region E3 included in the fluorescence signal 40J and the fluorescence receiving region E2 in a state where the fluorescence receiving region E3 having a shape spread in the spreading direction is in focus.
- the first management information in which the moving direction for making the state of the included fluorescence signal 40I (see FIG. 16) correspond is stored in advance.
- This moving direction may be the moving direction of at least one of the objective lens 20 and the measurement target member 22. In the present embodiment, description will be given on the assumption that the objective lens 20 is in the moving direction.
- the direction deriving unit 13D reads the moving direction corresponding to the spreading direction of the fluorescent light receiving region E included in the fluorescent signal 40J acquired by the acquiring unit 13A in the first management information, and thus the moving direction of the objective lens 20. Should be derived.
- the direction derivation unit 13D may previously store a function indicating the relationship shown in the first management information, and derive the moving direction using the function.
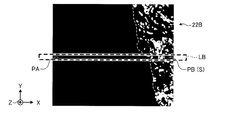
- the movement amount derivation unit 13E sets a boundary on the fluorescence signal 40J acquired by the acquisition unit 13A. Specifically, the movement amount deriving unit 13E passes a straight line 61 that passes over the fluorescence receiving area E3 included in the fluorescence signal 40J and along the spreading direction of the fluorescence receiving area E3 (X′ axis direction in FIG. 17). , Set as boundaries. Then, the movement amount deriving unit 13E divides the fluorescence signal 40J into two regions (region 60A and region 60B) with the straight line 61 as a boundary.
- the movement amount deriving unit 13E calculates the total value of the fluorescence intensity values of the pixels included in each of the regions 60A and 60B. Then, the movement amount deriving unit 13E moves the ratio of the difference between the total values of the fluorescence intensity values of the two regions 60A and 60B to the total value of the fluorescence intensity values included in the fluorescence signal 40J by moving the objective lens 20. Derived as a quantity.
- the movement amount deriving unit 13E derives the movement amount using the following equation (2).
- ⁇ A represents the total value of the fluorescence intensity value of each pixel included in the area 60A.
- ⁇ B represents the total value of the fluorescence intensity values of the pixels included in the region 60B.
- the deriving unit 13B uses the fluorescence signal 40 acquired from the detecting unit 30 having at least two light receiving units 31 to derive the moving direction and the moving amount of at least one of the objective lens 20 and the measurement target member 22. You can
- the deriving unit 13B may derive the moving direction and the moving amount of at least one of the objective lens 20 and the measurement target member 22 by using another method.
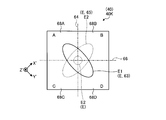
- FIG. 18 is an explanatory diagram showing another example of derivation of the movement direction and the movement amount.
- the fluorescence signal 40K includes the fluorescence receiving area E2.
- the fluorescent light receiving region E2 and the fluorescent light receiving region E3 are shown together on the fluorescent signal 40K (see also FIG. 16).
- the direction deriving unit 13D divides the fluorescence signal 40K into four regions (region 68A, region 68B, region 68C, region 68D). Specifically, the direction derivation unit 13D includes one end of the first linear region 63, the other end of the first linear region 63, and the second linear region 65 on the fluorescence signal 40K. Each of the one end and the other end of the second linear region 65 is specified.
- the first linear region 63 is a linear region showing the spread of the fluorescence receiving region E1 when the distance between the objective lens 20 and the measurement target member 22 becomes shorter.
- the second linear region 65 is a linear region showing the spread of the fluorescence receiving region E1 when the distance between the objective lens 20 and the measurement target member 22 increases.
- the linear region is a region that is long in the spreading direction of the fluorescence receiving region E.
- the direction deriving unit 13D may store the positions and ranges of the first linear region 63 and the second linear region 65 on the fluorescence signal 40 in advance.
- the direction derivation unit 13D divides the fluorescence signal 40 into four regions (region 68A, region 68B, region 68C, and region 68D) so that each of the specified four end portions is arranged in a different region. To do.
- the direction derivation unit 13D includes a straight line along the longitudinal direction of the first linear region 63 and a straight line along the longitudinal direction of the second linear region 65 on the fluorescence signal 40K. You may arrange
- the direction deriving unit 13D determines the spreading direction of the fluorescence receiving region E2 included in the fluorescence signal 40K acquired from the detecting unit 30 among the four regions (68A, region 68B, region 68C, and region 68D) in the fluorescence signal 40K. Two regions where both ends are located (region 68A and region 68D in FIG. 18) are specified as the region where the fluorescence receiving region E2 exists.
- the direction deriving unit 13D may derive the moving direction according to the positional relationship of the identified existing region in the fluorescence signal 40K.
- the spread direction of the fluorescent light receiving region E differs depending on whether the distance between the measurement target member 22 and the objective lens 20 is shorter than that in focus.
- the direction derivation unit 13D stores in advance the second management information in which the movement direction for bringing the fluorescence signal 40K into the in-focus state, which corresponds to the positional relationship of the identified existing regions, is associated with each other.
- This moving direction may be the moving direction of at least one of the objective lens 20 and the measurement target member 22. In the present embodiment, description will be given on the assumption that the objective lens 20 is in the moving direction.
- the direction deriving unit 13D may derive the moving direction of the objective lens 20 by reading the moving direction corresponding to the positional relationship of the identified existing region from the second management information.
- the direction derivation unit 13D may store in advance a function indicating the relationship indicated by the second management information, and derive the movement direction using the function.
- the movement amount derivation unit 13E determines the existence region of the fluorescence receiving region E2 (the region 68A, the region 68B, the region 68C, and the region 68D) of the four regions with respect to the total value of the fluorescence intensity values included in the fluorescence signal 40K ( From the total value of the regions 68A and 68D), the ratio of the difference obtained by subtracting the total value of the fluorescence intensity values of the regions (regions 68B and 68C) other than the existing region of the four regions is derived as the movement amount. ..
- the movement amount deriving unit 13E derives the movement amount using the following equation (3).
- ⁇ A represents the total value of the fluorescence intensity value of each pixel included in the area 68A.
- ⁇ B represents the total value of the fluorescence intensity values of the pixels included in the area 68B.
- ⁇ C represents the total value of the fluorescence intensity values of the pixels included in the area 68C.
- ⁇ D represents the total value of the fluorescence intensity values of the pixels included in the area 68D.
- the derivation unit 13B derives the movement direction and the movement amount of at least one of the objective lens 20 and the measurement target member 22 using the fluorescence signal 40 acquired from the detection unit 30 having at least four light receiving units 31. You can
- FIG. 19 is a flowchart showing an example of the flow of information processing.
- the acquisition unit 13A acquires the fluorescence signal 40 from the detection unit 30 (step S200).
- the direction deriving unit 13D derives the moving direction using the fluorescence signal 40 acquired in step S200 (step S202).
- the movement amount deriving unit 13E derives the movement amount using the fluorescence signal 40 acquired in step S200 (step S204).
- the movement control unit 13C moves at least one of the objective lens 20 and the measurement target member 22 in the movement amount and movement direction derived in steps S202 and S204 (step S206). Therefore, the positions of the objective lens 20 and the measurement target member 22 are adjusted so that the focus of the objective lens 20 is aligned with the measurement target region 22B of the measurement target member 22.
- step S208 determines whether or not to end the information processing.
- the determination in step S208 is the same as step S112 (see FIG. 9) in the first embodiment.
- step S208: No the process returns to step S200. If an affirmative decision is made in step S208 (step S208: Yes), this routine ends.
- the irradiation unit 17 of the microscope system 1D of the present embodiment irradiates the irradiation light LA emitted from the light emitting unit 14A with the excitation light LB in which astigmatism is generated.
- the excitation light LB in which the astigmatism is generated may be used as the excitation light LB having a shape asymmetric with respect to the optical axis.
- the microscope system 1D collects the asymmetrical excitation light LB on the measurement target member 22 and outputs the fluorescence signal 40 indicating the fluorescence intensity value of the fluorescence emitted from the measurement target region 22B. Then, in the microscope system 1D, the fluorescence signal 40 is used to derive the movement amount and the movement direction of at least one of the objective lens 20 and the measurement target member 22, and the movement is controlled.
- the microscope system 1D of the present embodiment it is possible to easily focus on the measurement target region 22B arranged via the glass (glass member 22A).
- the derivation unit 13B also includes a direction derivation unit 13D and a movement amount derivation unit 13E.
- the direction derivation unit 13D derives the movement direction based on the spreading direction of the fluorescence receiving region E included in the fluorescence signal 40.
- the movement amount deriving unit 13E divides the fluorescence signal 40 into two regions (regions 60A and 60B) with a straight line 61 passing through the fluorescence receiving region E and extending in the spreading direction of the fluorescence receiving region E as a boundary. The ratio of the difference between the total values of the fluorescence intensity values of the two regions (the regions 60A and 60B) to the total value of the fluorescence intensity values included in the fluorescence signal 40 is derived as the movement amount.
- the microscope system 1D of the present embodiment by acquiring the fluorescence signal 40 from the detection unit 30 including at least two light receiving units 31, the measurement target region 22B arranged via the glass (glass member 22A). You can easily focus on.
- the direction deriving unit 13D sends the fluorescence signal 40 to one end of the first linear region 63 showing the spread of the fluorescence receiving region E when the distance between the objective lens 20 and the measurement target member 22 is short,
- the other end of the first linear region 63, one end of the second linear region 65 showing the spread of the fluorescence receiving region E when the distance between the objective lens 20 and the measurement target member 22 increases, and the second The other end of the linear area 65 and the linear area 65 are divided into four areas (area 68A, area 68B, area 68C, and area 68D).
- both ends in the spreading direction of the fluorescence receiving region E included in the fluorescence signal 40 acquired from the detecting unit 30 are provided.
- the movement direction is derived according to the existing regions (regions 68A and 68D) that are the two regions located.
- the movement amount deriving unit 13E includes existing regions (regions 68A and 68D) within the four regions (region 68A, region 68B, region 68C, and region 68D) with respect to the total value of the fluorescence intensity values included in the fluorescence signal 40. ), the ratio of the difference obtained by subtracting the total value of the fluorescence intensity values of the other two areas (area 68B, area 68C) other than the existing area of the four areas from the total value of the fluorescence intensity values of Derive.
- the microscope system 1D of the present embodiment by acquiring the fluorescence signal 40 from the detection unit 30 including at least four light receiving units 31, the measurement target region 22B arranged via the glass (glass member 22A). You can easily focus on.
- the microscope system 1E of this embodiment is the same as the microscope system 1 of the first embodiment (see FIG. 1). However, the microscope system 1E includes a detection unit 39 instead of the detection unit 30. Further, the microscope system 1E includes a focus adjustment device 19 instead of the focus adjustment device 12.
- the focus adjustment device 19 is an example of an information processing device.
- the description will be made assuming that the light emitting unit 14A is a light source that emits the irradiation light LA having a linear shape. Further, similar to the first embodiment, a case where the longitudinal direction of the linearly-shaped irradiation light LA coincides with the X-axis direction in FIG. 1 will be described as an example.
- FIG. 20 is a schematic diagram showing an example of the detection unit 39.
- the detection unit 39 includes a plurality of light receiving units 31, similarly to the detection unit 30 of the first embodiment, receives the fluorescence emitted from the measurement target region 22B, and outputs the fluorescence signal 40.
- the detection unit 39 includes a plurality of light receiving units 31.
- the plurality of light receiving units 31 are two-dimensionally arranged along the light receiving surface 33 that receives the fluorescence.
- the detection unit 39 may have a configuration in which the plurality of light receiving units 31 are one-dimensionally arranged along the light receiving surface 33.
- the detection unit 39 may include at least two light receiving units 31.
- the detection unit 39 has a configuration in which the plurality of light receiving units 31 are two-dimensionally arranged along the light receiving surface 33 will be described as an example.
- the detection unit 39 has a configuration in which a plurality of types of unit regions 37 are arranged along the light receiving surface 33.
- Each of the plurality of types of unit areas 37 includes one or a plurality of light receiving portions 31.
- the plurality of types of unit areas 37 have different exposure values of the light receiving unit 31 included therein.
- the exposure value means at least one of gain and charge storage time. That is, the plurality of types of unit regions 37 are regions in which at least one of the gain and the charge accumulation time of the light receiving unit 31 included therein is different from each other.
- the definitions of the gain and the charge storage time have been described in the first embodiment, and thus the description thereof is omitted here.
- the exposure values of the plurality of light receiving units 31 included in one unit area 37 are the same as each other.
- a predetermined exposure value may be set for each of the plurality of light receiving units 31 for each type of the unit area 37 to which the light receiving unit 31 belongs. Therefore, as the light receiving unit 31, the light receiving unit 31 that can set the exposure value to an arbitrary value may be used.
- FIG. 20 shows, as an example, a configuration in which the detection unit 39 has a configuration in which unit areas 37A and 37B are alternately arranged as the two kinds of unit areas 37.
- the unit area 37A and the unit area 37B are different unit areas 37 from each other.
- a high exposure value is set in advance in the light receiving unit 31 included in the unit area 37A.
- a high exposure value means that at least one of gain and charge storage time is equal to or greater than a threshold value.
- a low exposure value is set in advance in the light receiving unit 31 included in the unit area 37B.
- a low exposure value means that at least one of gain and charge storage time is below a threshold.
- the threshold may be set in advance.
- the detection unit 39 may have a configuration in which three or more types of unit areas 37 having different exposure values are arranged, and is not limited to two types of unit areas 37.
- the detection unit 39 receives fluorescence and outputs a fluorescence signal 40.
- the fluorescence signal 40 output from the detection unit 39 is a signal indicating the intensity value of the fluorescence received by each of the plurality of light receiving units 31, similarly to the fluorescence signal 40 described in the above embodiment. That is, the fluorescence signal 40 is a signal that defines the fluorescence intensity value for each of the plurality of light receiving units 31.
- the detection unit 39 outputs the fluorescence signal 40 to the focus adjustment device 19.
- FIG. 21 is a diagram showing an example of the functional configuration of the focus adjustment device 19. Note that FIG. 21 also illustrates the detection unit 39, the first drive unit 36, and the second drive unit 38 for the sake of explanation.
- the focus adjustment device 19 adjusts the focus of the objective lens 20 based on the fluorescence signal 40 acquired from the detection unit 39, similarly to the focus adjustment device 12 of the first embodiment.
- the focus adjustment device 19, the detection unit 39, the first drive unit 36, and the second drive unit 38 are connected so as to be able to exchange data or signals.
- the focus adjustment device 19 includes an acquisition unit 19A, a derivation unit 19B, and a movement control unit 19C.
- the derivation unit 19B includes a selection unit 19G, a generation unit 19D, a specification unit 19E, and a calculation unit 19F.
- Some or all of the acquisition unit 19A, the derivation unit 19B, the movement control unit 19C, the selection unit 19G, the generation unit 19D, the identification unit 19E, and the calculation unit 19F cause a processing device such as a CPU to execute the program. That is, it may be implemented by software, hardware such as an IC, or both software and hardware.
- the movement control unit 19C is similar to the movement control unit 12C.
- the acquisition unit 19A acquires the fluorescence signal 40 from the detection unit 39.
- the deriving unit 19B derives the movement amount and the movement direction of at least one of the objective lens 20 and the measurement target member 22 based on the fluorescence signal 40 acquired from the detection unit 39. Specifically, the derivation unit 19B derives the movement amount and the movement direction for adjusting the focus of the objective lens 20 to the measurement target region 22B based on the fluorescence signal 40.
- the derivation unit 19B includes a selection unit 19G, a generation unit 19D, a specification unit 19E, and a calculation unit 19F.
- the selection unit 19G selects the unit area 37 including the light receiving unit 31 for which a specific exposure value is set, from the plurality of types of unit areas 37.
- FIG. 22A is an image diagram of the measurement target region 22B of the sample S.
- the irradiation light LA having a line shape is asymmetric with respect to the optical axis A1 and is irradiated onto the measurement target region 22B as the excitation light LB.
- the sample S included in the measurement target region 22B is an object such as a cell that is labeled with a fluorescent dye that emits fluorescence upon irradiation with the excitation light LB.
- the intensity of the light emitted from the region PB in which the sample S exists in the irradiation region of the excitation light LB in the measurement target region 22B becomes higher than the intensity of the light emitted from the region PA in which the sample S does not exist. ..
- FIG. 22B is a schematic diagram showing an example of the fluorescence signal 40L.
- the fluorescence signal 40L is an example of the fluorescence signal 40 output from the detection unit 39.
- the area EA corresponding to the area PA where the sample S does not exist has a lower intensity value of the fluorescence received by the light receiving unit 31 than the area EB corresponding to the area PB where the sample S exists. Therefore, for the area EA, it is preferable to perform information processing using the intensity value of the fluorescence received by the light receiving unit 31 having a high exposure value. Further, regarding the region EB, it is preferable to perform information processing using the intensity value of fluorescence received by the light receiving unit 31 having a low exposure value.
- the selection unit 19G selects the unit area 37 including the light receiving unit 31 to which a specific exposure value is set, from the plurality of types of unit areas 37 included in the detection unit 39.
- the selection unit 19G uses the fluorescence signal 40L acquired by the acquisition unit 19A to select the unit region 37. Specifically, the selection unit 19G selects the unit region 37 including the light receiving unit 31 whose fluorescence intensity value is within a predetermined range. For example, assume that the fluorescence intensity value is represented by a gradation value of 0 to 255. In this case, the selection unit 19G identifies a region in the fluorescence signal 40L in which the gradation value that is the fluorescence intensity value is within a predetermined range.
- the selection unit 19G selects the unit region 37 including the light receiving unit 31 corresponding to the specified region. For example, the selection unit 19G selects, as the predetermined range, the unit area 37 including the light receiving unit 31 that outputs the fluorescence intensity value within the range of the gradation value of 10 or more and 250 or less.
- FIG. 22C is an explanatory diagram of selection of the unit area 37.
- the selecting unit 19G causes the unit area 37A (unit area 37A1) in which a high exposure value is set in the light receiving unit 31 included in the area EA in the fluorescence signal 40L corresponding to the area PA where the sample S does not exist. , 37A2, 37A3, 37A4).
- the selecting unit 19G in the fluorescence signal 40L, for the region EB corresponding to the region PB in which the sample S exists, the unit region 37B (unit regions 37B4, 37B5) in which the light receiving unit 31 included has a low exposure value. Select.
- the generation unit 19D generates a profile of the fluorescence intensity value included in the fluorescence signal 40L, similar to the generation unit 12D of the first embodiment. However, the generation unit 19D of the present embodiment generates a profile using the fluorescence signal 40 including the fluorescence intensity value of the light receiving unit 31 included in the unit area 37 selected by the selection unit 19G in the fluorescence signal 40L.
- the specifying unit 19E specifies the barycentric position of the fluorescence intensity value in the fluorescence signal 40L based on the profile generated by the generating unit 19D. That is, the identifying unit 19E indicates the fluorescence signal 40 indicating the fluorescence intensity value received by the light receiving unit 31 included in the unit area 37 (unit areas 37A1, 37A2, 37A3, 37A4, 37B4, 37B5) selected by the selecting unit 19G. The position of the center of gravity is specified based on the profile of. The identifying unit 19E may calculate the barycentric position in the same manner as the identifying unit 12E of the first embodiment except that the profile is used.
- the calculation unit 19F specifies the target center-of-gravity position in the same manner as the calculation unit 12F of the first embodiment, and calculates the movement amount and the movement direction based on the difference between the center-of-gravity position and the target center-of-gravity position.
- the calculation unit 19F moves at least one of the objective lens 20 and the measurement target member 22 in the movement amount and movement direction derived by the derivation unit 19B.
- the calculation unit 19F is similar to the movement control unit 12C of the first embodiment except that the movement amount and the movement direction derived by the derivation unit 19B are used instead of the derivation unit 12B, and the objective lens 20 and the measurement target are measured. At least one of the members 22 is moved.
- FIG. 23 is a flowchart showing an example of the flow of information processing executed by the focus adjustment device 19.
- the acquisition unit 19A acquires the fluorescence signal 40L from the detection unit 39 (step S300).
- the selection unit 19G selects the unit area 37 including the light receiving unit 31 for which a specific exposure value is set, from the plurality of types of unit areas 37 (step S302).
- the generation unit 19D uses the fluorescence signal 40L acquired in step S300 to generate a profile using the fluorescence signal 40 including the fluorescence intensity value of the light receiving unit 31 included in the unit area 37 selected in step S302 (step S304). ).
- the identifying unit 19E identifies the barycentric position g of the fluorescence intensity value in the fluorescence signal 40 based on the profile generated in step S304 (step S306).
- the calculation unit 19F calculates the difference ⁇ g between the barycentric position g specified in step S306 and the target barycentric position g′ (step S308).
- the calculation unit 19F uses the difference ⁇ g calculated in step S308 to calculate the movement amount and the movement direction of at least one of the objective lens 20 and the measurement target member 22 (step S310).
- the movement control unit 19C moves at least one of the objective lens 20 and the measurement target member 22 in the movement amount and the movement direction derived by the derivation unit 19B (step S312).
- the movement control unit 19C drives and controls at least one of the first drive unit 36 and the second drive unit 38 to move at least one of the objective lens 20 and the measurement target member 22. Therefore, the positions of the objective lens 20 and the measurement target member 22 are adjusted so that the focus of the objective lens 20 is aligned with the measurement target region 22B of the measurement target member 22.
- the focus adjustment device 19 determines whether to end the information processing (step S314). For example, the focus adjustment device 19 determines in step S314 by determining whether or not an instruction signal indicating the end of processing has been received. When it is determined to continue the process (step S314: No), the process returns to step S300. On the other hand, when it is determined that the processing is finished (step S314: Yes), this routine is finished.
- a plurality of types of unit regions 37 having different exposure values of the included light receiving unit 31 are arranged along the light receiving surface.
- the selection unit 19G of the derivation unit 19B selects the unit region 37 including the light receiving unit 31 having a specific exposure value from the plurality of types of unit regions 37.
- the identifying unit 19E identifies the barycentric position g based on the profile of the fluorescence signal 40 indicating the fluorescence intensity value of the light receiving unit 31 included in the selected unit area 37.
- the microscope system 1E of the present embodiment as compared with the case where the above information processing is performed using the fluorescence signal 40 of the detection unit 30 including the light receiving unit 31 with the same exposure value set, saturation, signal shortage, etc. It is possible to suppress the occurrence of problems.
- the accuracy of specifying the barycentric position g for specifying the barycentric position g based on the profile of the fluorescence signal 40 indicating the fluorescence intensity value of the light receiving unit 31 included in the selected unit area 37 is improved. Can be planned. Therefore, in the microscope system 1E, in addition to the effects of the above-described embodiment, it is possible to more accurately focus on the measurement target region 22B arranged via the glass (glass member 22A).
- FIG. 24 is a hardware configuration diagram showing an example of a computer 1000 that realizes the functions of the focus adjustment device 12, the focus adjustment device 13, and the focus adjustment device 19 according to the above-described embodiment and modification.
- the computer 1000 has a CPU 1100, a RAM 1200, a ROM (Read Only Memory) 1300, an HDD (Hard Disk Drive) 1400, a communication interface 1500, and an input/output interface 1600.
- the respective units of the computer 1000 are connected by a bus 1050.
- the CPU 1100 operates based on a program stored in the ROM 1300 or the HDD 1400, and controls each part. For example, the CPU 1100 expands the focus adjustment program stored in the ROM 1300 or the HDD 1400 into the RAM 1200 and executes the processing corresponding to the focus adjustment program.
- the ROM 1300 stores a boot program such as a BIOS (Basic Input Output System) that is executed by the CPU 1100 when the computer 1000 starts up, a program that depends on the hardware of the computer 1000, and the like.
- BIOS Basic Input Output System
- the HDD 1400 is a computer-readable recording medium that non-temporarily records a program executed by the CPU 1100, data used by the program, and the like.
- the HDD 1400 is a recording medium that records the focus adjustment program according to the present disclosure, which is an example of the program data 1450.
- the communication interface 1500 is an interface for connecting the computer 1000 to an external network 1550 (for example, the Internet).
- the CPU 1100 receives data from another device or transmits the data generated by the CPU 1100 to another device via the communication interface 1500.
- the input/output interface 1600 is an interface for connecting the input/output device 1650 and the computer 1000.
- the CPU 1100 receives data from an input device such as a keyboard or a mouse via the input/output interface 1600.
- the CPU 1100 also transmits data to an output device such as a display, a speaker, or a printer via the input/output interface 1600.
- the input/output interface 1600 may also function as a media interface for reading the focus adjustment program and the like recorded in a predetermined recording medium (medium).
- the medium is, for example, an optical recording medium such as a DVD (Digital Versatile Disc), a PD (Phase change rewritable Disk), a magneto-optical recording medium such as an MO (Magneto-Optical disk), a tape medium, a magnetic recording medium, or a semiconductor memory.
- an optical recording medium such as a DVD (Digital Versatile Disc), a PD (Phase change rewritable Disk), a magneto-optical recording medium such as an MO (Magneto-Optical disk), a tape medium, a magnetic recording medium, or a semiconductor memory.
- the CPU 1100 of the computer 1000 executes the focus adjusting program loaded on the RAM 1200. Functions of the acquisition unit 12A, the derivation unit 12B, and the movement control unit 12C, or the acquisition unit 13A, the derivation unit 13B, and the movement control unit 13C, or the acquisition unit 19A, the derivation unit 19B, and the movement control unit 19C.
- the HDD 1400 stores the focus adjustment program and data according to the present disclosure.
- the CPU 1100 reads the program data 1450 from the HDD 1400 and executes the program data. However, as another example, these programs may be acquired from another device via the external network 1550.
- An irradiation unit that irradiates excitation light having a shape asymmetric with respect to the optical axis
- An objective lens that collects the excitation light on a measurement target member including a glass member and a measurement target region
- a detection unit that includes at least one light receiving unit that receives the fluorescence emitted from the measurement target region by the excitation light, and that outputs a fluorescence signal indicating the intensity value of the fluorescence received by each of the light receiving units;
- a derivation unit for deriving a movement amount and a movement direction of at least one of the objective lens and the measurement target member based on the fluorescence signal, and the objective lens and the measurement in the derived movement amount and the movement direction.
- a movement control unit that moves at least one of the target members, A microscope system comprising.
- the derivation unit A generation unit that generates a profile of the intensity value included in the fluorescence signal, Based on the profile, a specifying unit for specifying the barycentric position of the intensity value in the fluorescence signal, A target barycentric position is specified, and based on the difference between the barycentric position and the target barycentric position, a calculating unit that calculates the moving amount and the moving direction,
- the microscope system according to (1) above.
- the detection unit A plurality of types of unit areas having different exposure values of the light receiving unit included therein are arranged along the light receiving surface,
- the derivation unit A selection unit that selects the unit region that includes the light receiving unit having a specific exposure value from among a plurality of types of unit regions,
- the specific unit is Based on the profile of the fluorescence signal indicating the intensity value of the light receiving unit included in the selected unit area, to specify the barycentric position,
- the generator is The profile is generated using the intensity value of the fluorescence receiving region included in the fluorescence signal.
- the irradiation unit Part of the irradiation light emitted from the light emitting unit is shielded, and a light shielding unit that outputs the excitation light is provided, The microscope system according to any one of (1) to (4) above.
- the irradiation unit It has a separation part that separates the irradiation light emitted from the light emitting part into an asymmetric shape with respect to the optical axis, The microscope system according to any one of (1) to (4) above.
- the light emitting unit, The light emitting position of the light emitting unit is arranged at a position off the optical axis of the collimator lens,
- the microscope system according to any one of (1) to (4) above.
- the derivation unit Based on the spreading direction of the fluorescence receiving region included in the fluorescence signal, a direction deriving unit for deriving the moving direction,
- the fluorescence signal is divided into two regions with a straight line passing over the fluorescence light receiving region and extending along the spreading direction of the fluorescence light receiving region as a boundary, and two regions are added to the total value of the intensity values included in the fluorescence signal.
- a movement amount derivation unit that derives the ratio of the difference between the total values of the intensity values of the regions as the movement amount, Have The microscope system according to (8) above.
- the derivation unit The fluorescence signal is supplied to one end of a first linear region showing the spread of the fluorescence receiving region when the distance between the objective lens and the measurement target member is short, and the other end of the first linear region.
- One end of a second linear region showing the spread of the fluorescence receiving region when the distance between the objective lens and the measurement target member increases, and the other end of the second linear region Are divided into four areas so that the Of the four regions, the movement direction is derived in accordance with the existing regions, which are the two regions in which both ends in the spreading direction of the fluorescence receiving region included in the fluorescence signal acquired from the detection unit are located.
- a direction derivation unit From the total value of the intensity values of the existing regions of the four regions to the total value of the intensity values included in the fluorescence signal, the two other than the existing regions of the four regions A movement amount deriving unit that derives the ratio of the difference obtained by subtracting the total value of the intensity values of the region as the movement amount, Have The microscope system according to (8) above. (11) The detection unit, A plurality of block regions including a plurality of types of the light receiving portions having different gains and/or charge storage times are arranged along the light receiving surface. The microscope system according to any one of (1) to (10) above.
- An irradiation unit that irradiates excitation light having an asymmetrical shape with respect to the optical axis, an objective lens that condenses the excitation light on a measurement target member including a glass member and a measurement target region, and the measurement target region by the excitation light. From at least one light receiving unit for receiving the fluorescence emitted from the detection unit, and a detection unit outputting a fluorescence signal indicating the intensity value of the fluorescence received by each of the light receiving units.
- a step of acquiring a signal A derivation unit for deriving a movement amount and a movement direction of at least one of the objective lens and the measurement target member based on the fluorescence signal, and the objective lens and the measurement in the derived movement amount and the movement direction. Controlling the movement of at least one of the target members, A focus adjustment program that causes a computer to execute.
- a focus adjustment system configured to include a measurement unit and software used for controlling the operation of the measurement unit,
- the software is installed in the information processing device,
- the measurement unit An irradiation unit that irradiates excitation light having a shape asymmetric with respect to the optical axis,
- An objective lens that collects the excitation light on a measurement target member including a glass member and a measurement target region,
- a detection unit that includes at least one light receiving unit that receives the fluorescence emitted from the measurement target region by the excitation light, and that outputs a fluorescence signal indicating the intensity value of the fluorescence received by each of the light receiving units;
- the software is From the detection unit, obtain the fluorescence signal, Based on the fluorescence signal, for adjusting the focus of the objective lens to the measurement target region, derive the movement amount and movement direction of at least one of the objective lens and the measurement target member, At least one of the objective lens and the measurement target member is controlled to move in the derived movement amount and movement direction, Focus
Landscapes
- Physics & Mathematics (AREA)
- General Physics & Mathematics (AREA)
- Optics & Photonics (AREA)
- Chemical & Material Sciences (AREA)
- Analytical Chemistry (AREA)
- Health & Medical Sciences (AREA)
- Nuclear Medicine, Radiotherapy & Molecular Imaging (AREA)
- Computer Vision & Pattern Recognition (AREA)
- Engineering & Computer Science (AREA)
- Life Sciences & Earth Sciences (AREA)
- Biochemistry (AREA)
- General Health & Medical Sciences (AREA)
- Immunology (AREA)
- Pathology (AREA)
- Microscoopes, Condenser (AREA)
- Investigating, Analyzing Materials By Fluorescence Or Luminescence (AREA)
- Automatic Focus Adjustment (AREA)
Abstract
Description
図1は、本実施形態の顕微鏡システム1の一例を示す模式図である。
上記実施形態では、検出部30と、画像検出部34と、を別体として構成した場合を一例として説明した。しかし、検出部30としてCMOSイメージセンサ、または、CCDイメージセンサを用いる場合には、検出部30と画像検出部34とを共通化してもよい。
上記実施形態では、遮光部14Cによって照射光LAの一部遮光することで、光軸に対して非対称の形状の励起光LBを照射した。しかし、励起光LBの実現方法は、上記実施形態に限定されない。例えば、照射光LAを分離することで、励起光LBを実現してもよい。
本変形例では、非対称の形状の励起光LBを、遮光部14Cまたは分離部14Dを用いずに実現する構成を説明する。
なお、上記実施形態および上記変形例で実現した、光軸に対して非対称な形状の励起光LBを実現するための構成は、照射光LAを発光する光源から、測定部10内への照射光LAの出力開始位置までの間の空間に、実現されていてもよい。すなわち、非対称な形状の励起光LBを発光する光学部材から励起光LBを発光する構成とし、測定部10、測定部10A、測定部10B、測定部10Cの各々内に照射するようにしてもよい。
本実施形態では、光軸に対して非対称の形状の励起光LBとして、非点収差を発生させた励起光LBを用いる形態を説明する。
本実施形態では、特定の露出値の受光部31による蛍光信号40を用いて、重心位置を特定する形態を説明する。なお、上記実施形態と同じ機能または構成を示す部分には、同じ符号を付与し、詳細な説明を省略する場合がある。
図24は、上記実施形態および変形例に係る焦点調整装置12、焦点調整装置13、および焦点調整装置19の機能を実現するコンピュータ1000の一例を示すハードウェア構成図である。
(1)
光軸に対して非対称の形状の励起光を照射する照射部と、
ガラス部材と測定対象領域とを含む測定対象部材に前記励起光を集光する対物レンズと、
前記励起光により前記測定対象領域から発せられた蛍光を受光する少なくとも1つ以上の受光部を備え、各々の前記受光部で受光した蛍光の強度値を示す蛍光信号を出力する検出部と、
前記蛍光信号に基づいて、前記対物レンズおよび前記測定対象部材の少なくとも一方の移動量および移動方向を導出する導出部を備え、導出された前記移動量および前記移動方向に、前記対物レンズおよび前記測定対象部材の少なくとも一方を移動させる移動制御部と、
を備える、顕微鏡システム。
(2)
前記導出部は、
前記蛍光信号に含まれる前記強度値のプロファイルを生成する生成部と、
前記プロファイルに基づいて、前記蛍光信号における前記強度値の重心位置を特定する特定部と、
目標重心位置を特定し、前記重心位置と前記目標重心位置との差に基づいて、前記移動量および前記移動方向を算出する算出部と、
を有する、
上記(1)に記載の顕微鏡システム。
(3)
前記検出部は、
含まれる前記受光部の露出値が互いに異なる複数種類の単位領域が受光面に沿って配列され、
前記導出部は、
複数種類の前記単位領域の内、特定の露出値の前記受光部を含む前記単位領域を選択する選択部を含み、
前記特定部は、
選択された前記単位領域に含まれる前記受光部の前記強度値を示す前記蛍光信号の前記プロファイルに基づいて、前記重心位置を特定する、
上記(2)に記載の顕微鏡システム。
(4)
前記生成部は、
前記蛍光信号に含まれる蛍光受光領域の前記強度値を用いて、前記プロファイルを生成する、
上記(2)に記載の顕微鏡システム。
(5)
前記照射部は、
発光部から照射された照射光の一部を遮光し、前記励起光として出力する遮光部を有する、
上記(1)~(4)の何れか1つに記載の顕微鏡システム。
(6)
前記照射部は、
発光部から照射された照射光を光軸に対して非対称の形状に分離する分離部を有する、
上記(1)~(4)の何れか1つに記載の顕微鏡システム。
(7)
前記照射部は、
発光部から照射された照射光の一部を平行にして前記励起光として出力するコリメートレンズを有し、
前記発光部は、
前記発光部の発光位置が前記コリメートレンズの光軸から外れた位置に配置されてなる、
上記(1)~(4)の何れか1つに記載の顕微鏡システム。
(8)
前記照射部は、
発光部から照射された照射光に非点収差を発生させた前記励起光を照射する、
上記(1)~(4)の何れか1つに記載の顕微鏡システム。
(9)
前記導出部は、
前記蛍光信号に含まれる蛍光受光領域の広がり方向に基づいて、前記移動方向を導出する方向導出部と、
前記蛍光信号を、該蛍光受光領域上を通り且つ該蛍光受光領域の広がり方向に沿った直線を境界として2つの領域に分割し、前記蛍光信号に含まれる前記強度値の合計値に対する、2つの前記領域の各々の前記強度値の合計値の差の比を、前記移動量として導出する移動量導出部と、
を有する、
上記(8)に記載の顕微鏡システム。
(10)
前記導出部は、
前記蛍光信号を、前記対物レンズと前記測定対象部材との距離が近づくときの蛍光受光領域の広がりを示す第1の線状領域の一端部と、該第1の線状領域の他端部と、前記対物レンズと前記測定対象部材との距離が離れるときの前記蛍光受光領域の広がりを示す第2の線状領域の一端部と、該第2の線状領域の他端部と、の各々が互いに異なる領域に配置されるように4つの領域に分割し、
4つの前記領域の内、前記検出部から取得した前記蛍光信号に含まれる前記蛍光受光領域の広がり方向の両端部が位置する2つの前記領域である存在領域に応じて、前記移動方向を導出する方向導出部と、
前記蛍光信号に含まれる前記強度値の合計値に対する、4つの前記領域の内の前記存在領域の前記強度値の合計値から、4つの前記領域の内の前記存在領域以外の他の2つの前記領域の前記強度値の合計値を減算した差分の比を、前記移動量として導出する移動量導出部と、
を有する、
上記(8)に記載の顕微鏡システム。
(11)
前記検出部は、
ゲインおよび電荷蓄積時間の少なくとも一方の異なる複数種類の前記受光部を含むブロック領域を受光面に沿って複数配列してなる、
上記(1)~(10)の何れか1つに記載の顕微鏡システム。
(12)
光軸に対して非対称の形状の励起光を照射する照射部と、ガラス部材と測定対象領域とを含む測定対象部材に前記励起光を集光する対物レンズと、前記励起光により前記測定対象領域から発せられた蛍光を受光する少なくとも1つ以上の受光部を備え、各々の前記受光部で受光した蛍光の強度値を示す蛍光信号を出力する検出部と、を備えた測定部から、前記蛍光信号を取得するステップと、
前記蛍光信号に基づいて、前記対物レンズおよび前記測定対象部材の少なくとも一方の移動量および移動方向を導出する導出部を備え、導出された前記移動量および前記移動方向に、前記対物レンズおよび前記測定対象部材の少なくとも一方を移動制御するステップと、
をコンピュータに実行させるための焦点調整プログラム。
(13)
測定部と、前記測定部の動作の制御に使われるソフトウェアと、を含んで構成される焦点調整システムであって、
前記ソフトウェアは情報処理装置に搭載されており、
前記測定部は、
光軸に対して非対称の形状の励起光を照射する照射部と、
ガラス部材と測定対象領域とを含む測定対象部材に前記励起光を集光する対物レンズと、
前記励起光により前記測定対象領域から発せられた蛍光を受光する少なくとも1つ以上の受光部を備え、各々の前記受光部で受光した蛍光の強度値を示す蛍光信号を出力する検出部と、
を含み、
前記ソフトウェアは、
前記検出部から、前記蛍光信号を取得し、
前記蛍光信号に基づいて、前記対物レンズの焦点を前記測定対象領域に合わせるための、前記対物レンズおよび前記測定対象部材の少なくとも一方の移動量および移動方向を導出し、
導出された前記移動量および前記移動方向に、前記対物レンズおよび前記測定対象部材の少なくとも一方を移動制御する、
焦点調整システム。
10、10A、10B、10C 測定部
12、13、19 焦点調整装置
12A、13A、19A 取得部
12B、13B、19B 導出部
12C、13C、19C 移動制御部
12D、19D 生成部
12E、19E 特定部
12F、19F 算出部
13D 方向導出部
13E 移動量導出部
14、15A、15B 照射部
19G 選択部
20 対物レンズ
22 測定対象部材
22A ガラス部材
22B 測定対象領域
30、35、39 検出部
Claims (13)
- 光軸に対して非対称の形状の励起光を照射する照射部と、
ガラス部材と測定対象領域とを含む測定対象部材に前記励起光を集光する対物レンズと、
前記励起光により前記測定対象領域から発せられた蛍光を受光する少なくとも1つ以上の受光部を備え、各々の前記受光部で受光した蛍光の強度値を示す蛍光信号を出力する検出部と、
前記蛍光信号に基づいて、前記対物レンズおよび前記測定対象部材の少なくとも一方の移動量および移動方向を導出する導出部を備え、導出された前記移動量および前記移動方向に、前記対物レンズおよび前記測定対象部材の少なくとも一方を移動させる移動制御部と、
を備える、顕微鏡システム。 - 前記導出部は、
前記蛍光信号に含まれる前記強度値のプロファイルを生成する生成部と、
前記プロファイルに基づいて、前記蛍光信号における前記強度値の重心位置を特定する特定部と、
目標重心位置を特定し、前記重心位置と前記目標重心位置との差に基づいて、前記移動量および前記移動方向を算出する算出部と、
を有する、
請求項1に記載の顕微鏡システム。 - 前記検出部は、
含まれる前記受光部の露出値が互いに異なる複数種類の単位領域が受光面に沿って配列され、
前記導出部は、
複数種類の前記単位領域の内、特定の露出値の前記受光部を含む前記単位領域を選択する選択部を含み、
前記特定部は、
選択された前記単位領域に含まれる前記受光部の前記強度値を示す前記蛍光信号の前記プロファイルに基づいて、前記重心位置を特定する、
請求項2に記載の顕微鏡システム。 - 前記生成部は、
前記蛍光信号に含まれる蛍光受光領域の前記強度値を用いて、前記プロファイルを生成する、
請求項2に記載の顕微鏡システム。 - 前記照射部は、
発光部から照射された照射光の一部を遮光し、前記励起光として出力する遮光部を有する、
請求項1に記載の顕微鏡システム。 - 前記照射部は、
発光部から照射された照射光を光軸に対して非対称の形状に分離する分離部を有する、
請求項1に記載の顕微鏡システム。 - 前記照射部は、
発光部から照射された照射光の一部を平行にして前記励起光として出力するコリメートレンズを有し、
前記発光部は、
前記発光部の発光位置が前記コリメートレンズの光軸から外れた位置に配置されてなる、
請求項1に記載の顕微鏡システム。 - 前記照射部は、
発光部から照射された照射光に非点収差を発生させた前記励起光を照射する、
請求項1に記載の顕微鏡システム。 - 前記導出部は、
前記蛍光信号に含まれる蛍光受光領域の広がり方向に基づいて、前記移動方向を導出する方向導出部と、
前記蛍光信号を、該蛍光受光領域上を通り且つ該蛍光受光領域の広がり方向に沿った直線を境界として2つの領域に分割し、前記蛍光信号に含まれる前記強度値の合計値に対する、2つの前記領域の各々の前記強度値の合計値の差の比を、前記移動量として導出する移動量導出部と、
を有する、
請求項8に記載の顕微鏡システム。 - 前記導出部は、
前記蛍光信号を、前記対物レンズと前記測定対象部材との距離が近づくときの蛍光受光領域の広がりを示す第1の線状領域の一端部と、該第1の線状領域の他端部と、前記対物レンズと前記測定対象部材との距離が離れるときの前記蛍光受光領域の広がりを示す第2の線状領域の一端部と、該第2の線状領域の他端部と、の各々が互いに異なる領域に配置されるように4つの領域に分割し、
4つの前記領域の内、前記検出部から取得した前記蛍光信号に含まれる前記蛍光受光領域の広がり方向の両端部が位置する2つの前記領域である存在領域に応じて、前記移動方向を導出する方向導出部と、
前記蛍光信号に含まれる前記強度値の合計値に対する、4つの前記領域の内の前記存在領域の前記強度値の合計値から、4つの前記領域の内の前記存在領域以外の他の2つの前記領域の前記強度値の合計値を減算した差分の比を、前記移動量として導出する移動量導出部と、
を有する、
請求項8に記載の顕微鏡システム。 - 前記検出部は、
ゲインおよび電荷蓄積時間の少なくとも一方の異なる複数種類の前記受光部を含むブロック領域を受光面に沿って複数配列してなる、
請求項1に記載の顕微鏡システム。 - 光軸に対して非対称の形状の励起光を照射する照射部と、ガラス部材と測定対象領域とを含む測定対象部材に前記励起光を集光する対物レンズと、前記励起光により前記測定対象領域から発せられた蛍光を受光する少なくとも1つ以上の受光部を備え、各々の前記受光部で受光した蛍光の強度値を示す蛍光信号を出力する検出部と、を備えた測定部から、前記蛍光信号を取得するステップと、
前記蛍光信号に基づいて、前記対物レンズおよび前記測定対象部材の少なくとも一方の移動量および移動方向を導出する導出部を備え、導出された前記移動量および前記移動方向に、前記対物レンズおよび前記測定対象部材の少なくとも一方を移動制御するステップと、
をコンピュータに実行させるための焦点調整プログラム。 - 測定部と、前記測定部の動作の制御に使われるソフトウェアと、を含んで構成される焦点調整システムであって、
前記ソフトウェアは情報処理装置に搭載されており、
前記測定部は、
光軸に対して非対称の形状の励起光を照射する照射部と、
ガラス部材と測定対象領域とを含む測定対象部材に前記励起光を集光する対物レンズと、
前記励起光により前記測定対象領域から発せられた蛍光を受光する少なくとも1つ以上の受光部を備え、各々の前記受光部で受光した蛍光の強度値を示す蛍光信号を出力する検出部と、
を含み、
前記ソフトウェアは、
前記検出部から、前記蛍光信号を取得し、
前記蛍光信号に基づいて、前記対物レンズの焦点を前記測定対象領域に合わせるための、前記対物レンズおよび前記測定対象部材の少なくとも一方の移動量および移動方向を導出し、
導出された前記移動量および前記移動方向に、前記対物レンズおよび前記測定対象部材の少なくとも一方を移動制御する、
焦点調整システム。
Priority Applications (4)
| Application Number | Priority Date | Filing Date | Title |
|---|---|---|---|
| US17/431,122 US12248134B2 (en) | 2019-02-20 | 2020-02-20 | Microscope system, focus adjustment program, and focus adjustment system |
| JP2021502143A JP7414057B2 (ja) | 2019-02-20 | 2020-02-20 | 顕微鏡システム、焦点調整プログラム、および焦点調整システム |
| DE112020000879.7T DE112020000879T5 (de) | 2019-02-20 | 2020-02-20 | Mikroskopsystem, fokuseinstellprogramm und fokuseinstellsystem |
| CN202080013975.1A CN113424092B (zh) | 2019-02-20 | 2020-02-20 | 显微镜系统、焦点调节程序和焦点调节系统 |
Applications Claiming Priority (2)
| Application Number | Priority Date | Filing Date | Title |
|---|---|---|---|
| JP2019028737 | 2019-02-20 | ||
| JP2019-028737 | 2019-02-20 |
Publications (1)
| Publication Number | Publication Date |
|---|---|
| WO2020171173A1 true WO2020171173A1 (ja) | 2020-08-27 |
Family
ID=72143841
Family Applications (1)
| Application Number | Title | Priority Date | Filing Date |
|---|---|---|---|
| PCT/JP2020/006837 Ceased WO2020171173A1 (ja) | 2019-02-20 | 2020-02-20 | 顕微鏡システム、焦点調整プログラム、および焦点調整システム |
Country Status (5)
| Country | Link |
|---|---|
| US (1) | US12248134B2 (ja) |
| JP (1) | JP7414057B2 (ja) |
| CN (1) | CN113424092B (ja) |
| DE (1) | DE112020000879T5 (ja) |
| WO (1) | WO2020171173A1 (ja) |
Cited By (1)
| Publication number | Priority date | Publication date | Assignee | Title |
|---|---|---|---|---|
| WO2023127261A1 (ja) * | 2021-12-30 | 2023-07-06 | 株式会社Zido | オートフォーカス装置 |
Families Citing this family (2)
| Publication number | Priority date | Publication date | Assignee | Title |
|---|---|---|---|---|
| CN113777768A (zh) * | 2021-10-13 | 2021-12-10 | 大连理工大学 | 基于3d打印制造的显微成像及光学传感物联网系统 |
| CN116718578B (zh) * | 2023-08-11 | 2023-10-27 | 深圳赛陆医疗科技有限公司 | 超分辨显微成像系统和成像方法 |
Citations (4)
| Publication number | Priority date | Publication date | Assignee | Title |
|---|---|---|---|---|
| JP2008152011A (ja) * | 2006-12-18 | 2008-07-03 | Lasertec Corp | コンフォーカル顕微鏡、及びコンフォーカル画像の撮像方法 |
| JP2009098437A (ja) * | 2007-10-17 | 2009-05-07 | Nikon Corp | 焦点調節装置及び顕微鏡装置 |
| JP2011175289A (ja) * | 2011-05-09 | 2011-09-08 | Nikon Corp | 顕微鏡、顕微鏡の焦点調節制御方法 |
| JP2015227940A (ja) * | 2014-05-30 | 2015-12-17 | 国立研究開発法人理化学研究所 | 光学顕微鏡システムおよびスクリーニング装置 |
Family Cites Families (5)
| Publication number | Priority date | Publication date | Assignee | Title |
|---|---|---|---|---|
| JPH1047918A (ja) | 1996-08-07 | 1998-02-20 | Nikon Corp | 変位計測装置及び自動合焦機能付き顕微鏡 |
| JP4932162B2 (ja) * | 2005-01-20 | 2012-05-16 | オリンパス株式会社 | 焦点検出装置とそれを用いた蛍光観察装置 |
| JP5226352B2 (ja) * | 2008-03-21 | 2013-07-03 | オリンパス株式会社 | 生体観察装置及び生体観察方法 |
| CN102354046A (zh) * | 2011-07-04 | 2012-02-15 | 上海理工大学 | 一种多路频分复用荧光共焦显微成像技术实现方法 |
| JP7226825B2 (ja) * | 2018-02-14 | 2023-02-21 | 国立研究開発法人理化学研究所 | オートフォーカス装置ならびにそれを備える光学装置および顕微鏡 |
-
2020
- 2020-02-20 WO PCT/JP2020/006837 patent/WO2020171173A1/ja not_active Ceased
- 2020-02-20 DE DE112020000879.7T patent/DE112020000879T5/de active Pending
- 2020-02-20 CN CN202080013975.1A patent/CN113424092B/zh active Active
- 2020-02-20 JP JP2021502143A patent/JP7414057B2/ja active Active
- 2020-02-20 US US17/431,122 patent/US12248134B2/en active Active
Patent Citations (4)
| Publication number | Priority date | Publication date | Assignee | Title |
|---|---|---|---|---|
| JP2008152011A (ja) * | 2006-12-18 | 2008-07-03 | Lasertec Corp | コンフォーカル顕微鏡、及びコンフォーカル画像の撮像方法 |
| JP2009098437A (ja) * | 2007-10-17 | 2009-05-07 | Nikon Corp | 焦点調節装置及び顕微鏡装置 |
| JP2011175289A (ja) * | 2011-05-09 | 2011-09-08 | Nikon Corp | 顕微鏡、顕微鏡の焦点調節制御方法 |
| JP2015227940A (ja) * | 2014-05-30 | 2015-12-17 | 国立研究開発法人理化学研究所 | 光学顕微鏡システムおよびスクリーニング装置 |
Cited By (1)
| Publication number | Priority date | Publication date | Assignee | Title |
|---|---|---|---|---|
| WO2023127261A1 (ja) * | 2021-12-30 | 2023-07-06 | 株式会社Zido | オートフォーカス装置 |
Also Published As
| Publication number | Publication date |
|---|---|
| JP7414057B2 (ja) | 2024-01-16 |
| US20220146805A1 (en) | 2022-05-12 |
| CN113424092B (zh) | 2024-08-13 |
| CN113424092A (zh) | 2021-09-21 |
| DE112020000879T5 (de) | 2021-11-11 |
| JPWO2020171173A1 (ja) | 2021-12-23 |
| US12248134B2 (en) | 2025-03-11 |
Similar Documents
| Publication | Publication Date | Title |
|---|---|---|
| US8179432B2 (en) | Predictive autofocusing | |
| US9832365B2 (en) | Autofocus based on differential measurements | |
| CN112461760B (zh) | 用于使用光源配置来进行改进的聚焦跟踪的系统和方法 | |
| US9383563B2 (en) | Confocal image generation apparatus | |
| US10365468B2 (en) | Autofocus imaging | |
| JP5469133B2 (ja) | 顕微鏡システム | |
| JP7414057B2 (ja) | 顕微鏡システム、焦点調整プログラム、および焦点調整システム | |
| WO2016121685A1 (ja) | レーザーダイシング装置 | |
| JP7679826B2 (ja) | 顕微鏡システム、撮像方法、および撮像装置 | |
| KR101505745B1 (ko) | 이중 검출 반사 공초점 현미경 및 이를 사용하는 시편의 높이의 정보를 검출하는 방법 | |
| WO2022269961A1 (ja) | 顕微鏡システム、情報処理装置及び制御方法 | |
| JP2011521269A (ja) | 光学照光装置及び方法 | |
| JPH11337812A (ja) | オートフォーカス装置 | |
| JP2006242726A (ja) | 蛍光検出装置 | |
| JP2003042720A (ja) | 高さ測定装置 | |
| WO2021193325A1 (ja) | 顕微鏡システム、撮像方法、および撮像装置 | |
| JPH0519172A (ja) | レーザ走査顕微鏡 | |
| JP2007292590A (ja) | 共焦点光学系およびそれを用いた高さ測定装置 | |
| JPH0843717A (ja) | 焦点検出装置 | |
| JP3746703B2 (ja) | 焦点検出装置及びそれを備えた光学顕微鏡又は光学検査装置 | |
| HK1259689B (zh) | 使用阻擋結構來進行改進的聚焦跟踪的系統和方法 |
Legal Events
| Date | Code | Title | Description |
|---|---|---|---|
| 121 | Ep: the epo has been informed by wipo that ep was designated in this application |
Ref document number: 20760287 Country of ref document: EP Kind code of ref document: A1 |
|
| ENP | Entry into the national phase |
Ref document number: 2021502143 Country of ref document: JP Kind code of ref document: A |
|
| 122 | Ep: pct application non-entry in european phase |
Ref document number: 20760287 Country of ref document: EP Kind code of ref document: A1 |
|
| WWG | Wipo information: grant in national office |
Ref document number: 17431122 Country of ref document: US |