WO2020174863A1 - 診断支援プログラム、診断支援システム及び診断支援方法 - Google Patents
診断支援プログラム、診断支援システム及び診断支援方法 Download PDFInfo
- Publication number
- WO2020174863A1 WO2020174863A1 PCT/JP2019/050880 JP2019050880W WO2020174863A1 WO 2020174863 A1 WO2020174863 A1 WO 2020174863A1 JP 2019050880 W JP2019050880 W JP 2019050880W WO 2020174863 A1 WO2020174863 A1 WO 2020174863A1
- Authority
- WO
- WIPO (PCT)
- Prior art keywords
- information
- pathological image
- image
- diagnosis
- diagnostic
- Prior art date
- Legal status (The legal status is an assumption and is not a legal conclusion. Google has not performed a legal analysis and makes no representation as to the accuracy of the status listed.)
- Ceased
Links
Images










Classifications
-
- G—PHYSICS
- G16—INFORMATION AND COMMUNICATION TECHNOLOGY [ICT] SPECIALLY ADAPTED FOR SPECIFIC APPLICATION FIELDS
- G16H—HEALTHCARE INFORMATICS, i.e. INFORMATION AND COMMUNICATION TECHNOLOGY [ICT] SPECIALLY ADAPTED FOR THE HANDLING OR PROCESSING OF MEDICAL OR HEALTHCARE DATA
- G16H50/00—ICT specially adapted for medical diagnosis, medical simulation or medical data mining; ICT specially adapted for detecting, monitoring or modelling epidemics or pandemics
- G16H50/30—ICT specially adapted for medical diagnosis, medical simulation or medical data mining; ICT specially adapted for detecting, monitoring or modelling epidemics or pandemics for calculating health indices; for individual health risk assessment
-
- G—PHYSICS
- G16—INFORMATION AND COMMUNICATION TECHNOLOGY [ICT] SPECIALLY ADAPTED FOR SPECIFIC APPLICATION FIELDS
- G16H—HEALTHCARE INFORMATICS, i.e. INFORMATION AND COMMUNICATION TECHNOLOGY [ICT] SPECIALLY ADAPTED FOR THE HANDLING OR PROCESSING OF MEDICAL OR HEALTHCARE DATA
- G16H30/00—ICT specially adapted for the handling or processing of medical images
- G16H30/40—ICT specially adapted for the handling or processing of medical images for processing medical images, e.g. editing
-
- G—PHYSICS
- G02—OPTICS
- G02B—OPTICAL ELEMENTS, SYSTEMS OR APPARATUS
- G02B21/00—Microscopes
- G02B21/36—Microscopes arranged for photographic purposes or projection purposes or digital imaging or video purposes including associated control and data processing arrangements
- G02B21/368—Microscopes arranged for photographic purposes or projection purposes or digital imaging or video purposes including associated control and data processing arrangements details of associated display arrangements, e.g. mounting of LCD monitor
-
- G—PHYSICS
- G06—COMPUTING OR CALCULATING; COUNTING
- G06T—IMAGE DATA PROCESSING OR GENERATION, IN GENERAL
- G06T7/00—Image analysis
- G06T7/0002—Inspection of images, e.g. flaw detection
- G06T7/0012—Biomedical image inspection
-
- G—PHYSICS
- G06—COMPUTING OR CALCULATING; COUNTING
- G06T—IMAGE DATA PROCESSING OR GENERATION, IN GENERAL
- G06T7/00—Image analysis
- G06T7/10—Segmentation; Edge detection
- G06T7/11—Region-based segmentation
-
- G—PHYSICS
- G16—INFORMATION AND COMMUNICATION TECHNOLOGY [ICT] SPECIALLY ADAPTED FOR SPECIFIC APPLICATION FIELDS
- G16H—HEALTHCARE INFORMATICS, i.e. INFORMATION AND COMMUNICATION TECHNOLOGY [ICT] SPECIALLY ADAPTED FOR THE HANDLING OR PROCESSING OF MEDICAL OR HEALTHCARE DATA
- G16H50/00—ICT specially adapted for medical diagnosis, medical simulation or medical data mining; ICT specially adapted for detecting, monitoring or modelling epidemics or pandemics
- G16H50/20—ICT specially adapted for medical diagnosis, medical simulation or medical data mining; ICT specially adapted for detecting, monitoring or modelling epidemics or pandemics for computer-aided diagnosis, e.g. based on medical expert systems
-
- G—PHYSICS
- G06—COMPUTING OR CALCULATING; COUNTING
- G06T—IMAGE DATA PROCESSING OR GENERATION, IN GENERAL
- G06T2207/00—Indexing scheme for image analysis or image enhancement
- G06T2207/10—Image acquisition modality
- G06T2207/10056—Microscopic image
-
- G—PHYSICS
- G06—COMPUTING OR CALCULATING; COUNTING
- G06T—IMAGE DATA PROCESSING OR GENERATION, IN GENERAL
- G06T2207/00—Indexing scheme for image analysis or image enhancement
- G06T2207/20—Special algorithmic details
- G06T2207/20081—Training; Learning
-
- G—PHYSICS
- G06—COMPUTING OR CALCULATING; COUNTING
- G06T—IMAGE DATA PROCESSING OR GENERATION, IN GENERAL
- G06T2207/00—Indexing scheme for image analysis or image enhancement
- G06T2207/30—Subject of image; Context of image processing
- G06T2207/30004—Biomedical image processing
- G06T2207/30024—Cell structures in vitro; Tissue sections in vitro
-
- G—PHYSICS
- G06—COMPUTING OR CALCULATING; COUNTING
- G06T—IMAGE DATA PROCESSING OR GENERATION, IN GENERAL
- G06T2207/00—Indexing scheme for image analysis or image enhancement
- G06T2207/30—Subject of image; Context of image processing
- G06T2207/30004—Biomedical image processing
- G06T2207/30096—Tumor; Lesion
Definitions
- the present disclosure relates to a diagnosis support program, a diagnosis support system, and a diagnosis support method.
- Non-Patent Document 1 discloses a technique of displaying an attention area by learning HE (hematoxylin and eosin. general tissue staining) image data to which an annotation is added. It is considered that this technique can improve the accuracy of diagnosis.
- HE hematoxylin and eosin. general tissue staining
- the present disclosure has been made in view of the above, and proposes a diagnosis support program, a diagnosis support system, and a diagnosis support method that can improve the accuracy of diagnosis.
- a diagnosis support program is a first pathological image corresponding to a first diseased tissue, and history information regarding a browsing history for the first pathological image, Derivation of deriving diagnosis support information for assisting diagnosis of the second pathological image corresponding to the second diseased tissue to be diagnosed based on the diagnosis information for the first diseased tissue corresponding to the first pathological image Let the computer perform the procedure.
- FIG. 1 is a diagram showing a diagnosis support system 1 according to the first embodiment.
- the diagnosis support system 1 includes a pathology system 10, a pathology system 20, a medical information system 30, and a derivation device 100.
- the pathology system 10 is a system mainly used by pathologists, and is applied to, for example, a laboratory or a hospital. As shown in FIG. 1, the pathological system 10 includes a microscope 11, a server 12, a display control device 13, and a display device 14.
- the microscope 11 has an optical microscope function and is an imaging device that images an observation target object contained in a glass slide and acquires a pathological image (an example of a medical image) that is a digital image.
- the observation target is, for example, a tissue or cell collected from a patient, and is a piece of organ meat, saliva, blood, or the like.
- the server 12 is a device that stores and saves a pathological image captured by the microscope 11 in a storage unit (not shown).
- the server 12 searches the storage unit (not shown) for a pathological image and sends the searched pathological image to the display control device 13.
- the display control device 13 sends to the server 12 a request for browsing the pathological image received from the user. Then, the display control device 13 controls the display device 14 to display the pathological image received from the server 12.
- the display device 14 has a screen using, for example, liquid crystal, EL (Electro-Luminescence), CRT (Cathode Ray Tube), or the like.
- the display device 14 may support 4K or 8K, or may be formed by a plurality of display devices.
- the display device 14 displays the pathological image controlled to be displayed by the display control device 13. It should be noted that, although details will be described later, the server 12 stores browsing history information regarding a region of a pathological image observed by a pathologist via the display device 14.
- the pathology system 20 is a system applied to a hospital different from the pathology system 10.
- the pathological system 20 includes a microscope 21, a server 22, a display control device 23, and a display device 24. Since each unit included in the pathological diagnosis system 20 is similar to that of the pathological system 10, description thereof will be omitted.
- the medical information system 30 is a system that stores information related to patient diagnosis. For example, when it is difficult to diagnose a medical condition only by the endoscopic examination in a predetermined hospital, a biopsy may be performed to make a definitive diagnosis by pathological diagnosis. A tissue specimen made from a tissue collected from a patient is imaged by the microscope 11 of the pathological system 10, and a pathological image obtained by the imaging is stored in the server 12. A pathological image is displayed on the display device 14 by the display control device 13, and a pathologist using the pathological system 10 makes a pathological diagnosis. The doctor makes a definite diagnosis based on the pathological diagnosis result, and the definite diagnosis result is stored in the medical information system 30. The medical information system 30 stores information for identifying a patient, disease information of the patient, examination information and image information used for diagnosis, diagnosis results, information regarding diagnosis such as prescription drugs. The medical information system 30 is called an electronic medical record system or the like.
- the accuracy of pathological diagnosis varies depending on the pathologist.
- the diagnosis result by the pathological image may differ depending on the pathologist depending on the number of years of experience and the specialty of the pathologist.
- a technique for deriving diagnosis support information which is information for supporting diagnosis using machine learning.
- a technique of estimating a region of interest in a new pathological image by preparing a plurality of pathological images in which a region of interest in the pathological image is annotated and analyzing the plurality of pathological images. Is proposed. With this, the region of interest in the pathological image can be provided to the pathologist, and thus the diagnosis by the pathologist can be supported.
- the derivation device 100 of the diagnosis support system 1 derives the diagnosis support information by using the browsing history information regarding the area of the pathological image browsed by the pathologist during the pathological diagnosis. Specifically, the derivation device 100 is based on the first pathological image corresponding to the first affected tissue, the browsing history information regarding the browsing of the first pathological image by the pathologist, and the diagnostic information about the affected tissue. , And derives diagnosis support information regarding browsing that supports diagnosis of the second pathological image corresponding to the second diseased tissue different from the first diseased tissue.
- the derivation device 100 derives, as the diagnosis support information, a region of the first pathological image for which the diagnosis result is positive, which is of interest to the pathologist.
- the server 12 of the pathological system 10 accumulates information regarding diagnosis by a pathologist every day. That is, the server 12 stores the first pathological image which is the pathological image corresponding to the first affected tissue and the browsing history information regarding the browsing history of the pathologist for the first pathological image.
- the derivation device 100 provides the pathological system 20 with diagnosis support information.
- the derivation device 100 acquires, from the server 12 of the pathological system 10, the first pathological image accumulated every day and the browsing history information for the first pathological image. Further, the derivation device 100 acquires the diagnostic information regarding the diagnostic result corresponding to the first pathological image from the medical information system 30. The deriving apparatus 100 learns the first pathological image, the browsing history information, and the diagnostic information in association with each other, thereby learning the second pathological image corresponding to the second diseased tissue different from the first diseased tissue. A learning model for estimating the region of interest is generated.
- the derivation device 100 may include an enlarged region displayed by a pathologist, a region viewed by a pathologist for a long time, or a region in the first pathological image having a positive diagnosis result.
- a learning model for estimating an area of the second pathological image similar to an area that the pathologist repeatedly viewed many times as an attention area is generated.
- the microscope 21 has generated the second pathological image corresponding to the second affected tissue.
- the display control device 23 receives a display request for the second pathological image from a user such as a doctor or a pathologist, the display control device 23 sends the second pathological image to the derivation device 100.
- the derivation device 100 uses the learning model to derive the diagnostic assistance information indicating the attention area of the second pathological image from the second pathological image, and outputs the derived diagnostic assistance information to the display control device 23.
- the display control device 23 controls the display device 24 to display the attention area based on the diagnosis support information together with the second pathological image.
- the derivation device 100 derives information regarding the attention area as diagnosis support information based on the browsing history information regarding the browsing of the pathological image, which is the action that the pathologist must perform at the time of pathological diagnosis. That is, since the derivation device 100 uses the browsing history information of the pathologist accumulated every day, the attention area can be estimated without requiring a lot of time and an operator. Then, the derivation device 100 can improve the accuracy of diagnosis by the pathologist by displaying the attention area on the display device 24. For example, although there are cases where the diagnosis varies depending on the pathologist, by displaying the attention area on the pathological image, any pathologist can carefully observe the attention area and make a diagnosis. Variation can be reduced.
- the derivation device 100 since the derivation device 100 performs learning using the diagnostic information, it is possible to derive the attention area as the diagnostic support information when the diagnostic result is positive. Therefore, the derivation device 100 can provide a region that has an influence on the diagnosis, and thus the accuracy of the diagnosis can be improved.
- the worker may refer to the diagnosis support information derived by the derivation device 100 to perform an annotation work.
- a pathological image with an annotation can be efficiently generated, and thus machine learning can be performed based on a large amount of learning data.
- the derivation device 100 converts the pathological image stored in the server 22 of the pathological system 20.
- a learning model may be generated as learning data, or a learning model may be generated using both the pathological image stored in the server 12 and the pathological image stored in the server 22 as learning data. That is, the derivation device 100 can use as the learning data any pathological image that has been browsed in the past.
- leading-out apparatus 100 showed the example which provides the display control apparatus 23 with diagnostic assistance information above, the derivation
- the pathological system 10 and the pathological system 20 are described separately, but the pathological system 10 and the pathological system 20 may be the same system.
- the diagnosis support system 1 may include only the pathology system 10.
- the derivation device 100 generates a learning model from the first pathological image stored in the server 12 and provides the display control device 13 with the diagnosis support information in response to a request from the display control device 13.
- the diagnosis support system 1 may include three or more pathological systems.
- the derivation device 100 may collect the pathological images accumulated in each pathological system to generate the learning model.
- the medical information system 30 may be the same system as the pathological system 10 or 20. That is, the diagnostic information may be stored in the server 12 or 22.
- diagnosis support system 1 has been briefly explained.
- the configuration and processing of each device will be described in detail, but various information (data structure of pathological image, browsing history information of pathological image, diagnostic information) on which these descriptions are based will be described first.
- the derivation device 100 performs learning by using the learning data accumulated in the pathological system 10 and provides the pathological system 20 with diagnosis support information will be described.
- the pathological image is generated by the observation object being imaged by the microscope 11 or the microscope 21.
- the imaging processing by the microscope 11 and the microscope 21 will be described with reference to FIGS. 2 and 3.
- 2 and 3 are diagrams for explaining the image capturing process according to the first embodiment. Since the microscope 11 and the microscope 21 perform the same imaging processing, the microscope 11 will be described as an example here.
- the microscope 11 described below has a low-resolution imaging unit for imaging at low resolution and a high-resolution imaging unit for imaging at high resolution.
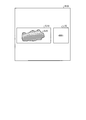
- a glass slide G10 in which an observation object A10 is housed is included in an imaging region R10 that is a region where the microscope 11 can photograph.
- the glass slide G10 is placed on, for example, a stage (not shown).
- the microscope 11 captures an image of the imaging region R10 by the low-resolution imaging unit to generate a whole image that is a pathological image of the observation target A10 as a whole.
- the label information L10 shown in FIG. 2 describes identification information (for example, a character string or a QR code (registered trademark)) for identifying the observation target A10. By associating the identification information described in the label information L10 with the patient, the patient corresponding to the entire image can be specified. In the example of FIG. 2, “#001” is described as the identification information.
- the label information L10 may include, for example, a brief description of the observation object A10.
- the microscope 11 specifies the area where the observation object A10 exists from the entire image after generating the entire image, and divides the area where the observation object A10 exists into a predetermined size into high resolution areas.
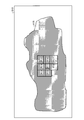
- the imaging unit sequentially captures images. For example, as shown in FIG. 3, the microscope 11 first images the region R11 and generates a high resolution image I11 which is an image showing a partial region of the observation object A10. Subsequently, the microscope 11 moves the stage to capture an image of the region R12 with the high-resolution image capturing unit, and generates a high-resolution image I12 corresponding to the region R12. Similarly, the microscope 11 generates high resolution images I13, I14,... Corresponding to the regions R13, R14,. Although only the region R18 is illustrated in FIG. 3, the microscope 11 sequentially images the divided regions corresponding to the observation object A10 by the high-resolution imaging unit by sequentially moving the stage, and corresponds to each divided region. Generate a high resolution image.
- the glass slide G10 may move on the stage when the stage is moved. If the glass slide G10 moves, there is a possibility that an unphotographed region of the observation object A10 may occur. As shown in FIG. 3, the microscope 11 picks up an image by the high-resolution image pickup unit so that adjacent divided areas partially overlap each other, so that even when the glass slide G10 moves, an unphotographed area is generated. Can be prevented.
- the low-resolution imaging unit and the high-resolution imaging unit described above may be different optical systems or the same optical system.
- the microscope 11 changes the resolution according to the imaging target.
- the imaging area may be changed by moving the optical system (such as the high-resolution imaging unit) by the microscope 11.
- FIG. 3 shows an example in which the microscope 11 images from the central portion of the observation object A10.
- the microscope 11 may image the observation object A10 in an order different from the imaging order shown in FIG.
- the microscope 11 may capture an image from the outer peripheral portion of the observation object A10.
- the microscope 11 divides the entire image capturing region R10 or the glass slide G10 shown in FIG. May be.
- FIG. 4 is a diagram for explaining a partial image (tile image) generation process.
- FIG. 4 shows a high resolution image I11 corresponding to the region R11 shown in FIG.
- the server 12 generates a partial image from a high resolution image.
- the partial image may be generated by a device other than the server 12 (for example, an information processing device mounted inside the microscope 11).
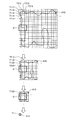
- the server 12 divides one high resolution image I11 to generate 100 tile images T11, T12,.... For example, when the resolution of the high-resolution image I11 is 2560 ⁇ 2560 [pixels: pixels], the server 12 determines, from the high-resolution image I11, 100 tile images T11 having a resolution of 256 ⁇ 256 [pixels]. .. are generated. Similarly, the server 12 generates a tile image by dividing other high resolution images into the same size.
- the regions R111, R112, R113, and R114 are regions that overlap with other adjacent high-resolution images (not shown in FIG. 4).
- the server 12 performs stitching processing on high-resolution images adjacent to each other by aligning overlapping areas by a technique such as template matching.
- the server 12 may generate the tile image by dividing the high resolution image after the stitching process.
- the server 12 generates tile images of areas other than the areas R111, R112, R113, and R114 before the stitching processing, and generates tile images of areas R111, R112, R113, and R114 after the stitching processing. Good.
- the server 12 generates the tile image that is the minimum unit of the captured image of the observation object A10. Then, the server 12 sequentially synthesizes tile images of the minimum unit to generate tile images of different layers. Specifically, the server 12 synthesizes a predetermined number of tile images adjacent to each other to generate one tile image. This point will be described with reference to FIGS. 5 and 6. 5 and 6 are diagrams for explaining the pathological image according to the first embodiment.
- the tile image group of the minimum unit generated from each high resolution image by the server 12 is shown.
- the server 12 generates one tile image T110 by combining four tile images T111, T112, T211 and T212 that are adjacent to each other among the tile images. For example, if the tile images T111, T112, T211 and T212 each have a resolution of 256 ⁇ 256, the server 12 generates the tile image T110 having a resolution of 256 ⁇ 256.
- the server 12 generates a tile image T120 by combining four tile images T113, T114, T213, and T214 that are adjacent to each other. In this way, the server 12 generates a tile image in which a predetermined number of tile images of the minimum unit are combined.
- the server 12 generates a tile image in which tile images adjacent to each other are further combined among the tile images after the tile image of the minimum unit is combined.
- the server 12 generates one tile image T100 by combining four tile images T110, T120, T210, and T220 that are adjacent to each other.
- the server 12 uses an average of 4 pixels, a weighting filter (a process of reflecting closer pixels more strongly than distant pixels), or 1/2 thinning from an image with a resolution of 512 ⁇ 512, which is a combination of four tile images adjacent to each other. By performing processing and the like, a tile image having a resolution of 256 ⁇ 256 is generated.
- the server 12 finally generates one tile image having the same resolution as the resolution of the tile image of the minimum unit by repeating such a combining process. For example, when the resolution of the tile image of the minimum unit is 256 ⁇ 256 as in the above example, the server 12 repeats the above-described combining process to finally obtain one tile image whose resolution is 256 ⁇ 256. Generate T1.
- FIG. 6 schematically shows the tile image shown in FIG.
- the tile image group in the lowermost layer is the tile image of the minimum unit generated by the server 12.
- the tile image group in the second layer from the bottom is a tile image after the tile image group in the lowest layer is combined.
- the uppermost tile image T1 is one tile image that is finally generated.
- the server 12 generates a tile image group having a hierarchy like the pyramid structure shown in FIG. 6 as a pathological image.
- the area D shown in FIG. 5 shows an example of an area displayed on the display screen of the display device 14 or 24.
- the display device can display three vertical tile images and four horizontal tile images.
- the level of detail of the observation target object A10 displayed on the display device changes depending on the layer to which the tile image to be displayed belongs. For example, when the lowermost tile image is used, a narrow area of the observation object A10 is displayed in detail. In addition, the wider the tile image in the upper layer is used, the coarser the area of the observation object A10 is displayed.
- the server 12 stores the tile image of each layer as shown in FIG. 6 in a storage unit (not shown).
- the server 12 stores each tile image together with tile identification information (an example of partial image information) capable of uniquely identifying each tile image.
- tile identification information an example of partial image information
- the server 12 may store each tile image together with layer identification information for identifying each layer and tile identification information that can be uniquely identified within the same layer.
- the server 12 when the server 12 receives a tile image acquisition request including the layer identification information and the tile identification information from another device, the server 12 corresponds to the tile identification information among the tile images belonging to the layer corresponding to the layer identification information.
- the tile image to be transmitted is transmitted to another device.
- the server 12 may store the tile image of each layer as shown in FIG. 6 in a storage device other than the server 12.
- the server 12 may store the tile image of each layer in a cloud server or the like.
- the tile image generation process shown in FIGS. 5 and 6 may be executed by a cloud server or the like.
- the server 12 does not have to store tile images of all layers.
- the server 12 may store only the tile image at the bottom layer, may store only the tile image at the bottom layer and the tile image at the top layer, and may store a predetermined layer (for example, an odd layer). , Even numbered tile images) may be stored.
- the server 12 dynamically combines the stored tile images to generate a tile requested by another device. Generate an image. In this way, the server 12 can prevent the storage capacity from being pressured by thinning out the tile images to be saved.
- the server 12 may store tile images of each layer as shown in FIG. 6 for each imaging condition.
- An example of the imaging condition is the focal length of the subject (observation target A10 or the like).
- the microscope 11 may image the same subject while changing the focal length.
- the server 12 may store the tile image of each layer as shown in FIG. 6 for each focal length.
- the reason for changing the focal length is that it is semi-transparent depending on the observation target A10, so that the focal length suitable for imaging the surface of the observation target A10 and the inside of the observation target A10 are imaged. This is because there is a suitable focal length.
- the microscope 11 can generate a pathological image of the surface of the observation target A10 and a pathological image of the inside of the observation target A10 by changing the focal length.
- the imaging condition there is a staining condition for the observation target A10. More specifically, in pathological diagnosis, a specific part (for example, cell nucleus) of the observation object A10 may be stained with a luminescent material.
- the luminescent material is, for example, a substance that emits light when irradiated with light having a specific wavelength. Then, different luminescent materials may be dyed with respect to the same observation object A10.
- the server 12 may store the tile image of each layer as shown in FIG. 6 for each dyed illuminant.
- the number and resolution of tile images described above are examples, and can be appropriately changed depending on the system.
- the number of tile images combined by the server 12 is not limited to four.
- the tile image has a resolution of 256 ⁇ 256, but the tile image may have a resolution other than 256 ⁇ 256.
- the display control device 13 uses software that adopts a system that is compatible with the tile image group having the hierarchical structure described above, and selects a desired tile image group from the hierarchical structure according to an input operation via the display control device 13 by the user.
- the tile image is extracted and output to the display device 14.
- the display device 14 displays an image of an arbitrary portion selected by the user, out of images of arbitrary resolution selected by the user.
- the display control device 13 functions as a virtual microscope.
- the virtual observation magnification here actually corresponds to the resolution.
- FIG. 7 is a diagram showing an example of a browsing mode of a pathological image by a viewer.
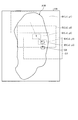
- a viewer such as a pathologist browses the pathological image I10 in the order of regions D1, D2, D3,..., D7.
- the display control device 13 first acquires the pathological image corresponding to the region D1 from the server 12 according to the browsing operation by the browser.
- the server 12 acquires from the storage unit one or more tile images forming the pathological image corresponding to the area D1, and sends the acquired one or more tile images to the display control device 13.
- the display control device 13 displays on the display device 14 a pathological image formed from one or more tile images acquired from the server 12. For example, when there are a plurality of tile images, the display control device 13 displays the plurality of tile images side by side.
- the display control device 13 outputs a pathological image corresponding to the display target area (areas D2, D3,..., D7, etc.) from the server 12 every time the viewer performs a display area changing operation. It is acquired and displayed on the display device 14.
- the viewer first browses a relatively wide area D1 and there is no area to carefully observe in the area D1, so the browsing area is moved to the area D2. Then, the viewer views a region D3 by enlarging a part of the region D2 because there is a region in the region D2 that he wants to observe carefully. Then, the viewer is further moving to the area D4 which is a partial area of the area D2. Then, the viewer views a region D5 by enlarging a part of the region D4 because there is a region in the region D4 that he wants to observe more carefully. In this way, the viewer also browses the areas D6 and D7.
- the pathological images corresponding to the regions D1, D2, and D7 are display images at 1.25 magnifications
- the pathological images corresponding to the regions D3 and D4 are display images at 20 magnifications
- the pathological images corresponding to the regions D5 and D6 are display images at 1.25 magnifications
- the image is a display image with a magnification of 40.
- the display control device 13 acquires and displays the tile image of the hierarchy corresponding to each magnification from the tile image group of the hierarchical structure stored in the server 12.
- the layer of the tile image corresponding to the areas D1 and D2 is higher than the layer of the tile image corresponding to the area D3 (that is, the layer close to the tile image T1 shown in FIG. 6).
- the display control device 13 acquires the browsing information at a predetermined sampling cycle. Specifically, the display control device 13 acquires the central coordinates and the display magnification of the browsed pathological image at every predetermined timing, and stores the acquired browse information in the storage unit of the server 12.
- FIG. 8 is a diagram illustrating an example of the browsing history storage unit 12a included in the server 12.
- the browsing history storage unit 12a stores information such as “sampling”, “center coordinates”, “magnification”, and “time”. “Sampling” indicates the order of timing of storing browsing information.
- the “center coordinates” indicate the position information of the browsed pathological image. In this example, the center coordinates are coordinates indicated by the center position of the browsed pathological image, and correspond to the coordinates of the coordinate system of the tile image group in the lowermost layer.
- the "magnification” indicates the display magnification of the browsed pathological image.
- “Time” indicates the elapsed time from the start of browsing. The example of FIG.
- the display control device 13 stores the browsing information in the browsing history storage unit 12a every 30 seconds.
- the sampling period is not limited to this example, and may be, for example, 0.1 to 10 seconds, or may be outside this range.
- sampling “1” indicates the browsing information of the area D1 shown in FIG. 7
- sampling “2” indicates the browsing information of the area D2
- sampling “3” and “4” indicate the browsing information of the area D3.
- the sampling "5" indicates the browsing information of the area D4
- the samplings "6", "7", and “8” indicate the browsing information of the area D5. That is, in the example of FIG. 8, the area D1 is viewed for about 30 seconds, the area D2 is viewed for about 30 seconds, the area D3 is viewed for about 60 seconds, the area D4 is viewed for about 30 seconds, and the area D5 is about 90 seconds. Indicates that it has been viewed. In this way, the browsing time of each area can be extracted from the browsing history information.
- the number of times each area is browsed can be extracted from the browsing history information. For example, each time a display area changing operation (for example, a display area moving operation or a display size changing operation) is performed, the number of times each pixel of the displayed pathological image is displayed is increased by one. For example, in the example shown in FIG. 7, when the area D1 is first displayed, the number of times of display of each pixel included in the area D1 is one. Next, when the area D2 is displayed, the number of display times of each pixel included in both the area D1 and the area D2 is two, and the number of display times of each pixel included in the area D2 that is not included in the area D1 is It will be once.
- a display area changing operation for example, a display area moving operation or a display size changing operation
- each pixel (each pixel It is possible to extract the number of times that (also referred to as coordinates) is displayed.
- the display control device 13 may interrupt the storage processing of the browsing information when the operation of changing the display position is not performed by the viewer for a predetermined time (for example, 5 minutes). Further, in the above example, the example in which the pathological image browsed by the center coordinate and the magnification is stored as the browsing information is shown, but the present invention is not limited to this example, and the browsing information is information that can specify the region of the browsed pathological image. Any information may be used as long as it is.
- the display control device 13 stores the tile identification information for identifying the tile image corresponding to the browsed pathological image and the information indicating the position of the tile image corresponding to the browsed pathological image as the browse information of the pathological image. May be.
- the browsing history storage unit 12a stores information for identifying a patient, a chart, and the like. That is, the browsing history storage unit 12a shown in FIG. 8 is stored so that the browsing information can be associated with the patient, the chart, and the like.
- FIGS. 9A to 9C are diagrams showing a diagnostic information storage unit included in the medical information system 30.
- 9A to 9C show an example in which diagnostic information is stored in different tables for each organ to be examined.
- FIG. 9A shows an example of a table that stores diagnostic information about breast cancer tests
- FIG. 9B shows an example of a table that stores diagnostic information about lung cancer tests
- FIG. 9C stores diagnostic information about colon tests. An example of a table is shown.
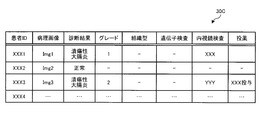
- the diagnostic information storage unit 30A shown in FIG. 9A includes “patient ID”, “pathological image”, “diagnosis result”, “grade”, “tissue type”, “gene test”, “ultrasound test”, “medication”, etc. Store information.
- “Patient ID” indicates identification information for identifying a patient.
- “Pathological image” indicates a pathological image saved by a pathologist at the time of diagnosis.
- the "pathological image” may store position information (center coordinates, magnification, etc.) indicating an image region to be stored, with respect to the entire image, instead of the image itself.
- the "diagnosis result” is a diagnosis result by a pathologist, and indicates the presence or absence of a lesion site and the type of the lesion site, for example.
- “Grade” indicates the degree of progress of the diseased part. “Tissue type” indicates the type of diseased part. “Genetic test” indicates the result of genetic test. “Ultrasonic examination” indicates the result of ultrasonic examination. The medication indicates information regarding medication to the patient.
- the diagnostic information storage unit 30B shown in FIG. 9B stores information about the “CT examination” performed in the lung cancer examination, instead of the “ultrasound examination” stored in the diagnostic information storage unit 30A shown in FIG. 9A.
- the diagnostic information storage unit 30C illustrated in FIG. 9C stores information regarding “endoscopic examination” performed in a large intestine examination instead of the “ultrasound examination” stored in the diagnostic information storage unit 30A illustrated in FIG. 9A. ..
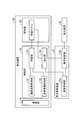
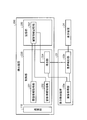
- FIG. 10 is a diagram illustrating an example of the derivation device 100 and the display control device 23 according to the first embodiment.
- the derivation device 100 is a computer including a communication unit 110, a storage unit 120, and a control unit 130.
- the communication unit 110 is realized by, for example, a NIC (Network Interface Card) or the like.
- the communication unit 110 is connected to a network (not shown) by wire or wirelessly, and transmits/receives information to/from the pathological system 10, the pathological system 20, the medical information system 30, and the like via the network.
- the control unit 130 which will be described later, transmits and receives information to and from these devices via the communication unit 110.
- the storage unit 120 is realized by, for example, a semiconductor memory device such as a RAM (Random Access Memory) or a flash memory (Flash Memory), or a storage device such as a hard disk or an optical disk.
- the storage unit 120 stores the learning model 121 generated by the control unit 130.
- the learning model 121 will be described later.
- control unit 130 for example, a program (an example of a diagnostic support program) stored in the derivation device 100 by a CPU (Central Processing Unit) or an MPU (Micro Processing Unit) uses a RAM (random Access Memory) as a work area. It is realized by being executed. Further, the control unit 130 may be executed by an integrated circuit such as an ASIC (Application specific Integrated Circuit) or an FPGA (Field Programmable gate Array).
- ASIC Application specific Integrated Circuit
- FPGA Field Programmable gate Array
- control unit 130 includes a history information acquisition unit 131, a diagnostic information acquisition unit 132, a learning unit 133, and a derivation unit 134, and has functions and actions of information processing described below. Realize or execute.
- the internal configuration of the control unit 130 is not limited to the configuration shown in FIG. 10, and may be another configuration as long as it is a configuration for performing information processing described later.
- the history information acquisition unit 131 acquires information used in the learning process performed by the learning unit 133 via the communication unit 110. Specifically, the history information acquisition unit 131 stores, in the server 12 of the pathology system 10, the first pathological image corresponding to the first affected tissue and the viewing history information regarding the viewing of the first pathological image. And get. In the browsing history information acquired by the history information acquisition unit 131, as in the example shown in FIG. 8, information on an enlarged and browsed area of the first pathological image by the pathologist and the first pathological information by the pathologist. Of the pathological image of the first pathological image, and information about the number of times the pathologist has viewed each area of the first pathological image.
- the diagnostic information acquisition unit 132 acquires information used in the learning process performed by the learning unit 133 via the communication unit 110. Specifically, the diagnostic information acquisition unit 132 acquires diagnostic information for the first affected tissue corresponding to the first pathological image from the medical information system 30.
- the learning unit 133 learns the correspondence between the first pathological image and the browsing history information acquired by the history information acquisition unit 131 and the diagnostic information acquired by the diagnostic information acquisition unit 132. Thereby, the learning unit 133 generates a learning model for estimating the attention area in the second pathological image. Then, the learning unit 133 stores the learning model 121 in the storage unit 120.
- the learning unit 133 generates learning data. Specifically, the learning unit 133 generates a heat map image in which the information about the attention area is reflected in the first pathological image based on the browsing history information acquired by the history information acquisition unit 131. For example, the learning unit 133 associates each pixel of the first pathological image with an index value (hereinafter, referred to as an attention index value) that is as large as the viewer paid attention.
- an attention index value an index value
- the learning unit 133 associates a pixel with a higher display magnification with a higher attention index value.
- the pathological image corresponding to the area D1 is a display image at 1.25 magnification
- the pathological image corresponding to the area D3 is a display image at 20 magnification
- the pathological image to be displayed is a display image with a magnification of 40.
- the learning unit 133 makes the attention index value of each pixel included in the region D3 higher than the attention index value of each pixel included in the region D1.
- the learning unit 133 sets the attention index value of each pixel included in the region D5 higher than the attention index value of each pixel included in the region D3.
- the learning unit 133 associates a pixel with a longer browsing time with a higher attention index value.
- the area D1 is browsed for about 30 seconds
- the area D3 is browsed for about 60 seconds
- the area D5 is browsed for about 90 seconds.
- the learning unit 133 makes the attention index value of each pixel included in the region D3 higher than the attention index value of each pixel included in the region D1.
- the learning unit 133 sets the attention index value of each pixel included in the region D5 higher than the attention index value of each pixel included in the region D3.
- the learning unit 133 associates a pixel with a larger number of browsing times with a higher attention index value.
- the learning unit 133 may associate the attention index value using only one of the enlargement ratio, the browsing time, and the number of browsing times, or may associate the attention index value using two or more pieces of information. Good.
- the learning unit 133 generates a heat map image in which each pixel of each first pathological image acquired by the history information acquisition unit 131 is associated with a target index value.
- the heat map image is, for example, a set of data that is a combination of a pixel of the first pathological image and an attention index value corresponding to the pixel, and can be said to be browsing history information indicated by the attention index value. ..
- the learning unit 133 performs machine learning by using a combination of the first pathological image, the heat map image corresponding to the first pathological image, and the diagnostic information corresponding to the first pathological image as learning data.
- the learning unit 133 uses learning data whose diagnostic result is positive (for example, the diagnostic result of the diagnostic information storage units 30A to 30C is other than “normal”) as a positive example, and the diagnostic result is negative (for example, the diagnostic information storage unit).
- the learning data whose diagnostic result of 30A to 30C is "normal” is learned as a negative example.
- the learning process by the learning unit 133 is a black box, it is conceptually explained, but the learning unit 133 has a positive diagnostic result from each region of the new pathological image (second pathological image).
- a learning model 121 that outputs a higher score (hereinafter referred to as a attention score) is generated for a region having a similar image feature value to a region having a higher attention index value.
- the attention score for each region of the second pathological image output by the learning model 121 can be said to indicate the degree to which a region similar to this region has been noticed by a pathologist in the past.
- the region focused by the pathologist is a region in which the lesion is likely to exist. That is, it can be said that the attention score output by the learning model 121 indicates the probability that a lesion portion exists in the corresponding area.
- the attention score of each region indicates that the probability that cancer tissue exists in each region, that is, the diagnosis is affected. It can also be said to indicate the estimated region.
- the first pathological image having a positive diagnosis result was taken as a positive example, but all the observation objects visualized in the first pathological image are positive even if the diagnosis result is positive.
- the observation object drawn in a partial region of the first pathological image is often a lesion.
- the learning unit 133 takes only positive regions of the first pathological image with a positive diagnosis result and whose attention index value is equal to or greater than the predetermined threshold value TH1, and the attention index value is higher than the predetermined threshold value TH1.
- a small area may be learned as a negative example. Further, the learning unit 133 may learn using only the first pathological image having a positive diagnosis result.
- weak learning can be applied to learning by the learning unit 133, and the following method can also be used.
- WILDCAT Weakly Supervised Learning of Deep ConvNets for Image Classification, Pointwise Localization and Segmentation”, CVPR 2017 (http://webia.lip6.fr/ ⁇ durandt/pdfs/2017_CVPR/Durand_WILDCAT_CVPR_2017.pdf) “Attention-based Deep Multiple Instance Learning”, 2018 (https://arxiv.org/abs/1802.04712)
- the learning method by the learning unit 133 may be based on any algorithm.
- the learning unit 133 uses various learning algorithms such as deep learning, which is a machine learning method using a multilayer neural network (Deep Neural Network), support vector machine, clustering, and reinforcement learning.
- a learning model can be generated.
- the learning unit 133 does not have to perform learning using all the first pathological images.
- the learning unit 133 may perform learning using only the first pathological image that has received particular attention.
- the learning unit 133 may perform learning by using only the first pathological image including the area browsed for a predetermined time or more, or only the first pathological image including the area browsed at a predetermined magnification. May be used for learning, or learning may be performed using only the first pathological image including a region browsed a predetermined number of times or more.
- the learning unit 133 may perform learning using only an area browsed for a predetermined time or more, or may perform learning using only an area browsed at a predetermined magnification. The learning may be performed using only the area browsed more than times.
- the learning unit 133 may perform learning by cutting out only the central region of the first pathological image, assuming that the central region of the first pathological image is the focused region.
- the learning unit 133 generates a heat map image as learning data
- the process of generating the heat map image may be performed by the microscope 11, the server 12, or the like.
- the heat map image may be stored in the server 12.
- the history information acquisition unit 131 acquires the heat map image from the server 12 as the browsing history information.
- the deriving unit 134 acquires the second pathological image from the display control device 23 and applies the learning path to the learning model to generate the second pathological image based on the attention area of the second pathological image estimated from the browsing history information.
- the diagnosis support information which is information related to browsing of the pathological image, is derived. Specifically, the deriving unit 134 sets a region of interest having a higher degree of attention as the display magnification of the first pathological image is higher, or a region of interest having a higher degree of attention as a region where the browsing time of the first pathological image is longer. Alternatively, the diagnosis support information is derived as an attention area having a higher degree of attention as the area in which the number of times of browsing the first pathological image is larger. Then, the derivation unit 134 outputs the diagnosis support information that is the derivation result to the display control device 23.
- the deriving unit 134 receives a request from the display control device 23, together with the second pathological image, to estimate the attention area of the second pathological image.
- the second pathological image is, for example, a pathological image diagnosed by a pathologist.
- the derivation unit 134 uses the learning model 121 stored in the storage unit 120 to estimate the attention area of the second pathological image.
- the learning model 121 outputs the attention score that becomes higher in a region similar to the region noticed by the pathologist in the pathological image for which the diagnosis result is positive. It can be said that such an attention score indicates the degree of importance in pathological diagnosis, that is, the degree of influence on diagnosis.
- the deriving unit 134 specifies the area of the second pathological image whose attention score calculated using the learning model 121 is higher than a predetermined threshold TH2 as the attention area. Then, the derivation unit 134 transmits the diagnosis support information indicating the position information regarding the attention area of the second pathological image to the display control device 23. For example, the derivation unit 134 transmits, as the position information, information regarding the coordinates and the tile image (tile identification information, or a combination of layer identification information and tile identification information) to the display control device 23.
- the display control device 23 is equipped with a pathological image display control program for displaying a pathological image such as the tile image described above.
- the pathological image display control program is downloaded from a server or installed in a general-purpose computer from a storage medium such as a DVD (Digital Versatile Disc), so that the display control device 23 described below is displayed. May be realized. Further, by performing some processing on the server and performing other processing by a client computer such as the display control device 23, the display control device 23 described below can be performed by performing the processing on two or more devices. May be realized. Further, the processing by the display control device 23 described below may be realized by causing the pathological image display control program to operate on the cloud.
- the display control device 23 is a computer that has an image acquisition unit 23a and a display control unit 23b and realizes or executes the functions and actions of information processing described below.
- the internal configuration of the display control device 23 is not limited to the configuration shown in FIG. 10, and may be another configuration as long as it is a configuration for performing information processing described later.
- the image acquisition unit 23a and the display control unit 23b are realized, for example, by the CPU or MPU executing the display control program stored in the display control device 23 using a RAM or the like as a work area. Further, the image acquisition unit 23a and the display control unit 23b may be executed by an integrated circuit such as ASIC or FPGA.
- the image acquisition unit 23a acquires the second pathological image from the server 22 and transmits the acquired second pathological image to the derivation device 100. For example, the image acquisition unit 23a transmits to the derivation device 100 the second pathological image that the pathologist is going to diagnose according to the operation by the pathologist.
- the image acquisition unit 23a and the display control unit 23b may be the same, and the process of transmitting the second pathological image to the derivation device 100 may be performed by the display control unit 23b.
- the display control unit 23b receives the diagnosis support information corresponding to the second pathological image from the derivation device 100. Then, the display control unit 23b controls the display device 24 based on the diagnosis support information so as to display the second pathological image in a state in which the attention area, which is the area estimated to affect the diagnosis, can be visually recognized. .. In the following, displaying the various information such as a pathological image on the display device 24 by controlling the display device 24 by the display control unit 23b will be simply referred to as displaying the various information by the display control unit 23b. There are cases.
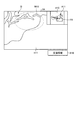
- FIG. 11 is a diagram showing a display example of a pathological image by the display control device 23 according to the first embodiment.
- the display control unit 23b entirely displays the observation object A11 in the entire display area H10, and enlarges and displays a partial area of the observation object A11 in the enlarged display area H11.
- the support information button B10 is displayed.
- the display control unit 23b displays, in the entire display area H10, the pathological image I1 formed from tile images of an arbitrary layer in the tile image group having the layered structure shown in FIG.
- the display control unit 23b displays, in the enlarged display area H11, the pathological image I2 formed from the tile images in the hierarchy lower than the tile image displayed in the entire display area H10.
- the display control unit 23b displays, in the entire display area H10, an enlarged area frame FR indicating the area displayed in the enlarged display area H11.
- a viewer such as a pathologist can change the area of the observation object A11 displayed in the enlarged display area H11 by moving the enlarged area frame FR (such as dragging the mouse).
- the viewer can check a part of the observation object A11 in more detail by viewing the pathological image of the enlarged display area H11 while grasping the entire observation object A11 in the entire display area H10. it can.
- the display control unit 23b selects one of the pathological images I2 displayed in the enlarged display region H11 based on the diagnosis support information received from the derivation device 100 when the viewer selects the support information button B10. ,
- the region of interest is displayed in a visible state.
- the display control unit 231 acquires the diagnosis support information corresponding to the pathological image I2 by transmitting the pathological image I2 displayed in the enlarged display area H11 to the derivation device 100.
- the display control unit 23b displays the frame image RI10 that encloses the outer frame of the region of interest with a dotted line, based on the diagnosis support information acquired from the derivation device 100. Accordingly, the viewer can determine that the region indicated by the frame image RI10 should be observed more carefully in the pathological image displayed in the enlarged display region H11.
- the display control unit 23b may hide the displayed frame image RI10 when the support information button B10 is selected again while the frame image RI10 is displayed. Thereby, the viewer can observe the pathological image to which extra information is not added.
- the display control unit 23b displays the frame image corresponding to the pathological image I1 in the entire display region H10 instead of the enlarged display region H11. It may be displayed.
- the image acquisition unit 23a acquires the diagnosis support information corresponding to the pathological image I1 by transmitting the pathological image I1 to the derivation device 100.
- the viewer can display the region of the pathological image I1 in which the frame image is displayed in the enlarged display region H11, so that all the noticeable regions of the observation object A11 can be carefully observed. it can.
- the display control unit 23b may also display the frame image in both the entire display area H10 and the enlarged display area H11.
- the display control device 23 may acquire the diagnosis support information from the derivation device 100 in real time at the timing when the pathologist views the pathological image, but the pathological image stored in the server 22 is periodically (for example, The diagnosis support information may be acquired in advance by transmitting the diagnosis support information to the derivation device 100 once a day.
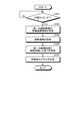
- FIG. 12 is a flowchart showing a learning processing procedure according to the first embodiment.
- the derivation device 100 determines whether it is the learning timing (step S101). For example, when the learning date and time for learning is predetermined, the derivation device 100 determines whether the current date and time is the learning date and time.
- the derivation device 100 acquires the first pathological image and the browsing history information of the first pathological image from the server 12 (step S102). Further, the derivation device 100 acquires the diagnostic information corresponding to the first pathological image acquired from the server 12 from the medical information system 30 (step S103).
- the derivation device 100 learns the relationship between the heat map image and the diagnosis result based on the browsing history information (browsing time, number of browsing times, magnification, etc.) (step S104). As a result, the derivation device 100 generates the learning model 121 (step S105). Then, the derivation device 100 stores the learned learning model 121 in the storage unit 120.
- FIG. 12 shows an example in which the learning model 121 is newly generated
- the derivation device 100 may re-learn the learned learning model 121. In this case, the derivation device 100 will correct the learning model 121 using the new learning data.
- FIG. 13 is a flowchart showing a derivation processing procedure according to the first embodiment. As illustrated in FIG. 13, the derivation device 100 determines whether the second pathological image has been received from the display control device 23 (step S201).
- the derivation device 100 acquires the learned learning model 121 from the storage unit 120 (step S202). Subsequently, the derivation device 100 uses the learning model 121 to derive the diagnosis support information that is the information indicating the region of interest in the second pathological image (step S203). Then, the derivation device 100 transmits the diagnosis support information to the display control device 23 (step S204). As a result, the display control device 23 controls the display device 24 to display the second pathological image together with the diagnosis support information, as in the example shown in FIG.
- FIGS. 14 to 22 are diagrams showing display examples of the pathological image according to the modified example.
- FIG. 11 an example is shown in which information (frame image RI10) indicating one attention area is displayed, but the display control unit 23b, for each threshold of a plurality of attention scores, the attention corresponding to the attention score equal to or more than the threshold. Information indicating the area may be displayed. At this time, the display control unit 23b may change the display mode of the information indicating the attention area for each attention score. Further, FIG. 11 shows an example in which a frame image RI10 surrounded by a dotted line is displayed as the information indicating the attention area. However, the display control unit 23b may display a mask image that semitransparently covers the attention area as the information indicating the attention area. In addition, the display control unit 23b may display the pathological image on which the information indicating the attention area is not superimposed and the pathological image on which the information indicating the attention area is superimposed, side by side.
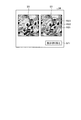
- the display control unit 23b displays the pathological image I21 on the left side of the display screen without superimposing the information indicating the attention area, and superimposes the information indicating the attention area on the right side of the display screen.
- the pathological image I21 is displayed.
- the display control unit 23b displays the mask images RI11, RI12, and RI13 that are semitransparently filled in as the information indicating the attention area. It is assumed that the mask images RI11, RI12, and RI13 have the highest attention score in that order.
- the mask image RI11 is superimposed on a region where the attention score is a threshold TH11 or more
- the mask image RI12 is superimposed on a continuous region where the attention score is a threshold TH12 (>TH11) or more
- the mask image RI13 is noticed.
- the score is overlaid on a continuous region having a threshold value TH13 (>TH12) or more.
- the display control unit 23b may change the saturation, brightness, or transparency of the mask images RI11, RI12, RI13 according to the attention score.
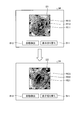
- the display control unit 23b displays the display switching button B11.
- the display control unit 23b may hide the pathological image I21 on which the information indicating the attention area is not superimposed, as shown in the lower part of FIG. ..
- the display control unit 23b when the display switching button B11 is selected in a state where the pathological image I21 on which the information indicating the attention area is not superimposed is hidden, the display control unit 23b, as shown in the upper part of FIG.
- the pathological image I21 on which the information indicating the attention area is not superimposed may be displayed again.
- the display control unit 23b causes the pathological image I21 in which the information indicating the attention area is not superimposed and the pathological image in which the information indicating the attention area is superimposed each time the display switching button B11 is selected. You may switch and display I21.
- the display control unit 23b may display a plurality of frame images for each threshold of the attention score. This point will be described with reference to FIG. In the example illustrated in FIG. 15, the display control unit 23b superimposes and displays the frame images RI21, RI22, and RI23, which are not filled in, on the pathological image I21 as information indicating the attention area. Here, it is assumed that the attention scores are high in the order of the frame images RI21, RI22, and RI23. Similar to the example of FIG. 14, the display control unit 23b may change the saturation, brightness, or transparency of the frame images RI21, RI22, RI23 according to the attention score.
- the display control unit 23b may automatically display the pathological image corresponding to the attention area having a predetermined attention score or higher. For example, the display control unit 23b may automatically display the pathological images in descending order of the attention score. Further, for example, the display control unit 23b may switch the pathological image corresponding to each attention area to the same display area and display it on the display device 24 in accordance with the operation of the viewer.
- the display control unit 23b displays the mask images RI11, RI12, and RI13 by superimposing them on the pathological image I21 and displays the automatic detection button B12, as in the example illustrated in FIG. To do.
- the display control unit 23b automatically and initially displays the pathological image I21 corresponding to a partial area of the entire image as an image including the area having the highest attention score in the entire image.
- the display control unit 23b includes the pathological image I22 including the region having the second highest attention score in the entire image. Switch the display to.
- the display control unit 23b switches the display to the pathological image with the next-highest attention score.
- the display control unit 23b changes the number of frame images or the number of mask images to be displayed according to the operation of the viewer when displaying a plurality of frame images or mask images. You may.
- the display control unit 23b displays the mask images RI11, RI12, and RI13 by superimposing them on the pathological image I21 and displays the display change button B13, as in the example illustrated in FIG. To do.
- the display control unit 23b initially displays the three mask images RI11, RI12, and RI13.
- the display control unit 23b selects the mask image RI13 having the lowest attention score among the mask images RI11, RI12, and RI13, as shown in the middle part of FIG. To hide.
- the display control unit 23b hides the mask image RI12 having the second lowest attention score, as shown in the lower part of FIG. Only RI11 is displayed. Then, when the display change button B13 is further selected, the display control unit 23b redisplays all the mask images RI11, RI12, and RI13 as shown in the upper part of FIG. Note that the display control unit 23b hides the mask image RI11 and hides all the mask images RI11, RI12, and RI13 when the display change button B13 is selected in the lower state of FIG. Good.
- the display control unit 23b may simultaneously display the information indicating the attention area in a plurality of areas of different pathological images. This point will be described with reference to FIG. In the example shown in FIG. 18, the display control unit 23b displays the pathological image I1 in which the observation object A10 is entirely depicted, and displays the frame images RI21 to RI25 in a superimposed manner on the pathological image I1. Since the frame images RI21 to RI25 indicate the region of interest of the pathological image I1, the viewer can observe the region corresponding to the frame images RI21 to RI25 in detail while sequentially enlarging it.
- the display control unit 23b may display a frame image or a mask image indicating a non-attention area in the example of FIG.
- the display control unit 23b displays a frame image or the like indicating a non-attention area in an area where the attention score output by the learning model 121 is lower than a predetermined threshold TH3. This point will be described with reference to FIG.
- the display control unit 23b displays the pathological image I1 on which the observation object A10 is entirely drawn, displays the frame images RI21 to RI23 indicating the attention area, and further, the non-attention area.
- the frame images RI31 and RI32 indicating the are displayed.
- the display control device 23 can specify the non-attention region by acquiring the attention score corresponding to each region of the pathological image I1 as the diagnosis support information from the derivation device 100.
- the display control unit 23b may display the pathological images corresponding to the plurality of attention areas side by side. This point will be described with reference to FIG. As shown in FIG. 20, the display control unit 23b displays a screen including an entire display area H10 and an enlarged display area H11. In the example of FIG. 20, the display control unit 23b displays the pathological image I1 and the frame images RI21 to RI25 shown in FIG. 18 in the entire display area H10. Then, the display control unit 23b displays the pathological images corresponding to the frame images RI21 to RI25 side by side in the enlarged display area H11. In the example of FIG.
- the display control unit 23b corresponds to the pathological image I41 corresponding to the frame image RI21, the pathological image I42 corresponding to the frame image RI22, the pathological image I43 corresponding to the frame image RI23, and the frame image RI24.
- the pathological image I44 and the pathological image I45 corresponding to the frame image RI25 are displayed.
- the display control unit 23b may display the pathological images I41 to I45 in descending order of the attention score.
- the display control unit 23b may selectably display a plurality of pathological images corresponding to the attention area in the example of FIG. Then, the display control unit 23b may store the selected pathological image in the storage unit of the server 22 as the diagnosis result information. This point will be described with reference to FIG. As shown in FIG. 21, the display control unit 23b displays the pathological image I1 by superimposing the frame images RI21 to RI25 in the entire display area H10, as in the example of FIG. Further, the display control unit 23b displays the pathological images I41 to I45 side by side in a selectable manner in the enlarged display area H11.
- the display control unit 23b displays check boxes CH11 to CH15 for selecting each of the pathological images I41 to I45. Then, the display control unit 23b stores the selected pathological image in the storage unit of the server 22 or the medical information system 30 when a save button (not shown) is pressed with these check boxes selected.
- the display control unit 23b may display the learning result when the learning parameter is changed, for the developer who generates the learning model.
- the display control unit 23b may display learning results corresponding to different learning parameters side by side so as to be comparable.
- the learning parameter include a threshold TH4 that sets 0 or less to a predetermined attention index value in the heat map image, a learning batch size or an input size, and a deep learning network configuration.
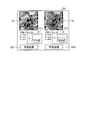
- the display control unit 23b displays the two learning results side by side. Specifically, the display control unit 23b displays the learning result when the learning parameter A is "XXX", the learning parameter B is “YYY”, and the learning parameter C is "ZZZ” on the left side of the screen. Further, the display control unit 23b displays the learning result when the learning parameters A, B, and C are "PPP", "QQQ", and "RRR” on the right side of the screen. As a learning result, the display control unit 23b displays, for example, information indicating the attention area (mask image in the example of FIG. 22) by superimposing it on the pathological image I21.
- the display control unit 23b displays graphs G11 and G12 showing the relationship between the number of learnings in machine learning and the output of the loss function, as shown in FIG.
- the vertical axis of the graphs G11 and G12 shown in FIG. 22 represents the output of the loss function
- the horizontal axis represents the number of times of learning.
- the number of times of learning corresponds to, for example, the number of times of backpropagation performed when learning a neural network (that is, the number of times of updating the weight). Since the learning is performed at any time, the display control unit 23b displays the latest learning result information when the learning result button B31 or B32 is selected.
- the frame image and the mask image have been described as examples of the diagnostic support information to be superimposed and displayed on the pathological image.
- the display control unit 23b may superimpose and display an arrow image indicating the attention area on the pathological image, or may display text information that is an explanation about the attention area.
- a tile image that is a pathological image may be generated for each imaging condition such as the focal length and the staining condition.
- the display control unit 23b in the example described with reference to FIGS. 11 and 14 to 22, for example, a pathological image corresponding to a specific imaging condition (hereinafter referred to as a specific pathology). Display).
- the display control unit 23b displays, together with the specific pathological image, other pathological images corresponding to the imaging conditions different from the specific imaging conditions, that is, other pathological images in the same region as the specific pathological image. May be.
- the display control unit 23b displays information (mask image, frame image, etc.) indicating the attention area at a position corresponding to the attention area of the specific pathological image among the other pathological images.
- the specific imaging condition may be designated by the viewer.
- the display control unit 23b may display the pathological images of the same region corresponding to each imaging condition side by side when a plurality of imaging conditions are designated by the viewer.
- the display control unit 23b may display the information indicating the attention area (mask image, frame image, etc.) and the information predicted as the diagnosis result. ..
- the attention score derived using the learning model 121 indicates the probability that a lesion portion exists. That is, it can be said that the attention score corresponding to each area of the second pathological image indicates the probability that a lesion exists in each area.
- the display control unit 23b may display the information regarding the existence probability of the lesion determined from the attention score. For example, in the example shown in FIGS. 11 and 14 to 22, the display control unit 23b may superimpose and display the information regarding the existence probability of the lesion together with the information indicating the region of interest (mask image, frame image, etc.). ..
- the information displayed by the display control unit 23b is not limited to the information described above, and the display control unit 23b may display additional information as appropriate.
- the display control unit 23b may display the resolution of the pathological image.
- the display control unit 23b may display a recommended size for displaying the observation target based on the browsing history information.
- the display control unit 23b may display the past pathological images of the same patient side by side.
- the display control unit 23b may also display a pathological image of another patient similar to the pathological image to be displayed.
- the learning unit 133 has shown an example of learning using the browsing history information acquired from the server 12.
- the learning unit 133 may acquire the pathological image stored in the medical information system 30 as the browsing history information.
- the diagnostic information storage unit of the medical information system 30 stores the pathological image saved by the pathologist at the time of diagnosis.
- the pathologist often enlarges and saves the area of the pathological image in which the lesion portion was present. That is, the pathological image stored in the diagnostic information storage unit is an image of a partial region of the entire image, and often corresponds to a region that has a lesion or a region that is likely to have a lesion. ..
- the learning unit 133 learns that the pathological image stored in the medical information system 30 is the area of interest. For example, when the learning unit 133 generates the heat map image from the first pathological image stored in the server 12, the area corresponding to the pathological image acquired from the medical information system 30 in the first pathological image.
- the attention index value of is added by a predetermined value.
- the learning unit 133 can perform learning not only by the browsing operation by the pathologist, but also by considering the pathological image that the pathologist actually paid attention to and saved, so that the learning model 121 with high accuracy can be generated. You can
- the learning unit 133 may perform learning using only the entire image of the first pathological image. Then, the learning unit 133 may use the browsing history information used for the learning process as the position information of the region of the entire image that is viewed and browsed. Accordingly, the learning unit 133 can generate the learning model 121 capable of estimating the region of particular interest in the entire image corresponding to the entire observation target object.
- the learning unit 133 may perform learning by performing weighting based on information regarding the observation target object (here, the first affected area tissue). For example, the learning unit 133, as the information on the observation object, information (sex, age, medical history, etc.) on the patient from which the first affected tissue is collected, and site information (large intestine, lung, etc.) of the first affected tissue. It is possible to use the reagent that stains the first diseased tissue, the information about the organization that stains the first diseased tissue, the type and progress of the lesion site of the observation target, and the like.
- the learning unit 133 may perform learning by weighting the first pathological image corresponding to the patient as the age of the patient increases. Further, for example, the learning unit 133 learns by weighting the first pathological image corresponding to the first diseased tissue stained by such an institution as the reliability of the organization that stained the first diseased tissue is higher. You may.
- the learning unit 133 may generate a learning model for each piece of information about the first affected area tissue by learning by dividing each piece of information about the first affected area tissue. For example, the learning unit 133 generates a learning model for men based on the first pathological image of only men, and generates a learning model for women based on the first pathological image of only women. In this case, the derivation unit 134 performs the derivation process using a learning model that matches the sex of the patient corresponding to the second pathological image to be predicted. Similarly for other examples, the learning unit 133 may generate a learning model for the large intestine and a learning model for the lungs, or a learning model for the staining institution A and a learning model for the staining institution B.
- the learning unit 133 learns by weighting the first pathological image of the male with a high incidence of large intestine more than the first pathological image of the female. You may. In addition, for example, when generating a learning model for breast cancer, the learning unit 133 performs learning by weighting the first pathological image of a woman having a high incidence of breast cancer more heavily than the first pathological image of a male. You may.
- the deriving unit 134 may derive the diagnosis support information using each learning model. For example, the deriving unit 134 may derive the diagnosis support information X1 using the learning model for the dyeing institution A, and may derive the diagnosis support information X2 using the learning model for the dyeing institution B. Then, the display control unit 23b superimposes and displays both the information (mask image or the like) indicating the attention area based on the diagnosis support information X1 and the information indicating the attention area based on the diagnosis support information X2 on the same pathological image. Good.
- the display control unit 23b may change the display mode (saturation, brightness, transparency, etc.) of the information indicating the attention area according to the reliability of the diagnosis support information. For example, the display control unit 23b determines that the diagnosis support information X2 has higher reliability than the diagnosis support information X1 when the dyeing engine B has higher reliability than the dyeing engine A. In addition, the display control unit 23b may switch the display of the pathological image in accordance with the reliability of the diagnosis support information in the example of FIG. For example, the display control unit 23b displays the pathological images corresponding to the regions specified by the diagnosis support information in the order of increasing reliability of the diagnosis support information.
- the display control unit 23b may change the display mode (saturation, brightness, transparency, etc.) of the information indicating the attention area according to the reliability of the diagnosis support information. For example, the display control unit 23b determines that the diagnosis support information X2 has higher reliability than the diagnosis support information X1 when the dyeing engine B has higher reliability than the dyeing engine A. In addition, the display control
- the display control unit 23b may display the pathological images side by side according to the reliability of the diagnosis support information in the example of FIG.
- the display control unit 23b displays the pathological images corresponding to the regions specified by the diagnostic support information side by side in the descending order of reliability of the diagnostic support information.
- the learning unit 133 generates a learning model for each type of lesion site (organization type shown in FIGS. 9A to 9C) of the observation target.
- the deriving unit 134 applies the second pathological image to each learning model, so that the score of interest corresponding to each region of the second pathological image, that is, the lesion part, for each type of lesion site.
- the probability that there exists can be derived.
- the display control unit 23b may display the probability that a lesion part exists for each type of lesion site together with information (mask image, frame image, etc.) indicating the region of interest, based on such attention score.
- the display control unit 23b displays information regarding the grade of the lesion. May be.
- the learning unit 133 may perform learning by performing weighting based on the information regarding the imaging of the first pathological image.
- the learning unit 133 can use, as the information related to the imaging of the first pathological image, the device related to the imaging of the first pathological image, the information related to the institution imaging the first pathological image, and the like.
- the learning unit 133 may perform learning by increasing the weight of the first pathological image captured by the device, as the accuracy of the device capturing the first pathological image is higher. Further, for example, the learning unit 133 may perform learning by increasing the weight of the first pathological image captured by the institution as the reliability of the institution capturing the first pathological image is higher. Further, the learning unit 133 may generate a learning model for each piece of information regarding the imaging of the first pathological image by separately learning for each piece of information regarding the imaging of the first pathological image. Further, the display control unit 23b may display a plurality of pieces of diagnosis support information derived using each learning model. In addition, the display control unit 23b may change the display mode of the information indicating the attention area according to the reliability of the diagnosis support information determined by the reliability of the imaging device or the imaging institution.
- the learning unit 133 may perform learning by performing weighting based on the information regarding the display of the first pathological image. For example, the learning unit 133 uses the device used to display the first pathological image, the program used to display the first pathological image, the viewing time of the area in which the pathological image is displayed, or the first pathological image. Information about the number of times of displaying the region in which the pathological image is displayed can be used.
- the learning unit 133 learns by increasing the weight of the first pathological image displayed and diagnosed by the display device as the accuracy of the display device used for displaying the first pathological image increases. May be.
- the learning unit 133 learns by weighting the first pathological image displayed and diagnosed by the program more heavily as the program used for displaying the first pathological image is more accurate. May be. Note that, as described above regarding the browsing time and the display count, the learning unit 133 performs learning based on the heat map image in which the attention index value is reflected as the weight according to the browsing time and the display count.
- the learning unit 133 may generate a learning model for each piece of information regarding the display of the first pathological image by learning by dividing each piece of information regarding the display of the first pathological image.
- the display control unit 23b may display a plurality of pieces of diagnosis support information derived using each learning model.
- the display control unit 23b may change the display mode of the information indicating the attention area according to the reliability of the diagnosis support information determined by the reliability of the display device or the display program.
- the learning unit 133 may perform learning by performing weighting based on the information regarding the user (that is, the viewer of the first pathological image) corresponding to the browsing history information. For example, the learning unit 133 can use, as the information related to the user corresponding to the browsing history information, information that identifies a diagnostician who has diagnosed the first pathological image or information that indicates the ability rank of the diagnostician.
- the learning unit 133 may perform learning by increasing the weight of the first pathological image browsed by such a diagnostician as the diagnostic level or ability rank of the diagnostician who diagnoses the first pathological image is higher. ..
- the diagnostic level and ability rank of a diagnostician are determined based on years of experience, the number of experienced cases, and the like.
- the learning unit 133 may generate a learning model for each piece of information regarding the user corresponding to the browsing history information by learning by dividing for each piece of information regarding the user corresponding to the browsing history information.
- the display control unit 23b may display a plurality of pieces of diagnosis support information derived using each learning model.
- the display control unit 23b may change the display mode of the information indicating the attention area according to the reliability of the diagnosis support information determined by the diagnosis level of the diagnostician and the reliability of the ability rank.
- the learning unit 133 may perform the learning without using the heat map image.
- the learning unit 133 sets the attention time indicating the degree of attention of the pathologist to each region of the pathological image, using the browsing time, the number of times of browsing, and the enlargement ratio of the pathologist for each region of the first pathological image as explanatory variables. , 0 to 1) may be used as the objective variable for learning.
- the learning unit 133 has a higher attention score in a region having a longer browsing time, a higher attention score in a region having a larger number of browsing times, and a higher attention score in a region that has been enlarged and browsed, and thus has a higher magnification rate. Learning is performed so that the attention score becomes higher in the region.
- the browsing history storage unit 12a illustrated in FIG. 8 may store the line-of-sight information of the viewer when browsing the first pathological image.
- the browsing history storage unit 12a stores, as the line-of-sight information, the position information of the region of the first pathological image that the viewer has browsed for a predetermined time or more and the region of the first pathological image that has been browsed a predetermined number of times or more.
- Such line-of-sight information can be acquired by a technique such as eye tracking.
- the learning unit 133 may learn by considering the line-of-sight information stored in the browsing history storage unit 12a. For example, the learning unit 133 learns after reflecting the attention index value based on the line-of-sight information on the heat map image described above.
- diagnosis support information is derived using the learning model.
- diagnosis support information is derived using the learning model.
- second embodiment an example of deriving diagnosis support information without using a learning model will be described.
- FIG. 23 is a diagram showing an example of the derivation device 200 and the display control device 23 according to the second embodiment.
- the derivation device 200 includes a communication unit 110, a storage unit 220, and a control unit 230.
- the storage unit 220 is realized by, for example, a semiconductor memory device such as a RAM or a flash memory, or a storage device such as a hard disk or an optical disk.
- the storage unit 220 has a history information storage unit 221.
- the control unit 230 is realized, for example, by the CPU or MPU executing the diagnostic support program stored in the derivation device 200 using a RAM or the like as a work area. Further, the control unit 230 may be executed by an integrated circuit such as an ASIC or FPGA. As shown in FIG. 23, the control unit 230 includes a history information acquisition unit 231, a diagnostic information acquisition unit 232, and a derivation unit 234.
- the history information acquisition unit 231 acquires a first pathological image from the server 12 of the pathological system 10 and browsing history information regarding browsing of the first pathological image, and records the acquired first pathological image and browsing history information as a history.
- the information is stored in the information storage unit 221.
- the diagnostic information acquisition unit 232 acquires the diagnostic information for the first affected tissue corresponding to the first pathological image from the medical information system 30, and stores the acquired diagnostic information in the history information storage unit 221.
- the derivation unit 234 When the derivation unit 234 receives the second pathological image from the display control device 23, the derivation unit 234 refers to the history information storage unit 221 to determine whether the similarity with the second pathological image is higher than a predetermined threshold TH4.
- the diagnosis support information is derived based on the browsing history information regarding the pathological image No. 1. Specifically, the derivation unit 234 has a similarity between the second pathological image and the feature amount of the first pathological image stored in the history information storage unit 221 that is higher than the threshold value TH4, and the diagnosis result is The first pathological image that is positive is identified. Then, the derivation unit 234 determines the position information and the like of the area of the second pathological image that is similar to the attention area of the first pathological image based on the browsing history information corresponding to the identified first pathological image. Derive as.
- the derivation unit 234 may derive the diagnosis support information based on the browsing history information regarding the first pathological image whose degree of correlation with the second pathological image is higher than the predetermined threshold TH5.
- the degree of correlation here corresponds to the identity of the attributes (sex, age, etc.) of the patient, the identity of the affected tissue, and the like.
- the derivation device 200 according to the second embodiment can derive the diagnosis support information without using the learning model.
- the display processing by the display control device 23 described in the first embodiment can be applied to the second embodiment.
- the information indicating the attention area such as the mask image is superimposed and displayed on the pathological image displayed on the stationary display device 24
- the information indicating the attention area may be displayed on a mounting device (such as a head mounted display) mounted by a viewer who is browsing the pathological image displayed on the display device 24. Accordingly, the pathological image displayed on the display device 24 may be overlapped with the information indicating the attention area displayed on the mounting device.
- the information indicating the attention area may be displayed on a transparent display mounted so as to cover the front surface of the display device 24. Accordingly, the pathological image displayed on the display device 24 may be superposed with the information indicating the attention area displayed on the transparent display.
- the device for imaging the observation target may be a medical image acquisition device such as an endoscope for imaging the inside of the patient's body, CT (Computed Tomography), or MRI (Magnetic Resonance Image).
- CT Computer Planar Tomography
- MRI Magnetic Resonance Image
- the server 12 or the server 22 stores medical images such as a two-dimensional still image or moving image generated by an endoscope and a three-dimensional image generated by CT or MRI.
- the server 12 or the server 22 may store image-related information such as imaging conditions and diagnostic results for the images in association with these images.
- the server 12 or the server 22 may store another pathological image captured by another medical image acquisition apparatus such as an endoscope or CT or MRI in association with the pathological image generated by the microscope. Good.
- the display control unit 23b may display, in addition to the pathological image generated by the microscope, another pathological image captured by another imaging device for reference.
- [Pathological image] Among the pathological images stored in the server 12 and the server 22, there are pathological images with low resolution. That is, although there is browsing history information, there are cases where the resolution of the pathological image corresponding to the browsing history information is not such that appropriate learning can be performed.
- the derivation device 100 browses the first pathological image when the resolution of the first pathological image for learning is not such that appropriate learning can be performed and there is a re-imaged pathological image.
- the above-described learning may be performed by associating the history information with the re-imaged pathological image.
- the derivation device 100 aligns the first pathological image and the re-imaged pathological image, and the pathological image in which the attention area indicated by the browsing history information of the first pathological image is re-imaged.
- the processing is performed so as to correspond to the area.
- FIG. 24 is a hardware configuration diagram showing an example of a computer 1000 that realizes the functions of the derivation device 100.
- the computer 1000 has a CPU 1100, a RAM 1200, a ROM (Read Only Memory) 1300, an HDD (Hard Disk Drive) 1400, a communication interface 1500, and an input/output interface 1600.
- the respective units of the computer 1000 are connected by a bus 1050.
- the CPU 1100 operates based on a program stored in the ROM 1300 or the HDD 1400, and controls each part. For example, the CPU 1100 expands a program stored in the ROM 1300 or the HDD 1400 into the RAM 1200 and executes processing corresponding to various programs.
- the ROM 1300 stores a boot program such as a BIOS (Basic Input Output System) executed by the CPU 1100 when the computer 1000 starts up, a program dependent on the hardware of the computer 1000, and the like.
- BIOS Basic Input Output System
- the HDD 1400 is a computer-readable recording medium that non-temporarily records a program executed by the CPU 1100, data used by the program, and the like. Specifically, the HDD 1400 is a recording medium that records the response generation program according to the present disclosure, which is an example of the program data 1450.
- the communication interface 1500 is an interface for connecting the computer 1000 to an external network 1550 (for example, the Internet).
- the CPU 1100 receives data from another device or transmits the data generated by the CPU 1100 to another device via the communication interface 1500.
- the input/output interface 1600 is an interface for connecting the input/output device 1650 and the computer 1000.
- the CPU 1100 receives data from an input device such as a keyboard or a mouse via the input/output interface 1600.
- the CPU 1100 also transmits data to an output device such as a display, a speaker, a printer, etc. via the input/output interface 1600.
- the input/output interface 1600 may function as a media interface for reading a program or the like recorded in a predetermined computer-readable recording medium (medium).
- Examples of media include optical recording media such as DVD (Digital Versatile Disc) and PD (Phase change rewritable Disk), magneto-optical recording media such as MO (Magneto-Optical disk), tape media, magnetic recording media, and semiconductor memory. Is.
- optical recording media such as DVD (Digital Versatile Disc) and PD (Phase change rewritable Disk)
- magneto-optical recording media such as MO (Magneto-Optical disk), tape media, magnetic recording media, and semiconductor memory.
- the CPU 1100 of the computer 1000 executes the diagnosis support program loaded on the RAM 1200 to acquire the history information acquisition unit 131 and the diagnosis information acquisition. Functions of the unit 132, the learning unit 133, the deriving unit 134, and the like are realized. Further, the HDD 1400 stores the diagnosis support program according to the present disclosure and the data in the storage unit 120. Further, for example, when the computer 1000 functions as the display control device 23 according to the first embodiment, the CPU 1100 of the computer 1000 executes the display control program loaded on the RAM 1200 to display the image acquisition unit 23a and display. The functions of the control unit 23b and the like are realized.
- the HDD 1400 stores the display control program according to the present disclosure.
- the CPU 1100 reads the program data 1450 from the HDD 1400 and executes the program data.
- the diagnosis support program or the display control program may be acquired from another device via the external network 1550.
- each component of each illustrated device is functionally conceptual, and does not necessarily have to be physically configured as illustrated. That is, the specific form of distribution/integration of each device is not limited to that shown in the figure, and all or part of the device may be functionally or physically distributed/arranged in arbitrary units according to various loads and usage conditions. It can be integrated and configured.
- the derivation device 100 includes the first pathological image corresponding to the first affected area tissue, history information regarding the browsing history of the first pathological image (browsing history information described above), Derivation procedure for deriving diagnostic support information for assisting diagnosis of the second pathological image corresponding to the second diseased tissue to be diagnosed, based on the diagnostic information for the first diseased tissue corresponding to the first pathological image Causes the computer to execute.
- the diagnosis support system 1 also includes a microscope 11 (or 21) and a derivation device 100 (or 200) that derives diagnosis support information that is information that supports diagnosis.
- the process performed by the derivation device 100 may be realized by software used for processing a pathological image corresponding to an object imaged by the microscope 11 (or 21). In the following description of the effects, the derivation device 100 can be read as the derivation device 200.
- the derivation device 100 derives information regarding browsing as diagnosis support information.
- the derivation device 100 derives the diagnosis support information by using the browsing history information corresponding to the diagnosis information having the positive diagnosis result.
- the diagnosis support information in which the browsing history information at the time of positive is added is derived, the accuracy of positive diagnosis can be improved.
- the browsing history information includes information regarding an image of a partial area of the first pathological image saved at the time of diagnosis of the first pathological image.
- leading-out apparatus 100 acquires the image of the partial area
- the pathological image is derived by deriving the diagnosis support information in consideration of the pathological image that the pathologist actually paid attention to and saved, so that the diagnosis accuracy can be further improved.
- the first pathological image is an entire image of the entire first affected tissue.
- the browsing history information is position information indicating the position where the first pathological image was browsed.
- the browsing history information is position information indicating a position where the first pathological image is browsed and information indicating a time or the number of times the first pathological image is browsed.
- the diagnosis support information is derived based on the region that the pathologist has noticed and browsed, so that the diagnosis accuracy can be further improved.
- the first pathological image is an image formed by partial images corresponding to the respective regions of the first affected tissue.
- the browsing history information is partial image information indicating the browsed partial image among the partial images corresponding to each area.
- the partial image information is information indicating the position of the partial image or identifying the partial image.
- the derivation device 100 derives the diagnosis support information based on the attention area of the second pathological image estimated from the browsing history information.
- a region of interest in the second pathological image to be diagnosed can be provided, so that the diagnostic work can be facilitated and the variation in the diagnosis can be reduced.
- the derivation device 100 determines that a region having a larger display magnification has a higher attention level, or a region having a longer browsing time has a higher attention level, or has a larger number of browsing times.
- the diagnosis support information is derived as a region of interest having a higher degree of attention as the region increases.
- the region of interest can be specified with high accuracy, so that the diagnostic accuracy can be further improved.
- the diagnostic information is information on the presence or absence of a lesion site, the type of lesion site, or the degree of progress of the lesion site. Moreover, the diagnostic information is acquired from the medical information system in which the information of the patient corresponding to the first pathological image is registered.
- the derivation device 100 also learns the correspondence between the first pathological image, the browsing history information, and the diagnostic information. Further, the derivation device 100 derives diagnosis support information using the learning result.
- the derivation device 100 performs learning by performing weighting based on the information on the first affected tissue, or learns separately for each information on the first affected tissue.
- the information on the first diseased tissue includes information on the patient from which the first diseased tissue is collected, site information on the first diseased tissue, a reagent that stains the first diseased tissue, or the first diseased tissue. This is information about the stained organization.
- the diagnosis support information can be derived with higher accuracy by using the information on the first affected tissue.
- the derivation device 100 performs learning by weighting based on the information regarding the imaging of the first pathological image, or learns by dividing each information regarding the imaging of the first pathological image.
- the information regarding the imaging of the first pathological image is information regarding the device that has captured the first pathological image or the institution that has captured the first pathological image.
- the derivation device 100 performs learning by performing weighting based on the information regarding the display of the first pathological image, or learns by dividing each information regarding the display of the first pathological image.
- Information regarding the display of the first pathological image includes the device used for displaying the first pathological image, the program used for displaying the first pathological image, and browsing of the area where the first pathological image is displayed. It is information about the time or the display count of the area in which the first pathological image is displayed.
- the derivation device 100 performs learning by weighting based on the information about the user corresponding to the browsing history information, or learns separately for each information about the user corresponding to the browsing history information.
- the information about the user corresponding to the browsing history information is information that identifies a diagnostician who has diagnosed the first pathological image, or information that indicates the ability rank of the diagnostician.
- the derivation device 100 learns by associating the diagnostic information showing a positive diagnostic result with the browsing history information corresponding to the diagnostic information.
- the diagnosis support information in which the browsing history information at the time of positive is added is derived, the accuracy of positive diagnosis can be improved.
- the derivation device 100 learns by associating the diagnostic information showing a negative diagnostic result with the browsing history information corresponding to the diagnostic information.
- the derivation device 100 learns a region other than the region of interest in the second pathological image as diagnostic information showing a negative diagnostic result.
- the derivation device 200 corresponds to the first pathological image whose similarity to the second pathological image is higher than the threshold value, or the first pathological image whose correlation degree to the second pathological image is higher than the threshold value.
- the diagnosis support information is derived based on the browsing history information regarding the browsing history.
- the display control device 23 controls, based on the diagnosis support information, to superimpose and display the attention area, which is an area estimated to affect the diagnosis, on the second pathological image in a visible state.
- the display control device 23 uses a mask image that is an image covering the attention area, a frame image that is an image showing the outer frame of the attention area, an arrow image that points the attention area, or text information that describes the attention area. It is controlled so as to be superimposed and displayed on the pathological image.
- the display control device 23 changes the display mode of the attention area according to the degree of influence on the diagnosis or the reliability of the diagnosis support information based on the diagnosis support information.
- the display mode is saturation, brightness, or transparency.
- the information in which the degree of influence and the degree of reliability are reflected is displayed, so that it is possible to improve the diagnostic accuracy and improve the diagnostic efficiency.
- the display control device 23 also controls to display a partial image of the second affected tissue corresponding to the region of interest.
- the display control device 23 controls to display a pathological image corresponding to each attention area. Further, the display control device 23 controls to display the pathological images corresponding to the respective attention areas side by side on the display screen.
- the display control device 23 controls to display the pathological images corresponding to each attention area in the display screen in the order of the degree of influence on the diagnosis or the degree of reliability of the diagnosis support information.
- the information in which the degree of influence and the degree of reliability are reflected is displayed, so that it is possible to improve the diagnostic accuracy and improve the diagnostic efficiency.
- the display control device 23 controls to display the pathological image corresponding to each attention area by switching to the same display area.
- the display control device 23 controls to display the pathological images corresponding to each attention area by switching to the same display area in the order of the degree of influence on diagnosis or reliability of diagnosis support information.
- the information in which the degree of influence and the degree of reliability are reflected is displayed, so that it is possible to improve the diagnostic accuracy and improve the diagnostic efficiency.
- the diagnosis support information is a diagnosis prediction result that is predicted to be a diagnosis result for the first affected tissue.
- the diagnosis prediction result is the presence or absence of a lesion site, the type of lesion site, the degree of progress of the lesion site, or the probability of being a lesion site.
- the present technology may also be configured as below.
- (1) Acquiring a first pathological image corresponding to the first diseased tissue, history information regarding a browsing history of the first pathological image, and diagnostic information for the first diseased tissue corresponding to the first pathological image.
- Acquisition procedure Derivation procedure for deriving diagnosis support information for supporting diagnosis of the second pathological image corresponding to the second diseased tissue of the diagnosis target based on the first pathological image, the history information, and the diagnosis information.
- a diagnostic support program that causes an information processing apparatus to execute.
- (2) The derivation procedure is As the diagnosis support information, information regarding browsing is derived.
- the derivation procedure is Using the history information corresponding to the diagnostic information that the diagnostic result is positive, derive the diagnostic support information, The diagnostic support program according to (1) or (2) above.
- the history information includes information about an image of a partial region of the first pathological image that was saved at the time of diagnosis of the first pathological image.
- the derivation procedure is The diagnostic support program according to (4), wherein an image of a partial region of the first pathological image is acquired from a medical information system in which information on a patient corresponding to the first pathological image is registered.
- the first pathological image is an entire image of the entire first affected tissue
- the history information is position information indicating a position where the first pathological image is browsed
- the diagnostic support program according to any one of (1) to (5) above.
- the history information is position information indicating a position where the first pathological image is browsed, and information indicating a time or the number of times the first pathological image is browsed.
- the first pathological image is an image formed by partial images corresponding to each region of the first affected tissue
- the history information is partial image information indicating a browsed partial image among the partial images corresponding to the areas.
- the diagnostic support program according to any one of (1) to (7) above.
- the partial image information is information indicating the position of the partial image or identifying the partial image,
- the derivation procedure is Deriving the diagnosis support information based on a region of interest of the second pathological image estimated from the history information, The diagnostic support program according to any one of (1) to (9) above.
- the derivation procedure is Based on the history information, a region having a larger display magnification is regarded as a region of higher interest, or a region having a longer browsing time is regarded as a region of higher attention, or a region having a larger number of browsing times has a higher attention. As a region, derive the diagnosis support information, The diagnostic support program according to (10) above.
- the diagnostic information is the presence or absence of a lesion site, the type of the lesion site, or information regarding the degree of progress of the lesion site,
- the diagnostic support program according to any one of (1) to (11) above.
- the diagnostic information is acquired from a medical information system in which information of a patient corresponding to the first pathological image is registered.
- the diagnostic support program according to any one of (1) to (12) above.
- (14) Causing the computer to further execute a learning procedure for learning the correspondence between the first pathological image, the history information, and the diagnosis information,
- the derivation procedure is Deriving the diagnosis support information by using the learning result by the learning procedure,
- the diagnostic support program according to any one of (1) to (13) above.
- the learning procedure is The diagnosis support program according to (14), wherein learning is performed by performing weighting based on the information on the first affected tissue, or learning is performed separately for each information on the first affected tissue.
- the information on the first affected tissue is information on a patient from which the first affected tissue is collected, site information on the first affected tissue, a reagent that stains the first affected tissue, or the first information. Information about the organization that stained the affected tissue, The diagnostic support program according to (15) above.
- the learning procedure is The learning is performed by weighting based on the information regarding the imaging of the first pathological image, or the learning is performed separately for each information regarding the imaging of the first pathological image. (14) to (16) The diagnostic support program described.
- the information regarding the imaging of the first pathological image is information regarding a device that has captured the first pathological image or an institution that has captured the first pathological image, The diagnostic support program according to (17) above.
- the learning procedure is Learning is performed by weighting based on the information on the display of the first pathological image, or learning is performed separately for each information on the display of the first pathological image.
- the information related to the display of the first pathological image is the device used for displaying the first pathological image, the program used for displaying the first pathological image, and the display of the first pathological image. It is information regarding the viewing time of the area, or the display frequency of the area in which the first pathological image is displayed, The diagnostic support program according to (19) above.
- the learning procedure is The learning is performed by performing weighting based on the information about the user corresponding to the history information, or learning is performed separately for each information about the user corresponding to the history information.
- the information about the user corresponding to the history information is information that identifies a diagnostician who has diagnosed the first pathological image, or information that indicates the ability rank of the diagnostician.
- the learning procedure is The diagnostic information showing a positive diagnostic result and the history information corresponding to the diagnostic information are associated and learned, The diagnostic support program according to any one of (14) to (22).
- the learning procedure is The diagnostic information indicating a negative diagnostic result and the history information corresponding to the diagnostic information are associated and learned.
- the diagnostic support program according to any one of (14) to (23).
- the learning procedure is An area other than the area of interest in the second pathological image is learned as the diagnostic information showing a negative diagnostic result,
- the derivation procedure is Regarding the browsing history corresponding to the first pathological image whose degree of similarity with the second pathological image is higher than a threshold value or the first pathological image whose degree of correlation with the second pathological image is higher than a threshold value
- the diagnosis support program according to any one of (1) to (25), wherein the diagnosis support information is derived based on history information.
- a microscope A derivation device that derives diagnosis support information that is information that supports diagnosis.
- Deriving diagnosis support information for supporting diagnosis of the second pathological image corresponding to the target second affected tissue Diagnostic support system.
- a diagnostic support system configured to include a microscope and software used for processing a pathological image corresponding to an object imaged by the microscope, The software is A diagnosis imaged by the microscope based on a first pathological image corresponding to a first diseased tissue, history information regarding a browsing history of the first pathological image, and diagnostic information for the first diseased tissue.
- the diagnosis support system further includes a display control device, The display control device, Based on the diagnosis support information, control is performed so as to superimpose and display the attention area, which is an area estimated to affect the diagnosis, on the second pathological image in a visible state.
- the diagnosis support system according to (27) or (28).
- the display control device The mask image that covers the attention area, the frame image that indicates the outer frame of the attention area, the arrow image that indicates the attention area, or the text information that describes the attention area, and the second pathological image. Control to be displayed superimposed on The diagnosis support system according to (29).
- the display control device Based on the diagnosis support information, the display mode of the attention area is changed according to the degree of influence on the diagnosis or the reliability of the diagnosis support information.
- the display mode is saturation, brightness, or transparency, The diagnosis support system according to (31).
- the display control device Controlling to display a partial image of the second affected tissue corresponding to the region of interest, The diagnosis support system according to any one of (29) to (32).
- the display control device When there are a plurality of attention areas, control is performed to display a pathological image corresponding to each attention area, The diagnosis support system according to any one of (29) to (33).
- the display control device Controlling to display the pathological images corresponding to each of the attention areas side by side in a display screen, The diagnosis support system according to (34).
- the display control device The pathological image corresponding to each of the attention areas is controlled to be displayed side by side in the display screen in the order of the degree of influence on the diagnosis or the reliability of the diagnosis support information.
- the diagnosis support system according to (35) The display control device, Control to switch and display the pathological image corresponding to each of the attention areas in the same display area, The diagnosis support system according to (34).
- the display control device, The pathological image corresponding to each region of interest is controlled so as to be displayed by switching to the same display area in the order of the degree of influence on the diagnosis or the reliability of the diagnosis support information.
- the diagnosis support system according to (37).
- the diagnosis support information is a diagnosis prediction result predicted to be a diagnosis result for the first affected tissue.
- the diagnosis support system according to any one of (28) to (38).
- the diagnosis prediction result is the presence or absence of a lesion site, the type of the lesion site, the degree of progress of the lesion site, or the probability of being the lesion site,
- the diagnosis support system according to (39).
- (41) Computer Based on the first pathological image corresponding to the first diseased tissue, history information regarding the browsing history for the first pathological image, and diagnostic information for the first diseased tissue corresponding to the first pathological image
- a diagnostic support system including a medical image acquisition device and software used for processing a medical image corresponding to an object imaged by the medical image acquisition device,
- the software is An image is captured by the medical image acquisition device based on a first medical image corresponding to a first affected tissue, history information regarding a browsing history of the first medical image, and diagnostic information about the first affected tissue.
Landscapes
- Engineering & Computer Science (AREA)
- Health & Medical Sciences (AREA)
- Medical Informatics (AREA)
- Public Health (AREA)
- General Health & Medical Sciences (AREA)
- Biomedical Technology (AREA)
- Epidemiology (AREA)
- Primary Health Care (AREA)
- Physics & Mathematics (AREA)
- General Physics & Mathematics (AREA)
- Radiology & Medical Imaging (AREA)
- Nuclear Medicine, Radiotherapy & Molecular Imaging (AREA)
- Pathology (AREA)
- Databases & Information Systems (AREA)
- Data Mining & Analysis (AREA)
- Computer Vision & Pattern Recognition (AREA)
- Theoretical Computer Science (AREA)
- Chemical & Material Sciences (AREA)
- Multimedia (AREA)
- Quality & Reliability (AREA)
- Analytical Chemistry (AREA)
- Optics & Photonics (AREA)
- Image Analysis (AREA)
- Medical Treatment And Welfare Office Work (AREA)
- Investigating Or Analysing Materials By Optical Means (AREA)
- Image Processing (AREA)
Abstract
診断支援プログラムは、第1の患部組織に対応する第1の病理画像と、第1の病理画像に対する閲覧履歴に関する履歴情報と、第1の病理画像に対応する第1の患部組織に対する診断情報とに基づいて、診断対象の第2の患部組織に対応する第2の病理画像の診断を支援する診断支援情報を導出する導出手順、をコンピュータに実行させる。
Description
本開示は、診断支援プログラム、診断支援システム及び診断支援方法に関する。
近年、病理画像等である医療画像に対して、病変部が存在する可能性のある領域等を注目すべき領域としてマーク(以下、アノテーションと表記する)を付す技術が開発されている。例えば、以下の非特許文献1には、アノテーションが付与されたHE(hematoxylin and eosin。一般組織染色)画像データを学習することにより、注目領域を表示する技術が開示されている。この技術によれば、診断の精度を向上させることができるとも考えられる。
"Annotation of Whole Slide Images Using Touchscreen Technology"; Jessical L. Baumann, Kari Garsha, Mike S. Flores, Faith Ough, Ehab A. ElGabry; Roche
しかしながら、上記の従来技術では、診断精度の向上を実現するために膨大な工数を要することになる。具体的には、病理画像にアノテーションを付す作業は、例えば人手によって行われるため、多くの時間と作業者を要する。すなわち、上記の従来技術では、診断精度の向上を容易に実現することが困難である。
そこで、本開示は、上記に鑑みてなされたものであり、診断の精度を向上させることができる診断支援プログラム、診断支援システム及び診断支援方法を提案する。
上記の課題を解決するために、本開示に係る一形態の診断支援プログラムは、第1の患部組織に対応する第1の病理画像と、前記第1の病理画像に対する閲覧履歴に関する履歴情報と、前記第1の病理画像に対応する第1の患部組織に対する診断情報とに基づいて、診断対象の第2の患部組織に対応する第2の病理画像の診断を支援する診断支援情報を導出する導出手順、をコンピュータに実行させる。
以下に、本開示の実施形態について図面に基づいて詳細に説明する。なお、以下の各実施形態において、同一の部位には同一の符号を付することにより重複する説明を省略する。
以下に示す項目順序に従って本開示を説明する。
<第1の実施形態>
1.第1の実施形態に係るシステムの構成
2.各種情報について
2-1.病理画像
2-2.閲覧履歴情報
2-3.診断情報
3.装置構成
3-1.第1の実施形態に係る導出装置
3-2.第1の実施形態に係る表示制御装置
4.処理手順
4-1.第1の実施形態に係る学習処理手順
4-2.第1の実施形態に係る導出処理手順
5.変形例1
5-1.表示例(1)~5-10.表示例(10)
5-11.撮像条件の異なる病理画像
5-12.診断予測結果
6.変形例2
6-1.学習処理(1)~6-8.学習処理(8)
<第2の実施形態>
<その他の実施形態>
<第1の実施形態>
1.第1の実施形態に係るシステムの構成
2.各種情報について
2-1.病理画像
2-2.閲覧履歴情報
2-3.診断情報
3.装置構成
3-1.第1の実施形態に係る導出装置
3-2.第1の実施形態に係る表示制御装置
4.処理手順
4-1.第1の実施形態に係る学習処理手順
4-2.第1の実施形態に係る導出処理手順
5.変形例1
5-1.表示例(1)~5-10.表示例(10)
5-11.撮像条件の異なる病理画像
5-12.診断予測結果
6.変形例2
6-1.学習処理(1)~6-8.学習処理(8)
<第2の実施形態>
<その他の実施形態>
(第1の実施形態)
[1.第1の実施形態に係るシステムの構成]
まず、図1を用いて、第1の実施形態に係る診断支援システム1について説明する。図1は、第1の実施形態に係る診断支援システム1を示す図である。図1に示すように、診断支援システム1は、病理システム10と、病理システム20と、医療情報システム30と、導出装置100とを含む。
[1.第1の実施形態に係るシステムの構成]
まず、図1を用いて、第1の実施形態に係る診断支援システム1について説明する。図1は、第1の実施形態に係る診断支援システム1を示す図である。図1に示すように、診断支援システム1は、病理システム10と、病理システム20と、医療情報システム30と、導出装置100とを含む。
病理システム10は、主に病理医が使用するシステムであり、例えば研究所や病院に適用される。図1に示すように、病理システム10は、顕微鏡11と、サーバ12と、表示制御装置13と、表示装置14とを含む。
顕微鏡11は、光学顕微鏡の機能を有し、ガラススライドに収められた観察対象物を撮像し、デジタル画像である病理画像(医療画像の一例)を取得する撮像装置である。なお、観察対象物とは、例えば、患者から採取された組織や細胞であり、臓器の肉片、唾液、血液等である。
サーバ12は、顕微鏡11によって撮像された病理画像を図示しない記憶部に記憶、保存する装置である。サーバ12は、表示制御装置13から閲覧要求を受け付けた場合に、図示しない記憶部から病理画像を検索し、検索した病理画像を表示制御装置13に送る。
表示制御装置13は、ユーザから受け付けた病理画像の閲覧要求をサーバ12に送る。そして、表示制御装置13は、サーバ12から受け付けた病理画像を表示するよう表示装置14を制御する。
表示装置14は、例えば、液晶、EL(Electro‐Luminescence)、CRT(Cathode Ray Tube)などが用いられた画面を有する。表示装置14は4Kや8Kに対応していてもよいし、複数の表示装置により形成されてもよい。表示装置14は、表示制御装置13によって表示するよう制御された病理画像を表示する。なお、詳細は後述するが、サーバ12は、表示装置14を介して病理医に観察された病理画像の領域に関する閲覧履歴情報を記憶する。
病理システム20は、病理システム10と異なる病院に適用されるシステムである。病理システム20は、顕微鏡21と、サーバ22と、表示制御装置23と、表示装置24とを含む。病理診断システム20に含まれる各部は病理システム10と同様であるため説明を省略する。
医療情報システム30は、患者の診断に関する情報を記憶するシステムである。例えば、所定の病院で内視鏡検査などにて、その画像のみからは病状の診断が困難な場合に、生検を行って病理診断による確定診断を行うことがある。患者から採取された組織から作られた組織標本は、病理システム10の顕微鏡11にて撮像され、撮像されることで得られる病理画像はサーバ12に保存される。表示制御装置13によって表示装置14に病理画像が表示され、病理システム10を利用する病理医によって病理診断が行われる。医師は、病理診断結果に基づき確定診断を行い、その確定診断結果は医療情報システム30に記憶される。医療情報システム30は、患者を識別する情報、患者の疾患情報、診断に用いた検査情報や画像情報、診断結果、処方薬などの診断に関する情報を記憶する。なお、医療情報システム30は、電子カルテシステム等と呼ばれる。
ところで、病理診断の精度は病理医によってばらつきがある。具体的には、病理医の経験年数や専門性などによって、病理画像による診断結果は病理医によって異なることがある。このようなことから、近年では、病理診断を支援することを目的として、機械学習を用いて診断を支援する情報である診断支援情報を導出する技術が開発されている。具体的には、病理画像のうち注目すべき領域にアノテーションが付した複数の病理画像を用意し、かかる複数の病理画像を解析することで、新たな病理画像における注目すべき領域を推定する技術が提案されている。これにより、病理画像における注目すべき領域を病理医に提供することができるため、病理医による診断を支援することができる。
しかしながら、病理医が病理診断を行う際には、病理画像を観察するのみであり、病変部などの診断に影響がある領域にアノテーションを付すことはほぼない。このため、上述した機械学習を用いて診断支援情報を導出する技術では、病理画像にアノテーションを付与する作業を行うことにより大量の学習データを用意することとなるが、このアノテーションを付与する作業に多くの時間と作業者を要する。仮に十分な量の学習データを用意することができなければ、機械学習の精度が下がり、診断支援情報(すなわち、病理画像における注目すべき領域)を高精度に導出することが困難となる。また、詳細なアノテーションデータを必要としない弱教師学習という枠組みもあるが、詳細なアノテーションデータを使った機械学習と比較すると精度が劣るという問題がある。
そこで、第1の実施形態に係る診断支援システム1の導出装置100は、病理診断時に病理医が閲覧した病理画像の領域に関する閲覧履歴情報を用いて、診断支援情報を導出する。具体的には、導出装置100は、第1の患部組織に対応する第1の病理画像と、第1の病理画像に対する病理医による閲覧に関する閲覧履歴情報と、患部組織に対する診断情報とに基づいて、第1の患部組織とは異なる第2の患部組織に対応する第2の病理画像の診断を支援する閲覧に関する診断支援情報を導出する。詳細は後述するが、概念的に説明すると、導出装置100は、診断結果が陽性である第1の病理画像において病理医に注目された領域を診断支援情報として導出する。
図1の例を用いて、導出装置100による処理の一例を説明する。図1の例では、病理システム10のサーバ12には、病理医による診断に関する情報が日々蓄積されるものとする。すなわち、サーバ12には、第1の患部組織に対応する病理画像である第1の病理画像と、第1の病理画像に対する病理医の閲覧履歴に関する閲覧履歴情報とが保存される。また、図1の例では、導出装置100は、病理システム20に対して診断支援情報を提供するものとする。
まず、導出装置100は、病理システム10のサーバ12から、日々蓄積されている第1の病理画像と、第1の病理画像に対する閲覧履歴情報とを取得する。また、導出装置100は、第1の病理画像に対応する診断結果に関する診断情報を医療情報システム30から取得する。導出装置100は、第1の病理画像と、閲覧履歴情報と、診断情報とを対応付けて学習することで、第1の患部組織とは異なる第2の患部組織に対応する第2の病理画像から注目領域を推定するための学習モデルを生成する。詳細は後述するが、例えば、導出装置100は、診断結果が陽性であった第1の病理画像のうち、病理医が拡大して表示した領域や、病理医が長時間かけて閲覧した領域や、病理医が何度も繰り返し閲覧した領域と類似する第2の病理画像の領域を注目領域として推定するための学習モデルを生成する。
そして、病理システム20において、顕微鏡21により第2の患部組織に対応する第2の病理画像が生成されたものとする。このとき、表示制御装置23は、医師や病理医等のユーザから第2の病理画像の表示要求を受けると、第2の病理画像を導出装置100に送る。導出装置100は、学習モデルを用いて、第2の病理画像から第2の病理画像の注目領域を示す診断支援情報を導出し、導出した診断支援情報を表示制御装置23に出力する。表示制御装置23は、第2の病理画像とともに、診断支援情報に基づく注目領域を表示装置24に表示するよう制御する。
このように、導出装置100は、病理医が病理診断時に必ず行う行動である病理画像の閲覧に関する閲覧履歴情報に基づいて、注目領域に関する情報を診断支援情報として導出する。すなわち、導出装置100は、日々蓄積される病理医の閲覧履歴情報を用いるので、多くの時間と作業者を要することなく、注目領域を推定することができる。そして、導出装置100は、注目領域が表示装置24に表示されることで、病理医による診断の精度を向上させることができる。例えば、病理医によって診断にばらつきがある場合もあるが、病理画像に注目領域が表示されることで、どの病理医でも注目すべき領域を丁寧に観察して診断することができるので、診断のばらつきを低減することができる。
また、導出装置100は、診断情報を用いて学習を行うので、診断結果が陽性であった場合に注目された領域を診断支援情報として導出することができる。このため、導出装置100は、診断に影響がある領域を提供することができるので、診断の精度を向上させることができる。
また、上記では、病理画像にアノテーションを付与する作業に多くの時間と作業者を要すると説明した。しかし、作業者が、導出装置100によって導出される診断支援情報を参照して、アノテーションを付与する作業を行ってもよい。これにより、アノテーション付きの病理画像を効率的に生成することができるので、大量の学習データに基づいて機械学習を行うことが可能となる。
なお、上記では、病理システム10のサーバ12に保存された病理画像を学習データとして学習モデルを生成する例を示したが、導出装置100は、病理システム20のサーバ22に保存された病理画像を学習データとして学習モデルを生成してもよいし、サーバ12に保存された病理画像と、サーバ22に保存された病理画像との双方を学習データとして学習モデルを生成してもよい。すなわち、導出装置100は、過去に閲覧されたことがある病理画像であれば学習データとして用いることができる。また、上記では、導出装置100が表示制御装置23に診断支援情報を提供する例を示したが、導出装置100は、表示制御装置13に診断支援情報を提供してもよい。
また、上記例では、病理システム10と病理システム20とを分けて説明したが、病理システム10と病理システム20とは同一のシステムであってもよい。より具体的には、診断支援システム1には、病理システム10のみが含まれていてもよい。この場合、導出装置100は、サーバ12に保存されている第1の病理画像から学習モデルを生成し、表示制御装置13からの要求に応じて診断支援情報を表示制御装置13へ提供する。また、診断支援システム1に含まれる病理システムは3個以上であってもよい。この場合、導出装置100は、それぞれの病理システムに蓄積される病理画像を収集して学習モデルを生成してもよい。また、上記例において、医療情報システム30は、病理システム10又は20と同一のシステムであってもよい。すなわち、診断情報は、サーバ12又は22に保存されてもよい。
ここまで診断支援システム1について簡単に説明した。以下では、各装置の構成及び処理を詳細に説明するが、これらの説明の前提となる各種情報(病理画像のデータ構造、病理画像の閲覧履歴情報、診断情報)を最初に説明する。なお、以下では、導出装置100が、病理システム10に蓄積される学習データを用いて学習を行い、病理システム20に診断支援情報を提供する例を示す。
[2.各種情報について]
[2-1.病理画像]
上記の通り、病理画像は、顕微鏡11や顕微鏡21によって観察対象物が撮像されることで生成される。まず、図2及び図3を用いて、顕微鏡11や顕微鏡21による撮像処理を説明する。図2及び図3は、第1の実施形態に係る撮像処理を説明するための図である。顕微鏡11と顕微鏡21とは同様の撮像処理を行うため、ここでは顕微鏡11を例に挙げて説明する。以下に説明する顕微鏡11は、低解像度で撮像するための低解像度撮像部と、高解像度で撮像するための高解像度撮像部とを有する。
[2-1.病理画像]
上記の通り、病理画像は、顕微鏡11や顕微鏡21によって観察対象物が撮像されることで生成される。まず、図2及び図3を用いて、顕微鏡11や顕微鏡21による撮像処理を説明する。図2及び図3は、第1の実施形態に係る撮像処理を説明するための図である。顕微鏡11と顕微鏡21とは同様の撮像処理を行うため、ここでは顕微鏡11を例に挙げて説明する。以下に説明する顕微鏡11は、低解像度で撮像するための低解像度撮像部と、高解像度で撮像するための高解像度撮像部とを有する。
図2には、顕微鏡11の撮影可能な領域である撮像領域R10に、観察対象物A10が収められたガラススライドG10が含まれる。ガラススライドG10は、例えば図示しないステージに置かれる。顕微鏡11は、低解像度撮像部により撮像領域R10を撮像することで観察対象物A10が全体的に撮像された病理画像である全体画像を生成する。図2に示すラベル情報L10は、観察対象物A10を識別するための識別情報(例えば、文字列やQRコード(登録商標))が記載される。ラベル情報L10に記載される識別情報と患者を対応付けておくことで、全体画像に対応する患者を特定することが可能になる。図2の例では、識別情報として「#001」が記載されている。なお、ラベル情報L10には、例えば、観察対象物A10の簡単な説明が記載されてもよい。
続いて、顕微鏡11は、全体画像を生成した後に、全体画像から観察対象物A10が存在する領域を特定し、観察対象物A10が存在する領域を所定サイズ毎に分割した各分割領域を高解像度撮像部により順次撮像する。例えば、図3に示すように、顕微鏡11は、最初に領域R11を撮像し、観察対象物A10の一部領域を示す画像である高解像度画像I11を生成する。続いて、顕微鏡11は、ステージを移動させることで、領域R12を高解像度撮像部により撮像し、領域R12に対応する高解像度画像I12を生成する。同様にして、顕微鏡11は、領域R13、R14、・・・に対応する高解像度画像I13、I14、・・・を生成する。図3では領域R18までしか図示していないが、顕微鏡11は、ステージを順次移動させることで、観察対象物A10に対応する全ての分割領域を高解像度撮像部により撮像し、各分割領域に対応する高解像度画像を生成する。
ところで、ステージを移動させる際にガラススライドG10がステージ上で移動することがある。ガラススライドG10が移動すると、観察対象物A10のうち未撮影の領域が発生するおそれがある。顕微鏡11は、図3に示すように、隣り合う分割領域が一部重なるように、高解像度撮像部により撮像することで、ガラススライドG10が移動した場合であっても、未撮影領域の発生を防止することができる。
なお、上述した低解像度撮像部と高解像度撮像部とは、異なる光学系であってもよいし、同一の光学系であってもよい。同一の光学系である場合には、顕微鏡11は、撮像対象に応じて解像度を変更する。また、上記では、ステージを移動させることで撮像領域を変更する例を示したが、顕微鏡11が光学系(高解像度撮像部など)を移動させることで撮像領域を変更してもよい。また、図3では、顕微鏡11が観察対象物A10の中央部から撮像する例を示した。しかし、顕微鏡11は、図3に示した撮像順とは異なる順序で観察対象物A10を撮像してもよい。例えば、顕微鏡11は、観察対象物A10の外周部から撮像してもよい。また、上記では、観察対象物A10が存在する領域のみを高解像度撮像部で撮像する例を示した。しかし、観察対象物A10が存在する領域を正確に検出できない場合もあるので、顕微鏡11は、図2に示した撮像領域R10又はガラススライドG10の全領域を分割して高解像度撮像部で撮像してもよい。
続いて、顕微鏡11によって生成された各々の高解像度画像は、所定のサイズに分割される。これにより、高解像度画像から部分画像(以下、タイル画像と表記する)が生成される。この点について、図4を用いて説明する。図4は、部分画像(タイル画像)の生成処理を説明するための図である。図4には、図3に示した領域R11に対応する高解像度画像I11を示す。なお、以下では、サーバ12によって、高解像度画像から部分画像が生成されるものとして説明する。しかし、サーバ12以外の装置(例えば、顕微鏡11内部に搭載される情報処理装置など)によって部分画像が生成されてもよい。
図4に示す例では、サーバ12は、1つの高解像度画像I11を分割することで、100個のタイル画像T11、T12、・・・を生成する。例えば、高解像度画像I11の解像度が2560×2560[pixel:ピクセル]である場合、サーバ12は、高解像度画像I11から、解像度が256×256[pixel:ピクセル]である100個のタイル画像T11、T12、・・・を生成する。同様にして、サーバ12は、他の高解像度画像も同様のサイズに分割することでタイル画像を生成する。
なお、図4の例において、領域R111、R112、R113、R114は、隣り合う他の高解像度画像(図4には図示しない)と重複する領域である。サーバ12は、重複する領域をテンプレートマッチング等の技法により位置合わせを行うことで、互いに隣り合う高解像度画像にスティッチング処理を施す。この場合、サーバ12は、スティッチング処理後に高解像度画像を分割することでタイル画像を生成してもよい。または、サーバ12は、スティッチング処理前に、領域R111、R112、R113及びR114以外の領域のタイル画像を生成し、スティッチング処理後に、領域R111、R112、R113及びR114のタイル画像を生成してもよい。
このようにして、サーバ12は、観察対象物A10の撮像画像の最小単位となるタイル画像を生成する。そして、サーバ12は、最小単位のタイル画像を順次合成することで、階層の異なるタイル画像を生成する。具体的には、サーバ12は、隣り合う所定数のタイル画像を合成することで、1つのタイル画像を生成する。この点について、図5及び図6を用いて説明する。図5及び図6は、第1の実施形態に係る病理画像を説明するための図である。
図5の上段には、サーバ12によって各高解像度画像から生成された最小単位のタイル画像群を示す。図5の上段の例において、サーバ12は、タイル画像のうち、互いに隣り合う4つのタイル画像T111、T112、T211、T212を合成することで、1つのタイル画像T110を生成する。例えば、タイル画像T111、T112、T211、T212の解像度がそれぞれ256×256である場合、サーバ12は、解像度が256×256であるタイル画像T110を生成する。同様にして、サーバ12は、互いに隣り合う4つのタイル画像T113、T114、T213、T214を合成することで、タイル画像T120を生成する。このようにして、サーバ12は、最小単位のタイル画像を所定数ずつ合成したタイル画像を生成する。
また、サーバ12は、最小単位のタイル画像を合成した後のタイル画像のうち、互いに隣り合うタイル画像を更に合成したタイル画像を生成する。図5の例において、サーバ12は、互いに隣り合う4つのタイル画像T110、T120、T210、T220を合成することで、1つのタイル画像T100を生成する。例えば、タイル画像T110、T120、T210、T220の解像度が256×256である場合、サーバ12は、解像度が256×256であるタイル画像T100を生成する。例えば、サーバ12は、互いに隣り合う4つのタイル画像を合成した解像度512×512の画像から、4画素平均や、重み付けフィルタ(近い画素を遠い画素よりも強く反映する処理)や、1/2間引き処理等を施すことにより、解像度が256×256であるタイル画像を生成する。
サーバ12は、このような合成処理を繰り返すことで、最終的には、最小単位のタイル画像の解像度と同様の解像度を有する1つのタイル画像を生成する。例えば、上記例のように、最小単位のタイル画像の解像度が256×256である場合、サーバ12は、上述した合成処理を繰り返すことにより、最終的に解像度が256×256である1つのタイル画像T1を生成する。
図6に、図5に示したタイル画像を模式的に示す。図6に示した例では、最下層のタイル画像群は、サーバ12によって生成された最小単位のタイル画像である。また、下から2階層目のタイル画像群は、最下層のタイル画像群が合成された後のタイル画像である。そして、最上層のタイル画像T1は、最終的に生成される1つのタイル画像であることを示す。このようにして、サーバ12は、病理画像として、図6に示すピラミッド構造のような階層を有するタイル画像群を生成する。
なお、図5に示す領域Dは、表示装置14又は24等のディスプレイ画面に表示される領域の一例を示す。例えば、表示装置が表示可能な解像度が、縦3個分のタイル画像であり、横4個分のタイル画像であるものとする。この場合、図5に示す領域Dのように、表示対象のタイル画像が属する階層によって、表示装置に表示される観察対象物A10の詳細度が変わる。例えば、最下層のタイル画像が用いられる場合には、観察対象物A10の狭い領域が詳細に表示される。また、上層のタイル画像が用いられるほど観察対象物A10の広い領域が粗く表示される。
サーバ12は、図6に示したような各階層のタイル画像を図示しない記憶部に記憶する。例えば、サーバ12は、各タイル画像を一意に識別可能なタイル識別情報(部分画像情報の一例)とともに、各タイル画像を記憶する。この場合、サーバ12は、他の装置(例えば、表示制御装置13や導出装置100)からタイル識別情報を含むタイル画像の取得要求を受け付けた場合に、タイル識別情報に対応するタイル画像を他の装置へ送信する。また、例えば、サーバ12は、各階層を識別する階層識別情報と、同一階層内で一意に識別可能なタイル識別情報とともに、各タイル画像を記憶してもよい。この場合、サーバ12は、他の装置から階層識別情報とタイル識別情報を含むタイル画像の取得要求を受け付けた場合に、階層識別情報に対応する階層に属するタイル画像のうち、タイル識別情報に対応するタイル画像を他の装置へ送信する。
なお、サーバ12は、図6に示したような各階層のタイル画像をサーバ12以外の他の記憶装置に記憶してもよい。例えば、サーバ12は、クラウドサーバ等に各階層のタイル画像を記憶してもよい。また、図5及び図6に示したタイル画像の生成処理はクラウドサーバ等で実行されてもよい。
また、サーバ12は、全ての階層のタイル画像を記憶しなくてもよい。例えば、サーバ12は、最下層のタイル画像のみを記憶してもよいし、最下層のタイル画像と最上層のタイル画像のみを記憶してもよいし、所定の階層(例えば、奇数番目の階層、偶数番目の階層など)のタイル画像のみを記憶してもよい。このとき、サーバ12は、記憶していない階層のタイル画像を他の装置から要求された場合には、記憶しているタイル画像を動的に合成することで、他の装置から要求されたタイル画像を生成する。このように、サーバ12は、保存対象のタイル画像を間引くことで、記憶容量の圧迫を防止することができる。
また、上記例では撮像条件について言及しなかったが、サーバ12は、撮像条件毎に、図6に示したような各階層のタイル画像を記憶してもよい。撮像条件の例としては、被写体(観察対象物A10など)に対する焦点距離が挙げれられる。例えば、顕微鏡11は、同一の被写体に対して焦点距離を変更しながら撮像してもよい。この場合、サーバ12は、焦点距離毎に、図6に示したような各階層のタイル画像を記憶してもよい。なお、焦点距離を変更する理由は、観察対象物A10によっては半透明であるため、観察対象物A10の表面を撮像するために適した焦点距離や、観察対象物A10の内部を撮像するために適した焦点距離があるからである。言い換えれば、顕微鏡11は、焦点距離を変更することで、観察対象物A10の表面を撮像した病理画像や、観察対象物A10の内部を撮像した病理画像を生成することができる。
また、撮像条件の他の例として、観察対象物A10に対する染色条件が挙げられる。具体的に説明すると、病理診断では、観察対象物A10のうち特定の部分(例えば、細胞の核など)に発光物を染色する場合がある。発光物とは、例えば、特定の波長の光が照射されると発光する物質である。そして、同一の観察対象物A10に対して異なる発光物が染色される場合がある。この場合、サーバ12は、染色された発光物毎に、図6に示したような各階層のタイル画像を記憶してもよい。
また、上述したタイル画像の数や解像度は一例であってシステムによって適宜変更可能である。例えば、サーバ12が合成するタイル画像の数は4つの限られない。例えば、サーバ12は、3×3=9個のタイル画像を合成する処理を繰り返してもよい。また、上記例ではタイル画像の解像度が256×256である例を示したが、タイル画像の解像度は256×256以外であってもよい。
表示制御装置13は、上述した階層構造のタイル画像群に対応可能なシステムを採用するソフトウェアを用い、ユーザの表示制御装置13を介した入力操作に応じて、階層構造のタイル画像群から所望のタイル画像を抽出し、これを表示装置14に出力する。具体的には、表示装置14は、ユーザにより選択された任意の解像度の画像のうちの、ユーザにより選択された任意の部位の画像を表示する。このような処理により、ユーザは、観察倍率を変えながら観察対象物を観察しているような感覚を得ることができる。すなわち、表示制御装置13は仮想顕微鏡として機能する。ここでの仮想的な観察倍率は、実際には解像度に相当する。
[2-2.閲覧履歴情報]
次に、図7を用いて、サーバ12又は22に保存される病理画像の閲覧履歴情報について説明する。図7は、病理画像の閲覧者による閲覧態様の一例を示す図である。図7に示した例では、病理医等の閲覧者が、病理画像I10のうち、領域D1、D2、D3、・・・、D7の順に閲覧したものとする。この場合、表示制御装置13は、閲覧者による閲覧操作に従って、最初に領域D1に対応する病理画像をサーバ12から取得する。サーバ12は、表示制御装置13からの要求に応じて、領域D1に対応する病理画像を形成する1以上のタイル画像を記憶部から取得し、取得した1以上のタイル画像を表示制御装置13へ送信する。そして、表示制御装置13は、サーバ12から取得した1以上のタイル画像から形成される病理画像を表示装置14に表示する。例えば、表示制御装置13は、タイル画像が複数である場合には、複数のタイル画像を並べて表示する。同様にして、表示制御装置13は、閲覧者によって表示領域の変更操作が行われるたびに、表示対象の領域(領域D2、D3、・・・、D7など)に対応する病理画像をサーバ12から取得し、表示装置14に表示する。
次に、図7を用いて、サーバ12又は22に保存される病理画像の閲覧履歴情報について説明する。図7は、病理画像の閲覧者による閲覧態様の一例を示す図である。図7に示した例では、病理医等の閲覧者が、病理画像I10のうち、領域D1、D2、D3、・・・、D7の順に閲覧したものとする。この場合、表示制御装置13は、閲覧者による閲覧操作に従って、最初に領域D1に対応する病理画像をサーバ12から取得する。サーバ12は、表示制御装置13からの要求に応じて、領域D1に対応する病理画像を形成する1以上のタイル画像を記憶部から取得し、取得した1以上のタイル画像を表示制御装置13へ送信する。そして、表示制御装置13は、サーバ12から取得した1以上のタイル画像から形成される病理画像を表示装置14に表示する。例えば、表示制御装置13は、タイル画像が複数である場合には、複数のタイル画像を並べて表示する。同様にして、表示制御装置13は、閲覧者によって表示領域の変更操作が行われるたびに、表示対象の領域(領域D2、D3、・・・、D7など)に対応する病理画像をサーバ12から取得し、表示装置14に表示する。
図7の例では、閲覧者は、最初に比較的広い領域D1を閲覧し、領域D1内に注意深く観察する領域がなかったため、閲覧領域を領域D2に移動させている。そして、閲覧者は、領域D2内に注意深く観察したい領域があったため、領域D2の一部領域を拡大して領域D3を閲覧している。そして、閲覧者は、さらに領域D2の一部領域である領域D4へ移動させている。そして、閲覧者は、領域D4内にさらに注意深く観察したい領域があったため、領域D4の一部領域を拡大して領域D5を閲覧している。このようにして、閲覧者は、領域D6、D7についても閲覧している。例えば、領域D1、D2、D7に対応する病理画像が1.25倍率の表示画像であり、領域D3、D4に対応する病理画像が20倍率の表示画像であり、領域D5、D6に対応する病理画像が40倍率の表示画像である。表示制御装置13は、サーバ12に記憶されている階層構造のタイル画像群のうち、各倍率に対応する階層のタイル画像を取得して表示することになる。例えば、領域D1及びD2に対応するタイル画像の階層は、領域D3に対応するタイル画像の階層よりも上(すわなち、図6に示したタイル画像T1に近い階層)になる。
上記のように病理画像が閲覧されている間、表示制御装置13は、所定のサンプリング周期で閲覧情報を取得する。具体的には、表示制御装置13は、所定のタイミング毎に、閲覧された病理画像の中心座標と表示倍率を取得し、取得した閲覧情報をサーバ12の記憶部に格納する。
この点について、図8を用いて説明する。図8は、サーバ12が有する閲覧履歴記憶部12aの一例を示す図である。図8に示すように、閲覧履歴記憶部12aは、「サンプリング」、「中心座標」、「倍率」、「時間」といった情報を記憶する。「サンプリング」は、閲覧情報を記憶するタイミングの順番を示す。「中心座標」は、閲覧された病理画像の位置情報を示す。ここの例では、中心座標は、閲覧された病理画像の中心位置が示す座標であって、最下層のタイル画像群の座標系の座標に該当する。「倍率」は、閲覧された病理画像の表示倍率を示す。「時間」は、閲覧が開始されてからの経過時間を示す。図8の例では、サンプリング周期が30秒であることを示す。すなわち、表示制御装置13は、30秒毎に閲覧情報を閲覧履歴記憶部12aに保存する。ただし、この例に限られず、サンプリング周期は、例えば0.1~10秒であってもよいし、この範囲外であってもよい。
図8の例において、サンプリング「1」は図7に示す領域D1の閲覧情報を示し、サンプリング「2」は領域D2の閲覧情報を示し、サンプリング「3」及び「4」は領域D3の閲覧情報を示し、サンプリング「5」は領域D4の閲覧情報を示し、サンプリング「6」、「7」及び「8」は領域D5の閲覧情報を示す。つまり、図8の例では、領域D1が30秒程度閲覧され、領域D2が30秒程度閲覧され、領域D3が60秒程度閲覧され、領域D4が30秒程度閲覧され、領域D5が90秒程度閲覧されたことを示す。このように、閲覧履歴情報から、各領域の閲覧時間を抽出することができる。
また、閲覧履歴情報から各領域を閲覧した回数を抽出することができる。例えば、表示領域の変更操作(例えば、表示領域の移動操作、表示サイズの変更操作)が行われるたびに、表示された病理画像の各画素の表示回数が1回ずつ増加するものとする。例えば、図7に示した例において、最初に領域D1が表示された場合、領域D1に含まれる各画素の表示回数は1回となる。次に領域D2が表示された場合には、領域D1と領域D2との双方に含まれる各画素の表示回数は2回となり、領域D1には含まれず領域D2に含まれる各画素の表示回数は1回となる。閲覧履歴記憶部12aの中心座標及び倍率を参照することで表示領域を特定可能であるので、閲覧履歴記憶部12aに記憶されている閲覧履歴情報を分析することで、病理画像の各画素(各座標ともいえる)が表示された回数を抽出することができる。
表示制御装置13は、閲覧者から所定時間(例えば5分)、表示位置を変更する操作が行われなかった場合には、閲覧情報の記憶処理を中断してもよい。また、上記例では、中心座標と倍率によって閲覧された病理画像を閲覧情報として記憶する例を示したが、この例に限られず、閲覧情報は、閲覧された病理画像の領域を特定可能な情報であれば如何なる情報であってもよい。例えば、表示制御装置13は、閲覧された病理画像に対応するタイル画像を識別するタイル識別情報や、閲覧された病理画像に対応するタイル画像の位置示す情報を、病理画像の閲覧情報として記憶してもよい。また、図8では、図示することを省略したが、閲覧履歴記憶部12aには、患者、カルテ等を識別する情報が記憶される。すなわち、図8に示した閲覧履歴記憶部12aは、閲覧情報と、患者やカルテ等と対応付け可能に記憶される。
[2-3.診断情報]
次に、図9A~図9Cを用いて、医療情報システム30に記憶される診断情報について説明する。図9A~図9Cは、医療情報システム30が有する診断情報記憶部を示す図である。図9A~図9Cでは、それぞれ検査対象の臓器毎に異なるテーブルで診断情報を記憶する例を示す。例えば、図9Aは、乳がん検査に関する診断情報を記憶するテーブルの例を示し、図9Bは、肺がん検査に関する診断情報を記憶するテーブルの例を示し、図9Cは、大腸検査に関する診断情報を記憶するテーブルの例を示す。
次に、図9A~図9Cを用いて、医療情報システム30に記憶される診断情報について説明する。図9A~図9Cは、医療情報システム30が有する診断情報記憶部を示す図である。図9A~図9Cでは、それぞれ検査対象の臓器毎に異なるテーブルで診断情報を記憶する例を示す。例えば、図9Aは、乳がん検査に関する診断情報を記憶するテーブルの例を示し、図9Bは、肺がん検査に関する診断情報を記憶するテーブルの例を示し、図9Cは、大腸検査に関する診断情報を記憶するテーブルの例を示す。
図9Aに示す診断情報記憶部30Aは、「患者ID」、「病理画像」、「診断結果」、「グレード」、「組織型」、「遺伝子検査」、「超音波検査」、「投薬」といった情報を記憶する。「患者ID」は、患者を識別するための識別情報を示す。「病理画像」は、病理医が診断時に保存した病理画像を示す。「病理画像」には、画像自体ではなく、全体画像に対する、保存対象の画像領域を示す位置情報(中心座標と倍率など)が記憶されてもよい。「診断結果」は、病理医による診断結果であり、例えば、病変部位の有無、病変部位の種類を示す。「グレード」は、病気部位の進行度を示す。「組織型」は、病気部位の種類を示す。「遺伝子検査」は、遺伝子検査の結果を示す。「超音波検査」は、超音波検査の結果を示す。投薬は、患者への投薬に関する情報を示す。
図9Bに示す診断情報記憶部30Bは、図9Aに示した診断情報記憶部30Aに記憶される「超音波検査」の代わりに、肺がん検査で行われる「CT検査」に関する情報を記憶する。図9Cに示す診断情報記憶部30Cは、図9Aに示した診断情報記憶部30Aに記憶される「超音波検査」の代わりに、大腸検査で行われる「内視鏡検査」に関する情報を記憶する。
図9A~図9Cの例において、「診断結果」に「正常」が記憶されている場合には、病理診断の結果が陰性であったことを示し、「診断結果」に「正常」以外の情報が記憶されている場合には、病理診断の結果が陽性であったことを示す。
[3.装置構成]
[3-1.第1の実施形態に係る導出装置]
次に、第1の実施形態に係る導出装置100について説明する。ここでは、導出装置100とともに表示制御装置23についても説明する。図10は、第1の実施形態に係る導出装置100及び表示制御装置23の一例を示す図である。図10に示すように、導出装置100は、通信部110と、記憶部120と、制御部130とを有するコンピュータである。
[3-1.第1の実施形態に係る導出装置]
次に、第1の実施形態に係る導出装置100について説明する。ここでは、導出装置100とともに表示制御装置23についても説明する。図10は、第1の実施形態に係る導出装置100及び表示制御装置23の一例を示す図である。図10に示すように、導出装置100は、通信部110と、記憶部120と、制御部130とを有するコンピュータである。
通信部110は、例えば、NIC(Network Interface Card)等によって実現される。通信部110は、図示しないネットワークと有線又は無線で接続され、ネットワークを介して、病理システム10、病理システム20、医療情報システム30等との間で情報の送受信を行う。後述する制御部130は、通信部110を介して、これらの装置との間で情報の送受信を行う。
記憶部120は、例えば、RAM(Random Access Memory)、フラッシュメモリ(Flash Memory)等の半導体メモリ素子、または、ハードディスク、光ディスク等の記憶装置によって実現される。記憶部120は、制御部130によって生成される学習モデル121を記憶する。学習モデル121については後述する。
制御部130は、例えば、CPU(Central Processing Unit)やMPU(Micro Processing Unit)によって、導出装置100内部に記憶されたプログラム(診断支援プログラムの一例)がRAM(random Access Memory)等を作業領域として実行されることにより実現される。また、制御部130は、例えばASIC(Application specific Integrated Circuit)やFPGA(Field Programmable gate Array)等の集積回路により実行されてもよい。
図10に示すように、制御部130は、履歴情報取得部131と、診断情報取得部132と、学習部133と、導出部134とを有し、以下に説明する情報処理の機能や作用を実現または実行する。なお、制御部130の内部構成は、図10に示した構成に限られず、後述する情報処理を行う構成であれば他の構成であってもよい。
履歴情報取得部131は、学習部133で行われる学習処理に用いられる情報を、通信部110を介し、取得する。具体的には、履歴情報取得部131は、病理システム10のサーバ12に記憶されている、第1の患部組織に対応する第1の病理画像と、第1の病理画像に対する閲覧に関する閲覧履歴情報とを取得する。履歴情報取得部131によって取得される閲覧履歴情報には、図8に示した例のように、病理医が第1の病理画像のうち拡大して閲覧した領域に関する情報や、病理医が第1の病理画像のうち相対的に長時間かけて閲覧した領域に関する情報や、病理医が第1の病理画像の各領域を閲覧した回数に関する情報が含まれる。
診断情報取得部132は、学習部133で行われる学習処理に用いられる情報を、通信部110を介し、取得する。具体的には、診断情報取得部132は、医療情報システム30から、第1の病理画像に対応する第1の患部組織に対する診断情報を取得する。
学習部133は、履歴情報取得部131によって取得された第1の病理画像及び閲覧履歴情報と、診断情報取得部132によって取得された診断情報との対応を学習する。これにより、学習部133は、第2の病理画像における注目領域を推定するための学習モデルを生成する。そして、学習部133は、学習モデル121を記憶部120に記憶させる。
学習部133による学習処理についてより具体的に説明する。最初に、学習部133は、学習データを生成する。具体的には、学習部133は、履歴情報取得部131によって取得された閲覧履歴情報に基づいて、第1の病理画像に注目領域に関する情報を反映させたヒートマップ画像を生成する。例えば、学習部133は、第1の病理画像の各画素に対して、閲覧者によって注目されたほど大きい指標値(以下、注目指標値と表記する)を対応付ける。
一例を挙げると、学習部133は、表示倍率が高い画素ほど高い注目指標値を対応付ける。図7に示した例を用いて説明すると、領域D1に対応する病理画像が1.25倍率の表示画像であり、領域D3に対応する病理画像が20倍率の表示画像であり、領域D5に対応する病理画像が40倍率の表示画像であるものとする。この場合、学習部133は、領域D1に含まれる各画素の注目指標値よりも、領域D3に含まれる各画素の注目指標値を高くする。また、学習部133は、領域D3に含まれる各画素の注目指標値よりも、領域D5に含まれる各画素の注目指標値を高くする。
また、例えば、学習部133は、閲覧時間が長い画素ほど高い注目指標値を対応付ける。図8の例では、領域D1が30秒程度閲覧され、領域D3が60秒程度閲覧され、領域D5が90秒程度閲覧されたことを示す。この場合、学習部133は、領域D1に含まれる各画素の注目指標値よりも、領域D3に含まれる各画素の注目指標値を高くする。また、学習部133は、領域D3に含まれる各画素の注目指標値よりも、領域D5に含まれる各画素の注目指標値を高くする。
また、例えば、学習部133は、閲覧回数が多い画素ほど高い注目指標値を対応付ける。なお、学習部133は、拡大率、閲覧時間及び閲覧回数のうち、1つのみ情報を用いて注目指標値を対応付けてもよいし、2以上の情報を用いて注目指標値を対応付けてもよい。このようにして、学習部133は、履歴情報取得部131によって取得されたそれぞれの第1の病理画像の各画素に注目指標値を対応付けたヒートマップ画像を生成する。なお、ヒートマップ画像は、例えば、第1の病理画像の画素と、かかる画素に対応する注目指標値との組合せであるデータの集合であり、注目指標値により示した閲覧履歴情報であるといえる。
続いて、学習部133は、第1の病理画像と、第1の病理画像に対応するヒートマップ画像と、第1の病理画像に対応する診断情報との組合せを学習データとして機械学習を行う。例えば、学習部133は、診断結果が陽性(例えば、診断情報記憶部30A~30Cの診断結果が「正常」以外)である学習データを正例とし、診断結果が陰性(例えば、診断情報記憶部30A~30Cの診断結果が「正常」)である学習データを負例として学習する。学習部133による学習処理はブラックボックスであるため概念的な説明になるが、学習部133は、新たな病理画像(第2の病理画像)の各領域の中から、診断結果が陽性であった第1の病理画像群において注目指標値が高い傾向にある領域と画像特徴量が類似する領域ほど高いスコア(以下、注目スコアとする)を出力する学習モデル121を生成する。
学習モデル121によって出力される第2の病理画像の各領域に対する注目スコアは、かかる領域と同様の領域が過去に病理医によって注目された度合いを示すといえる。ここで、病理医は、病変部がある領域ほど注目して閲覧するので、病理医によって注目された領域とは、病変部が存在する可能性が高い領域であるといえる。すなわち、学習モデル121によって出力される注目スコアは、該当の領域に病変部が存在する確率を示すともいえる。例えば、学習データ用の第1の病理画像が癌検査に用いられた画像である場合には、各領域の注目スコアは、各領域に癌組織が存在する確率、すなわち、診断に影響があると推定される領域を示すともいえる。
なお、上記例では、診断結果が陽性である第1の病理画像を正例としたが、診断結果が陽性であっても第1の病理画像に描出される全ての観察対象物が陽性であるわけではなく、第1の病理画像の一部領域に描出される観察対象物が病変部であることが多い。このため、学習部133は、診断結果が陽性である第1の病理画像のうち、注目指標値が所定の閾値TH1以上である領域のみを正例とし、注目指標値が所定の閾値TH1よりも小さい領域を負例として学習してもよい。また、学習部133は、診断結果が陽性である第1の病理画像のみを用いて学習してもよい。
例えば、学習部133による学習は弱教師学習を適用することが可能であり、下記のような手法も用いることができる。
“WILDCAT: Weakly Supervised Learning of Deep ConvNets for Image Classification, Pointwise Localization and Segmentation”, CVPR 2017
(http://webia.lip6.fr/~durandt/pdfs/2017_CVPR/Durand_WILDCAT_CVPR_2017.pdf)
“Attention-based Deep Multiple Instance Learning”, 2018(https://arxiv.org/abs/1802.04712)
“WILDCAT: Weakly Supervised Learning of Deep ConvNets for Image Classification, Pointwise Localization and Segmentation”, CVPR 2017
(http://webia.lip6.fr/~durandt/pdfs/2017_CVPR/Durand_WILDCAT_CVPR_2017.pdf)
“Attention-based Deep Multiple Instance Learning”, 2018(https://arxiv.org/abs/1802.04712)
ただし、学習部133による学習手法はいかなるアルゴリズムの基づくものであってもよい。例えば、学習部133は、多層のニューラルネットワーク(Deep Neural Network)による機械学習手法である深層学習(ディープラーニング)、サポートベクターマシン(support vector machine)、クラスタリング、強化学習等の各種学習アルゴリズムを用いて学習モデルを生成することができる。
また、学習部133は、全ての第1の病理画像を用いて学習を行わなくてもよい。例えば、学習部133は、特に注目された第1の病理画像のみを用いて学習を行ってもよい。例えば、学習部133は、所定の時間以上閲覧された領域を含む第1の病理画像のみを用いて学習を行ってもよいし、所定の倍率で閲覧された領域を含む第1の病理画像のみを用いて学習を行ってもよいし、所定の回数以上閲覧された領域を含む第1の病理画像のみを用いて学習を行ってもよい。また、例えば、学習部133は、所定の時間以上閲覧された領域のみを用いて学習を行ってもよいし、所定の倍率で閲覧された領域のみを用いて学習を行ってもよいし、所定の回数以上閲覧された領域のみを用いて学習を行ってもよい。また、例えば、学習部133は、第1の病理画像のうち中心領域が注目された領域であるとして、第1の病理画像のうち中心領域のみを切り出して学習を行ってもよい。
また、上記では、学習部133が学習データとしてヒートマップ画像を生成する例を示した。しかし、ヒートマップ画像を生成する処理は、顕微鏡11や、サーバ12などで行われてもよい。そして、ヒートマップ画像はサーバ12に記憶されていてもよい。この場合、履歴情報取得部131は、閲覧履歴情報として、サーバ12からヒートマップ画像とを取得する。
導出部134は、表示制御装置23から第2の病理画像を取得して、学習モデルに適応することで、閲覧履歴情報から推定される第2の病理画像の注目領域に基づいて、第2の病理画像の閲覧に関する情報である診断支援情報を導出する。具体的には、導出部134は、第1の病理画像の表示倍率が大きい領域ほど注目度が高い注目領域とし、または、第1の病理画像の閲覧時間が長い領域ほど注目度が高い注目領域とし、または、第1の病理画像の閲覧回数が多い領域ほど注目度が高い注目領域として、診断支援情報を導出する。そして、導出部134は、導出結果である診断支援情報を表示制御装置23に出力する。
一例を挙げて説明する。導出部134は、表示制御装置23から第2の病理画像とともに、第2の病理画像の注目領域を推定する旨の要求を受け付ける。第2の病理画像は、例えば、病理医によって診断が行われている病理画像である。そして、導出部134は、記憶部120に記憶されている学習モデル121を用いて、第2の病理画像の注目領域を推定する。上記の通り、学習モデル121は、診断結果が陽性であった病理画像のうち、病理医に注目された領域と類似する領域ほど高くなる注目スコアを出力する。このような注目スコアは、病理診断における重要度、すわなち、診断への影響度を示すといえる。導出部134は、学習モデル121を用いて算出した注目スコアが所定の閾値TH2よりも高い第2の病理画像の領域を注目領域として特定する。そして、導出部134は、第2の病理画像の注目領域に関する位置情報を示す診断支援情報を表示制御装置23へ送信する。例えば、導出部134は、位置情報として、座標やタイル画像に関する情報(タイル識別情報、または、階層識別情報とタイル識別情報の組合せ)を表示制御装置23へ送信する。
[3-2.第1の実施形態に係る表示制御装置]
続いて、表示制御装置23について説明する。表示制御装置23は、上述したタイル画像等の病理画像を表示するための病理画像表示制御プログラムが搭載される。ただし、これに限られず、病理画像表示制御プログラムは、サーバからダウンロード、またはDVD(Digital Versatile Disc)などの記憶媒体から、汎用的なコンピュータにインストールされることで、以下に説明する表示制御装置23による処理を実現してもよい。また、一部の処理をサーバ上で行い、その他の処理を処理を表示制御装置23等のクライアントコンピュータで行うなど、2台以上の機器で処理を行うことで、以下に説明する表示制御装置23による処理を実現してもよい。また、病理画像表示制御プログラムがクラウド上で動作することで、以下に説明する表示制御装置23による処理を実現してもよい。
続いて、表示制御装置23について説明する。表示制御装置23は、上述したタイル画像等の病理画像を表示するための病理画像表示制御プログラムが搭載される。ただし、これに限られず、病理画像表示制御プログラムは、サーバからダウンロード、またはDVD(Digital Versatile Disc)などの記憶媒体から、汎用的なコンピュータにインストールされることで、以下に説明する表示制御装置23による処理を実現してもよい。また、一部の処理をサーバ上で行い、その他の処理を処理を表示制御装置23等のクライアントコンピュータで行うなど、2台以上の機器で処理を行うことで、以下に説明する表示制御装置23による処理を実現してもよい。また、病理画像表示制御プログラムがクラウド上で動作することで、以下に説明する表示制御装置23による処理を実現してもよい。
図10に示すように、表示制御装置23は、画像取得部23a、表示制御部23bとを有し、以下に説明する情報処理の機能や作用を実現または実行するコンピュータである。なお、表示制御装置23の内部構成は、図10に示した構成に限られず、後述する情報処理を行う構成であれば他の構成であってもよい。また、画像取得部23a及び表示制御部23bは、例えば、CPUやMPUによって、表示制御装置23内部に記憶された表示制御プログラムがRAM等を作業領域として実行されることにより実現される。また、画像取得部23a及び表示制御部23bは、例えばASICやFPGA等の集積回路により実行されてもよい。
画像取得部23aは、サーバ22から第2の病理画像を取得し、取得した第2の病理画像を導出装置100へ送信する。例えば、画像取得部23aは、病理医による操作に従って、病理医が診断しようとしている第2の病理画像を導出装置100へ送信する。なお、画像取得部23aと表示制御部23bとは同一であってよく、導出装置100へ第2の病理画像を送信する処理は、表示制御部23bが行ってもよい。
表示制御部23bは、第2の病理画像に対応する診断支援情報を導出装置100から受け付ける。そして、表示制御部23bは、診断支援情報に基づいて、診断に影響があると推測される領域である注目領域を視認可能な状態で第2の病理画像を表示するよう表示装置24を制御する。なお、以下では、表示制御部23bが表示装置24を制御することで表示装置24に病理画像等の各種情報を表示することを、単に、表示制御部23bが各種情報を表示する、と表記する場合がある。
図11は、第1の実施形態に係る表示制御装置23による病理画像の表示例を示す図である。図11に示す例では、表示制御部23bは、全体表示領域H10に観察対象物A11を全体的に表示し、拡大表示領域H11に観察対象物A11の一部領域を拡大して表示し、さらに支援情報ボタンB10を表示する。例えば、表示制御部23bは、全体表示領域H10に、図6に示した階層構造のタイル画像群のうち、任意の階層のタイル画像から形成される病理画像I1を表示する。また、表示制御部23bは、拡大表示領域H11に、全体表示領域H10に表示したタイル画像よりも下の階層のタイル画像から形成される病理画像I2を表示する。
また、図11に示すように、表示制御部23bは、全体表示領域H10に、拡大表示領域H11に表示されている領域を示す拡大領域枠FRを表示する。病理医等の閲覧者は、拡大領域枠FRを移動操作(マウスのドラッグ操作など)することで、拡大表示領域H11に表示させる観察対象物A11の領域を変更することができる。これにより、閲覧者は、全体表示領域H10で観察対象物A11の全体を把握しながら、拡大表示領域H11の病理画像を閲覧することで観察対象物A11の一部をより詳細に確認することができる。
ここで、表示制御部23bは、閲覧者によって支援情報ボタンB10が選択された場合に、導出装置100から受け付けた診断支援情報に基づいて、拡大表示領域H11に表示されている病理画像I2のうち、注目すべき領域を視認可能な状態で表示する。例えば、表示制御部231は、拡大表示領域H11に表示される病理画像I2を導出装置100へ送信することで、病理画像I2に対応する診断支援情報を取得する。そして、表示制御部23bは、導出装置100から取得した診断支援情報に基づいて、注目すべき領域の外枠を点線で囲んだ枠画像RI10を表示する。これにより、閲覧者は、拡大表示領域H11に表示されている病理画像のうち、枠画像RI10が示す領域をより注意して観察すべきであると判断できる。
なお、表示制御部23bは、枠画像RI10が表示された状態で支援情報ボタンB10が再度選択された場合には、表示済みの枠画像RI10を非表示にしてもよい。これにより、閲覧者は、余計な情報が付加されていない病理画像を観察することができる。
図11の例では、拡大表示領域H11に枠画像RI10を表示する例を示したが、表示制御部23bは、拡大表示領域H11ではなく、全体表示領域H10に病理画像I1に対応する枠画像を表示してもよい。この場合、画像取得部23aは、病理画像I1を導出装置100へ送信することで、病理画像I1に対応する診断支援情報を取得する。これにより、閲覧者は、病理画像I1のうち枠画像が表示されている領域を拡大表示領域H11に表示させることができるので、観察対象物A11のうち注目すべき領域を全て注意深く観察することができる。また、表示制御部23bは、全体表示領域H10と拡大表示領域H11との双方に枠画像を表示してもよい。
また、表示制御装置23は、病理医が病理画像を閲覧するタイミングで診断支援情報を導出装置100からリアルタイムに取得してもよいが、サーバ22に記憶されている病理画像を定期的(例えば、1日1回)に導出装置100へ送信することで診断支援情報を予め取得しておいてもよい。
[4.処理手順]
[4-1.第1の実施形態に係る学習処理手順]
次に、図12及び図13を用いて、第1の実施形態に係る処理手順を説明する。図12は、第1の実施形態に係る学習処理手順を示すフローチャートである。図12に示すように、導出装置100は、学習タイミングであるか否かを判定する(ステップS101)。例えば、学習を行う学習日時が予め決められている場合、導出装置100は、現在日時が学習日時であるか否かを判定する。
[4-1.第1の実施形態に係る学習処理手順]
次に、図12及び図13を用いて、第1の実施形態に係る処理手順を説明する。図12は、第1の実施形態に係る学習処理手順を示すフローチャートである。図12に示すように、導出装置100は、学習タイミングであるか否かを判定する(ステップS101)。例えば、学習を行う学習日時が予め決められている場合、導出装置100は、現在日時が学習日時であるか否かを判定する。
そして、導出装置100は、学習タイミングである場合(ステップS101;Yes)、第1の病理画像と、第1の病理画像の閲覧履歴情報とをサーバ12から取得する(ステップS102)。また、導出装置100は、サーバ12から取得した第1の病理画像に対応する診断情報を医療情報システム30から取得する(ステップS103)。
続いて、導出装置100は、閲覧履歴情報(閲覧時間、閲覧回数、拡大倍率など)に基づくヒートマップ画像と診断結果との関係を学習する(ステップS104)。これにより、導出装置100は、学習モデル121を生成する(ステップS105)。そして、導出装置100は学習済みの学習モデル121を記憶部120に格納する。
なお、図12では、新たに学習モデル121を生成する例を示したが、導出装置100は、学習済みの学習モデル121を再学習する場合もある。この場合、導出装置100は、新たな学習データを用いて、学習モデル121を補正することになる。
[4-2.第1の実施形態に係る導出処理手順]
図13は、第1の実施形態に係る導出処理手順を示すフローチャートである。図13に示すように、導出装置100は、表示制御装置23から第2の病理画像を受け付けたか否かを判定する(ステップS201)。
図13は、第1の実施形態に係る導出処理手順を示すフローチャートである。図13に示すように、導出装置100は、表示制御装置23から第2の病理画像を受け付けたか否かを判定する(ステップS201)。
そして、導出装置100は、第2の病理画像を受け付けた場合(ステップS201;Yes)、記憶部120から学習済みの学習モデル121を取得する(ステップS202)。続いて、導出装置100は、学習モデル121を用いて、第2の病理画像のうち注目すべき領域を示す情報である診断支援情報を導出する(ステップS203)。そして、導出装置100は、診断支援情報を表示制御装置23へ送信する(ステップS204)。これにより、表示制御装置23は、図11に示した例のように、診断支援情報とともに第2の病理画像を表示するよう表示装置24を制御する。
[5.変形例1]
以下、図14~図22を用いて表示処理の変形例を説明する。図14~図22は、変形例に係る病理画像の表示例を示す図である。
以下、図14~図22を用いて表示処理の変形例を説明する。図14~図22は、変形例に係る病理画像の表示例を示す図である。
[5-1.表示例(1)]
図11では、1つの注目領域を示す情報(枠画像RI10)を表示する例を示したが、表示制御部23bは、複数の注目スコアの閾値毎に、かかる閾値以上の注目スコアに対応する注目領域を示す情報を表示してもよい。このとき、表示制御部23bは、注目スコア毎に注目領域を示す情報の表示態様を変更してもよい。また、図11では、注目領域を示す情報として、点線で囲まれた枠画像RI10を表示する例を示した。しかし、表示制御部23bは、注目領域を示す情報として、注目領域を半透明に覆うマスク画像を表示してもよい。また、表示制御部23bは、注目領域を示す情報が重畳されていない病理画像と、注目領域を示す情報が重畳されている病理画像とを並べて表示してもよい。
図11では、1つの注目領域を示す情報(枠画像RI10)を表示する例を示したが、表示制御部23bは、複数の注目スコアの閾値毎に、かかる閾値以上の注目スコアに対応する注目領域を示す情報を表示してもよい。このとき、表示制御部23bは、注目スコア毎に注目領域を示す情報の表示態様を変更してもよい。また、図11では、注目領域を示す情報として、点線で囲まれた枠画像RI10を表示する例を示した。しかし、表示制御部23bは、注目領域を示す情報として、注目領域を半透明に覆うマスク画像を表示してもよい。また、表示制御部23bは、注目領域を示す情報が重畳されていない病理画像と、注目領域を示す情報が重畳されている病理画像とを並べて表示してもよい。
この点について図14を用いて説明する。図14に示す例では、表示制御部23bは、表示画面の左側に、注目領域を示す情報を重畳せずに病理画像I21を表示し、表示画面の右側に、注目領域を示す情報を重畳した病理画像I21を表示する。ここでは、表示制御部23bは、注目領域を示す情報として、半透明に塗り潰されたマスク画像RI11、RI12及びRI13を表示する。なお、マスク画像RI11、RI12、RI13の順に注目スコアが高いものとする。例えば、マスク画像RI11は、注目スコアが閾値TH11以上である領域に重畳され、マスク画像RI12は、注目スコアが閾値TH12(>TH11)以上である連続する領域に重畳され、マスク画像RI13は、注目スコアが閾値TH13(>TH12)以上である連続する領域に重畳される。表示制御部23bは、注目スコアに応じて、マスク画像RI11、RI12、RI13の彩度、輝度、または透過度を変更してもよい。
また、図14に示すように、表示制御部23bは、表示切り替えボタンB11を表示する。表示制御部23bは、表示切り替えボタンB11が閲覧者によって選択された場合には、図14の下段に示すように、注目領域を示す情報が重畳されていない病理画像I21を非表示にしてもよい。そして、表示制御部23bは、注目領域を示す情報が重畳されていない病理画像I21が非表示である状態で、表示切り替えボタンB11が選択された場合には、図14の上段に示すように、注目領域を示す情報が重畳されていない病理画像I21を再度表示してもよい。この例に限られず、表示制御部23bは、表示切り替えボタンB11が選択されるたびに、注目領域を示す情報が重畳されていない病理画像I21と、注目領域を示す情報が重畳されている病理画像I21とを切り替えて表示してもよい。
[5-2.表示例(2)]
図14の例では、複数のマスク画像を表示する例を示した。しかし、表示制御部23bは、注目スコアの閾値毎に複数の枠画像を表示してもよい。この点について図15を用いて説明する。図15に示す例では、表示制御部23bは、注目領域を示す情報として、中が塗り潰されていない枠画像RI21、RI22及びRI23を病理画像I21に重畳して表示する。ここでは、枠画像RI21、RI22、RI23の順に注目スコアが高いものとする。図14の例と同様に、表示制御部23bは、注目スコアに応じて、枠画像RI21、RI22、RI23の彩度、輝度、または透過度を変更してもよい。
図14の例では、複数のマスク画像を表示する例を示した。しかし、表示制御部23bは、注目スコアの閾値毎に複数の枠画像を表示してもよい。この点について図15を用いて説明する。図15に示す例では、表示制御部23bは、注目領域を示す情報として、中が塗り潰されていない枠画像RI21、RI22及びRI23を病理画像I21に重畳して表示する。ここでは、枠画像RI21、RI22、RI23の順に注目スコアが高いものとする。図14の例と同様に、表示制御部23bは、注目スコアに応じて、枠画像RI21、RI22、RI23の彩度、輝度、または透過度を変更してもよい。
[5-3.表示例(3)]
また、表示制御部23bは、所定の注目スコア以上の注目領域に対応する病理画像を自動的に表示してもよい。例えば、表示制御部23bは、注目スコアが高い順に各病理画像を自動的に表示してもよい。また、例えば、表示制御部23bは、閲覧者の操作に従って、同一表示エリアに各注目領域に対応する病理画像を切り替えて表示装置24に表示してもよい。
また、表示制御部23bは、所定の注目スコア以上の注目領域に対応する病理画像を自動的に表示してもよい。例えば、表示制御部23bは、注目スコアが高い順に各病理画像を自動的に表示してもよい。また、例えば、表示制御部23bは、閲覧者の操作に従って、同一表示エリアに各注目領域に対応する病理画像を切り替えて表示装置24に表示してもよい。
この点について図16を用いて説明する。図16の上段に示す例では、表示制御部23bは、図14に示した例と同様に、マスク画像RI11、RI12及びRI13を病理画像I21に重畳して表示するとともに、自動検出ボタンB12を表示する。ここでは、表示制御部23bは、全体画像の中で注目スコアが最も高い領域を含む画像として、全体画像の一部領域に該当する病理画像I21を自動的に初期表示するものとする。そして、表示制御部23bは、自動検出ボタンB12が閲覧者によって選択された場合には、図16の下段に示すように、全体画像の中で注目スコアが2番目に高い領域を含む病理画像I22に表示を切り替える。表示制御部23bは、自動検出ボタンB12が選択されるたびに、注目スコアが次点に高い病理画像へ表示を切り替える。
[5-4.表示例(4)]
また、表示制御部23bは、図14及び図15の例ように、複数の枠画像やマスク画像を表示する場合に、閲覧者の操作に従って、表示する枠画像の数やマスク画像の数を変更してもよい。
また、表示制御部23bは、図14及び図15の例ように、複数の枠画像やマスク画像を表示する場合に、閲覧者の操作に従って、表示する枠画像の数やマスク画像の数を変更してもよい。
この点について図17を用いて説明する。図17の上段に示す例では、表示制御部23bは、図14に示した例と同様に、マスク画像RI11、RI12及びRI13を病理画像I21に重畳して表示するとともに、表示変更ボタンB13を表示する。ここでは、表示制御部23bは、3つのマスク画像RI11、RI12及びRI13を初期表示するものとする。そして、表示制御部23bは、表示変更ボタンB13が閲覧者によって選択された場合には、図17の中段に示すように、マスク画像RI11、RI12及びRI13のうち、注目スコアが最も低いマスク画像RI13を非表示にする。そして、表示制御部23bは、表示変更ボタンB13が更に選択された場合には、図17の下段に示すように、注目スコアが2番目に低いマスク画像RI12を非表示にすることで、マスク画像RI11のみを表示する。そして、表示制御部23bは、表示変更ボタンB13が更に選択された場合には、図17の上段に示すように、全てのマスク画像RI11、RI12及びRI13を再度表示する。なお、表示制御部23bは、図17の下段の状態において表示変更ボタンB13が選択された場合には、マスク画像RI11を非表示にして、全てのマスク画像RI11、RI12及びRI13を非表示にしてもよい。
[5-5.表示例(5)]
また、表示制御部23bは、病理画像の異なる複数の領域に、注目領域を示す情報を同時に表示してもよい。この点について図18を用いて説明する。図18に示す例では、表示制御部23bは、観察対象物A10が全体的に描出される病理画像I1を表示するとともに、病理画像I1に枠画像RI21~RI25を重畳して表示する。枠画像RI21~RI25は、病理画像I1の注目領域を示すので、閲覧者は、枠画像RI21~RI25に対応する領域を順に拡大しながら詳細に観察することができる。
また、表示制御部23bは、病理画像の異なる複数の領域に、注目領域を示す情報を同時に表示してもよい。この点について図18を用いて説明する。図18に示す例では、表示制御部23bは、観察対象物A10が全体的に描出される病理画像I1を表示するとともに、病理画像I1に枠画像RI21~RI25を重畳して表示する。枠画像RI21~RI25は、病理画像I1の注目領域を示すので、閲覧者は、枠画像RI21~RI25に対応する領域を順に拡大しながら詳細に観察することができる。
[5-6.表示例(6)]
また、表示制御部23bは、図18の例において、非注目領域を示す枠画像やマスク画像を表示してもよい。例えば、表示制御部23bは、学習モデル121によって出力される注目スコアが所定の閾値TH3よりも低い領域に非注目領域を示す枠画像等を表示する。この点について図19を用いて説明する。図19に示す例では、表示制御部23bは、観察対象物A10が全体的に描出される病理画像I1を表示するとともに、注目領域を示す枠画像RI21~RI23を表示し、さらに、非注目領域を示す枠画像RI31及びRI32を表示する。枠画像RI31及びRI32は、過去に注目して閲覧された領域でないことを示すので、枠画像RI31及びRI32に対応する領域については簡易な観察で済ませることができるので、効率的に病理診断を行うことができる。なお、表示制御装置23は、診断支援情報として病理画像I1の各領域に対応する注目スコアを導出装置100から取得することで、非注目領域を特定することができる。
また、表示制御部23bは、図18の例において、非注目領域を示す枠画像やマスク画像を表示してもよい。例えば、表示制御部23bは、学習モデル121によって出力される注目スコアが所定の閾値TH3よりも低い領域に非注目領域を示す枠画像等を表示する。この点について図19を用いて説明する。図19に示す例では、表示制御部23bは、観察対象物A10が全体的に描出される病理画像I1を表示するとともに、注目領域を示す枠画像RI21~RI23を表示し、さらに、非注目領域を示す枠画像RI31及びRI32を表示する。枠画像RI31及びRI32は、過去に注目して閲覧された領域でないことを示すので、枠画像RI31及びRI32に対応する領域については簡易な観察で済ませることができるので、効率的に病理診断を行うことができる。なお、表示制御装置23は、診断支援情報として病理画像I1の各領域に対応する注目スコアを導出装置100から取得することで、非注目領域を特定することができる。
[5-7.表示例(7)]
また、表示制御部23bは、複数の注目領域に対応する病理画像を並べて表示してもよい。この点について、図20を用いて説明する。図20に示すように、表示制御部23bは、全体表示領域H10と、拡大表示領域H11とを含む画面を表示する。図20の例では、表示制御部23bは、全体表示領域H10に、図18に示した病理画像I1と枠画像RI21~RI25を表示する。そして、表示制御部23bは、拡大表示領域H11には、枠画像RI21~RI25に対応する病理画像を並べて表示する。図20の例では、表示制御部23bは、枠画像RI21に対応する病理画像I41と、枠画像RI22に対応する病理画像I42と、枠画像RI23に対応する病理画像I43と、枠画像RI24に対応する病理画像I44と、枠画像RI25に対応する病理画像I45とを表示する。このとき、表示制御部23bは、注目スコアが高い順に、病理画像I41~I45を表示してもよい。
また、表示制御部23bは、複数の注目領域に対応する病理画像を並べて表示してもよい。この点について、図20を用いて説明する。図20に示すように、表示制御部23bは、全体表示領域H10と、拡大表示領域H11とを含む画面を表示する。図20の例では、表示制御部23bは、全体表示領域H10に、図18に示した病理画像I1と枠画像RI21~RI25を表示する。そして、表示制御部23bは、拡大表示領域H11には、枠画像RI21~RI25に対応する病理画像を並べて表示する。図20の例では、表示制御部23bは、枠画像RI21に対応する病理画像I41と、枠画像RI22に対応する病理画像I42と、枠画像RI23に対応する病理画像I43と、枠画像RI24に対応する病理画像I44と、枠画像RI25に対応する病理画像I45とを表示する。このとき、表示制御部23bは、注目スコアが高い順に、病理画像I41~I45を表示してもよい。
[5-8.表示例(8)]
また、表示制御部23bは、図20の例において、注目領域に対応する複数の病理画像を選択可能に表示してもよい。そして、表示制御部23bは、選択された病理画像を診断結果情報としてサーバ22の記憶部に保存してもよい。この点について、図21を用いて説明する。図21に示すように、表示制御部23bは、図20の例と同様に、全体表示領域H10に、病理画像I1に枠画像RI21~RI25を重畳して表示する。また、表示制御部23bは、拡大表示領域H11には、病理画像I41~I45を選択可能に並べて表示する。具体的には、表示制御部23bは、病理画像I41~I45のそれぞれを選択するためのチェックボックスCH11~CH15を表示する。そして、表示制御部23bは、これらのチェックボックスが選択された状態で図示しない保存ボタンが押下された場合に、選択された病理画像をサーバ22又は医療情報システム30の記憶部に保存する。
また、表示制御部23bは、図20の例において、注目領域に対応する複数の病理画像を選択可能に表示してもよい。そして、表示制御部23bは、選択された病理画像を診断結果情報としてサーバ22の記憶部に保存してもよい。この点について、図21を用いて説明する。図21に示すように、表示制御部23bは、図20の例と同様に、全体表示領域H10に、病理画像I1に枠画像RI21~RI25を重畳して表示する。また、表示制御部23bは、拡大表示領域H11には、病理画像I41~I45を選択可能に並べて表示する。具体的には、表示制御部23bは、病理画像I41~I45のそれぞれを選択するためのチェックボックスCH11~CH15を表示する。そして、表示制御部23bは、これらのチェックボックスが選択された状態で図示しない保存ボタンが押下された場合に、選択された病理画像をサーバ22又は医療情報システム30の記憶部に保存する。
[5-9.表示例(9)]
また、表示制御部23bは、学習モデルを生成する開発者向けに、学習パラメータを変更した場合の学習結果を表示してもよい。また、表示制御部23bは、異なる学習パラメータに対応する学習結果を比較可能に並べて表示してもよい。なお、学習パラメータの例としては、例えばヒートマップ画像のうち所定の注目指標値以下は0にするような閾値TH4や、学習のバッチサイズや入力サイズ、ディープラーニングのネットワーク構成といったものが挙げられる。
また、表示制御部23bは、学習モデルを生成する開発者向けに、学習パラメータを変更した場合の学習結果を表示してもよい。また、表示制御部23bは、異なる学習パラメータに対応する学習結果を比較可能に並べて表示してもよい。なお、学習パラメータの例としては、例えばヒートマップ画像のうち所定の注目指標値以下は0にするような閾値TH4や、学習のバッチサイズや入力サイズ、ディープラーニングのネットワーク構成といったものが挙げられる。
この点について、図22を用いて説明する。図22の例では、表示制御部23bは、2つの学習結果を並べて表示する。具体的には、表示制御部23bは、画面の左側に、学習パラメータAが「XXX」、学習パラメータBが「YYY」、学習パラメータCが「ZZZ」である場合における学習結果を表示する。また、表示制御部23bは、画面の右側に、学習パラメータA、B、Cが「PPP」、「QQQ」、「RRR」である場合における学習結果を表示する。表示制御部23bは、学習結果として、例えば注目領域を示す情報(図22の例ではマスク画像)を病理画像I21に重畳して表示する。また、表示制御部23bは、図22に示すように、機械学習における学習回数と損失関数の出力との関係をグラフG11、G12を表示する。図22に示したグラフG11、G12の縦軸は損失関数の出力を示し、横軸は学習回数を示す。学習回数とは、例えば、ニューラルネットワークを学習させる際に行われるバックプロパゲーションの回数(すなわち、重みを更新した回数)等が該当する。なお、学習は随時行われているので、表示制御部23bは、学習結果ボタンB31又はB32が選択された場合に、最新の学習結果の情報を表示する。
[5-10.表示例(10)]
また、上記では、病理画像に重畳表示する診断支援情報の例として、枠画像やマスク画像を説明した。しかし、表示制御部23bは、診断支援情報の例として、注目領域を指し示す矢印画像を病理画像に重畳表示してもよいし、注目領域に関する説明であるテキスト情報を表示してもよい。
また、上記では、病理画像に重畳表示する診断支援情報の例として、枠画像やマスク画像を説明した。しかし、表示制御部23bは、診断支援情報の例として、注目領域を指し示す矢印画像を病理画像に重畳表示してもよいし、注目領域に関する説明であるテキスト情報を表示してもよい。
[5-11.撮像条件の異なる病理画像]
また、[2-1.病理画像]で説明したように、病理画像であるタイル画像は、焦点距離や染色条件等の撮像条件毎に生成されてもよい。撮像条件毎にタイル画像が生成される場合、表示制御部23bは、図11及び図14~図22を用いて説明した例において、例えば特定の撮像条件に対応する病理画像(以下、特定の病理画像とする)を表示する。このとき、表示制御部23bは、特定の病理画像とともに、特定の撮像条件と異なる撮像条件に対応する他の病理画像であって、特定の病理画像と同一領域の他の病理画像を並べて表示してもよい。この場合、表示制御部23bは、他の病理画像のうち、特定の病理画像の注目領域と対応する位置に注目領域を示す情報(マスク画像や枠画像等)を表示する。なお、特定の撮像条件は、閲覧者に指定されてもよい。また、表示制御部23bは、閲覧者に複数の撮像条件が指定された場合には、各撮像条件に対応する同一領域の病理画像を並べて表示してもよい。
また、[2-1.病理画像]で説明したように、病理画像であるタイル画像は、焦点距離や染色条件等の撮像条件毎に生成されてもよい。撮像条件毎にタイル画像が生成される場合、表示制御部23bは、図11及び図14~図22を用いて説明した例において、例えば特定の撮像条件に対応する病理画像(以下、特定の病理画像とする)を表示する。このとき、表示制御部23bは、特定の病理画像とともに、特定の撮像条件と異なる撮像条件に対応する他の病理画像であって、特定の病理画像と同一領域の他の病理画像を並べて表示してもよい。この場合、表示制御部23bは、他の病理画像のうち、特定の病理画像の注目領域と対応する位置に注目領域を示す情報(マスク画像や枠画像等)を表示する。なお、特定の撮像条件は、閲覧者に指定されてもよい。また、表示制御部23bは、閲覧者に複数の撮像条件が指定された場合には、各撮像条件に対応する同一領域の病理画像を並べて表示してもよい。
[5-12.診断予測結果]
また、表示制御部23bは、図11及び図14~図22に示した例において、注目領域を示す情報(マスク画像や枠画像等)とともに、診断結果と予測される情報を表示してもおい。上記の通り、学習モデル121を用いて導出される注目スコアは、病変部が存在する確率を示すともいえる。すなわち、第2の病理画像の各領域に対応する注目スコアは、各領域に病変が存在する確率を示すともいえる。表示制御部23bは、このような注目スコアから定まる病変の存在確率に関する情報を表示してもよい。例えば、表示制御部23bは、図11及び図14~図22に示した例において、注目領域を示す情報(マスク画像や枠画像等)とともに、病変の存在確率に関する情報を重畳表示してもよい。
また、表示制御部23bは、図11及び図14~図22に示した例において、注目領域を示す情報(マスク画像や枠画像等)とともに、診断結果と予測される情報を表示してもおい。上記の通り、学習モデル121を用いて導出される注目スコアは、病変部が存在する確率を示すともいえる。すなわち、第2の病理画像の各領域に対応する注目スコアは、各領域に病変が存在する確率を示すともいえる。表示制御部23bは、このような注目スコアから定まる病変の存在確率に関する情報を表示してもよい。例えば、表示制御部23bは、図11及び図14~図22に示した例において、注目領域を示す情報(マスク画像や枠画像等)とともに、病変の存在確率に関する情報を重畳表示してもよい。
また、表示制御部23bによって表示される情報はこれまで説明した情報に限られず、表示制御部23bは、付加情報を適宜表示してよい。例えば、表示制御部23bは、病理画像の解像度を表示してもよい。また、表示制御部23bは、閲覧履歴情報に基づいて、観察対象を表示する推奨サイズ等を表示してもよい。また、表示制御部23bは、同一患者の過去の病理画像を並べて表示してもよい。また、表示制御部23bは、表示対象の病理画像と類似する他の患者の病理画像を表示してもよい。
[6.変形例2]
以下、学習処理の変形例を説明する。
以下、学習処理の変形例を説明する。
[6-1.学習処理(1)]
上記実施形態では、学習部133が、サーバ12から取得した閲覧履歴情報を用いて学習する例を示した。しかし、学習部133は、閲覧履歴情報として、医療情報システム30に記憶されている病理画像を取得してよい。具体的には、図9A~図9Cを用いて説明したように、医療情報システム30の診断情報記憶部には、病理医が診断時に保存した病理画像が記憶される。病理医は、病変部があった病理画像の領域を拡大して保存しておくことが多い。すなわち、診断情報記憶部に記憶される病理画像は、全体画像の一部領域の画像であって、病変部があった領域、または、病変部がある可能性の高い領域に該当することが多い。このため、学習部133は、医療情報システム30に記憶されている病理画像が注目すべき領域であるものとして学習する。例えば、学習部133は、サーバ12に記憶されている第1の病理画像からヒートマップ画像を生成する場合に、第1の病理画像のうち、医療情報システム30から取得した病理画像に対応する領域の注目指標値を所定値だけ加算する。これにより、学習部133は、病理医による閲覧操作だけでなく、病理医が実際に注目して保存した病理画像を加味して学習することができるので、精度の高い学習モデル121を生成することができる。
上記実施形態では、学習部133が、サーバ12から取得した閲覧履歴情報を用いて学習する例を示した。しかし、学習部133は、閲覧履歴情報として、医療情報システム30に記憶されている病理画像を取得してよい。具体的には、図9A~図9Cを用いて説明したように、医療情報システム30の診断情報記憶部には、病理医が診断時に保存した病理画像が記憶される。病理医は、病変部があった病理画像の領域を拡大して保存しておくことが多い。すなわち、診断情報記憶部に記憶される病理画像は、全体画像の一部領域の画像であって、病変部があった領域、または、病変部がある可能性の高い領域に該当することが多い。このため、学習部133は、医療情報システム30に記憶されている病理画像が注目すべき領域であるものとして学習する。例えば、学習部133は、サーバ12に記憶されている第1の病理画像からヒートマップ画像を生成する場合に、第1の病理画像のうち、医療情報システム30から取得した病理画像に対応する領域の注目指標値を所定値だけ加算する。これにより、学習部133は、病理医による閲覧操作だけでなく、病理医が実際に注目して保存した病理画像を加味して学習することができるので、精度の高い学習モデル121を生成することができる。
[6-2.学習処理(2)]
また、上記実施形態において、学習部133は、第1の病理画像のうち、全体画像のみを用いて学習してもよい。そして、学習部133は、学習処理に用いる閲覧履歴情報を、全体画像のうち注目して閲覧された領域の位置情報としてもよい。これにより、学習部133は、観察対象物全体に対応する全体画像の中で、特に注目すべき領域を推定することが可能な学習モデル121を生成することができる。
また、上記実施形態において、学習部133は、第1の病理画像のうち、全体画像のみを用いて学習してもよい。そして、学習部133は、学習処理に用いる閲覧履歴情報を、全体画像のうち注目して閲覧された領域の位置情報としてもよい。これにより、学習部133は、観察対象物全体に対応する全体画像の中で、特に注目すべき領域を推定することが可能な学習モデル121を生成することができる。
[6-3.学習処理(3)]
また、学習部133は、観察対象物(ここでは第1の患部組織)に関する情報に基づき重みづけを行って学習を行ってもよい。例えば、学習部133は、観察対象物に関する情報として、第1の患部組織が採取された患者に関する情報(性別、年齢、病歴など)や、第1の患部組織の部位情報(大腸、肺等)、第1の患部組織を染色した試薬、第1の患部組織を染色した機関に関する情報、観察対象物の病変部位の種類や進行度などを用いることができる。
また、学習部133は、観察対象物(ここでは第1の患部組織)に関する情報に基づき重みづけを行って学習を行ってもよい。例えば、学習部133は、観察対象物に関する情報として、第1の患部組織が採取された患者に関する情報(性別、年齢、病歴など)や、第1の患部組織の部位情報(大腸、肺等)、第1の患部組織を染色した試薬、第1の患部組織を染色した機関に関する情報、観察対象物の病変部位の種類や進行度などを用いることができる。
例えば、学習部133は、患者の年齢が高いほど、かかる患者に対応する第1の病理画像の重みを重くして学習してもよい。また、例えば、学習部133は、第1の患部組織を染色した機関の信頼性が高いほど、かかる機関が染色した第1の患部組織に対応する第1の病理画像の重みを重くして学習してもよい。
また、学習部133は、第1の患部組織に関する情報毎に分けて学習することで、第1の患部組織に関する情報毎に学習モデルを生成してもよい。例えば、学習部133は、男性だけの第1の病理画像に基づいて男性用の学習モデルを生成し、女性だけの第1の病理画像に基づいて女性用の学習モデルを生成する。この場合、導出部134は、予測対象の第2の病理画像に対応する患者の性別と一致する学習モデルを用いて導出処理を行う。他の例についても同様に、学習部133は、大腸用の学習モデルと、肺用の学習モデルを生成してもよいし、染色機関A用の学習モデルと、染色機関B用の学習モデルとを生成してもよい。また、学習部133は、例えば、大腸用の学習モデルを生成する場合には、大腸の発生率が高い男性の第1の病理画像を女性の第1の病理画像よりも重みを重くして学習してもよい。また、学習部133は、例えば、乳がん用の学習モデルを生成する場合には、乳がんの発生率が高い女性の第1の病理画像を男性の第1の病理画像よりも重みを重くして学習してもよい。
なお、学習部133が第1の患部組織に関する情報毎に学習モデルを生成した場合、導出部134は、各学習モデルを用いて、診断支援情報を導出してもよい。例えば、導出部134は、染色機関A用の学習モデルを用いて診断支援情報X1を導出するとともに、染色機関B用の学習モデルを用いて診断支援情報X2を導出してもよい。そして、表示制御部23bは、診断支援情報X1に基づく注目領域を示す情報(マスク画像等)と、診断支援情報X2に基づく注目領域を示す情報との双方を同一の病理画像に重畳表示してもよい。このとき、表示制御部23bは、診断支援情報の信頼度に応じて、注目領域を示す情報の表示態様(彩度、輝度、透過度など)を変更してもよい。例えば、表示制御部23bは、染色機関Aよりも染色機関Bの方が信頼度が高い場合には、診断支援情報X1よりも診断支援情報X2の方が信頼度が高いとする。また、表示制御部23bは、図16の例において、診断支援情報の信頼度に応じて、病理画像の表示を切り替えてもよい。例えば、表示制御部23bは、診断支援情報の信頼度が高い順に、かかる診断支援情報によって特定される領域に対応する病理画像を表示する。また、表示制御部23bは、図20の例において、診断支援情報の信頼度に応じて、病理画像を並べて表示してもよい。例えば、表示制御部23bは、診断支援情報の信頼度が高い順に、かかる診断支援情報によって特定される領域に対応する病理画像を並べて表示する。
また、学習部133が観察対象物の病変部位の種類(図9A~図9Cに示した組織型)毎に学習モデルを生成するものとする。この場合には、導出部134は、第2の病理画像を各学習モデルに適用することで、病変部位の種類毎に、第2の病理画像の各領域に対応する注目スコア、すなわち、病変部が存在する確率を導出することができる。表示制御部23bは、このような注目スコアに基づいて、病変部位の種類毎に、病変部が存在する確率を注目領域を示す情報(マスク画像や枠画像等)とともに表示してもよい。同様に、学習部133が観察対象物の進行度(図9A~図9Cに示したグレード)毎に学習モデルを生成した場合には、表示制御部23bは、病変部のグレードに関する情報を表示してもよい。
[6-4.学習処理(4)]
また、学習部133は、第1の病理画像の撮像に関する情報に基づき重みづけを行って学習を行ってもよい。例えば、学習部133は、第1の病理画像の撮像に関する情報として、第1の病理画像を撮像した機器、第1の病理画像を撮像した機関に関する情報などを用いることができる。
また、学習部133は、第1の病理画像の撮像に関する情報に基づき重みづけを行って学習を行ってもよい。例えば、学習部133は、第1の病理画像の撮像に関する情報として、第1の病理画像を撮像した機器、第1の病理画像を撮像した機関に関する情報などを用いることができる。
例えば、学習部133は、第1の病理画像を撮像した機器が高精度であるほど、かかる機器により撮像された第1の病理画像の重みを重くして学習してもよい。また、例えば、学習部133は、第1の病理画像を撮像した機関の信頼性が高いほど、かかる機関により撮像された第1の病理画像の重みを重くして学習してもよい。また、学習部133は、第1の病理画像の撮像に関する情報毎に分けて学習することで、第1の病理画像の撮像に関する情報毎に学習モデルを生成してもよい。また、表示制御部23bは、各学習モデルを用いて導出された複数の診断支援情報を表示してもよい。また、表示制御部23bは、撮像機器や撮像機関の信頼度で定まる診断支援情報の信頼度に応じて、注目領域を示す情報の表示態様を変更してもよい。
[6-5.学習処理(5)]
また、学習部133は、第1の病理画像の表示に関する情報に基づき重みづけを行って学習を行ってもよい。例えば、学習部133は、第1の病理画像の表示に用いた機器、第1の病理画像の表示に用いたプログラム、1の記病理画像の表示された領域の閲覧時間、または、第1の病理画像の表示された領域の表示回数に関する情報などを用いることができる。
また、学習部133は、第1の病理画像の表示に関する情報に基づき重みづけを行って学習を行ってもよい。例えば、学習部133は、第1の病理画像の表示に用いた機器、第1の病理画像の表示に用いたプログラム、1の記病理画像の表示された領域の閲覧時間、または、第1の病理画像の表示された領域の表示回数に関する情報などを用いることができる。
例えば、学習部133は、第1の病理画像に表示に用いられた表示機器が高精度であるほど、かかる表示機器により表示されて診断された第1の病理画像の重みを重くして学習してもよい。また、例えば、学習部133は、第1の病理画像に表示に用いられたプログラムが高精度であるほど、かかるプログラムにより表示されて診断された第1の病理画像の重みを重くして学習してもよい。なお、閲覧時間や表示回数については既に説明したように、学習部133は、閲覧時間や表示回数に応じた重みとして注目指標値を反映させたヒートマップ画像に基づいて学習を行う。また、学習部133は、第1の病理画像の表示に関する情報毎に分けて学習することで、第1の病理画像の表示に関する情報毎に学習モデルを生成してもよい。また、表示制御部23bは、各学習モデルを用いて導出された複数の診断支援情報を表示してもよい。また、表示制御部23bは、表示機器や表示プログラムの信頼度で定まる診断支援情報の信頼度に応じて、注目領域を示す情報の表示態様を変更してもよい。
[6-6.学習処理(6)]
また、学習部133は、閲覧履歴情報に対応するユーザ(すなわち、第1の病理画像の閲覧者)に関する情報に基づき重みづけを行って学習を行ってもよい。例えば、学習部133は、閲覧履歴情報に対応するユーザに関する情報として、第1の病理画像を診断した診断者を特定する情報、または診断者の能力ランクを示す情報などを用いることができる。
また、学習部133は、閲覧履歴情報に対応するユーザ(すなわち、第1の病理画像の閲覧者)に関する情報に基づき重みづけを行って学習を行ってもよい。例えば、学習部133は、閲覧履歴情報に対応するユーザに関する情報として、第1の病理画像を診断した診断者を特定する情報、または診断者の能力ランクを示す情報などを用いることができる。
例えば、学習部133は、第1の病理画像を診断した診断者の診断レベルや能力ランクが高いほど、かかる診断者によって閲覧された第1の病理画像の重みを重くして学習してもよい。診断者の診断レベルや能力ランクは、経験年数、経験した症例数などに基づいて定まる。また、学習部133は、閲覧履歴情報に対応するユーザに関する情報毎に分けて学習することで、閲覧履歴情報に対応するユーザに関する情報毎に学習モデルを生成してもよい。また、表示制御部23bは、各学習モデルを用いて導出された複数の診断支援情報を表示してもよい。また、表示制御部23bは、診断者の診断レベルや能力ランクの信頼度で定まる診断支援情報の信頼度に応じて、注目領域を示す情報の表示態様を変更してもよい。
[6-7.学習処理(7)]
また、上記実施形態では、ヒートマップ画像を用いて学習を行う例を示したが、学習部133は、ヒートマップ画像を用いずに学習を行ってもよい。例えば、学習部133は、第1の病理画像の各領域に対する病理医の閲覧時間、閲覧回数、拡大率などを説明変数とし、病理画像の各領域に対する病理医の注目度合いを示す注目スコア(例えば、0~1)を目的変数として学習してもよい。このとき、学習部133は、閲覧時間が長い領域ほど注目スコアが高くなり、閲覧回数が多い領域ほど注目スコアが高くなり、拡大して閲覧された領域ほど注目スコアが高くなり、拡大率が高い領域ほど注目スコアが高くなるように学習する。
また、上記実施形態では、ヒートマップ画像を用いて学習を行う例を示したが、学習部133は、ヒートマップ画像を用いずに学習を行ってもよい。例えば、学習部133は、第1の病理画像の各領域に対する病理医の閲覧時間、閲覧回数、拡大率などを説明変数とし、病理画像の各領域に対する病理医の注目度合いを示す注目スコア(例えば、0~1)を目的変数として学習してもよい。このとき、学習部133は、閲覧時間が長い領域ほど注目スコアが高くなり、閲覧回数が多い領域ほど注目スコアが高くなり、拡大して閲覧された領域ほど注目スコアが高くなり、拡大率が高い領域ほど注目スコアが高くなるように学習する。
[6-8.学習処理(8)]
また、図8に示した閲覧履歴記憶部12aは、第1の病理画像を閲覧した際の閲覧者の視線情報を記憶してもよい。例えば、閲覧履歴記憶部12aは、視線情報として、閲覧者が所定時間以上閲覧した第1の病理画像の領域や、所定回数以上閲覧した第1の病理画像の領域の位置情報を記憶する。このような視線情報は、アイトラッキング等の技術により取得可能である。そして、学習部133は、閲覧履歴記憶部12aに記憶されている視線情報を加味して学習してもよい。例えば、学習部133は、上述したヒートマップ画像に、視線情報に基づく注目指標値を反映した上で学習する。
また、図8に示した閲覧履歴記憶部12aは、第1の病理画像を閲覧した際の閲覧者の視線情報を記憶してもよい。例えば、閲覧履歴記憶部12aは、視線情報として、閲覧者が所定時間以上閲覧した第1の病理画像の領域や、所定回数以上閲覧した第1の病理画像の領域の位置情報を記憶する。このような視線情報は、アイトラッキング等の技術により取得可能である。そして、学習部133は、閲覧履歴記憶部12aに記憶されている視線情報を加味して学習してもよい。例えば、学習部133は、上述したヒートマップ画像に、視線情報に基づく注目指標値を反映した上で学習する。
(第2の実施形態)
上記第1の実施形態では、学習モデルを用いて診断支援情報を導出する例を示した。第2の実施形態では、学習モデルを用いずに診断支援情報を導出する例について説明する。
上記第1の実施形態では、学習モデルを用いて診断支援情報を導出する例を示した。第2の実施形態では、学習モデルを用いずに診断支援情報を導出する例について説明する。
図23は、第2の実施形態に係る導出装置200及び表示制御装置23の一例を示す図である。図23に示すように、導出装置200は、通信部110と、記憶部220と、制御部230とを有する。
記憶部220は、例えば、RAM、フラッシュメモリ等の半導体メモリ素子、または、ハードディスク、光ディスク等の記憶装置によって実現される。記憶部220は、履歴情報記憶部221を有する。
制御部230は、例えば、CPUやMPUによって、導出装置200内部に記憶された診断支援プログラムがRAM等を作業領域として実行されることにより実現される。また、制御部230は、例えばASICやFPGA等の集積回路により実行されてもよい。図23に示すように、制御部230は、履歴情報取得部231と、診断情報取得部232と、導出部234とを有する。
履歴情報取得部231は、病理システム10のサーバ12から第1の病理画像と、第1の病理画像に対する閲覧に関する閲覧履歴情報とを取得し、取得した第1の病理画像と閲覧履歴情報を履歴情報記憶部221に格納する。
診断情報取得部232は、医療情報システム30から、第1の病理画像に対応する第1の患部組織に対する診断情報を取得し、取得した診断情報を履歴情報記憶部221に格納する。
導出部234は、表示制御装置23から第2の病理画像を受け付けた場合に、履歴情報記憶部221を参照することで、第2の病理画像との類似度が所定の閾値TH4よりも高い第1の病理画像に関する閲覧履歴情報に基づいて、診断支援情報を導出する。具体的には、導出部234は、履歴情報記憶部221に記憶されている第1の病理画像のうち、第2の病理画像と特徴量の類似度が閾値TH4よりも高く、かつ診断結果が陽性である第1の病理画像を特定する。そして、導出部234は、特定した第1の病理画像に対応する閲覧履歴情報に基づいて、第1の病理画像の注目領域と類似する第2の病理画像の領域の位置情報等を診断支援情報として導出する。
なお、導出部234は、第2の病理画像との相関度が所定の閾値TH5よりも高い第1の病理画像に関する閲覧履歴情報に基づいて、診断支援情報を導出してもよい。ここでいう相関度とは、患者の属性(性別、年齢など)の同一性や、患部組織の同一性等に該当する。
このように、第2の実施形態に係る導出装置200は、学習モデルを用いずに診断支援情報を導出することができる。なお、第1の実施形態で説明した表示制御装置23による表示処理は、第2の実施形態に適用することができる。
(その他の実施形態)
上述した各実施形態に係る処理は、上記各実施形態以外にも種々の異なる形態にて実施されてよい。
上述した各実施形態に係る処理は、上記各実施形態以外にも種々の異なる形態にて実施されてよい。
[表示装置]
上記実施形態では、据え置きタイプの表示装置24に表示される病理画像に、マスク画像等の注目領域を示す情報を重畳表示する例を示した。しかし、注目領域を示す情報は、表示装置24に表示される病理画像を閲覧している閲覧者が装着している装着装置(ヘッドマウントディスプレイ等)に表示されてもよい。これにより、表示装置24に表示される病理画像に、装着装置に表示される注目領域を示す情報を重畳させてもよい。また、注目領域を示す情報は、表示装置24の前面を覆うように装着される透明型ディスプレイに表示されてもよい。これにより、表示装置24に表示される病理画像に、透明型ディスプレイに表示される注目領域を示す情報を重畳させてもよい。
上記実施形態では、据え置きタイプの表示装置24に表示される病理画像に、マスク画像等の注目領域を示す情報を重畳表示する例を示した。しかし、注目領域を示す情報は、表示装置24に表示される病理画像を閲覧している閲覧者が装着している装着装置(ヘッドマウントディスプレイ等)に表示されてもよい。これにより、表示装置24に表示される病理画像に、装着装置に表示される注目領域を示す情報を重畳させてもよい。また、注目領域を示す情報は、表示装置24の前面を覆うように装着される透明型ディスプレイに表示されてもよい。これにより、表示装置24に表示される病理画像に、透明型ディスプレイに表示される注目領域を示す情報を重畳させてもよい。
[撮像装置]
また、上記実施形態では、観察対象物を撮像する装置として顕微鏡を例に挙げて説明したが、これに限られない。例えば、観察対象物を撮像する装置は、患者の体内を撮像する内視鏡、CT(Computed Tomography)、またはMRI(Magnetic Resonance Image)などの医療画像取得装置でもよい。この場合、サーバ12やサーバ22には、内視鏡により生成される二次元の静止画像または動画像や、CTやMRIにより生成される三次元画像等の医用画像が保存される。また、サーバ12やサーバ22は、これらの画像と対応づけて、撮像条件やその画像に対する診断結果などの画像に関連する情報を記憶してもよい。
また、上記実施形態では、観察対象物を撮像する装置として顕微鏡を例に挙げて説明したが、これに限られない。例えば、観察対象物を撮像する装置は、患者の体内を撮像する内視鏡、CT(Computed Tomography)、またはMRI(Magnetic Resonance Image)などの医療画像取得装置でもよい。この場合、サーバ12やサーバ22には、内視鏡により生成される二次元の静止画像または動画像や、CTやMRIにより生成される三次元画像等の医用画像が保存される。また、サーバ12やサーバ22は、これらの画像と対応づけて、撮像条件やその画像に対する診断結果などの画像に関連する情報を記憶してもよい。
[サーバ]
また、サーバ12やサーバ22には、顕微鏡により生成された病理画像に対応付けて、内視鏡やCTやMRI等の他の医療画像取得装置で撮像された他の病理画像が記憶されてもよい。この場合、表示制御部23bは、顕微鏡により生成された病理画像に加えて、参照用に、他の撮像装置で撮像された他の病理画像を並べて表示してもよい。
また、サーバ12やサーバ22には、顕微鏡により生成された病理画像に対応付けて、内視鏡やCTやMRI等の他の医療画像取得装置で撮像された他の病理画像が記憶されてもよい。この場合、表示制御部23bは、顕微鏡により生成された病理画像に加えて、参照用に、他の撮像装置で撮像された他の病理画像を並べて表示してもよい。
[病理画像]
サーバ12やサーバ22に保存される病理画像の中には、解像度が低い病理画像もある。すなわち、閲覧履歴情報はあるものの、かかる閲覧履歴情報に対応する病理画像の解像度が適切に学習が行える程度でない場合がある。ここで、観察対象物が収められたガラススライドが保存されている場合には、ガラススライドを高解像度の顕微鏡で再撮像を行い高解像度の病理画像を新たに生成することがある。このため、導出装置100は、学習用の第1の病理画像の解像度が適切な学習が行える程度でなく、かつ、再撮像された病理画像がある場合には、かかる第1の病理画像の閲覧履歴情報と、再撮像された病理画像とを対応付けて上述してきた学習を行ってもよい。このとき、導出装置100は、第1の病理画像と、再撮像された病理画像との位置合わせを行い、第1の病理画像の閲覧履歴情報によってしめされる注目領域が再撮像された病理画像の領域に対応するよう処理を行う。
サーバ12やサーバ22に保存される病理画像の中には、解像度が低い病理画像もある。すなわち、閲覧履歴情報はあるものの、かかる閲覧履歴情報に対応する病理画像の解像度が適切に学習が行える程度でない場合がある。ここで、観察対象物が収められたガラススライドが保存されている場合には、ガラススライドを高解像度の顕微鏡で再撮像を行い高解像度の病理画像を新たに生成することがある。このため、導出装置100は、学習用の第1の病理画像の解像度が適切な学習が行える程度でなく、かつ、再撮像された病理画像がある場合には、かかる第1の病理画像の閲覧履歴情報と、再撮像された病理画像とを対応付けて上述してきた学習を行ってもよい。このとき、導出装置100は、第1の病理画像と、再撮像された病理画像との位置合わせを行い、第1の病理画像の閲覧履歴情報によってしめされる注目領域が再撮像された病理画像の領域に対応するよう処理を行う。
[ハードウェア構成]
上述してきた各実施形態に係る導出装置100、200や表示制御装置23等の情報機器は、例えば図24に示すような構成のコンピュータ1000によって実現される。以下、第1の実施形態に係る導出装置100を例に挙げて説明する。図24は、導出装置100の機能を実現するコンピュータ1000の一例を示すハードウェア構成図である。コンピュータ1000は、CPU1100、RAM1200、ROM(Read Only Memory)1300、HDD(Hard Disk Drive)1400、通信インターフェイス1500、及び入出力インターフェイス1600を有する。コンピュータ1000の各部は、バス1050によって接続される。
上述してきた各実施形態に係る導出装置100、200や表示制御装置23等の情報機器は、例えば図24に示すような構成のコンピュータ1000によって実現される。以下、第1の実施形態に係る導出装置100を例に挙げて説明する。図24は、導出装置100の機能を実現するコンピュータ1000の一例を示すハードウェア構成図である。コンピュータ1000は、CPU1100、RAM1200、ROM(Read Only Memory)1300、HDD(Hard Disk Drive)1400、通信インターフェイス1500、及び入出力インターフェイス1600を有する。コンピュータ1000の各部は、バス1050によって接続される。
CPU1100は、ROM1300又はHDD1400に格納されたプログラムに基づいて動作し、各部の制御を行う。例えば、CPU1100は、ROM1300又はHDD1400に格納されたプログラムをRAM1200に展開し、各種プログラムに対応した処理を実行する。
ROM1300は、コンピュータ1000の起動時にCPU1100によって実行されるBIOS(Basic Input Output System)等のブートプログラムや、コンピュータ1000のハードウェアに依存するプログラム等を格納する。
HDD1400は、CPU1100によって実行されるプログラム、及び、かかるプログラムによって使用されるデータ等を非一時的に記録する、コンピュータが読み取り可能な記録媒体である。具体的には、HDD1400は、プログラムデータ1450の一例である本開示に係る応答生成プログラムを記録する記録媒体である。
通信インターフェイス1500は、コンピュータ1000が外部ネットワーク1550(例えばインターネット)と接続するためのインターフェイスである。例えば、CPU1100は、通信インターフェイス1500を介して、他の機器からデータを受信したり、CPU1100が生成したデータを他の機器へ送信したりする。
入出力インターフェイス1600は、入出力デバイス1650とコンピュータ1000とを接続するためのインターフェイスである。例えば、CPU1100は、入出力インターフェイス1600を介して、キーボードやマウス等の入力デバイスからデータを受信する。また、CPU1100は、入出力インターフェイス1600を介して、ディスプレイやスピーカーやプリンタ等の出力デバイスにデータを送信する。また、入出力インターフェイス1600は、コンピュータ読み取り可能な所定の記録媒体(メディア)に記録されたプログラム等を読み取るメディアインターフェイスとして機能してもよい。メディアとは、例えばDVD(Digital Versatile Disc)、PD(Phase change rewritable Disk)等の光学記録媒体、MO(Magneto-Optical disk)等の光磁気記録媒体、テープ媒体、磁気記録媒体、または半導体メモリ等である。
例えば、コンピュータ1000が第1の実施形態に係る導出装置100として機能する場合、コンピュータ1000のCPU1100は、RAM1200上にロードされた診断支援プログラムを実行することにより、履歴情報取得部131、診断情報取得部132、学習部133、導出部134等の機能を実現する。また、HDD1400には、本開示に係る診断支援プログラムや、記憶部120内のデータが格納される。また、例えば、コンピュータ1000が第1の実施形態に係る表示制御装置23として機能する場合、コンピュータ1000のCPU1100は、RAM1200上にロードされた表示制御プログラムを実行することにより、画像取得部23a、表示制御部23b等の機能を実現する。また、HDD1400には、本開示に係る表示制御プログラムが格納される。なお、CPU1100は、プログラムデータ1450をHDD1400から読み取って実行するが、他の例として、外部ネットワーク1550を介して、他の装置からこれらの診断支援プログラムや表示制御プログラムを取得してもよい。
[その他]
上記各実施形態において説明した各処理のうち、自動的に行われるものとして説明した処理の全部または一部を手動的に行うこともでき、あるいは、手動的に行われるものとして説明した処理の全部または一部を公知の方法で自動的に行うこともできる。この他、上記文書中や図面中で示した処理手順、具体的名称、各種のデータやパラメータを含む情報については、特記する場合を除いて任意に変更することができる。例えば、各図に示した各種情報は、図示した情報に限られない。
上記各実施形態において説明した各処理のうち、自動的に行われるものとして説明した処理の全部または一部を手動的に行うこともでき、あるいは、手動的に行われるものとして説明した処理の全部または一部を公知の方法で自動的に行うこともできる。この他、上記文書中や図面中で示した処理手順、具体的名称、各種のデータやパラメータを含む情報については、特記する場合を除いて任意に変更することができる。例えば、各図に示した各種情報は、図示した情報に限られない。
また、図示した各装置の各構成要素は機能概念的なものであり、必ずしも物理的に図示の如く構成されていることを要しない。すなわち、各装置の分散・統合の具体的形態は図示のものに限られず、その全部または一部を、各種の負荷や使用状況などに応じて、任意の単位で機能的または物理的に分散・統合して構成することができる。
また、上述してきた各実施形態及び変形例は、処理内容を矛盾させない範囲で適宜組み合わせることが可能である。
(効果)
上述してきたように、導出装置100(又は200)は、第1の患部組織に対応する第1の病理画像と、第1の病理画像に対する閲覧履歴に関する履歴情報(上述した閲覧履歴情報)と、第1の病理画像に対応する第1の患部組織に対する診断情報とに基づいて、診断対象の第2の患部組織に対応する第2の病理画像の診断を支援する診断支援情報を導出する導出手順をコンピュータに実行させる。また、診断支援システム1は、顕微鏡11(又は21)と、診断を支援する情報である診断支援情報を導出する導出装置100(又は200)とを備える。なお、導出装置100による処理は、顕微鏡11(又は21)により撮像される対象物に対応する病理画像の処理に使われるソフトウェアによって実現されてよい。なお、以下の効果の説明では、導出装置100を導出装置200と読み替えることができる。
上述してきたように、導出装置100(又は200)は、第1の患部組織に対応する第1の病理画像と、第1の病理画像に対する閲覧履歴に関する履歴情報(上述した閲覧履歴情報)と、第1の病理画像に対応する第1の患部組織に対する診断情報とに基づいて、診断対象の第2の患部組織に対応する第2の病理画像の診断を支援する診断支援情報を導出する導出手順をコンピュータに実行させる。また、診断支援システム1は、顕微鏡11(又は21)と、診断を支援する情報である診断支援情報を導出する導出装置100(又は200)とを備える。なお、導出装置100による処理は、顕微鏡11(又は21)により撮像される対象物に対応する病理画像の処理に使われるソフトウェアによって実現されてよい。なお、以下の効果の説明では、導出装置100を導出装置200と読み替えることができる。
これにより、上記実施形態によれば、診断支援情報に基づき、診断精度を向上させることができる。
また、導出装置100は、診断支援情報として、閲覧に関する情報を導出する。
これにより、上記実施形態によれば、閲覧時の診断精度を向上させることができる。
また、導出装置100は、診断結果が陽性である診断情報に対応する閲覧履歴情報を用いて、診断支援情報を導出する。
これにより、上記実施形態によれば、陽性時の閲覧履歴情報を加味した診断支援情報を導出するので、陽性の診断精度を向上させることができる。
また、閲覧履歴情報は、第1の病理画像の診断時に保存された第1の病理画像の一部領域の画像に関する情報を含む。また、導出装置100は、第1の病理画像に対応する患者の情報が登録された医療情報システムから、第1の病理画像の一部領域の画像を取得する。
これにより、上記実施形態によれば、病理医が実際に注目して保存した病理画像を加味して診断支援情報を導出するので、診断精度をより向上させることができる。
また、第1の病理画像は、第1の患部組織の全体を撮像した全体画像である。また、閲覧履歴情報は、第1の病理画像が閲覧された位置を示す位置情報である。
これにより、上記実施形態によれば、第1の患部組織全体の診断支援情報を導出することができるので、第1の患部組織全体を漏れなく診断することを支援することができる。
また、閲覧履歴情報は、第1の病理画像が閲覧された位置を示す位置情報、および第1の病理画像が閲覧された時間または回数を示す情報である。
これにより、上記実施形態によれば、病理医が注目して閲覧した領域に基づいて診断支援情報を導出するので、診断精度をより向上させることができる。
また、第1の病理画像は、第1の患部組織の各領域に対応する部分画像により形成される画像である。また、閲覧履歴情報は、各領域に対応する部分画像のうち、閲覧された部分画像を示す部分画像情報である。また、部分画像情報は、部分画像の位置を示す、または部分画像を特定する情報である。
これにより、上記実施形態によれば、部分画像により病理画像が形成されるシステムであっても、診断精度を向上させることができる。
また、導出装置100は、閲覧履歴情報から推定される第2の病理画像の注目領域に基づいて、診断支援情報を導出する。
これにより、上記実施形態によれば、診断対象の第2の病理画像のうち注目すべき領域を提供できるので、診断作業を容易にし、かつ、診断のばらつきを低減することができる。
また、導出装置100は、閲覧履歴情報に基づいて、表示倍率が大きい領域ほど注目度が高い注目領域とし、または、閲覧時間が長い領域ほど注目度が高い注目領域とし、または、閲覧回数が多い領域ほど注目度が高い注目領域として、診断支援情報を導出する。
これにより、上記実施形態によれば、注目すべき領域を高精度に特定することができるので、診断精度をより向上させることができる。
また、診断情報は、病変部位の有無、病変部位の種類、または病変部位の進行度に関する情報である。また、診断情報は、第1の病理画像に対応する患者の情報が登録された医療情報システムから、取得される。
これにより、上記実施形態によれば、病変部位の有無、病変部位の種類、または病変部位の進行度に応じた診断支援情報を導出することができる。
また、導出装置100は、第1の病理画像と、閲覧履歴情報と、診断情報との対応を学習する。また、導出装置100は、学習結果を用いて、診断支援情報を導出する。
これにより、上記実施形態によれば、閲覧履歴情報を用いるので、弱教師学習などの詳細なアノテーションデータを必要としない教師学習の枠組みで精度良く診断支援情報を導出することができる。
また、導出装置100は、第1の患部組織に関する情報に基づき重みづけを行って学習、または第1の患部組織に関する情報ごとに分けて学習する。また、第1の患部組織に関する情報は、第1の患部組織が採取された患者に関する情報、第1の患部組織の部位情報、第1の患部組織を染色した試薬、または第1の患部組織を染色した機関に関する情報である。
これにより、上記実施形態によれば、第1の患部組織に関する情報を用いることで、より高精度に診断支援情報を導出することができる。
また、導出装置100は、第1の病理画像の撮像に関する情報に基づき重みづけを行って学習、または第1の病理画像の撮像に関する情報ごとに分けて学習する。また、第1の病理画像の撮像に関する情報は、第1の病理画像を撮像した機器、または第1の病理画像を撮像した機関に関する情報である。
これにより、上記実施形態によれば、第1の病理画像の撮像に関する情報を用いることで、より高精度に診断支援情報を導出することができる。
また、導出装置100は、第1の病理画像の表示に関する情報に基づき重みづけを行って学習、または第1の病理画像の表示に関する情報ごとに分けて学習する。また、第1の病理画像の表示に関する情報は、第1の病理画像の表示に用いた機器、第1の病理画像の表示に用いたプログラム、第1の記病理画像の表示された領域の閲覧時間、または第1の病理画像の表示された領域の表示回数に関する情報である。
これにより、上記実施形態によれば、第1の病理画像の表示に関する情報を用いることで、より高精度に診断支援情報を導出することができる。
また、導出装置100は、閲覧履歴情報に対応するユーザに関する情報に基づき重みづけを行って学習、または閲覧履歴情報に対応するユーザに関する情報ごとに分けて学習する。また、閲覧履歴情報に対応するユーザに関する情報は、第1の病理画像を診断した診断者を特定する情報、または診断者の能力ランクを示す情報である。
これにより、上記実施形態によれば、閲覧履歴情報に対応するユーザに関する情報を用いることで、より高精度に診断支援情報を導出することができる。
また、導出装置100は、診断結果が陽性を示す診断情報と、かかる診断情報に対応する閲覧履歴情報とを対応付けて学習する。
これにより、上記実施形態によれば、陽性時の閲覧履歴情報を加味した診断支援情報を導出するので、陽性の診断精度を向上させることができる。
また、導出装置100は、診断結果が陰性を示す診断情報と、かかる診断情報に対応する閲覧履歴情報とを対応付けて学習する。
これにより、上記実施形態によれば、陰性時の閲覧履歴情報を加味した診断支援情報を導出するので、陰性の診断精度を向上させることができる。
また、導出装置100は、第2の病理画像のうち注目領域以外の領域を、診断結果が陰性を示す診断情報として学習する。
これにより、上記実施形態によれば、注目すべき領域をより高精度に推定することが可能になるので、診断精度をより向上させることができる。
また、導出装置200は、第2の病理画像との類似度が閾値よりも高い第1の病理画像、または第2の病理画像との相関度が閾値よりも高い第1の病理画像に対応する閲覧履歴に関する閲覧履歴情報に基づいて、診断支援情報を導出する。
これにより、上記実施形態によれば、診断支援情報に基づき、診断精度を向上させることができる。
また、表示制御装置23は、診断支援情報に基づいて、診断に影響があると推測される領域である注目領域を視認可能な状態で第2の病理画像に重畳して表示するよう制御する。また、表示制御装置23は、注目領域を覆う画像であるマスク画像、注目領域の外枠を示す画像である枠画像、注目領域を指し示す矢印画像、または注目領域を説明するテキスト情報で、第2の病理画像に重畳して表示するよう制御する。
これにより、上記実施形態によれば、第2の病理画像のうち注目して診断すべき領域を表示するので、診断精度の向上及び診断の効率化を図ることができる。
また、表示制御装置23は、診断支援情報に基づいて、診断への影響度、または診断支援情報の信頼度に応じて、注目領域の表示態様を変える。また、表示態様は、彩度、輝度、または透過度である。
これにより、上記実施形態によれば、影響度や信頼度が反映された情報を表示するので、診断精度の向上及び診断の効率化を図ることができる。
また、表示制御装置23は、注目領域に対応する第2の患部組織の一部画像を表示するよう制御する。
これにより、上記実施形態によれば、注目すべき領域自体を表示するので、診断精度の向上及び診断の効率化を図ることができる。
また、表示制御装置23は、注目領域が複数ある場合は、各注目領域に対応する病理画像を表示するよう制御する。また、表示制御装置23は、各注目領域に対応する病理画像を表示画面内に並べて表示するよう制御する。
これにより、上記実施形態によれば、第1の患部組織全体を漏れなく診断することを支援することができる。
また、表示制御装置23は、各注目領域に対応する病理画像を、表示画面内に診断への影響度、または診断支援情報の信頼度の高い順に並べて表示するよう制御する。
これにより、上記実施形態によれば、影響度や信頼度が反映された情報を表示するので、診断精度の向上及び診断の効率化を図ることができる。
また、表示制御装置23は、各注目領域に対応する病理画像を同一表示エリアに切り替えて表示するよう制御する。
これにより、上記実施形態によれば、第1の患部組織全体を漏れなく診断することを支援することができる。
また、表示制御装置23は、各注目領域に対応する病理画像を、診断への影響度、または診断支援情報の信頼度の高い順に、同一表示エリアに切り替えて表示するよう制御する。
これにより、上記実施形態によれば、影響度や信頼度が反映された情報を表示するので、診断精度の向上及び診断の効率化を図ることができる。
また、診断支援情報は、第1の患部組織に対する診断結果と予測される診断予測結果である。また、診断予測結果とは、病変部位の有無、病変部位の種類、病変部位の進行度、または病変部位である確率である。
これにより、上記実施形態によれば、診断予測結果という付加情報を導出することで、診断精度を向上させることができる。
なお、本明細書に記載された効果はあくまで例示であって限定されるものでは無く、また他の効果があってもよい。
なお、本技術は以下のような構成も取ることができる。
(1)
第1の患部組織に対応する第1の病理画像と、前記第1の病理画像に対する閲覧履歴に関する履歴情報と、前記第1の病理画像に対応する第1の患部組織に対する診断情報とを取得する取得手順と、
前記第1の病理画像と、前記履歴情報と、前記診断情報とに基づいて、診断対象の第2の患部組織に対応する第2の病理画像の診断を支援する診断支援情報を導出する導出手順と、
を情報処理装置に実行させる診断支援プログラム。
(2)
前記導出手順は、
前記診断支援情報として、閲覧に関する情報を導出する、
前記(1)に記載の診断支援プログラム。
(3)
前記導出手順は、
診断結果が陽性である前記診断情報に対応する履歴情報を用いて、前記診断支援情報を導出する、
前記(1)又は(2)に記載の診断支援プログラム。
(4)
前記履歴情報は、前記第1の病理画像の診断時に保存された前記第1の病理画像の一部領域の画像に関する情報を含む
前記(1)~(3)のいずれか1つに記載の診断支援プログラム。
(5)
前記導出手順は、
前記第1の病理画像に対応する患者の情報が登録された医療情報システムから、前記第1の病理画像の一部領域の画像を取得する
前記(4)に記載の診断支援プログラム。
(6)
前記第1の病理画像は、前記第1の患部組織の全体を撮像した全体画像であり、
前記履歴情報は、前記第1の病理画像が閲覧された位置を示す位置情報である、
前記(1)~(5)のいずれか1つに記載の診断支援プログラム。
(7)
前記履歴情報は、前記第1の病理画像が閲覧された位置を示す位置情報、および前記第1の病理画像が閲覧された時間または回数を示す情報である、
前記(6)に記載の診断支援プログラム。
(8)
前記第1の病理画像は、前記第1の患部組織の各領域に対応する部分画像により形成される画像であり、
前記履歴情報は、前記各領域に対応する部分画像のうち、閲覧された部分画像を示す部分画像情報である、
前記(1)~(7)のいずれか1つに記載の診断支援プログラム。
(9)
前記部分画像情報は、前記部分画像の位置を示す、または前記部分画像を特定する情報である、
前記(8)に記載の診断支援プログラム。
(10)
前記導出手順は、
前記履歴情報から推定される前記第2の病理画像の注目領域に基づいて、前記診断支援情報を導出する、
前記(1)~(9)のいずれか1つに記載の診断支援プログラム。
(11)
前記導出手順は、
前記履歴情報に基づいて、表示倍率が大きい領域ほど注目度が高い注目領域とし、または、閲覧時間が長い領域ほど注目度が高い注目領域とし、または、閲覧回数が多い領域ほど注目度が高い注目領域として、前記診断支援情報を導出する、
前記(10)に記載の診断支援プログラム。
(12)
前記診断情報は、病変部位の有無、前記病変部位の種類、または前記病変部位の進行度に関する情報である、
前記(1)~(11)のいずれか1つに記載の診断支援プログラム。
(13)
前記診断情報は、前記第1の病理画像に対応する患者の情報が登録された医療情報システムから、取得される、
前記(1)~(12)のいずれか1つに記載の診断支援プログラム。
(14)
前記第1の病理画像と、前記履歴情報と、前記診断情報との対応を学習する学習手順をさらに前記コンピュータに実行させ、
前記導出手順は、
前記学習手順による学習結果を用いて、前記診断支援情報を導出する、
前記(1)~(13)のいずれか1つに記載の診断支援プログラム。
(15)
前記学習手順は、
前記第1の患部組織に関する情報に基づき重みづけを行って学習、または前記第1の患部組織に関する情報ごとに分けて学習する
前記(14)に記載の診断支援プログラム。
(16)
前記第1の患部組織に関する情報は、前記第1の患部組織が採取された患者に関する情報、前記第1の患部組織の部位情報、前記第1の患部組織を染色した試薬、または前記第1の患部組織を染色した機関に関する情報である、
前記(15)に記載の診断支援プログラム。
(17)
前記学習手順は、
前記第1の病理画像の撮像に関する情報に基づき重みづけを行って学習、または前記第1の病理画像の撮像に関する情報ごとに分けて学習する
前記(14)~(16)のいずれか1つに記載の診断支援プログラム。
(18)
前記第1の病理画像の前記撮像に関する情報は、前記第1の病理画像を撮像した機器、または前記第1の病理画像を撮像した機関に関する情報である、
前記(17)に記載の診断支援プログラム。
(19)
前記学習手順は、
前記第1の病理画像の表示に関する情報に基づき重みづけを行って学習、または前記第1の病理画像の表示に関する情報ごとに分けて学習する
前記(14)~(18)のいずれか1つに記載の診断支援プログラム。
(20)
前記第1の病理画像の前記表示に関する情報は、前記第1の病理画像の表示に用いた機器、前記第1の病理画像の表示に用いたプログラム、前記第1の記病理画像の表示された領域の閲覧時間、または前記第1の病理画像の表示された領域の表示回数に関する情報である、
前記(19)に記載の診断支援プログラム。
(21)
前記学習手順は、
前記履歴情報に対応するユーザに関する情報に基づき重みづけを行って学習、または前記履歴情報に対応するユーザに関する情報ごとに分けて学習する
前記(14)~(20)のいずれか1つに記載の診断支援プログラム。
(22)
前記履歴情報に対応する前記ユーザに関する情報は、前記第1の病理画像を診断した診断者を特定する情報、または前記診断者の能力ランクを示す情報である、
前記(21)に記載の診断支援プログラム。
(23)
前記学習手順は、
診断結果が陽性を示す前記診断情報と、前記診断情報に対応する前記履歴情報とを対応付けて学習する、
前記(14)~(22)のいずれか1つに記載の診断支援プログラム。
(24)
前記学習手順は、
診断結果が陰性を示す前記診断情報と、前記診断情報に対応する前記履歴情報とを対応付けて学習する、
前記(14)~(23)のいずれか1つに記載の診断支援プログラム。
(25)
前記学習手順は、
前記第2の病理画像のうち注目領域以外の領域を、診断結果が陰性を示す前記診断情報として学習する、
前記(24)に記載の診断支援プログラム。
(26)
前記導出手順は、
前記第2の病理画像との類似度が閾値よりも高い前記第1の病理画像、または前記第2の病理画像との相関度が閾値よりも高い前記第1の病理画像に対応する閲覧履歴に関する履歴情報に基づいて、前記診断支援情報を導出する
前記(1)~(25)のいずれか1つに記載の診断支援プログラム。
(27)
顕微鏡と、
診断を支援する情報である診断支援情報を導出する導出装置、
とを備え、
前記導出装置は、
第1の患部組織に対応する第1の病理画像と、前記第1の病理画像に対する閲覧履歴に関する履歴情報と、前記第1の患部組織に対する診断情報とに基づいて、前記顕微鏡によって撮像された診断対象の第2の患部組織に対応する第2の病理画像の診断を支援する診断支援情報を導出する、
診断支援システム。
(28)
顕微鏡と、前記顕微鏡により撮像される対象物に対応する病理画像の処理に使われるソフトウェアとを含んで構成される診断支援システムであって、
前記ソフトウェアは、
第1の患部組織に対応する第1の病理画像と、前記第1の病理画像に対する閲覧履歴に関する履歴情報と、前記第1の患部組織に対する診断情報とに基づいて、前記顕微鏡によって撮像された診断対象の第2の患部組織に対応する第2の病理画像の診断を支援する診断支援情報を導出する処理を情報処理装置に実行させる、
診断支援システム。
(29)
前記診断支援システムは、さらに表示制御装置を備え、
前記表示制御装置は、
前記診断支援情報に基づいて、診断に影響があると推測される領域である注目領域を視認可能な状態で前記第2の病理画像に重畳して表示するよう制御する、
前記(27)又は(28)に記載の診断支援システム。
(30)
前記表示制御装置は、
前記注目領域を覆う画像であるマスク画像、前記注目領域の外枠を示す画像である枠画像、前記注目領域を指し示す矢印画像、または前記注目領域を説明するテキスト情報で、前記第2の病理画像に重畳して表示するよう制御する、
前記(29)に記載の診断支援システム。
(31)
前記表示制御装置は、
前記診断支援情報に基づいて、前記診断への影響度、または前記診断支援情報の信頼度に応じて、前記注目領域の表示態様を変える、
前記(29)又は(30)に記載の診断支援システム。
(32)
前記表示態様は、彩度、輝度、または透過度である、
前記(31)に記載の診断支援システム。
(33)
前記表示制御装置は、
前記注目領域に対応する前記第2の患部組織の一部画像を表示するよう制御する、
前記(29)~(32)のいずれか1つに記載の診断支援システム。
(34)
前記表示制御装置は、
前記注目領域が複数ある場合は、各注目領域に対応する病理画像を表示するよう制御する、
前記(29)~(33)のいずれか1つに記載の診断支援システム。
(35)
前記表示制御装置は、
前記各注目領域に対応する病理画像を表示画面内に並べて表示するよう制御する、
前記(34)に記載の診断支援システム。
(36)
前記表示制御装置は、
前記各注目領域に対応する病理画像を、表示画面内に前記診断への影響度、または前記診断支援情報の信頼度の高い順に並べて表示するよう制御する、
前記(35)に記載の診断支援システム。
(37)
前記表示制御装置は、
前記各注目領域に対応する病理画像を同一表示エリアに切り替えて表示するよう制御する、
前記(34)に記載の診断支援システム。
(38)
前記表示制御装置は、
前記各注目領域に対応する病理画像を、前記診断への影響度、または前記診断支援情報の信頼度の高い順に、前記同一表示エリアに切り替えて表示するよう制御する、
前記(37)に記載の診断支援システム。
(39)
前記診断支援情報は、前記第1の患部組織に対する診断結果と予測される診断予測結果である、
前記(28)~(38)のいずれか1つに記載の診断支援システム。
(40)
前記診断予測結果とは、病変部位の有無、前記病変部位の種類、前記病変部位の進行度、または前記病変部位である確率である、
前記(39)に記載の診断支援システム。
(41)
コンピュータが、
第1の患部組織に対応する第1の病理画像と、前記第1の病理画像に対する閲覧履歴に関する履歴情報と、前記第1の病理画像に対応する第1の患部組織に対する診断情報とに基づいて、診断対象の第2の患部組織に対応する第2の病理画像の診断を支援する診断支援情報を導出する
診断支援方法。
(42)
医療画像取得装置と、前記医療画像取得装置により撮像される対象物に対応する医療画像の処理に使われるソフトウェアとを含んで構成される診断支援システムであって、
前記ソフトウェアは、
第1の患部組織に対応する第1の医療画像と、前記第1の医療画像に対する閲覧履歴に関する履歴情報と、前記第1の患部組織に対する診断情報とに基づいて、前記医療画像取得装置によって撮像された診断対象の第2の患部組織に対応する第2の医療画像の診断を支援する診断支援情報を導出する処理を情報処理装置に実行させる、
診断支援システム。
(1)
第1の患部組織に対応する第1の病理画像と、前記第1の病理画像に対する閲覧履歴に関する履歴情報と、前記第1の病理画像に対応する第1の患部組織に対する診断情報とを取得する取得手順と、
前記第1の病理画像と、前記履歴情報と、前記診断情報とに基づいて、診断対象の第2の患部組織に対応する第2の病理画像の診断を支援する診断支援情報を導出する導出手順と、
を情報処理装置に実行させる診断支援プログラム。
(2)
前記導出手順は、
前記診断支援情報として、閲覧に関する情報を導出する、
前記(1)に記載の診断支援プログラム。
(3)
前記導出手順は、
診断結果が陽性である前記診断情報に対応する履歴情報を用いて、前記診断支援情報を導出する、
前記(1)又は(2)に記載の診断支援プログラム。
(4)
前記履歴情報は、前記第1の病理画像の診断時に保存された前記第1の病理画像の一部領域の画像に関する情報を含む
前記(1)~(3)のいずれか1つに記載の診断支援プログラム。
(5)
前記導出手順は、
前記第1の病理画像に対応する患者の情報が登録された医療情報システムから、前記第1の病理画像の一部領域の画像を取得する
前記(4)に記載の診断支援プログラム。
(6)
前記第1の病理画像は、前記第1の患部組織の全体を撮像した全体画像であり、
前記履歴情報は、前記第1の病理画像が閲覧された位置を示す位置情報である、
前記(1)~(5)のいずれか1つに記載の診断支援プログラム。
(7)
前記履歴情報は、前記第1の病理画像が閲覧された位置を示す位置情報、および前記第1の病理画像が閲覧された時間または回数を示す情報である、
前記(6)に記載の診断支援プログラム。
(8)
前記第1の病理画像は、前記第1の患部組織の各領域に対応する部分画像により形成される画像であり、
前記履歴情報は、前記各領域に対応する部分画像のうち、閲覧された部分画像を示す部分画像情報である、
前記(1)~(7)のいずれか1つに記載の診断支援プログラム。
(9)
前記部分画像情報は、前記部分画像の位置を示す、または前記部分画像を特定する情報である、
前記(8)に記載の診断支援プログラム。
(10)
前記導出手順は、
前記履歴情報から推定される前記第2の病理画像の注目領域に基づいて、前記診断支援情報を導出する、
前記(1)~(9)のいずれか1つに記載の診断支援プログラム。
(11)
前記導出手順は、
前記履歴情報に基づいて、表示倍率が大きい領域ほど注目度が高い注目領域とし、または、閲覧時間が長い領域ほど注目度が高い注目領域とし、または、閲覧回数が多い領域ほど注目度が高い注目領域として、前記診断支援情報を導出する、
前記(10)に記載の診断支援プログラム。
(12)
前記診断情報は、病変部位の有無、前記病変部位の種類、または前記病変部位の進行度に関する情報である、
前記(1)~(11)のいずれか1つに記載の診断支援プログラム。
(13)
前記診断情報は、前記第1の病理画像に対応する患者の情報が登録された医療情報システムから、取得される、
前記(1)~(12)のいずれか1つに記載の診断支援プログラム。
(14)
前記第1の病理画像と、前記履歴情報と、前記診断情報との対応を学習する学習手順をさらに前記コンピュータに実行させ、
前記導出手順は、
前記学習手順による学習結果を用いて、前記診断支援情報を導出する、
前記(1)~(13)のいずれか1つに記載の診断支援プログラム。
(15)
前記学習手順は、
前記第1の患部組織に関する情報に基づき重みづけを行って学習、または前記第1の患部組織に関する情報ごとに分けて学習する
前記(14)に記載の診断支援プログラム。
(16)
前記第1の患部組織に関する情報は、前記第1の患部組織が採取された患者に関する情報、前記第1の患部組織の部位情報、前記第1の患部組織を染色した試薬、または前記第1の患部組織を染色した機関に関する情報である、
前記(15)に記載の診断支援プログラム。
(17)
前記学習手順は、
前記第1の病理画像の撮像に関する情報に基づき重みづけを行って学習、または前記第1の病理画像の撮像に関する情報ごとに分けて学習する
前記(14)~(16)のいずれか1つに記載の診断支援プログラム。
(18)
前記第1の病理画像の前記撮像に関する情報は、前記第1の病理画像を撮像した機器、または前記第1の病理画像を撮像した機関に関する情報である、
前記(17)に記載の診断支援プログラム。
(19)
前記学習手順は、
前記第1の病理画像の表示に関する情報に基づき重みづけを行って学習、または前記第1の病理画像の表示に関する情報ごとに分けて学習する
前記(14)~(18)のいずれか1つに記載の診断支援プログラム。
(20)
前記第1の病理画像の前記表示に関する情報は、前記第1の病理画像の表示に用いた機器、前記第1の病理画像の表示に用いたプログラム、前記第1の記病理画像の表示された領域の閲覧時間、または前記第1の病理画像の表示された領域の表示回数に関する情報である、
前記(19)に記載の診断支援プログラム。
(21)
前記学習手順は、
前記履歴情報に対応するユーザに関する情報に基づき重みづけを行って学習、または前記履歴情報に対応するユーザに関する情報ごとに分けて学習する
前記(14)~(20)のいずれか1つに記載の診断支援プログラム。
(22)
前記履歴情報に対応する前記ユーザに関する情報は、前記第1の病理画像を診断した診断者を特定する情報、または前記診断者の能力ランクを示す情報である、
前記(21)に記載の診断支援プログラム。
(23)
前記学習手順は、
診断結果が陽性を示す前記診断情報と、前記診断情報に対応する前記履歴情報とを対応付けて学習する、
前記(14)~(22)のいずれか1つに記載の診断支援プログラム。
(24)
前記学習手順は、
診断結果が陰性を示す前記診断情報と、前記診断情報に対応する前記履歴情報とを対応付けて学習する、
前記(14)~(23)のいずれか1つに記載の診断支援プログラム。
(25)
前記学習手順は、
前記第2の病理画像のうち注目領域以外の領域を、診断結果が陰性を示す前記診断情報として学習する、
前記(24)に記載の診断支援プログラム。
(26)
前記導出手順は、
前記第2の病理画像との類似度が閾値よりも高い前記第1の病理画像、または前記第2の病理画像との相関度が閾値よりも高い前記第1の病理画像に対応する閲覧履歴に関する履歴情報に基づいて、前記診断支援情報を導出する
前記(1)~(25)のいずれか1つに記載の診断支援プログラム。
(27)
顕微鏡と、
診断を支援する情報である診断支援情報を導出する導出装置、
とを備え、
前記導出装置は、
第1の患部組織に対応する第1の病理画像と、前記第1の病理画像に対する閲覧履歴に関する履歴情報と、前記第1の患部組織に対する診断情報とに基づいて、前記顕微鏡によって撮像された診断対象の第2の患部組織に対応する第2の病理画像の診断を支援する診断支援情報を導出する、
診断支援システム。
(28)
顕微鏡と、前記顕微鏡により撮像される対象物に対応する病理画像の処理に使われるソフトウェアとを含んで構成される診断支援システムであって、
前記ソフトウェアは、
第1の患部組織に対応する第1の病理画像と、前記第1の病理画像に対する閲覧履歴に関する履歴情報と、前記第1の患部組織に対する診断情報とに基づいて、前記顕微鏡によって撮像された診断対象の第2の患部組織に対応する第2の病理画像の診断を支援する診断支援情報を導出する処理を情報処理装置に実行させる、
診断支援システム。
(29)
前記診断支援システムは、さらに表示制御装置を備え、
前記表示制御装置は、
前記診断支援情報に基づいて、診断に影響があると推測される領域である注目領域を視認可能な状態で前記第2の病理画像に重畳して表示するよう制御する、
前記(27)又は(28)に記載の診断支援システム。
(30)
前記表示制御装置は、
前記注目領域を覆う画像であるマスク画像、前記注目領域の外枠を示す画像である枠画像、前記注目領域を指し示す矢印画像、または前記注目領域を説明するテキスト情報で、前記第2の病理画像に重畳して表示するよう制御する、
前記(29)に記載の診断支援システム。
(31)
前記表示制御装置は、
前記診断支援情報に基づいて、前記診断への影響度、または前記診断支援情報の信頼度に応じて、前記注目領域の表示態様を変える、
前記(29)又は(30)に記載の診断支援システム。
(32)
前記表示態様は、彩度、輝度、または透過度である、
前記(31)に記載の診断支援システム。
(33)
前記表示制御装置は、
前記注目領域に対応する前記第2の患部組織の一部画像を表示するよう制御する、
前記(29)~(32)のいずれか1つに記載の診断支援システム。
(34)
前記表示制御装置は、
前記注目領域が複数ある場合は、各注目領域に対応する病理画像を表示するよう制御する、
前記(29)~(33)のいずれか1つに記載の診断支援システム。
(35)
前記表示制御装置は、
前記各注目領域に対応する病理画像を表示画面内に並べて表示するよう制御する、
前記(34)に記載の診断支援システム。
(36)
前記表示制御装置は、
前記各注目領域に対応する病理画像を、表示画面内に前記診断への影響度、または前記診断支援情報の信頼度の高い順に並べて表示するよう制御する、
前記(35)に記載の診断支援システム。
(37)
前記表示制御装置は、
前記各注目領域に対応する病理画像を同一表示エリアに切り替えて表示するよう制御する、
前記(34)に記載の診断支援システム。
(38)
前記表示制御装置は、
前記各注目領域に対応する病理画像を、前記診断への影響度、または前記診断支援情報の信頼度の高い順に、前記同一表示エリアに切り替えて表示するよう制御する、
前記(37)に記載の診断支援システム。
(39)
前記診断支援情報は、前記第1の患部組織に対する診断結果と予測される診断予測結果である、
前記(28)~(38)のいずれか1つに記載の診断支援システム。
(40)
前記診断予測結果とは、病変部位の有無、前記病変部位の種類、前記病変部位の進行度、または前記病変部位である確率である、
前記(39)に記載の診断支援システム。
(41)
コンピュータが、
第1の患部組織に対応する第1の病理画像と、前記第1の病理画像に対する閲覧履歴に関する履歴情報と、前記第1の病理画像に対応する第1の患部組織に対する診断情報とに基づいて、診断対象の第2の患部組織に対応する第2の病理画像の診断を支援する診断支援情報を導出する
診断支援方法。
(42)
医療画像取得装置と、前記医療画像取得装置により撮像される対象物に対応する医療画像の処理に使われるソフトウェアとを含んで構成される診断支援システムであって、
前記ソフトウェアは、
第1の患部組織に対応する第1の医療画像と、前記第1の医療画像に対する閲覧履歴に関する履歴情報と、前記第1の患部組織に対する診断情報とに基づいて、前記医療画像取得装置によって撮像された診断対象の第2の患部組織に対応する第2の医療画像の診断を支援する診断支援情報を導出する処理を情報処理装置に実行させる、
診断支援システム。
1 診断支援システム
11、21 顕微鏡
12、22 サーバ
13、23 表示制御装置
14、24 表示装置
23a 画像取得部
23b 表示制御部
100、200 導出装置
131、231 履歴情報取得部
132、232 診断情報取得部
133 学習部
134、234 導出部
11、21 顕微鏡
12、22 サーバ
13、23 表示制御装置
14、24 表示装置
23a 画像取得部
23b 表示制御部
100、200 導出装置
131、231 履歴情報取得部
132、232 診断情報取得部
133 学習部
134、234 導出部
Claims (21)
- 第1の患部組織に対応する第1の病理画像と、前記第1の病理画像に対する閲覧履歴に関する履歴情報と、前記第1の病理画像に対応する第1の患部組織に対する診断情報とに基づいて、診断対象の第2の患部組織に対応する第2の病理画像の診断を支援する診断支援情報を導出する導出手順、
をコンピュータに実行させる診断支援プログラム。 - 前記導出手順は、
前記診断支援情報として、閲覧に関する情報を導出する、
請求項1に記載の診断支援プログラム。 - 前記第1の病理画像は、前記第1の患部組織の全体を撮像した全体画像であり、
前記履歴情報は、前記第1の病理画像が閲覧された位置を示す位置情報である、
請求項1に記載の診断支援プログラム。 - 前記履歴情報は、前記第1の病理画像が閲覧された位置を示す位置情報、および前記第1の病理画像が閲覧された時間または回数を示す情報である、
請求項3に記載の診断支援プログラム。 - 前記第1の病理画像は、前記第1の患部組織の各領域に対応する部分画像により形成される画像であり、
前記履歴情報は、前記各領域に対応する部分画像のうち、閲覧された部分画像を示す部分画像情報である、
請求項1に記載の診断支援プログラム。 - 前記導出手順は、
前記履歴情報から推定される前記第2の病理画像の注目領域に基づいて、前記診断支援情報を導出する、
請求項1に記載の診断支援プログラム。 - 前記導出手順は、
前記履歴情報に基づいて、表示倍率が大きい領域ほど注目度が高い注目領域とし、または、閲覧時間が長い領域ほど注目度が高い注目領域とし、または、閲覧回数が多い領域ほど注目度が高い注目領域として、前記診断支援情報を導出する、
請求項6に記載の診断支援プログラム。 - 前記診断情報は、病変部位の有無、前記病変部位の種類、または前記病変部位の進行度に関する情報である、
請求項1に記載の診断支援プログラム。 - 前記第1の病理画像と、前記履歴情報と、前記診断情報との対応を学習する学習手順をさらに前記コンピュータに実行させ、
前記導出手順は、
前記学習手順による学習結果を用いて、前記診断支援情報を導出する、
請求項1に記載の診断支援プログラム。 - 前記学習手順は、
診断結果が陽性を示す前記診断情報と、前記診断情報に対応する前記履歴情報とを対応付けて学習する、
請求項9に記載の診断支援プログラム。 - 前記学習手順は、
診断結果が陰性を示す前記診断情報と、前記診断情報に対応する前記履歴情報とを対応付けて学習する、
請求項9に記載の診断支援プログラム。 - 前記学習手順は、
前記第2の病理画像のうち注目領域以外の領域を、診断結果が陰性を示す前記診断情報として学習する、
請求項11に記載の診断支援プログラム。 - 前記導出手順は、
前記第2の病理画像との類似度が閾値よりも高い前記第1の病理画像、または前記第2の病理画像との相関度が閾値よりも高い前記第1の病理画像に対応する閲覧履歴に関する履歴情報に基づいて、前記診断支援情報を導出する
請求項1に記載の診断支援プログラム。 - 顕微鏡と、
診断を支援する情報である診断支援情報を導出する導出装置、
とを備え、
前記導出装置は、
第1の患部組織に対応する第1の病理画像と、前記第1の病理画像に対する閲覧履歴に関する履歴情報と、前記第1の患部組織に対する診断情報とに基づいて、前記顕微鏡によって撮像された診断対象の第2の患部組織に対応する第2の病理画像の診断を支援する診断支援情報を導出する、
診断支援システム。 - 前記診断支援システムは、さらに表示制御装置を備え、
前記表示制御装置は、
前記診断支援情報に基づいて、診断に影響があると推測される領域である注目領域を視認可能な状態で前記第2の病理画像に重畳して表示するよう制御する、
請求項14に記載の診断支援システム。 - 前記表示制御装置は、
前記診断支援情報に基づいて、前記診断への影響度、または前記診断支援情報の信頼度に応じて、前記注目領域の表示態様を変える、
請求項15に記載の診断支援システム。 - 前記表示制御装置は、
前記注目領域に対応する前記第2の患部組織の一部画像を表示するよう制御する、
請求項15に記載の診断支援システム。 - 前記診断支援情報は、前記第1の患部組織に対する診断結果と予測される診断予測結果である、
請求項14に記載の診断支援システム。 - 前記診断予測結果とは、病変部位の有無、前記病変部位の種類、前記病変部位の進行度、または前記病変部位である確率である、
請求項18に記載の診断支援システム。 - コンピュータが、
第1の患部組織に対応する第1の病理画像と、前記第1の病理画像に対する閲覧履歴に関する履歴情報と、前記第1の病理画像に対応する第1の患部組織に対する診断情報とに基づいて、診断対象の第2の患部組織に対応する第2の病理画像の診断を支援する診断支援情報を導出する
診断支援方法。 - 顕微鏡と、前記顕微鏡により撮像される対象物に対応する病理画像の処理に使われるソフトウェアとを含んで構成される診断支援システムであって、
前記ソフトウェアは、
第1の患部組織に対応する第1の病理画像と、前記第1の病理画像に対する閲覧履歴に関する履歴情報と、前記第1の患部組織に対する診断情報とに基づいて、前記顕微鏡によって撮像された診断対象の第2の患部組織に対応する第2の病理画像の診断を支援する診断支援情報を導出する処理を情報処理装置に実行させる、
診断支援システム。
Priority Applications (3)
| Application Number | Priority Date | Filing Date | Title |
|---|---|---|---|
| US17/433,566 US12183449B2 (en) | 2019-02-28 | 2019-12-25 | Diagnosis support program, diagnosis support system, and diagnosis support method |
| EP19916878.2A EP3933849A4 (en) | 2019-02-28 | 2019-12-25 | DIAGNOSTIC SUPPORT PROGRAM, DIAGNOSTIC SUPPORT SYSTEM AND DIAGNOSTIC SUPPORT PROCEDURE |
| JP2021501643A JP7589679B2 (ja) | 2019-02-28 | 2019-12-25 | 診断支援プログラム、診断支援システム及び診断支援方法 |
Applications Claiming Priority (2)
| Application Number | Priority Date | Filing Date | Title |
|---|---|---|---|
| JP2019036899 | 2019-02-28 | ||
| JP2019-036899 | 2019-02-28 |
Publications (1)
| Publication Number | Publication Date |
|---|---|
| WO2020174863A1 true WO2020174863A1 (ja) | 2020-09-03 |
Family
ID=72239473
Family Applications (1)
| Application Number | Title | Priority Date | Filing Date |
|---|---|---|---|
| PCT/JP2019/050880 Ceased WO2020174863A1 (ja) | 2019-02-28 | 2019-12-25 | 診断支援プログラム、診断支援システム及び診断支援方法 |
Country Status (4)
| Country | Link |
|---|---|
| US (1) | US12183449B2 (ja) |
| EP (1) | EP3933849A4 (ja) |
| JP (1) | JP7589679B2 (ja) |
| WO (1) | WO2020174863A1 (ja) |
Cited By (9)
| Publication number | Priority date | Publication date | Assignee | Title |
|---|---|---|---|---|
| JP2022534155A (ja) * | 2019-05-29 | 2022-07-28 | ライカ バイオシステムズ イメージング インコーポレイテッド | デジタルパソロジー画像の関心領域のニューラルネットワークベースの特定方法 |
| JP2022121167A (ja) * | 2021-02-08 | 2022-08-19 | キヤノン株式会社 | 画像処理装置、画像処理装置の制御方法およびプログラム |
| WO2022190891A1 (ja) | 2021-03-11 | 2022-09-15 | ソニーグループ株式会社 | 情報処理システム及び情報処理方法 |
| JP2022165209A (ja) * | 2021-04-19 | 2022-10-31 | キヤノン株式会社 | 情報処理装置、情報処理システムおよび情報処理方法 |
| JP2022171177A (ja) * | 2021-04-30 | 2022-11-11 | キヤノン株式会社 | 画像処理装置、撮像装置及びその制御方法とプログラム |
| WO2024024022A1 (ja) * | 2022-07-28 | 2024-02-01 | 日本電気株式会社 | 内視鏡検査支援装置、内視鏡検査支援方法、及び、記録媒体 |
| WO2024150379A1 (ja) * | 2023-01-12 | 2024-07-18 | 日本電気株式会社 | 情報処理装置、情報処理方法、プログラム |
| JP2025036805A (ja) * | 2023-09-05 | 2025-03-17 | メドメイン株式会社 | 病理診断支援システム、病理診断支援方法及びプログラム |
| US12597506B2 (en) | 2023-12-05 | 2026-04-07 | Nec Corporation | Endoscopic examination support apparatus, endoscopic examination support method, and recording medium |
Families Citing this family (1)
| Publication number | Priority date | Publication date | Assignee | Title |
|---|---|---|---|---|
| US12315152B2 (en) * | 2022-07-12 | 2025-05-27 | Imvaria Inc. | Machine learning models for automated diagnosis of disease database entities |
Citations (2)
| Publication number | Priority date | Publication date | Assignee | Title |
|---|---|---|---|---|
| JP2012155455A (ja) * | 2011-01-25 | 2012-08-16 | Sony Corp | 画像処理装置および方法、並びにプログラム |
| JP2015116319A (ja) * | 2013-12-18 | 2015-06-25 | パナソニックIpマネジメント株式会社 | 診断支援装置、診断支援方法、および診断支援プログラム |
Family Cites Families (5)
| Publication number | Priority date | Publication date | Assignee | Title |
|---|---|---|---|---|
| US6912462B2 (en) | 2000-08-31 | 2005-06-28 | Sony Corporation | Information processing apparatus, information processing method and program storage media |
| CN103140757A (zh) * | 2010-09-30 | 2013-06-05 | 日本电气株式会社 | 信息处理设备、信息处理系统、信息处理方法、程序和记录介质 |
| JP2014029380A (ja) * | 2012-07-31 | 2014-02-13 | Sony Corp | 情報処理装置、情報処理方法、プログラム及び画像表示装置 |
| JP6400304B2 (ja) | 2014-02-28 | 2018-10-03 | キヤノンメディカルシステムズ株式会社 | 医用画像表示装置 |
| US11551353B2 (en) * | 2017-11-22 | 2023-01-10 | Arterys Inc. | Content based image retrieval for lesion analysis |
-
2019
- 2019-12-25 WO PCT/JP2019/050880 patent/WO2020174863A1/ja not_active Ceased
- 2019-12-25 US US17/433,566 patent/US12183449B2/en active Active
- 2019-12-25 JP JP2021501643A patent/JP7589679B2/ja active Active
- 2019-12-25 EP EP19916878.2A patent/EP3933849A4/en not_active Withdrawn
Patent Citations (2)
| Publication number | Priority date | Publication date | Assignee | Title |
|---|---|---|---|---|
| JP2012155455A (ja) * | 2011-01-25 | 2012-08-16 | Sony Corp | 画像処理装置および方法、並びにプログラム |
| JP2015116319A (ja) * | 2013-12-18 | 2015-06-25 | パナソニックIpマネジメント株式会社 | 診断支援装置、診断支援方法、および診断支援プログラム |
Non-Patent Citations (3)
| Title |
|---|
| JESSICAL L. BAUMANNKARI GARSHAMIKE S. FLORESFAITH OUGHEHAB A. ELGABRY, ANNOTATION OF WHOLE SLIDE IMAGES USING TOUCHSCREEN TECHNOLOGY |
| MIORI MARUYA, YOSHINORI DOBASHI, TSUYOSHI YAMAMOTO: "A study on importance estimation of medical images by learning user's operation history", ITE TECHNICAL REPORT, vol. 35, no. 9, 14 February 2011 (2011-02-14), pages 41 - 45, XP009529893, ISSN: 1342-6893, DOI: 10.11485/itetr.35.9.0_41 * |
| See also references of EP3933849A4 |
Cited By (17)
| Publication number | Priority date | Publication date | Assignee | Title |
|---|---|---|---|---|
| US12094182B2 (en) | 2019-05-29 | 2024-09-17 | Leica Biosystems Imaging Inc. | Neural network based identification of areas of interest in digital pathology images |
| JP2022534155A (ja) * | 2019-05-29 | 2022-07-28 | ライカ バイオシステムズ イメージング インコーポレイテッド | デジタルパソロジー画像の関心領域のニューラルネットワークベースの特定方法 |
| JP7793293B2 (ja) | 2021-02-08 | 2026-01-05 | キヤノン株式会社 | 画像処理装置、画像処理装置の制御方法およびプログラム |
| US12548353B2 (en) | 2021-02-08 | 2026-02-10 | Canon Kabushiki Kaisha | Image processing apparatus supporting observation of object using microscope, control method therefor, and storage medium storing control program therefor |
| JP2022121167A (ja) * | 2021-02-08 | 2022-08-19 | キヤノン株式会社 | 画像処理装置、画像処理装置の制御方法およびプログラム |
| WO2022190891A1 (ja) | 2021-03-11 | 2022-09-15 | ソニーグループ株式会社 | 情報処理システム及び情報処理方法 |
| JP7676205B2 (ja) | 2021-04-19 | 2025-05-14 | キヤノン株式会社 | 情報処理装置、情報処理システムおよび情報処理方法 |
| JP2022165209A (ja) * | 2021-04-19 | 2022-10-31 | キヤノン株式会社 | 情報処理装置、情報処理システムおよび情報処理方法 |
| JP2022171177A (ja) * | 2021-04-30 | 2022-11-11 | キヤノン株式会社 | 画像処理装置、撮像装置及びその制御方法とプログラム |
| JPWO2024024022A1 (ja) * | 2022-07-28 | 2024-02-01 | ||
| JP7750418B2 (ja) | 2022-07-28 | 2025-10-07 | 日本電気株式会社 | 内視鏡検査支援装置、内視鏡検査支援方法、及び、プログラム |
| US12533006B2 (en) | 2022-07-28 | 2026-01-27 | Nec Corporation | Endoscopic examination support apparatus, endoscopic examination support method, and recording medium |
| WO2024024022A1 (ja) * | 2022-07-28 | 2024-02-01 | 日本電気株式会社 | 内視鏡検査支援装置、内視鏡検査支援方法、及び、記録媒体 |
| US12551090B2 (en) | 2022-07-28 | 2026-02-17 | Nec Corporation | Endoscopic examination support apparatus, endoscopic examination support method, and recording medium |
| WO2024150379A1 (ja) * | 2023-01-12 | 2024-07-18 | 日本電気株式会社 | 情報処理装置、情報処理方法、プログラム |
| JP2025036805A (ja) * | 2023-09-05 | 2025-03-17 | メドメイン株式会社 | 病理診断支援システム、病理診断支援方法及びプログラム |
| US12597506B2 (en) | 2023-12-05 | 2026-04-07 | Nec Corporation | Endoscopic examination support apparatus, endoscopic examination support method, and recording medium |
Also Published As
| Publication number | Publication date |
|---|---|
| EP3933849A4 (en) | 2022-04-20 |
| JPWO2020174863A1 (ja) | 2021-12-23 |
| US12183449B2 (en) | 2024-12-31 |
| JP7589679B2 (ja) | 2024-11-26 |
| EP3933849A1 (en) | 2022-01-05 |
| US20220148714A1 (en) | 2022-05-12 |
Similar Documents
| Publication | Publication Date | Title |
|---|---|---|
| JP7589679B2 (ja) | 診断支援プログラム、診断支援システム及び診断支援方法 | |
| JP7366583B2 (ja) | 医用情報処理装置、方法及びプログラム | |
| EP3937183B1 (en) | Image analysis method, microscope video stream processing method, and related apparatus | |
| US20200320336A1 (en) | Control method and recording medium | |
| US11756673B2 (en) | Medical information processing apparatus and medical information processing method | |
| US20210133231A1 (en) | Control method and non-transitory computer-readable recording medium for comparing medical images | |
| JP5383431B2 (ja) | 情報処理装置、情報処理方法及びプログラム | |
| JP6438395B2 (ja) | 効果的な表示及び報告のための画像資料に関連する以前の注釈の自動検出及び取り出し | |
| JP5927591B2 (ja) | 症例表示装置、症例表示方法およびプログラム | |
| US20130093781A1 (en) | Examination information display device and method | |
| US10261681B2 (en) | Method for displaying a medical image and a plurality of similar medical images obtained from a case search system | |
| JP5661890B2 (ja) | 情報処理装置、情報処理方法及びプログラム | |
| JP5487157B2 (ja) | 画像処理装置および画像処理装置の作動方法並びに画像処理プログラム | |
| JP7652188B2 (ja) | 情報処理装置、情報処理方法及び情報処理システム | |
| US20230057933A1 (en) | Storage medium, diagnosis support apparatus and diagnosis support method | |
| EP3714467A2 (en) | Content based image retrieval for lesion analysis | |
| JP6845071B2 (ja) | 自動レイアウト装置および自動レイアウト方法並びに自動レイアウトプログラム | |
| JP2010167042A (ja) | 医用診断支援装置及びその制御方法、並びに、プログラム | |
| JP2018175864A (ja) | 自動レイアウト装置および自動レイアウト方法並びに自動レイアウトプログラム | |
| KR102222509B1 (ko) | 의료 영상에 관한 판단을 보조하는 방법 및 이를 이용한 장치 | |
| JP2011103095A (ja) | 医用画像表示システム及びプログラム | |
| JP2013052245A (ja) | 情報処理装置および情報処理方法 | |
| US20230259816A1 (en) | Determination support device, information processing device, and training method | |
| JP2023043344A (ja) | 医療画像処理装置、医療画像処理装置の作動方法、及び医療画像処理用プログラム | |
| JP5533198B2 (ja) | 医用画像表示装置及びプログラム |
Legal Events
| Date | Code | Title | Description |
|---|---|---|---|
| 121 | Ep: the epo has been informed by wipo that ep was designated in this application |
Ref document number: 19916878 Country of ref document: EP Kind code of ref document: A1 |
|
| ENP | Entry into the national phase |
Ref document number: 2021501643 Country of ref document: JP Kind code of ref document: A |
|
| NENP | Non-entry into the national phase |
Ref country code: DE |
|
| ENP | Entry into the national phase |
Ref document number: 2019916878 Country of ref document: EP Effective date: 20210928 |