WO2020209253A1 - Dispositif de création de données spatiales, procédé de création de données spatiales et programme - Google Patents
Dispositif de création de données spatiales, procédé de création de données spatiales et programme Download PDFInfo
- Publication number
- WO2020209253A1 WO2020209253A1 PCT/JP2020/015675 JP2020015675W WO2020209253A1 WO 2020209253 A1 WO2020209253 A1 WO 2020209253A1 JP 2020015675 W JP2020015675 W JP 2020015675W WO 2020209253 A1 WO2020209253 A1 WO 2020209253A1
- Authority
- WO
- WIPO (PCT)
- Prior art keywords
- data
- evaluation
- spatial
- subspace
- spatial data
- Prior art date
- Legal status (The legal status is an assumption and is not a legal conclusion. Google has not performed a legal analysis and makes no representation as to the accuracy of the status listed.)
- Ceased
Links
Images


Classifications
-
- H—ELECTRICITY
- H04—ELECTRIC COMMUNICATION TECHNIQUE
- H04W—WIRELESS COMMUNICATION NETWORKS
- H04W4/00—Services specially adapted for wireless communication networks; Facilities therefor
- H04W4/60—Subscription-based services using application servers or record carriers, e.g. SIM application toolkits
-
- H—ELECTRICITY
- H04—ELECTRIC COMMUNICATION TECHNIQUE
- H04B—TRANSMISSION
- H04B17/00—Monitoring; Testing
- H04B17/30—Monitoring; Testing of propagation channels
- H04B17/309—Measuring or estimating channel quality parameters
- H04B17/318—Received signal strength
- H04B17/327—Received signal code power [RSCP]
-
- H—ELECTRICITY
- H04—ELECTRIC COMMUNICATION TECHNIQUE
- H04B—TRANSMISSION
- H04B17/00—Monitoring; Testing
- H04B17/30—Monitoring; Testing of propagation channels
- H04B17/391—Modelling the propagation channel
-
- H—ELECTRICITY
- H04—ELECTRIC COMMUNICATION TECHNIQUE
- H04W—WIRELESS COMMUNICATION NETWORKS
- H04W4/00—Services specially adapted for wireless communication networks; Facilities therefor
- H04W4/02—Services making use of location information
- H04W4/021—Services related to particular areas, e.g. point of interest [POI] services, venue services or geofences
-
- H—ELECTRICITY
- H04—ELECTRIC COMMUNICATION TECHNIQUE
- H04W—WIRELESS COMMUNICATION NETWORKS
- H04W4/00—Services specially adapted for wireless communication networks; Facilities therefor
- H04W4/02—Services making use of location information
- H04W4/023—Services making use of location information using mutual or relative location information between multiple location based services [LBS] targets or of distance thresholds
-
- H—ELECTRICITY
- H04—ELECTRIC COMMUNICATION TECHNIQUE
- H04W—WIRELESS COMMUNICATION NETWORKS
- H04W4/00—Services specially adapted for wireless communication networks; Facilities therefor
- H04W4/02—Services making use of location information
- H04W4/029—Location-based management or tracking services
-
- H—ELECTRICITY
- H04—ELECTRIC COMMUNICATION TECHNIQUE
- H04W—WIRELESS COMMUNICATION NETWORKS
- H04W4/00—Services specially adapted for wireless communication networks; Facilities therefor
- H04W4/30—Services specially adapted for particular environments, situations or purposes
- H04W4/38—Services specially adapted for particular environments, situations or purposes for collecting sensor information
Definitions
- the present invention is based on the priority claim of Japanese patent application: Japanese Patent Application No. 2019-075357 (filed on April 11, 2019), and all the contents of the application are incorporated in this document by citation. It shall be.
- the present invention relates to a spatial data creation device, a spatial data creation method and a program.
- Patent Documents 1 and 2 a method of calculating an estimated value by a kriging method or an IDW (Inverse Distance Weighting) method using an observed value or an observed amount measured at a measurement point is known. In these methods, an error occurs in the estimated value depending on the installation condition of the sensor and the presence of obstacles around the sensor. Therefore, Patent Documents 1 and 2 propose to improve the accuracy by performing interpolation and weighted averaging using "reliability" and "impact", respectively.
- Patent Document 3 describes a radio wave environment data correction system that can more accurately correct radio wave environment data using actual measurement data at measurement points in an area around a base station of a wireless communication system at a limited number of measurement points.
- this radio wave environment data correction system includes a correction value determining means, a sub-area dividing means, a correction value calculating means, and a radio wave environment correcting means. Then, the correction value determining means measures the sub-area, which is an area divided based on the area usage classification, which is a predetermined division according to the layout of the object or space in the evaluation area, and belongs to the sub-area. The correction value is determined based on the measured data at the point.
- the sub-area division means divides the evaluation area into sub-areas based on the area usage classification. Further, the correction value calculation means calculates the correction value in the sub area by using the actual measurement data in which the measurement point is inside the sub area. Then, the radio wave environment correction means corrects the radio wave environment data inside the sub area by using the calculated correction value.
- Patent Document 4 discloses a method of setting the transmission power of a radio base station, which can appropriately set the transmission power of the radio signal of the indoor base station and minimize the interference with the outdoor base station. ..
- the radio base station has a receiving electric field strength measuring means, a building intrusion loss estimating means, and a transmitting power setting means. Then, the building intrusion loss estimating means estimates the building intrusion loss of the radio signal in the building where the indoor radio base station is installed, and the transmission power setting means estimates the building intrusion loss in the indoor based on the estimated building intrusion loss. Set the maximum transmission power of the wireless base station of.
- Patent Document 5 discloses an information processing device capable of appropriately grouping a plurality of wireless communication devices. Further, Patent Document 6 discloses an operation analyzer in a manufacturing process that enables appropriate analysis of process operation and quality data.
- Patent Documents 1 and 2 propose to improve the accuracy by performing interpolation and weighted averaging using "reliability" and "impact", respectively.
- the methods of Patent Documents 1 and 2 have a problem that information for determining these "reliability” and "impact” must be prepared.
- the "reliability" of Patent Document 1 is determined based on the reference information (external reference information) input from the external device, it is necessary to prepare this external reference information. This point is the same as in Patent Document 2, and the degree of influence by obstacles (shields) is evaluated by performing a preliminary evaluation step.
- One of the objects of the present invention is to use a spatial data creation device, a spatial data creation method, and a program that can contribute to the improvement of accuracy when creating spatial data from estimation data by using an approach different from each document of the background technology.
- the purpose is to provide.
- spatial data in which the position in the target area and the value related to the position are associated is created.
- a spatial data creation device including a spatial data creation unit, a partial spatial data evaluation unit that determines whether or not to adopt the subspace data by comparing the subspace data with the evaluation data. Will be done.
- spatial data in which the position in the target area and the value related to the position are associated is created.
- the estimation data for the purpose and the evaluation data obtained from the second sensor group installed at a position different from the position where the first sensor group is installed in the target area are input, respectively, and described above.
- the evaluation data is classified based on the difference between the evaluation data and the value of the spatial data corresponding to the acquisition position of the evaluation data, and the estimation data is classified by the data classification unit.
- subspace data forming a part of the spatial data is created, and the subspace data and the subspace data are described.
- a spatial data creation method for determining whether or not to adopt the subspatial data is provided by comparison with the evaluation data. This method is linked to a specific machine, a computer, that creates spatial data using data obtained from the first and second sensor groups.
- the computer is based on the data obtained from the first sensor group arranged in the target area, and the spatial data in which the position in the target area and the value related to the position are associated with each other.
- the estimation data for creating the above and the evaluation data obtained from the second sensor group installed at a position different from the position where the first sensor group is installed in the target area are input respectively.
- the processing for classifying the evaluation data and the processing for classifying the evaluation data based on the difference between the evaluation data and the value of the spatial data corresponding to the acquisition position of the evaluation data and the estimation data.
- a program for executing the process of determining whether or not to adopt the subspace data by comparing the subspace data with the evaluation data is provided.
- this program can be recorded on a computer-readable (non-transitional) storage medium. That is, the present invention can also be embodied as a computer program product.
- this program is input to a computer device from an input device or an external communication interface, stored in a storage device, drives a processor according to a predetermined step or process, and if necessary, the processing result including an intermediate state. Can be displayed step by step via a display device, or can communicate with the outside via a communication interface.
- Computer devices for this purpose typically include a processor, a storage device, an input device, a communication interface, and, if necessary, a display device that can be connected to each other by a bus.
- the present invention it is possible to improve the accuracy when creating spatial data from estimation data. That is, the present invention transforms the spatial data creation apparatus shown in the background technology into a configuration in which the spatial data creation accuracy is dramatically improved.
- the drawing reference reference numerals added to this outline are added to each element for convenience as an example for assisting understanding, and the present invention is not intended to be limited to the illustrated embodiment.
- the connecting line between blocks such as drawings referred to in the following description includes both bidirectional and unidirectional.
- the one-way arrow schematically shows the flow of the main signal (data), and does not exclude interactivity.
- the program is executed via a computer device, which includes, for example, a processor, a storage device, an input device, a communication interface, and, if necessary, a display device.
- the computer device is configured to be able to communicate with a device inside or outside the device (including a computer) via a communication interface regardless of whether it is wired or wireless.
- a communication interface regardless of whether it is wired or wireless.
- ports or interfaces at the input / output connection points of each block in the figure, they are not shown.
- a and / or B is used to mean at least one of A and B.
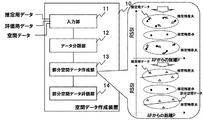
- a spatial data creation device including an input unit 11, a data classification unit 12, a subspace data creation unit 13, and a subspace data evaluation unit 14. It can be realized at 10.
- the estimation data and the evaluation data are input to the input unit 11, respectively.
- the estimation data is data for creating spatial data in which a position in the target area and a value related to the position are associated with each other.
- This estimation data is data obtained from the first sensor group arranged in the target area.
- the evaluation data is actual measurement data obtained from the second sensor group installed at a position different from the position where the first sensor group is installed in the target area.
- the data classification unit 12 classifies the evaluation data based on the difference between the evaluation data and the value of the spatial data corresponding to the acquisition position of the evaluation data.
- the upper black circle in the balloon on the right side of FIG. 2 shows the evaluation data which is the measured value measured at the distance P from a certain AP (access point).
- the data classification unit 12 classifies the evaluation data based on the difference between the evaluation data and the value of the spatial data corresponding to the acquisition position of each evaluation data. For example, in the present embodiment, as shown by the broken line in the lower row in the balloon on the right side of FIG. 2, attention is paid to the residual as a specific example of the difference. In this case, the data classification unit 12 classifies the evaluation data into a group in which the residual is largely generated on the + (plus) side and a group in which the residual is largely generated on the ⁇ (minus) side.
- the subspace data creation unit 13 uses the data obtained from the first sensor selected based on the acquisition position of the evaluation data classified by the data classification unit among the estimation data. Create subspace data that is part of the spatial data. For example, the subspace data creation unit 13 selects estimation data close to the evaluation data acquisition position, as shown in the upper part of the balloon on the right side of FIG. Then, the subspace data creation unit 13 creates subspace data using the selected estimation data, as shown in the lower part of the balloon on the right side of FIG.
- the method for creating the subspace data a method selected from the kriging method, the IDW method, and the like based on the use of the spatial data and the expected accuracy can be used.
- the subspace data may be created by using the same method as the spatial data.
- the subspace data evaluation unit 14 determines whether or not to adopt the subspace data by comparing the subspace data with the evaluation data. For example, the subspace data evaluation unit 14 determines whether or not to adopt the subspace data by comparing the subspace data with the evaluation data, as shown in the balloon on the right side of FIG. In the example of FIG. 4, since a good result is obtained as a result of comparing the subspace data with the evaluation data, the subspace data evaluation unit 14 decides to adopt the subspace data.
- Such subspace data can be used as spatial data that complements the inaccurate portion of the spatial data. Specifically, when estimating the data at a certain position in the target area, a good estimated value can be obtained by using the subspace data in preference to the spatial data. In addition, this estimated value can also be used for position estimation and map creation.
- -Spatial data Data composed of a set of position information indicating a position in a certain space and a feature amount at that position.
- -Spatial data estimation To create spatial data by estimating the distribution of features in space. For example, there are typical methods such as spline interpolation and kriging, but they are not limited to this. For example, the IDW method described in the background art is also included.
- the estimation data refers to data in which the position of the first sensor in the target area sampled for estimating the spatial data and the feature amount are associated with each other.
- the evaluation data is data in which the feature amount measured by the second sensor arranged in the target area is associated with the position of the second sensor. This evaluation data is used for classification of evaluation data and acceptance / rejection of subspace data.
- -Classification means to divide the whole into several groups.
- the classification by the evaluation data classification unit 106 refers to grouping the evaluation data. Therefore, "performing spatial data estimation independently for each classification" means performing spatial data estimation using estimation data belonging to each classified set.
- FIG. 5 is a diagram showing the configuration of the spatial data creation device according to the first embodiment of the present invention.
- the spatial data creation unit 105 the evaluation data classification unit 106, the partial spatial data creation unit 107, the partial spatial data evaluation unit 108, the spatial data output unit 109, and the storage device 110 are included. The configuration provided is shown.
- the storage device 110 functions as an estimation data storage unit 101, an evaluation data storage unit 102, a spatial data storage unit 103, and a subspace data primary storage unit 104.
- the estimation data storage unit 101 stores estimation data (estimation data) used for the above-mentioned spatial data estimation.
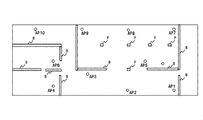
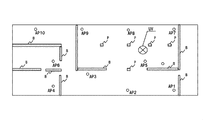
- the radio wave reception intensity when the radio waves transmitted from each AP of AP1 to AP10 arranged in the target area of FIG. 6 are received at each position of AP1 to AP10 can be used as estimation data.
- a first sensor can be installed at each position of AP1 to AP10.
- One AP transmits radio waves as a transmitting station, and another AP measures the received signal strength (RSSI) as a first sensor.
- RSSI received signal strength
- estimation data linked to the position of the AP can be obtained.
- B indicates Barrier (barrier, shield)
- P indicates Pillar (pillar).
- the spatial data storage unit 103 stores the spatial data created by the spatial data creation unit 105 using the above estimation data.
- the spatial data held in the spatial data storage unit 103 is illustrated in FIG. 22, for example. By creating such spatial data for each AP and synthesizing it, it is possible to create a spatial data map for radio quality evaluation of the target area.
- the evaluation data storage unit 102 stores evaluation data (evaluation data).
- evaluation data the measured value of the received signal strength (RSSI) at an arbitrary position of the radio wave transmitted from each AP can be used.
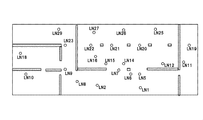
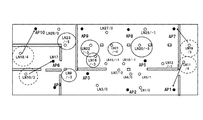
- FIG. 7 shows an example of arranging the measurement points LN1 to LN29 of the evaluation data in the target area.
- the measurement points LN1 to LN29 can be uniformly arranged in the target area, but may be mainly arranged in a place where a highly accurate estimated value is required.
- the radio waves transmitted by a certain AP as a transmitting station are received by these LN1 to LN29 as a second sensor, and the received signal strength (RSSI) is measured as a feature amount to obtain evaluation data linked to the position. Obtainable.
- the subspace data primary storage unit 104 groups the measurement points LN1 to LN29 and stores the subspace data created by using the estimated data for each group. While the above-mentioned spatial data represents an estimated value of the entire target area, this subspace data is an estimated value of a part of the target area (not necessarily a physically continuous area).
- the spatial data creation unit 105 creates spatial data using the above-mentioned spatial data estimation and stores it in the spatial data storage unit 103.
- the evaluation data classification unit 106 functions as a data classification unit that classifies (groups) the evaluation data based on the difference between the evaluation data and the spatial data. For example, the evaluation data classification unit 106 evaluates based on the residual of the spatial data (see FIG. 22) stored in the spatial data storage unit 103 and the evaluation data measured at the measurement points LN1 to LN29. Classify the data for use.
- the residual (dBm; decibel millimeter) is an estimated value of spatial data-a value of evaluation data. Therefore, when the residual is a positive value, the larger the value is, the worse the actual radio wave reception intensity is than the estimated value. On the contrary, when the residual is a negative value, the larger the value (absolute value) is, the better the actual radio wave reception intensity is than the estimated value.
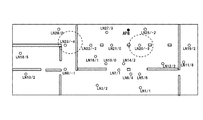
- FIG. 8 is a diagram showing the spatial data of AP8 and the residual of RSSI in LN1 to LN29.
- “LNxx / yy” in the figure indicates that the residual at an arbitrary measurement point LNxx is “yy” (xx is a natural number from 1 to 29 in this embodiment).
- a portion having a residual of 3 or more is detected in the portion of the circle indicated by the broken line.
- LN5, LN6, LN11, and LN18 indicate that the actual radio wave condition is poor.
- the actual radio wave condition is better than the estimated value.
- a portion having a residual of -3 or less is detected in the portion of the circle indicated by the broken line.
- LN20 and LN23 indicate that the actual radio wave condition is better than the estimated value.
- the evaluation data classification unit 106 calculates the residual with the spatial data for the radio waves transmitted from other APs as well as the AP8.
- FIG. 10 is a diagram showing the spatial data of AP10 and the residual of RSSI in LN1 to LN29. In the case of FIG. 10, a portion having a residual of 3 or more is detected in the portion of the circle indicated by the broken line. Similarly, in the case of FIG. 11, a portion having a residual of -3 or less is detected in the portion of the circle shown by the broken line.
- the evaluation data classification unit 106 of the present embodiment calculates the average value of the spatial data of each AP described above and the residual value of RSSI in LN1 to LN29, and classifies the evaluation data (grouping) based on the result. ). For example, as shown in FIG. 12, when the spatial data of each AP and the average value of the residuals of RSSI in LN1 to LN29 are calculated, the evaluation data classification unit 106 has a positive residual average value. The large evaluation data is classified into the first group (see the broken circle in FIG. 12). Similarly, the evaluation data classification unit 106 classifies the evaluation data having a negative residual mean value and a large absolute value into the second group (see the solid line circle in FIG. 12).
- the subspace data creation unit 107 selects the nearest estimation data from the measurement points of the evaluation data for each of the classified groups, and creates the subspace data using the set of the estimation data.
- the subspace data created by the subspace data creation unit 107 is temporarily stored in the subspace data primary storage unit 104.
- the subspace data evaluation unit 108 compares the evaluation data with the subspace data and calculates the residual (residual of the subspace data). Then, the subspace data evaluation unit 108 compares the total value or the average value of the residuals of the subspace data with the total value or the average value of the residuals of the spatial data and the evaluation data calculated by the evaluation data classification unit 106. To do. As a result of the comparison, when the residual of the subspace data is smaller, the subspace data evaluation unit 108 adopts the subspace data. Further, the subspace data evaluation unit 108 stores the subspace data in the spatial data storage unit 103.
- the subspace data evaluation unit 108 must adopt the subspace data. judge.
- the subspace data evaluation unit 108 does not store the subspace data in the spatial data storage unit 103.
- the spatial data output unit 109 outputs the spatial data stored in the spatial data storage unit 103 in a predetermined mode after the determination by the subspace data evaluation unit 108.
- this predetermined mode various modes such as a two-dimensional radio wave map as shown in FIG. 22 and a three-dimensional radio wave map can be considered.
- various data such as estimation data and evaluation data stored in the storage device 110 described above are input from the outside via an input device or a communication interface (not shown). Therefore, in the present embodiment, these input devices and communication interfaces function as input units.
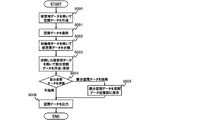
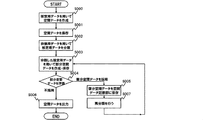
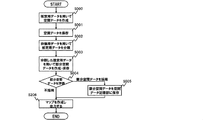
- FIG. 13 is a flow chart showing the operation of the spatial data creation device 100 according to the first embodiment of the present invention.
- the spatial data creation device 100 reads the estimation data from the estimation data storage unit 101 and creates the spatial data of the target area (step S000).
- the spatial data creation device 100 saves the created spatial data in the spatial data storage unit 103 (step S001).
- the spatial data creation device 100 calculates the residual between the created spatial data and the evaluation data of the evaluation data storage unit 102, and classifies the evaluation data based on the residual value. For example, a group having an average residual value of 3 dB or more in FIG. 12 is classified as an S1 group. In this case, LN10, LN11, LN18, and LN19 belong to the S1 group. Similarly, the group having the residual average value of -3 dB or less in FIG. 12 is also grouped as the S2 group. In this case, in this case, LN9, LN16, and LN20 to LN23 belong to the S2 group.
- the spatial data creation device 100 selects the estimation data measured at the position closest to the position of the classified evaluation data.
- the classification of the estimation data is completed (step S002).
- FIG. 14 shows an example of selecting estimation data for LN10, LN11, LN18, and LN19 of the S1 group.
- the reason for selecting the nearest estimation data is that the closer the distance, the more similar the environment is assumed.
- the k-nearest neighbor method can be mentioned.
- the estimation data that is not the nearest neighbor but has a similar environment or the like may be selected.
- AP6 which is closer to LN10 in FIG. 12
- AP4 which has a similar environment in that LN17 and LN18 are outside the area surrounded by the shield B in which they are arranged, is selected.
- the estimation data may be selected using such an algorithm.
- the spatial data creation device 100 independently estimates the spatial data for each classification using the classified estimation data.
- the spatial data creation device 100 stores the created subspace data in the subspace data primary storage unit 104 (step S003).
- the spatial data creation device 100 evaluates the created subspace data (step S004).
- the spatial data creation device 100 calculates the residuals of the evaluation data and the spatial data created in step S000, and the residuals of the evaluation data and the subspace data created in step S003, respectively. Then, when it is determined that the residual of the evaluation data and the subspace data created in step S003 is smaller, the spatial data creation device 100 determines that the subspace data is adopted (“subspace data in step S004”. Hiring ").
- the spatial data creation device 100 determines that the subspace data is not adopted (“not adopted” in step S004”. ).
- the spatial data creation device 100 stores the subspace data in the spatial data storage unit 103 (step S005).
- the spatial data creation device 100 outputs the spatial data stored in the spatial data storage unit 103 (step S006). At this time, when the subspace data is stored in the spatial data storage unit 103, the spatial data creation device 100 replaces the portion of the spatial data that overlaps with the subspace data with the content of the subspace data and outputs the data. .. As a result, of the spatial data, the portion determined in step S002 to have a large absolute value of the residual is replaced with the subspace data, and the accuracy is improved.
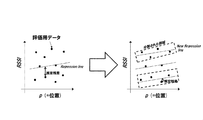
- the black dots in the figure on the left side of FIG. 15 represent the evaluation data.
- the Regression line in the figure shows the regression line obtained by an appropriate method from the estimation data.
- the positions where the deviation (estimated residual) from the evaluation data occurs are divided (classified) and divided (classified) groups.
- Subspace data is created by selecting estimation data for each.
- the New Regression line in the figure on the right side of FIG. 15 represents a regression line obtained as a result of creating this subspace data. For example, when the residual average value of the above-mentioned S1 group is 3 dB or more and the residual average value with the subspace data is less than 3 dB, the subspace data is adopted. As a result, it is possible to suppress the deviation (estimated residual) from the evaluation data at the position where the deviation (estimated residual) from the evaluation data occurs.
- the deviation (estimated residual) from the evaluation data may be larger in the new regression line than in the initial regression line. ..
- the acquisition position of the estimation data that is, the arrangement of the first sensor is not good, or the inappropriate estimation data is selected accordingly.
- the classification of the evaluation data may be redone, or the selection of the estimation data corresponding to the evaluation data may be redone by changing the selection rule (algorithm) of the estimation data. ..
- the spatial data and the subspace data are represented by regression lines, but the form of the spatial data and the subspace data is not limited to this, and a non-linear regression model may be used.
- a non-linear regression model may be used.
- various prediction models that can estimate RSSI can be adopted as the objective variable.
- the subspace data is selected by using the total value or the average value of the residuals of the subspace data and the evaluation data.
- the subspace data selection rule is as follows. It is not limited to this method. For example, even if a standard (upper limit value) is set for the maximum value of the absolute residual value between the subspace data and the evaluation data and the total value or the average value of the residual value is suppressed, the maximum absolute value of the residual value is set. If the value exceeds the upper limit, a rule that subspatial data is not adopted may be used.
- the evaluation data classification unit 106 has been described as classifying (grouping) the evaluation data based on the residual between the evaluation data and the spatial data.
- the method of classifying (grouping) is not limited to this.
- various methods can be adopted, such as a method of classifying the evaluation data based on the ratio of the evaluation data and the value of the spatial data.
- FIG. 17 is a diagram showing a configuration of a spatial data creation device according to a second embodiment of the present invention.
- the difference from the first embodiment shown in FIG. 5 is that the reclassification instruction unit 120 is added so that the subspace data is recursively reclassified. Since other configurations are common to the first embodiment, the differences will be mainly described below.
- the reclassification instruction unit 120 operates when the subspace data evaluation unit 108a determines that the subspace data is to be adopted, and further classifies (groups) the evaluation data to the evaluation data classification unit 106a. Instruct (hereinafter referred to as "reclassification instruction").
- FIG. 18 is an image diagram of the reclassification process of the evaluation data. For example, when the evaluation data as shown in the left figure of FIG. 18 and the regression line 1st Evaluation line are obtained, the evaluation data classification unit 106a reclassifies the evaluation data based on the residuals of both. (See the right figure in FIG. 18).
- the subspace data creation unit 107 selects the nearest estimation data from the measurement points of the evaluation data for each of the reclassified groups, and recreates the subspace data using the set of estimation data. To do.
- the subspace data created by the subspace data creation unit 107 is temporarily stored in the subspace data primary storage unit 104.
- the subspace data evaluation unit 108a compares the evaluation data after reclassification with the recreated subspace data, and calculates the residual (residual of the subspace data). Then, the subspace data evaluation unit 108a compares the residual of the evaluation data with respect to the previously calculated subspace data with the residual of the subspace data recreated by the subspace data creation unit 107 and the evaluation data. As a result of the comparison, when the residual of the subspace data is smaller, the subspace data evaluation unit 108a determines that the subspace data is adopted, and instructs the reclassification instruction unit 120 to reclassify. .. Further, the subspace data evaluation unit 108a stores the subspace data after reclassification in the spatial data storage unit 103. The comparison of the residuals here is to compare the residual with the 1st Regression line in the left figure of FIG. 18 and the residual with the 2nd Regression line in the right figure of FIG.
- the subspace data evaluation unit 108a determines that no further reclassification is performed.
- the subspace data evaluation unit 108a does not store the subspace data after reclassification in the spatial data storage unit 103.
- the spatial data output unit 109a outputs the spatial data and the subspace data stored in the spatial data storage unit 103 after the determination of the subspace data evaluation unit 108a.
- FIG. 19 is a flow chart showing the operation of the spatial data creation device 100 according to the second embodiment of the present invention. Since the processing of steps S000 to S002, S004, and S006 in FIG. 19 is the same as that of the first embodiment, the contents of steps S003, S005, and S007 will be described below.
- the spatial data creation device 100 stores the subspace data in the spatial data storage unit 103 (step S005), and further reclassifies the evaluation data (step S007).
- the regions are reclassified into four regions as shown by the broken line in the right figure of FIG.
- the subspace data creation unit 107 selects the nearest estimation data from the measurement points of the evaluation data for each of the four groups after the reclassification, and uses the set of estimation data to generate the subspace data. Recreate (step S003).
- the four regression lines in FIG. 18 correspond to these four subspace data.
- the four subspace data created by the subspace data creation unit 107 are temporarily stored in the subspace data primary storage unit 104.
- the subspace data evaluation unit 108a compares the evaluation data after reclassification with the recreated subspace data, and calculates the residual (residual of the subspace data). Then, the subspace data evaluation unit 108a compares the residual of the evaluation data with respect to the previously calculated subspace data with the residual of the subspace data recreated by the subspace data creation unit 107 and the evaluation data (step). S004). As a result of the comparison, when the total value or the average value of the residuals of the subspace data is smaller, the subspace data evaluation unit 108a determines that the subspace data is adopted, and the reclassification instruction unit 120 , Instruct reclassification. Further, the subspace data evaluation unit 108a stores the subspace data after reclassification in the spatial data storage unit 103.
- the subspace data evaluation unit 108a determines that no further reclassification is performed (“No” in step S004. Hiring "). The subspace data evaluation unit 108a does not store the subspace data after reclassification in the spatial data storage unit 103.
- the subspace data evaluation unit 108a recursively classifies the evaluation data until it is determined that further reclassification is unnecessary.
- the spatial data creation device 100 outputs the spatial data stored in the spatial data storage unit 103 (step S006).
- the spatial data creation device 100 of the spatial data and the subspatial data of the most finely classified subspatial data Replace with the contents and output.
- the portion determined in steps S002 and S007 that the absolute value of the residual is large is replaced with the finer subspace data, and the accuracy is improved.
- the estimation accuracy can be improved in comparison with the first embodiment.
- the reason is that the evaluation data is recursively divided so that it can be estimated accurately even when there are many models in the environment.
- the selection rule for subspace data is not limited to the above method.
- a reference (upper limit value) can be set for the maximum value of the absolute residual value between the subspace data and the evaluation data. Then, even if the total value and the average value of the residuals are suppressed, if the maximum value of the absolute residual value exceeds the upper limit value, the subspace data is not adopted (no subdivision is performed). You may.
- FIG. 20 is a diagram showing a configuration of a spatial data creation device according to a third embodiment of the present invention.
- the difference from the first embodiment shown in FIG. 5 is that the map presenting unit 130 is added. Since other configurations are common to the first embodiment, the differences will be mainly described below.
- the map presentation unit 130 converts the spatial data output by the spatial data output unit 109 into a radio wave map format and outputs it to a predetermined display device or the like (not shown).
- FIG. 21 is a flow chart showing the operation of the spatial data creation device 100b according to the third embodiment of the present invention. Since the processes of steps S000 to S005 of FIG. 19 are the same as those of the first embodiment, the contents of step S206 will be described below.
- step S206 the map presentation unit 130 of the spatial data creation device 100b creates and outputs a radio wave map using the data received from the spatial data output unit 109.
- FIG. 22 shows an example of the output form of the radio wave map.
- the strength of RSSI is represented by contour lines.
- “H” indicates a peak at a location where RSSI is large
- “L” indicates a peak at a location where RSSI is small.
- the contour lines are not created by a single model, but are appropriately classified and corrected by the subspace data.
- the present embodiment it is possible to present spatial data with improved accuracy in a form that is easy for the user to visually grasp.
- a configuration in which the map presenting unit 130 is added to the configuration of the second embodiment to present the radio wave map can also be adopted.
- FIG. 23 is a diagram showing a configuration of a spatial data creation device according to a fourth embodiment of the present invention.
- the difference from the first embodiment shown in FIG. 5 is that the position estimation unit 140 is added. Since other configurations are common to the first embodiment, the differences will be mainly described below.
- the position estimation unit 140 estimates the position of the moving body using the spatial data output by the spatial data output unit 109, and outputs the position estimation result to a predetermined display device or the like (not shown).
- FIG. 24 is a flow chart showing the operation of the spatial data creation device 100c according to the fourth embodiment of the present invention. Since the processes from steps S000 to S005 in FIG. 24 are the same as those in the first embodiment, the contents of step S306 will be described below.
- step S306 the position estimation unit 140 of the spatial data creation device 100c estimates and outputs the position corresponding to the received power vector of the moving body using the data received from the spatial data output unit 109.
- FIG. 25 shows an example of the output form of the position estimation information of the moving body. In the example of FIG. 25, a map of the target area in which the estimated position of the moving body is indicated by the symbol UV is shown. And this estimated position is not created by a single model as described in the first embodiment, but is a position specified by spatial data that is properly classified and modified by subspace data. It has become.
- the present embodiment it is possible to perform position estimation with high accuracy.
- a configuration in which the position estimation unit 140 is added to the configuration of the second embodiment to estimate the position of the mobile station can also be adopted.
- FIG. 26 is a diagram showing a configuration of a spatial data creation device according to a fifth embodiment of the present invention.
- the spatial data creation device 100d has an evaluation feature amount storage unit 301 and a position information estimation unit 302. Since other configurations are common to the first embodiment, the differences will be mainly described below.
- the evaluation feature amount storage unit 301 stores the feature amount information used as the evaluation data.
- the evaluation feature amount storage unit 301 stores a received power vector which is a set of RSSIs of radio waves received from each AP.
- the position information estimation unit 302 uses the spatial data and the feature amount information held in the evaluation feature amount storage unit 301 at the timing when the spatial data held in the spatial data storage unit 103 is updated. Estimate the position information that would have acquired the feature amount information. A FingerPrint method or the like can be used for estimating the position information. Then, the position information estimation unit 302 creates evaluation data by associating the estimated position information with the information of the related feature amount, and registers it in the evaluation data storage unit 102.
- FIG. 27 is a flow chart showing the operation of the spatial data creation device 100d according to the fifth embodiment of the present invention.
- steps S501 and S502 are added between steps S001 and S002.
- the contents of steps S501 and 502 will be described below.
- the evaluation feature quantity is obtained by using the spatial data and the evaluation feature quantity. Estimate the possible position (step S501).
- the spatial data creation device 100d generates evaluation data in association with the evaluation feature amount and the estimated position, and stores the evaluation data in the evaluation data storage unit 102 (step S502).
- the spatial data creation device 100d can calculate the residual between the created spatial data and the evaluation data of the evaluation data storage unit 102 in the next step S002.
- the present embodiment it is possible to improve the spatial data estimation accuracy even when the evaluation data cannot be prepared.
- the reason is that the evaluation feature amount is used to estimate the position where the feature amount is likely to be acquired, and the evaluation data associated with the position information can be generated.
- the evaluation feature amount storage unit 301 and the position information estimation unit 302 are added to the configuration of the first embodiment, but the evaluation feature is added to the configuration of the second embodiment. It is also possible to add the quantity storage unit 301 and the position information estimation unit 302. In this case, as shown in FIG. 28, in addition to creating the evaluation data in steps S501 and S502, a position update step of the evaluation data may be added between steps S005 and S007. By making this preparation, it becomes possible to update the position information of the evaluation data and improve the accuracy in the process of recursive classification of the evaluation data.
- the estimation data and the evaluation data have been described as being feature quantities (received signal strength) associated with the position information, but the scope of application of the present invention is to estimate the received signal strength. And it is not limited to position estimation using this.
- the amount of sunshine and wind power information as the feature amount associated with the position information
- the accuracy of prediction of the spatial data (sunshine amount and wind speed) of the entire target area can be improved by classifying the evaluation data based on the deviation from the spatial data.
- the exploration value of the mineral resource as the feature quantity associated with the position information, it is possible to create an estimated resource quantity map with a limited number of drilling points.
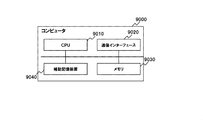
- the procedure shown in the first to fifth embodiments described above can be realized by a program that realizes the function of the computer (9000 in FIG. 29) that functions as the spatial data creation device.
- a computer is exemplified in a configuration including a CPU (Central Processing Unit) 9010, a communication interface 9020, a memory 9030, and an auxiliary storage device 9040 in FIG. 29. That is, the CPU 9010 in FIG. 29 may execute the area division program or the spatial data creation program, and update each calculation parameter held in the auxiliary storage device 9040 or the like.
- a CPU Central Processing Unit
- each part (processing means, function) of the spatial data creating apparatus shown in the first to fifth embodiments described above uses the hardware of the processor mounted on the spatial data creating apparatus, and each of the above-mentioned parts. It can be realized by a computer program that executes processing.
- the first sensor and the second sensor of the spatial data creation device described above are receiving devices that receive radio waves transmitted from a predetermined transmitting station.
- the data in which the power reception intensity measured by the receiving device and the positions of the first and second sensors are associated with each other can be used as the estimation data and the evaluation data.
- the data classification unit of the spatial data creation device described above classifies the evaluation data based on the difference or ratio between the evaluation data and the value of the spatial data corresponding to the acquisition position of the evaluation data. Can be taken.
- the spatial data creation device described above may further include an output unit that outputs the spatial data in a predetermined mode.
- the above-mentioned spatial data creation device further It is possible to adopt a configuration including a map presentation unit that visualizes and presents spatial data including the subspace data adopted by the subspace data evaluation unit.
- a position estimation unit for estimating the position of the moving body by collating the spatial data with the sensor value acquired by the moving body is provided.
- the position estimation unit may use spatial data including the subspace data adopted by the subspace data evaluation unit to estimate the position of the moving body and provide it as position information of the moving body. it can.
- [7th form] The above-mentioned spatial data creation device Further, by collating the spatial data with the feature amount prepared in advance, it is possible to adopt a configuration including a position information estimation unit that estimates the acquisition position of the feature amount and creates the evaluation data.
- [8th form] (Refer to the method of creating spatial data from the second viewpoint above)
- [9th form] (Refer to the program from the third viewpoint above)
- the eighth to ninth forms can be developed into the second to seventh forms in the same manner as the first form.
- the present invention can be applied to applications such as consulting and design using spatial data obtained by spatial data estimation, and indoor / outdoor location information services.
Landscapes
- Engineering & Computer Science (AREA)
- Computer Networks & Wireless Communication (AREA)
- Signal Processing (AREA)
- Physics & Mathematics (AREA)
- Electromagnetism (AREA)
- Quality & Reliability (AREA)
- Mobile Radio Communication Systems (AREA)
- Position Fixing By Use Of Radio Waves (AREA)
Abstract
Priority Applications (2)
| Application Number | Priority Date | Filing Date | Title |
|---|---|---|---|
| US17/601,483 US12244361B2 (en) | 2019-04-11 | 2020-04-07 | Spatial data creating apparatus, spatial data creating method, and program |
| JP2021513640A JP7115633B2 (ja) | 2019-04-11 | 2020-04-07 | 空間データ作成装置、空間データ作成方法及びプログラム |
Applications Claiming Priority (2)
| Application Number | Priority Date | Filing Date | Title |
|---|---|---|---|
| JP2019075357 | 2019-04-11 | ||
| JP2019-075357 | 2019-04-11 |
Publications (1)
| Publication Number | Publication Date |
|---|---|
| WO2020209253A1 true WO2020209253A1 (fr) | 2020-10-15 |
Family
ID=72751292
Family Applications (1)
| Application Number | Title | Priority Date | Filing Date |
|---|---|---|---|
| PCT/JP2020/015675 Ceased WO2020209253A1 (fr) | 2019-04-11 | 2020-04-07 | Dispositif de création de données spatiales, procédé de création de données spatiales et programme |
Country Status (3)
| Country | Link |
|---|---|
| US (1) | US12244361B2 (fr) |
| JP (1) | JP7115633B2 (fr) |
| WO (1) | WO2020209253A1 (fr) |
Families Citing this family (1)
| Publication number | Priority date | Publication date | Assignee | Title |
|---|---|---|---|---|
| US20240273120A1 (en) * | 2024-03-14 | 2024-08-15 | Intel Corporation | Automatic data source marking using autonomous systems |
Citations (3)
| Publication number | Priority date | Publication date | Assignee | Title |
|---|---|---|---|---|
| JPH11344517A (ja) * | 1998-06-02 | 1999-12-14 | Nec Corp | 電波環境分析装置 |
| JP2015010927A (ja) * | 2013-06-28 | 2015-01-19 | Kddi株式会社 | 観測値処理装置、観測値処理方法及び観測値処理プログラム |
| WO2017130877A1 (fr) * | 2016-01-25 | 2017-08-03 | 日本電気株式会社 | Dispositif d'estimation d'environnement électromagnétique, système d'estimation d'environnement électromagnétique, procédé d'estimation d'environnement électromagnétique, et support d'enregistrement |
Family Cites Families (11)
| Publication number | Priority date | Publication date | Assignee | Title |
|---|---|---|---|---|
| JP3875875B2 (ja) | 2001-11-02 | 2007-01-31 | 新日本製鐵株式会社 | 製造プロセスにおける操業分析装置、方法、コンピュータプログラム、及びコンピュータ読み取り可能な記憶媒体 |
| WO2010067560A1 (fr) | 2008-12-09 | 2010-06-17 | 日本電気株式会社 | Système, procédé et programme de correction de données d’environnement radio |
| JP2010219918A (ja) | 2009-03-17 | 2010-09-30 | Nec Corp | 無線基地局、無線基地局監視システム、無線基地局の送信電力設定方法、プログラム及び記録媒体 |
| US9037189B2 (en) * | 2011-08-05 | 2015-05-19 | Panasonic Intellectual Property Corporation Of America | Positioning server device and positioning control method |
| US9137637B2 (en) * | 2013-03-13 | 2015-09-15 | King Abdullah University Of Science And Technology | Printed tag real-time tracking |
| US20140274119A1 (en) * | 2013-03-15 | 2014-09-18 | Qualcomm Incorporated | Method and apparatus for indoor positioning based on wireless landmarks |
| US9476730B2 (en) * | 2014-03-18 | 2016-10-25 | Sri International | Real-time system for multi-modal 3D geospatial mapping, object recognition, scene annotation and analytics |
| JP6634694B2 (ja) | 2014-06-06 | 2020-01-22 | ソニー株式会社 | 情報処理装置、情報処理方法およびプログラム |
| US10754034B1 (en) * | 2015-09-30 | 2020-08-25 | Near Earth Autonomy, Inc. | Apparatus for redirecting field of view of lidar scanner, and lidar scanner including same |
| US11051386B2 (en) * | 2018-09-06 | 2021-06-29 | Lsi Industries, Inc. | Distributed intelligent network-based lighting system |
| US10767997B1 (en) * | 2019-02-25 | 2020-09-08 | Qualcomm Incorporated | Systems and methods for providing immersive extended reality experiences on moving platforms |
-
2020
- 2020-04-07 WO PCT/JP2020/015675 patent/WO2020209253A1/fr not_active Ceased
- 2020-04-07 JP JP2021513640A patent/JP7115633B2/ja active Active
- 2020-04-07 US US17/601,483 patent/US12244361B2/en active Active
Patent Citations (3)
| Publication number | Priority date | Publication date | Assignee | Title |
|---|---|---|---|---|
| JPH11344517A (ja) * | 1998-06-02 | 1999-12-14 | Nec Corp | 電波環境分析装置 |
| JP2015010927A (ja) * | 2013-06-28 | 2015-01-19 | Kddi株式会社 | 観測値処理装置、観測値処理方法及び観測値処理プログラム |
| WO2017130877A1 (fr) * | 2016-01-25 | 2017-08-03 | 日本電気株式会社 | Dispositif d'estimation d'environnement électromagnétique, système d'estimation d'environnement électromagnétique, procédé d'estimation d'environnement électromagnétique, et support d'enregistrement |
Also Published As
| Publication number | Publication date |
|---|---|
| JP7115633B2 (ja) | 2022-08-09 |
| JPWO2020209253A1 (fr) | 2020-10-15 |
| US12244361B2 (en) | 2025-03-04 |
| US20220209875A1 (en) | 2022-06-30 |
Similar Documents
| Publication | Publication Date | Title |
|---|---|---|
| US11475607B2 (en) | Radio coverage map generation | |
| CN112243249B (zh) | 5g nsa组网下lte新入网锚点小区参数配置方法和装置 | |
| CN101998411B (zh) | 一种基于扫频及传播模型覆盖预测的频率优化方法 | |
| CN110100148B (zh) | 用于管理天线倾斜的方法和设备 | |
| KR20210026520A (ko) | 측정 데이터 기반의 무선 통신 커버리지 예측 시스템 및 방법 | |
| CN113395704B (zh) | 一种5g基站的选址方法及装置 | |
| CN118740285B (zh) | 一种考虑菲涅尔区特征的路径损耗预测方法 | |
| US8639255B2 (en) | Simulation system, simulation apparatus, and simulation method | |
| CN106211186B (zh) | 一种无线网络规划中判定小区问题的方法 | |
| CN104113849A (zh) | 传播模型的校正方法 | |
| WO2020209253A1 (fr) | Dispositif de création de données spatiales, procédé de création de données spatiales et programme | |
| CN104349326A (zh) | 网络规划方法 | |
| Ito et al. | Radio propagation estimation in a long-range environment using a deep neural network | |
| CN109005552B (zh) | 基于lte mr数据精确评估无线网络的方法 | |
| CN116318462B (zh) | 一种双模态网络修正的精细化路径损耗预测方法 | |
| CN113365302B (zh) | 等信号线/区域生成方法及装置、设备、计算机程序 | |
| CN115133977B (zh) | 基于信息年龄最小化的无人机通信感知一体化系统位置优化方法 | |
| KR102546574B1 (ko) | 기지국의 커버리지 분석 방법 및 장치 | |
| KR102320237B1 (ko) | 이동통신망의 품질 최적화 시뮬레이션 방법 | |
| Zaboub et al. | 5G Mobile Network Signal Strength Interpolation Using Machine Learning GAN Algorithm | |
| CN105611549A (zh) | 一种基于信号强度的小区覆盖半径计算方法 | |
| Liu et al. | A Fine-Grained 3D Radio Map Construction Paradigm With Ultra-Low Sampling Rates by Large Generative Models | |
| CN115334569B (zh) | 热力图生成方法、装置、设备及存储介质 | |
| CN119675797B (zh) | 一种通信设备在强电场环境下的信号传输质量评价方法 | |
| Bahtite | Realistic Signal Strength Simulation for O-RAN Testing Environments |
Legal Events
| Date | Code | Title | Description |
|---|---|---|---|
| 121 | Ep: the epo has been informed by wipo that ep was designated in this application |
Ref document number: 20788379 Country of ref document: EP Kind code of ref document: A1 |
|
| ENP | Entry into the national phase |
Ref document number: 2021513640 Country of ref document: JP Kind code of ref document: A |
|
| NENP | Non-entry into the national phase |
Ref country code: DE |
|
| 122 | Ep: pct application non-entry in european phase |
Ref document number: 20788379 Country of ref document: EP Kind code of ref document: A1 |
|
| WWG | Wipo information: grant in national office |
Ref document number: 17601483 Country of ref document: US |