WO2023132188A1 - 内視鏡システム及びその作動方法 - Google Patents
内視鏡システム及びその作動方法 Download PDFInfo
- Publication number
- WO2023132188A1 WO2023132188A1 PCT/JP2022/045537 JP2022045537W WO2023132188A1 WO 2023132188 A1 WO2023132188 A1 WO 2023132188A1 JP 2022045537 W JP2022045537 W JP 2022045537W WO 2023132188 A1 WO2023132188 A1 WO 2023132188A1
- Authority
- WO
- WIPO (PCT)
- Prior art keywords
- image
- image signal
- light
- correction
- signal
- Prior art date
- Legal status (The legal status is an assumption and is not a legal conclusion. Google has not performed a legal analysis and makes no representation as to the accuracy of the status listed.)
- Ceased
Links
Images



















Classifications
-
- A—HUMAN NECESSITIES
- A61—MEDICAL OR VETERINARY SCIENCE; HYGIENE
- A61B—DIAGNOSIS; SURGERY; IDENTIFICATION
- A61B1/00—Instruments for performing medical examinations of the interior of cavities or tubes of the body by visual or photographical inspection, e.g. endoscopes; Illuminating arrangements therefor
- A61B1/04—Instruments for performing medical examinations of the interior of cavities or tubes of the body by visual or photographical inspection, e.g. endoscopes; Illuminating arrangements therefor combined with photographic or television appliances
- A61B1/045—Control thereof
-
- A—HUMAN NECESSITIES
- A61—MEDICAL OR VETERINARY SCIENCE; HYGIENE
- A61B—DIAGNOSIS; SURGERY; IDENTIFICATION
- A61B1/00—Instruments for performing medical examinations of the interior of cavities or tubes of the body by visual or photographical inspection, e.g. endoscopes; Illuminating arrangements therefor
-
- A—HUMAN NECESSITIES
- A61—MEDICAL OR VETERINARY SCIENCE; HYGIENE
- A61B—DIAGNOSIS; SURGERY; IDENTIFICATION
- A61B1/00—Instruments for performing medical examinations of the interior of cavities or tubes of the body by visual or photographical inspection, e.g. endoscopes; Illuminating arrangements therefor
- A61B1/00002—Operational features of endoscopes
- A61B1/00004—Operational features of endoscopes characterised by electronic signal processing
- A61B1/00009—Operational features of endoscopes characterised by electronic signal processing of image signals during a use of endoscope
- A61B1/000094—Operational features of endoscopes characterised by electronic signal processing of image signals during a use of endoscope extracting biological structures
-
- A—HUMAN NECESSITIES
- A61—MEDICAL OR VETERINARY SCIENCE; HYGIENE
- A61B—DIAGNOSIS; SURGERY; IDENTIFICATION
- A61B1/00—Instruments for performing medical examinations of the interior of cavities or tubes of the body by visual or photographical inspection, e.g. endoscopes; Illuminating arrangements therefor
- A61B1/04—Instruments for performing medical examinations of the interior of cavities or tubes of the body by visual or photographical inspection, e.g. endoscopes; Illuminating arrangements therefor combined with photographic or television appliances
- A61B1/05—Instruments for performing medical examinations of the interior of cavities or tubes of the body by visual or photographical inspection, e.g. endoscopes; Illuminating arrangements therefor combined with photographic or television appliances characterised by the image sensor, e.g. camera, being in the distal end portion
-
- A—HUMAN NECESSITIES
- A61—MEDICAL OR VETERINARY SCIENCE; HYGIENE
- A61B—DIAGNOSIS; SURGERY; IDENTIFICATION
- A61B1/00—Instruments for performing medical examinations of the interior of cavities or tubes of the body by visual or photographical inspection, e.g. endoscopes; Illuminating arrangements therefor
- A61B1/06—Instruments for performing medical examinations of the interior of cavities or tubes of the body by visual or photographical inspection, e.g. endoscopes; Illuminating arrangements therefor with illuminating arrangements
-
- A—HUMAN NECESSITIES
- A61—MEDICAL OR VETERINARY SCIENCE; HYGIENE
- A61B—DIAGNOSIS; SURGERY; IDENTIFICATION
- A61B1/00—Instruments for performing medical examinations of the interior of cavities or tubes of the body by visual or photographical inspection, e.g. endoscopes; Illuminating arrangements therefor
- A61B1/06—Instruments for performing medical examinations of the interior of cavities or tubes of the body by visual or photographical inspection, e.g. endoscopes; Illuminating arrangements therefor with illuminating arrangements
- A61B1/0638—Instruments for performing medical examinations of the interior of cavities or tubes of the body by visual or photographical inspection, e.g. endoscopes; Illuminating arrangements therefor with illuminating arrangements providing two or more wavelengths
-
- A—HUMAN NECESSITIES
- A61—MEDICAL OR VETERINARY SCIENCE; HYGIENE
- A61B—DIAGNOSIS; SURGERY; IDENTIFICATION
- A61B1/00—Instruments for performing medical examinations of the interior of cavities or tubes of the body by visual or photographical inspection, e.g. endoscopes; Illuminating arrangements therefor
- A61B1/06—Instruments for performing medical examinations of the interior of cavities or tubes of the body by visual or photographical inspection, e.g. endoscopes; Illuminating arrangements therefor with illuminating arrangements
- A61B1/0655—Control therefor
-
- A—HUMAN NECESSITIES
- A61—MEDICAL OR VETERINARY SCIENCE; HYGIENE
- A61B—DIAGNOSIS; SURGERY; IDENTIFICATION
- A61B1/00—Instruments for performing medical examinations of the interior of cavities or tubes of the body by visual or photographical inspection, e.g. endoscopes; Illuminating arrangements therefor
- A61B1/06—Instruments for performing medical examinations of the interior of cavities or tubes of the body by visual or photographical inspection, e.g. endoscopes; Illuminating arrangements therefor with illuminating arrangements
- A61B1/0661—Endoscope light sources
-
- A—HUMAN NECESSITIES
- A61—MEDICAL OR VETERINARY SCIENCE; HYGIENE
- A61B—DIAGNOSIS; SURGERY; IDENTIFICATION
- A61B5/00—Measuring for diagnostic purposes; Identification of persons
- A61B5/145—Measuring characteristics of blood in vivo, e.g. gas concentration or pH-value ; Measuring characteristics of body fluids or tissues, e.g. interstitial fluid or cerebral tissue
- A61B5/1455—Measuring characteristics of blood in vivo, e.g. gas concentration or pH-value ; Measuring characteristics of body fluids or tissues, e.g. interstitial fluid or cerebral tissue using optical sensors, e.g. spectral photometrical oximeters
- A61B5/14551—Measuring characteristics of blood in vivo, e.g. gas concentration or pH-value ; Measuring characteristics of body fluids or tissues, e.g. interstitial fluid or cerebral tissue using optical sensors, e.g. spectral photometrical oximeters for measuring blood gases
- A61B5/14552—Details of sensors specially adapted therefor
-
- A—HUMAN NECESSITIES
- A61—MEDICAL OR VETERINARY SCIENCE; HYGIENE
- A61B—DIAGNOSIS; SURGERY; IDENTIFICATION
- A61B5/00—Measuring for diagnostic purposes; Identification of persons
- A61B5/145—Measuring characteristics of blood in vivo, e.g. gas concentration or pH-value ; Measuring characteristics of body fluids or tissues, e.g. interstitial fluid or cerebral tissue
- A61B5/1455—Measuring characteristics of blood in vivo, e.g. gas concentration or pH-value ; Measuring characteristics of body fluids or tissues, e.g. interstitial fluid or cerebral tissue using optical sensors, e.g. spectral photometrical oximeters
- A61B5/1459—Measuring characteristics of blood in vivo, e.g. gas concentration or pH-value ; Measuring characteristics of body fluids or tissues, e.g. interstitial fluid or cerebral tissue using optical sensors, e.g. spectral photometrical oximeters invasive, e.g. introduced into the body by a catheter
Definitions
- the present invention relates to an endoscope system that performs exposure control when obtaining multiple types of image signals, and an operating method thereof.
- oxygen saturation imaging is known as one of the technologies that makes it easier to detect lesions.
- the observation target is irradiated with narrow-band light, and the oxygen saturation is calculated from the endoscopic image using the difference in the absorption coefficients of oxygenated hemoglobin and deoxyhemoglobin in the tissue of the observation target.
- Detect lesions such as malignant tumors with relatively low grade.
- Specific pigments such as yellow pigments different from oxygenated hemoglobin and reduced hemoglobin are present in tissues, and there is a problem that the calculation accuracy of oxygen saturation decreases due to the influence of light absorption of these specific pigments.
- corrective illumination light is irradiated to calculate the effect of the specific dye, and the oxygen saturation calculation algorithm is corrected based on the signal obtained by the corrective imaging ( See Patent Document 1).
- the optimum brightness of the image signal differs between when calculating the oxygen saturation and when performing correction calculation for calculating the oxygen saturation.
- the signal value including the brightness of the image signal is appropriate. Therefore, using a certain type of image signal to adjust the brightness of another type of image signal may cause problems such as being too dark or too bright depending on the type of image signal acquired. . Therefore, when obtaining a plurality of types of image signals, there is a demand for a technique capable of obtaining a new image signal having a highly reliable signal value that is more suitable for the purpose of obtaining each image signal.
- the present invention provides an endoscope system capable of obtaining a highly reliable image signal for each type of acquired image signal when a plurality of types of image signals are obtained by emitting a plurality of types of illumination light. and a method of operating the same.
- the endoscope system of the present invention includes a light source device, an imaging optical system, and a processor, illuminates an observation target, and captures an image of reflected light from the observation target.
- the light source device emits light from at least one or more light sources, and emits observation illumination light and correction illumination light having a spectrum different from that of the observation illumination light toward the observation target.
- the imaging optical system images the reflected light.
- the processor acquires a plurality of different types of image signals in a first exposure period during which the observation illumination light is emitted and a second exposure period during which the correction illumination light is emitted.
- Image signal brightness is calculated from a part of the image signal, a control amount that varies according to the image signal brightness is output, a plurality of types of exposure control signals with different control amounts are generated, and a Controls the light source and imaging optical system.
- the control amount is preferably output based on the difference between the image signal brightness calculated from the image signal and the preset target brightness.
- the processor acquires an image signal for observation as an image signal during a first exposure period, acquires an image signal for correction as an image signal during a second exposure period, and calculates image signal brightness using the image signal for observation. and the first target brightness, which is the target brightness.
- the first exposure control signal is generated as a signal
- the second exposure control signal is generated as an exposure control signal based on the second control amount.
- the second controlled variable is preferably larger than the first controlled variable.
- the processor preferably outputs the control amount using the specific color signal among the image signals.
- the specific color signal is preferably the B signal.
- the processor preferably generates an analysis image using the image signal, extracts a specific region from the analysis image, and outputs the control amount using the image signal in the specific region.
- the specific area is preferably extracted according to a specific shape.
- the processor extracts a first region as a specific region from the first analysis image, which is an analysis image generated using the observation image signal, and extracts the first region as the image signal brightness calculated using the first region.
- a first area control amount is output as a control amount based on the difference between the brightness and the first target brightness, and a second analysis image, which is an analysis image generated using the correction image signal, is converted into a second analysis image as a specific area.
- the first area exposure control signal is generated as an exposure control signal based on the one area control amount
- the second area exposure control signal is generated as an exposure control signal based on the second area control amount
- the processor switches between an observation mode for acquiring an observation image signal and a correction mode for acquiring an observation image signal and a correction image signal, generates a first exposure control signal in the observation mode, and performs a first exposure in the correction mode.
- a control signal and a second exposure control signal are generated.
- the first exposure period includes a first illumination period during which white equivalent light contained in the observation illumination light is emitted, and a second illumination period during which the calculation illumination light contained in the observation illumination light is emitted.
- the two exposure periods include a third illumination period for obtaining correction illumination light, and the processor automatically switches between the first illumination period, the second illumination period, and the third illumination period, and displays the image in the first illumination period.
- a white light equivalent image signal is acquired as a signal, a calculation image signal is acquired as an image signal during the second illumination period, a correction image signal is acquired during the third illumination period, and based on the white light equivalent image signal
- a 1A exposure control signal is generated as an exposure control signal
- a 1B exposure control signal is generated as an exposure control signal based on the calculation image signal
- a second exposure control signal is generated based on the correction image signal.
- light source control includes light amount control
- imaging optical system control includes aperture value control, exposure time length control, and gain control.
- a method of operating an endoscope system is a method of operating an endoscope system for illuminating an observation target and capturing an image of reflected light from the observation target, comprising: a light source device; an imaging optical system; a processor; wherein the light source device emits light from at least one or more light sources to sequentially emit observation illumination light and correction illumination light having a spectrum different from that of the observation illumination light to the observation target; A plurality of types of images different from each other in the step of the optical system capturing the reflected light, and the processor performing the first exposure period during which the illumination light for observation is emitted and the second exposure period during which the illumination light for correction is emitted.
- a step of obtaining a signal a step of calculating image signal brightness from a part of the image signals that are different from each other; a step of outputting a control amount that varies according to the image signal brightness;
- FIG. 1 is a schematic diagram of an endoscope system;
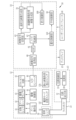
- FIG. 1 is a block diagram showing functions of an endoscope system;
- FIG. It is a block diagram which shows the structure of a light source part.
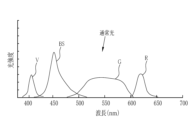
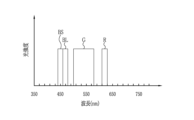
- 4 is a graph showing the spectrum of normal light;
- 4 is a graph showing the spectrum of equivalent white light;
- 7 is a graph showing the spectrum of illumination light for calculation;
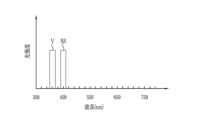
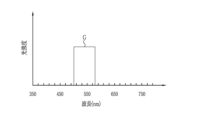
- 4 is a graph showing the spectrum of correction illumination light;
- It is an explanatory view showing the 1st light emission pattern. It is explanatory drawing which shows a 2nd light emission pattern. It is explanatory drawing which shows a 3rd light emission pattern.
- Fig. 3 is a graph showing a blue transmission band, a green transmission band and a red transmission band;
- FIG. 3 is a graph showing a blue transmission band, a green transmission band and a red transmission band;
- FIG. 3 is a graph showing a blue transmission band, a green transmission band and a red transmission band;
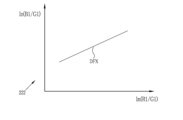
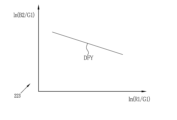
- 4 is a block diagram showing functions of a tissue oxygen saturation image generator; It is a graph showing the positions of oxygen saturation contour lines in a two-dimensional space with ln (R1/G1) on the X axis and ln (B2/G1) on the Y axis. 4 is a graph showing the absorption coefficients of oxygenated hemoglobin and reduced hemoglobin. It is explanatory drawing which shows the calculation method of oxygen saturation. It is a graph which shows the extinction coefficient of a yellow pigment.
- FIG. 4 is a block diagram showing functions of an exposure control unit;
- FIG. 4 is an explanatory diagram showing generation of an exposure control signal;
- FIG. 5 is an explanatory diagram showing a method of calculating image signal brightness and brightness difference and outputting a control amount;
- 4 is a block diagram showing functions of a brightness calculator;
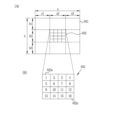
- FIG. 4 is an image diagram showing a region with high analysis accuracy and a region with low analysis accuracy in an endoscopic image.
- FIG. 10 is an image diagram showing a case where the specific area is an area excluding only the edge area of the image area for brightness calculation.
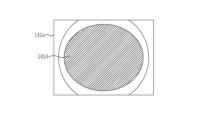
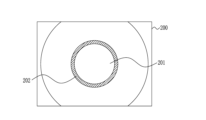
- FIG. 10 is an image diagram showing a case where a specific area is a doughnut-shaped area of the image area for brightness calculation.
- FIG. 10 is an image diagram showing a case where a specific area is set to be an area close to the center of an image area for brightness calculation.
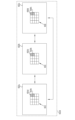
- FIG. 9 is an explanatory diagram showing an example of extracting a first region from a first analysis image and performing exposure control
- FIG. 11 is an explanatory diagram showing an example of performing exposure control by extracting a second region from a second analysis image;
- FIG. 9 is an explanatory diagram showing an example of extracting a first region from a first analysis image and performing exposure control
- FIG. 11 is an explanatory diagram showing an example of performing exposure control by extracting a second region from a second analysis image
- FIG. 4 is an explanatory diagram showing a case where exposure control is performed by generating a 1A exposure control signal, a 1B exposure control signal, and a second exposure control signal;
- FIG. 4 is an explanatory diagram showing specific contents of exposure control;
- 4 is a flowchart showing the flow of exposure control;
- FIG. 10 is an image diagram showing an example of a correction image;
- 3 is a block diagram showing functions of a correction image generation unit, a reliability calculation unit, and a correction determination unit;
- FIG. It is a graph which shows the table for a 1st reliability calculation. It is a graph which shows the table for a 2nd reliability calculation. It is a graph which shows the table for a 3rd reliability calculation.
- FIG. 10 is an image diagram showing an example of a correction image when the saturation of the correction image is changed according to reliability;
- FIG. 10 is an image diagram showing an example of a correction image in the case of enclosing a correction specific area with a frame according to reliability;
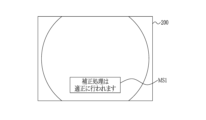
- FIG. 10 is an image diagram showing an example of a correction image indicating that correction processing can be performed appropriately;
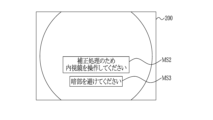
- FIG. 10 is an image diagram showing an example of a correction image when displaying a warning; It is a block diagram which shows the function of the endoscope system of 2nd Embodiment.
- FIG. 4 is a plan view of a rotating filter;
- FIG. 10 is an explanatory diagram showing a difference value ⁇ Z used in calculated value correction processing; It is a schematic diagram of an endoscope system of a 3rd embodiment.
- FIG. 11 is an explanatory diagram showing functions of a camera head according to a third embodiment
- 5 is a graph showing the spectrum of light incident on the imaging sensor 511.
- FIG. 5 is a graph showing the spectrum of light incident on the imaging sensor 512.
- FIG. 5 is a graph showing the spectrum of light incident on the imaging sensor 513.
- FIG. 5 is a graph showing the spectrum of light incident on the imaging sensor 514;
- FIG. 11 is an explanatory diagram showing functions of a camera head according to a fourth embodiment;
- (A) is a graph showing the spectrum of the second mixed light.
- FIG. 11 is an explanatory diagram showing a light emission pattern in an oxygen saturation mode according to the fourth embodiment;
- FIG. 14 is an explanatory diagram showing a light emission pattern in a correction mode according to the fourth embodiment;
- (A) is a graph showing the spectrum of correction illumination light.
- (B) is a graph showing the relationship between the reflectance and transmittance of light incident on the dichroic mirror of the fourth embodiment and the wavelength of light.
- (C) is a graph showing the relationship between the sensitivity of the imaging sensor 611 and the wavelength of light.
- (A) is a graph showing the spectrum of correction illumination light.
- (B) is a graph showing the relationship between the reflectance and transmittance of light incident on the dichroic mirror of the fourth embodiment and the wavelength of light.
- (C) is a graph showing the relationship between the sensitivity of the imaging sensor 612 and the wavelength of light.
- FIG. 11 is a block diagram showing functions of an endoscope system according to a fourth embodiment
- FIG. (A) is an image diagram showing a correction area.
- (B) is an enlarged view of the correction area shown in (A).
- FIG. 12 is a block diagram showing functions of a reliability calculation unit, a correction determination unit, and an extended display control unit according to the fourth embodiment; It is a graph which shows the table for a 1st reliability calculation which made the horizontal axis
- FIG. 11 is an explanatory diagram showing the relationship between a light emission pattern, a generated endoscopic image, and an image set in a correction mode according to the fourth embodiment;
- FIG. 5 is an explanatory diagram showing corresponding correction regions among a white light equivalent image, a second blue light image, and a correction illumination light image;
- FIG. 4 is an explanatory diagram showing a method of calculating a correlation coefficient;
- FIG. 11 is an image diagram showing an example of display when warning display is performed in the fourth embodiment;
- the endoscope system 10 has an endoscope 12, a light source device 13, a processor device 14, a display 15 and a user interface 16.
- the endoscope 12 is optically connected to the light source device 13 and electrically connected to the processor device 14 .
- the light source device 13 supplies illumination light to the endoscope 12 .
- the display 15 displays normal light images, white light equivalent images and/or tissue oxygen saturation images (oxygen saturation images and/or corrected oxygen saturation images).
- the user interface 16 has a keyboard, mouse, microphone, tablet, touch pen, etc., and receives input operations such as function settings.
- the processor device 14 controls the light source device 13 and controls image processing, analysis, and display of image signals transmitted from the endoscope 12 .
- the endoscope 12 has an insertion section 12a, an operation section 12b, a bending section 12c and a distal end section 12d.
- the insertion portion 12a is inserted into the body of the subject.
- the operation portion 12b is provided at the proximal end portion of the insertion portion 12a.
- the curved portion 12c and the distal end portion 12d are provided on the distal end side of the insertion portion 12a.
- the bending portion 12c is bent by operating the angle knob 12e of the operation portion 12b.
- the distal end portion 12d is directed in a desired direction by the bending motion of the bending portion 12c.
- the distal end portion 12d irradiates an observation target with illumination light and receives reflected light from the observation target to capture an image of the observation target.
- a forceps channel (not shown) for inserting a treatment instrument or the like may be provided from the insertion portion 12a to the distal end portion 12d.
- the treatment instrument is inserted into the force
- the operation unit 12b is provided with an angle knob 12e, a mode changeover switch 12f, a still image acquisition instruction switch 12h, and a zoom operation unit 12i.
- the mode changeover switch 12f is used for a mode changeover operation.
- a still image acquisition instruction switch 12h is used to instruct acquisition of a still image of a subject.
- a zoom operation unit 12 i is used for operating the zoom lens 42 .
- the endoscope system 10 has three modes: a normal observation mode (normal mode), a tissue oxygen saturation observation mode (observation mode), and a corrected tissue oxygen saturation calculation mode (correction mode). These three modes are switched via the central control unit 50 by the user operating the mode switch 12f.
- the normal mode is a mode in which the observation target is irradiated with normal light, which is broadband white light, and a normal light image is generated and displayed based on the normal light image signal. Normal light is illumination light suitable for screening observation.
- the observation target is irradiated with light equivalent to white light and illumination light for oxygen saturation calculation (illumination light for calculation), and an image signal equivalent to white light and an image signal for oxygen saturation calculation (image signal for calculation) are acquired.
- the oxygen saturation level of the observation target is calculated based on the calculation image signal, and the calculated oxygen saturation level is superimposed on the base image generated from the white light equivalent image signal to display the oxygen saturation level image.
- the white equivalent light and calculation illumination light used in the observation mode are illumination light for oxygen saturation image observation in which multiple light sources are turned on and multiple colors of light are combined. For this reason, hereinafter, when the white equivalent light and the illumination light for calculation are not described separately, they are collectively referred to as the illumination light for observation. Further, when indicating the image signal corresponding to white light and/or the image signal for calculation, it is referred to as an image signal for observation.
- the observation target is irradiated with illumination light for calculating the corrected oxygen saturation (correction illumination light), and when calculating the oxygen saturation, the image signal for calculating the corrected oxygen saturation (correction)
- a correction oxygen saturation is calculated by performing a calculation that takes into account the influence of a specific pigment contained in the observation target, based on the image signal for observation.
- tissue oxygen saturation used herein refers to either or both of the oxygen saturation calculated in the observation mode and the corrected oxygen saturation calculated in the correction mode.
- a normal light image with natural colors is displayed on the display 15.
- the display 15 displays an image corresponding to white light and an oxygen saturation image obtained by converting the calculated oxygen saturation into a pseudo-color image.
- the display 15 displays a white light equivalent image and a corrected oxygen saturation image obtained by imaging the corrected oxygen saturation.
- the light source device 13 includes a light source section 20 , a light source control section 21 and an optical path coupling section 22 .
- the light source unit 20 is composed of, for example, a semiconductor light source such as a multicolor LED (Light Emitting Diode), a laser light source, a combination of a laser diode and a phosphor, or a xenon lamp or halogen light source.
- the light source unit 20 has a plurality of light sources, and turns on or off each of the plurality of light sources, and when turned on, controls the light emission amount of each light source to emit illumination light for illuminating the observation target.
- the light source unit 20 includes a V-LED (Violet Light Emitting Diode) 20a, a BS-LED (Blue Short-wavelength Light Emitting Diode) 20b, a BL-LED (Blue Long- wavelength Light Emitting Diode) 20c, G-LED (Green Light Emitting Diode) 20d, and R-LED (Red Light Emitting Diode) 20e. Note that the combination of the LEDs of each color is not limited to this.
- a V-LED (Violet Light Emitting Diode) 20a emits violet light V with a central wavelength of 410 ⁇ 10 nm.
- the BS-LED 20b emits a first blue light BS with a center wavelength of 450 nm ⁇ 10 nm.
- the BL-LED 20c emits a second blue light BL with a central wavelength of 470 nm ⁇ 10 nm.
- the G-LED 20d preferably emits green light G in the green band with a center wavelength of about 540 nm.
- R-LED 20e preferably emits red light R in the red band with a center wavelength of about 630 nm. Note that the center wavelength and peak wavelength of each of the LEDs 20b to 20e may be the same or different.
- the light source control unit 21 inputs control signals independently to each of the LEDs 20a to 20e. At least one type of illumination light is emitted by light source control that independently controls the lighting or extinguishing of each LED 20a to 20e, the amount of light emitted when lit, etc., and depending on the set mode, the final light corresponds to normal light or white. Light, illumination light for calculation or illumination light for correction is emitted. Exposure control by the control of the light source control section 21 will be described later.
- the light source control unit 21 changes the light amount of the V-LED 20a, BS-LED 20b, BL-LED 20c, G-LED 20d and R-LED 20e for each frame F according to a specific pattern set in each mode, It is preferable to emit normal light, white-equivalent light, illumination light for calculation, or illumination light for correction in each frame.
- a frame is a unit of period including at least a period from the timing of emission of illumination light to completion of readout of the image signal by the imaging sensor 43 .
- the light source control unit 21 automatically switches the illumination light emitted from the light source unit 20 for each illumination period of one frame.
- a light emission pattern in which normal light is emitted during the normal light illumination period of each frame F is repeated.
- white equivalent light WL for one frame is emitted during a white equivalent light illumination period (first illumination period) P1 for illuminating the observation target with the white equivalent light WL, and the white equivalent light WL is emitted for calculation.
- a light emission pattern (first light emission pattern) for sequentially emitting one frame of calculation illumination light OL is repeated in a calculation illumination period (second illumination period) P2 in which the observation target is illuminated with the illumination light OL.
- a first exposure period EP1, which will be described later, includes a first illumination period P1 and a second illumination period P2. When the first illumination period P1 and the second illumination period P2 are continuous, it is preferable to include the continuous first illumination period P1 and the second illumination period P2 in the first exposure period EP1.
- one frame of white equivalent light WL is emitted during the white equivalent light illumination period P1
- one frame of calculation illumination light OL is emitted during the calculation illumination period P2.
- a light emission pattern (second light emission pattern) in which one frame of calculation illumination light OL is sequentially emitted during a correction illumination period (third illumination period) P3 in which the observation target is illuminated with correction illumination light CL is repeated.
- a second exposure period EP2, which will be described later, includes a third illumination period P3.
- Each illumination period is automatically switched by the light source controller 21 .
- the light emission pattern is not limited to this, and can be set arbitrarily. For example, as shown in FIG.
- white equivalent light WL, calculation illumination light OL, white equivalent light WL, and correction illumination light CL are sequentially emitted in a light emission pattern (third light emission pattern) for each frame. good too.
- a period in which the first illumination period, the second illumination period, the first illumination period, and the first illumination period or the second illumination period continue is defined as the first exposure period.
- the illumination optical system 30 is an optical system for illuminating an observation target with illumination light, and has an illumination lens 31 .
- Illumination light such as normal light, white-equivalent light, illumination light for calculation, and illumination light for correction is propagated by the light guide 23 and irradiated to the observation target through the illumination lens 31 .
- the imaging optical system 40 is an optical system that captures reflected light from an observation target illuminated by illumination light, and includes an objective lens 41 , a zoom lens 42 , and an imaging sensor 43 .
- the imaging optical system 40 also includes a diaphragm 47 (not shown) and a shutter 48, which will be described later.
- the diaphragm 47 and the shutter 48 are not provided as components, and may be electronically controlled electronic diaphragms or electronic shutters.
- the zoom lens 42 is a lens for enlarging an observation target, and is moved between the tele end and the wide end by operating the zoom operation section 12i.
- the imaging sensor 43 is a color imaging sensor that captures an image of an observation target illuminated with illumination light.
- Each pixel of the imaging sensor 43 includes a B pixel (blue pixel) having a B (blue) color filter, a G pixel (green pixel) having a G (green) color filter, and an R pixel having an R (red) color filter ( red pixels) are provided.
- the imaging sensor 43 is preferably a Bayer array color imaging sensor in which the ratio of the number of B pixels, G pixels, and R pixels is, for example, 1:2:1.
- the B color filter BF mainly transmits light in the blue band, specifically light in the wavelength band of 380 to 560 nm (blue transmission band).
- a peak wavelength at which the transmittance is maximum exists in the vicinity of 460 to 470 nm.
- the G color filter GF mainly transmits light in the green band, specifically light in the wavelength band of 450 to 630 nm (green transmission band).
- the R color filter RF mainly transmits light in the red band, specifically light in the range of 580 to 760 nm (red transmission band).
- CMYG four-color image signals are output. Therefore, by converting the CMYG four-color image signals into RGB three-color image signals by complementary color-primary color conversion, Image signals of RGB colors similar to those of the imaging sensor 43 can be obtained.
- the imaging sensor 43 is driven and controlled by the imaging control section 44 .
- the imaging sensor 43 senses reflected light from an observation target irradiated with normal light, and outputs normal light image signals (Bc image signal, Gc image signal, Rc image signal). It also senses reflected light from an observation target irradiated with light corresponding to white light, and outputs image signals corresponding to white light (B1 image signal, G1 image signal, R1 image signal). In addition, it senses reflected light from the observation object due to irradiation with the illumination light for calculation, and outputs image signals for calculation (B2 image signal, G2 image signal, R2 image signal).
- the image pickup control unit 44 outputs a normal light image signal when the image sensor 43 is in the normal mode, a white light equivalent image signal and a calculation image signal when the image sensor 43 is in the observation mode, and a white light equivalent image signal when the image sensor 43 is in the correction mode. Control is performed so that the image signal for calculation and the image signal for correction are respectively output.
- the light source control unit 21 turns on the V-LED 20a, the BS-LED 20b, the G-LED 20d, and the R-LED 20e during the normal light illumination period. Control is performed so that normal light is emitted, and the imaging control unit 44 performs imaging for each frame, and outputs a Bc image signal from the B pixels of the imaging sensor 43, a Gc image signal from the G pixels, and an Rc image signal from the R pixels.
- the imaging sensor 43 is controlled to output.
- a white light equivalent image signal and a calculation image signal are acquired.
- the light source control unit 21 controls the BS-LED 20b, the G-LED 20d, and the R-LED 20e to be turned on during the white equivalent light illumination period P1 to emit the white equivalent light WL.
- the control unit 44 takes an image every frame, and controls the image sensor 43 so that the B pixels of the image sensor 43 output the B1 image signal, the G pixels output the G1 image signal, and the R pixels output the R1 image signal.
- the light source control unit 21 lights the BL-LED 20c, the G-LED 20d, and the R-LED 20e in the calculation illumination period P2 to emit the calculation illumination light OL.
- 44 captures an image every frame, and controls the image sensor 43 so that the B pixels of the image sensor 43 output a B2 image signal, the G pixels output a G2 image signal, and the R pixels output an R2 image signal.
- an image signal corresponding to white light, an image signal for calculation, and an image signal for correction are acquired.
- the same control as in the observation mode is performed.
- the light source control unit 21 controls the G-LED 20d to light up to emit correction illumination light
- the imaging control unit 44 performs imaging for each frame
- the imaging sensor 43 The imaging sensor 43 is controlled to output the B3 image signal from the B pixel, the G3 image signal from the G pixel, and the R3 image signal from the R pixel. Exposure control by control of the imaging control unit 44 will be described later.
- the correction illumination light is not limited to monochromatic light as shown in Table 3, and may be illumination light using multiple colors.
- a CDS/AGC (Correlated Double Sampling/Automatic Gain Control) circuit 45 performs correlated double sampling (CDS) and automatic gain control (AGC) on analog image signals obtained from the imaging sensor 43 .
- the image signal that has passed through the CDS/AGC circuit 45 is converted into a digital image signal by an A/D (Analog/Digital) converter 46 .
- A/D Analog/Digital
- the processor device 14 includes a central control unit 50, an image signal acquisition unit 60, a DSP (Digital Signal Processor) 61, a noise reduction unit 62, an image processing switching unit 63, a normal light image generation unit 70, and a tissue oxygen saturation image generation unit 80. , a display control unit 100, and an exposure control unit 110 (see FIG. 2).
- programs related to each process are incorporated in a program memory (not shown).
- a central control unit 50 configured by a processor executes a program in a program memory to control an image signal acquisition unit 60, a DSP 61, a noise reduction unit 62, an image processing switching unit 63, a normal light image generation unit 70, a tissue oxygen
- the functions of the saturation image generation unit 80, the display control unit 100, and the exposure control unit 110 are realized.
- a white light equivalent image generation unit 81, a base image generation unit 82, a signal ratio calculation unit 83, an oxygen saturation calculation unit 84, and an oxygen saturation image generation unit, which are included in the tissue oxygen saturation image generation unit 80, will be described later.
- corrected oxygen saturation calculator 86 corrected oxygen saturation image generator 87
- exposure control signal generator 120 included in exposure controller 110
- control amount output unit 130 control amount output unit 130
- brightness calculator 140 analysis
- the functions of the area setting unit 141, the area brightness calculation unit 142, and the brightness difference calculation unit 150 are realized.
- the image signal acquisition unit 60 receives image signals (normal light image signal, white light equivalent image signal, calculation image signal, and correction image signal) input from the endoscope 12, and sends the received image signals to the DSP 61.
- the DSP 61 performs various signal processing such as defect correction processing, offset processing, gain correction processing, linear matrix processing, gamma conversion processing, demosaicing processing, and YC conversion processing on the received image signal.
- defect correction processing signals of defective pixels of the imaging sensor 43 are corrected.
- the offset processing the dark current component is removed from the image signal subjected to the defect correction processing, and an accurate zero level is set.
- the gain correction process adjusts the signal level of each image signal by multiplying the image signal of each color after the offset process by a specific gain.
- the image signals of each color after gain correction processing are subjected to linear matrix processing for enhancing color reproducibility.
- gamma conversion processing adjusts the brightness and saturation of each image signal.
- the image signal after linear matrix processing is subjected to demosaic processing (also referred to as isotropic processing or synchronizing processing), and interpolated to generate missing color signals for each pixel.
- demosaic processing causes all pixels to have RGB signals.
- the DSP 61 performs YC conversion processing on each image signal after the demosaicing processing, and outputs the luminance signal Y, the color difference signal Cb, and the color difference signal Cr to the noise reduction unit 62 .
- the noise reduction unit 62 performs noise reduction processing using, for example, the moving average method or the median filter method, on the image signal that has undergone demosaic processing or the like in the DSP 61 .
- the noise-reduced image signal is input to the image processing switching section 63 and the exposure control section 110, which will be described later.
- the image processing switching unit 63 transmits the image signal from the noise reduction unit 62 to the normal light image generation unit 70 in the normal mode, and to the tissue oxygen saturation image generation unit 80 in the observation mode or correction mode.
- the normal light image generation unit 70 further performs 3 ⁇ 3 matrix processing, gradation conversion processing, three-dimensional LUT (Look Up Table ) processing is performed.
- various color enhancement processes are applied to the RGB image data that has undergone the color conversion process.
- Structural enhancement processing such as spatial frequency enhancement is applied to the color-enhanced RGB image data.
- the RGB image data subjected to structure enhancement processing is transmitted to the display control unit 100 as a normal light image.
- the tissue oxygen saturation image generator 80 includes a white light equivalent image generator 81, a base image generator 82, a signal ratio calculator 83, an oxygen saturation calculator 84, and an oxygen saturation image generator. 85 , a corrected oxygen saturation calculator 86 and a corrected oxygen saturation image generator 87 .
- the white light equivalent image generation unit 81 further performs 3 ⁇ 3 matrix processing, gradation conversion processing, three-dimensional LUT processing, etc. on the input B1 image signal, G1 image signal, and R1 image signal for one frame. Apply color conversion processing. Next, various color enhancement processes are applied to the RGB image data that has undergone the color conversion process. Structural enhancement processing such as spatial frequency enhancement is applied to the color-enhanced RGB image data. The RGB image data subjected to structure enhancement processing is transmitted to the display control unit 100 as an image corresponding to white light.
- the white light equivalent image is an image corresponding to the normal light image obtained in the normal mode, but the color of the image differs from that of the normal light image because the spectrum of the illumination light applied to the observation target is different.
- the base image generation unit 82 performs various signal processing on the inputted image signal for one frame, for example, the B1 image signal, the G1 image signal, and the R1 image signal, and generates an oxygen saturation image or a corrected oxygen saturation image. Generate a base image for generation.
- the image signal input to the base image generation unit 82 is not limited to the B1 image signal, G1 image signal, and R1 image signal, and may be an image signal for generating any image desired by the user as the base image.
- the base image is sent to the oxygen saturation image generator 85 in the observation mode, and is sent to the corrected oxygen saturation image generator 87 in the correction mode.
- the oxygen saturation calculation unit 84 calculates the oxygen saturation based on the white light equivalent image signal and the calculation image signal in the observation mode. A method for calculating the oxygen saturation will be described later.
- Information on the calculated oxygen saturation is transmitted to the oxygen saturation image generator 85 .
- the oxygen saturation image generation unit 85 generates an oxygen saturation image in which oxygen saturation information is represented in a base image as pseudo colors.
- the base image is, for example, a white light equivalent image or an image obtained by adjusting the saturation of the white light equivalent image.
- Using a desaturated image corresponding to white light as a base image has the advantage of improving the visibility when the area for displaying the oxygen saturation is small. Note that an endoscopic image based on an image signal obtained using another illumination light may be used as the base image. Alternatively, the normal light image may be used as the base image.
- the oxygen saturation image is transmitted to the display control section 100 .
- the corrected oxygen saturation calculation unit 86 calculates the corrected oxygen saturation based on the white light equivalent image signal, the calculation image signal, and the correction image signal in the correction mode. A method for calculating the corrected oxygen saturation will be described later.
- Information on the calculated corrected oxygen saturation is sent to the corrected oxygen saturation image generator 87 .
- the corrected oxygen saturation image generating unit 87 generates an oxygen saturation image by superimposing the corrected oxygen saturation information on the base image as a pseudo color.
- the corrected oxygen saturation image is transmitted to the display control section 100 .
- the display control unit 100 displays the normal light image from the normal light image generation unit 70 and the white light equivalent image, the oxygen saturation image and the corrected oxygen saturation image from the tissue oxygen saturation image generation unit 80 on the display 15. to a video signal that enables full-color display.
- the converted video signal is input to display 15 .
- the normal light image, the white light equivalent image, the oxygen saturation image and/or the corrected oxygen saturation image are displayed on the display 15 .
- the signal ratio calculator 83 of the tissue oxygen saturation image generator 80 calculates an oxygen saturation calculation calculation value by signal ratio processing based on the B2 image signal, the G1 image signal, and the R1 image signal. Specifically, the signal ratio calculator 83 uses the signal ratio B2/G1 between the B2 image signal and the G1 image signal, the R1 image signal and the G1 image signal as the oxygen saturation calculation calculation values used to calculate the oxygen saturation. to calculate the signal ratio R1/G1.
- the signal ratio B2/G1 and the signal ratio R1/G1 are preferably logarithmized (ln). Color difference signals Cr and Cb calculated from the B2 image signal, the G1 image signal, and the R1 image signal, or the saturation S and hue H may be used as the calculation value for oxygen saturation calculation.
- the oxygen saturation calculation unit 84 refers to the oxygen saturation calculation table 84a and calculates the oxygen saturation using calculated values for oxygen saturation calculation such as the signal ratio B2/G1 and the signal ratio R1/G1.
- the signal ratios B2/G1 and R1/G1 obtained by simulation or by endoscopic images obtained by imaging a plurality of phantoms simulating a living body having a plurality of levels of oxygen saturation are stored. A correlation between the logarithmized value and oxygen saturation is stored.
- Y Y-axis direction logarithmized from the signal ratio B2/G1.
- the contour lines are positioned further downward in the Y-axis (vertical axis) direction as the oxygen saturation increases.
- the contour line 84b of 100% oxygen saturation is located below the contour line 84c of 0% oxygen saturation.
- the correlation between the signal ratios B2/G1 and R1/G1 and the oxygen saturation is closely related to the light absorption properties and light scattering properties of oxygenated hemoglobin (graph 84d) and reduced hemoglobin (graph 84e) shown in FIG. ing.
- graph 84d oxygenated hemoglobin
- graph 84e reduced hemoglobin
- the wavelength band of 540 ⁇ 20 nm of the green light G is a wavelength band in which the amount of light absorption is likely to change depending on the blood concentration, since the absorption coefficient of hemoglobin is relatively high.
- the signal value of the B2 image signal obtained by irradiating the observation target with the calculation illumination light containing the second blue light BL changes depending particularly on the oxygen saturation.
- the signal value of the G1 image signal obtained by irradiating the observation target with the white-equivalent light largely depends particularly on the blood concentration.
- the signal value of the R1 image signal obtained by irradiating the object to be observed with the white-equivalent light varies moderately depending on the oxygen saturation.
- the signal values of the B2 image signal, G1 image signal and R1 image signal all fluctuate depending on the oxygen saturation, blood concentration and brightness.
- blood concentration refers to the hemoglobin concentration (hemoglobin amount) in blood.
- the signal ratio B2/G1 that mainly depends on the oxygen saturation and the signal ratio R1/G1 that mainly depends on the blood concentration are calculated.
- the signal ratio B2/G1 is a value that is moderately dependent on the blood concentration.
- the signal ratio R1/G1 is a value that is moderately oxygen saturation dependent.
- the oxygen saturation calculation unit 84 refers to the oxygen saturation calculation table 84a and calculates the oxygen saturation corresponding to the signal ratios B2/G1 and R1/G1 for each pixel. For example, as shown in FIG. 15, the oxygen saturation corresponding to the signal ratios B2*/G1* and R1*/G1* of the specific pixel is "40%". Therefore, the oxygen saturation calculator 84 calculates the oxygen saturation of the specific pixel as "40%".
- the signal ratios B2/G1 and R1/G1 rarely become extremely large or extremely small. That is, the combinations of the signal ratios B2/G1 and R1/G1 are distributed below the isopleth line 84c (see FIG. 13) of the upper limit of the oxygen saturation of 100%, or conversely, when the oxygen saturation is 0 It is almost never distributed above the isoline 84b (see FIG. 13) of the lower limit of %. However, when distributed above the upper limit isovalue line 84c, the oxygen saturation is set to 100%, and when distributed below the lower limit isovalue line 84b, the oxygen saturation calculation unit 84 calculates the oxygen saturation. 0%.
- the oxygen saturation image generation unit 85 uses the oxygen saturation calculated by the oxygen saturation calculation unit 84 to generate an oxygen saturation image that visualizes the oxygen saturation. Specifically, the oxygen saturation image generation unit 85 acquires the B2 image signal, the G1 image signal, and the R1 image signal, and calculates the oxygen saturation image generation gain according to the oxygen saturation for these image signals. is applied pixel by pixel. Then, the B2 image signal, the G1 image signal, and the R1 image signal to which the oxygen saturation image generation gain has been applied are used to generate RGB image data, which is superimposed on the base image to form an oxygen saturation image.
- the gain for oxygen saturation image generation is multiplied so that the gains of the B and G channels are relatively increased and the gain of the R channel is relatively decreased.
- the oxygen saturation image generation unit 83 sets the same oxygen saturation image generation gain of "1" to all of the B2 image signal, the G1 image signal, and the R1 image signal for the pixels with the oxygen saturation of 60% or more. ” is multiplied by
- the B2 image signal is multiplied by an oxygen saturation image generation gain of "1" or more
- the G1 image signal and the R1 image signal are multiplied by "1". ” for oxygen saturation imaging.
- the oxygen saturation image is the RGB image data generated using the B2 image signal, the G1 image signal, and the R1 image signal after such gain processing for oxygen saturation image generation, and superimposed on the base image as pseudo colors.
- the image signal to which the oxygen saturation image generating gain is applied to generate the oxygen saturation image is not limited to the image signals given in the above examples.
- the oxygen saturation image generated by the oxygen saturation image generator 83 for example, a hyperoxic region (region with an oxygen saturation of 60 to 100%) is represented in the same color as the base image, while the oxygen saturation A hypoxic region (region with an oxygen saturation of 0 to 60%) where is below a specific value is preferably represented in a color (pseudocolor) different from that of the base image.
- the oxygen saturation image generating unit 83 represents the hypoxic region by multiplying the hypoxic region by the pseudo-colorized oxygen saturation image generating gain.
- the hyperoxic region may be represented by multiplying the hyperoxic region by an oxygen saturation image generation gain corresponding to the oxygen saturation.
- a color map representing the oxygen saturation with pseudo-color gradation may be generated and used as the oxygen saturation image.
- the low-oxygen region and the high-oxygen region are separated by the oxygen saturation of 60%, but this boundary is also arbitrary. For example, specific values in multiple stages may be provided, and a color map divided into low-oxygen, intermediate-oxygen, and high-oxygen areas may be generated.
- an oxygen saturation image may be generated in which the oxygen saturation is displayed as character information such as "A%".
- Corrected oxygen saturation image generation unit 87 The signal ratio calculation unit 83 of the tissue oxygen saturation image generation unit 80 performs signal ratio processing based on the B2 image signal, the G1 image signal, the R1 image signal, the B3 image signal, and the G3 image signal. A calculation value for calculating the corrected oxygen saturation is calculated. Specifically, the signal ratio calculator 83 uses the signal ratio B2/G1 between the B2 image signal and the G1 image signal, and A signal ratio R1/G1 and a signal ratio B3/G3 between the B3 image signal and the G3 image signal are calculated. It is preferable to logarithmize (ln) each of the signal ratios B2/G1, R1/G1 and B3/G3.
- the calculation value for oxygen saturation calculation includes the color difference signals Cr and Cb calculated from the B2 image signal, the G1 image signal, the R1 image signal, the B3 image signal and the G3 image signal, or the saturation S and hue H. may be used. Also, instead of the signal ratio B3/G3, the signal ratio B1/G3 between the B1 image signal and the G3 image signal may be used. In this case, a dye value calculation table 86a using the signal ratio B1/G3 is referred to as a dye value calculation table 86a, which will be described later.
- the observation target may include specific pigments that are pigments other than oxidized or reduced hemoglobin that affect the calculation of oxygen saturation.
- Specific pigments include, for example, yellow pigments.
- the absorption coefficient of the yellow dye has the highest peak near the wavelength of 450 ⁇ 10 nm. Therefore, the signal value of the B2 image signal obtained based on the light transmitted through the B color filter BF among the observation illumination light including the second blue light BL having a center wavelength of 470 nm ⁇ 10 nm is dependent on the amount of yellow pigment. It is high and its value fluctuates greatly depending on the amount of yellow pigment, which affects the calculation of oxygen saturation.
- the signal value of the B2 image signal decreases, so the value of the signal ratio B2/G1 decreases and the oxygen saturation appears to increase. Therefore, when the object to be observed contains a yellow pigment, the effect of the yellow pigment is taken into account by further acquiring image signals with relatively low yellow pigment amount dependence (for example, B3 image signal and G3 image signal). Corrected oxygen saturation, which is tissue oxygen saturation, can be calculated.
- the yellow pigment dependency of the G1 image signal is low to moderate, and the yellow pigment dependency of the R1 image signal is low.
- the signal value of the B3 image signal obtained by irradiating the observation object with the correction illumination light containing the green light G has brightness dependence, low oxygen saturation dependence, high blood concentration dependence, and yellow color.
- the dye amount dependence is a moderate value.
- the signal value of the G3 image signal obtained by irradiating the observation object with the correction illumination light containing the green light G has brightness dependency, low oxygen saturation dependency, and high blood concentration dependency. , with a low to moderate dependence on the amount of yellow pigment.
- the corrected oxygen saturation calculation unit 86 calculates signal ratios B2/G1, R1/G1 and B3/ Using G3, the pigment value calculation table 86a and the corrected oxygen saturation calculation table 86b are referenced to obtain the corrected oxygen saturation corresponding to the amount of the yellow pigment.
- the dye value calculation table 86a stores the signal ratio B2/G1, the signal ratio R1/G1, the signal ratio B3/G3, and the correlation with the dye value corresponding to the amount of the specific dye.
- the dye value is a value obtained in advance using a simulation or an endoscopic image obtained by imaging a plurality of phantoms simulating a living body having a plurality of stages of oxygen saturation.
- curved surfaces 86c to 86g are formed for each colorant value in multiple stages. Curved surfaces 86c-86g are contour lines of tissue oxygen saturation, each of which has a constant dye value.
- the corrected oxygen saturation calculation table 86b does not have to be stored in advance.
- the corrected oxygen saturation calculation unit 86 calculates the signal ratio B2/G1 and the signal ratio R1/G1, and the corrected oxygen saturation calculation, which is the correlation between the corrected oxygen saturation, each time according to the pigment value. Create a table 86b.
- the created corrected oxygen saturation calculation table 86b may be used in the observation mode as the oxygen saturation calculation table 84a.
- a correction oxygen saturation calculation table 86b that stores in advance the signal ratios R1/G1, B2/G1 and B3/G3 and the correlation with the tissue oxygen saturation is used. may be used to obtain a corrected oxygen saturation in which the influence of the yellow pigment is considered.
- the corrected oxygen saturation image generation unit 87 uses the corrected oxygen saturation calculated by the corrected oxygen saturation calculation unit 86 to generate a corrected oxygen saturation image that is an image of the corrected oxygen saturation. Specifically, the corrected oxygen saturation image generation unit 87 acquires the B2 image signal, the G1 image signal, and the R1 image signal, and uses these image signals for generating a corrected oxygen saturation image according to the oxygen saturation. Gain is applied pixel by pixel. Then, RGB image data is generated using the B2 image signal, the G1 image signal and the R1 image signal to which the gain for generating the corrected oxygen saturation image is applied, and superimposed on the base image as a pseudo color to obtain a corrected oxygen saturation image. . Note that the image signal to which the corrected oxygen saturation image generation gain is applied in order to generate the corrected oxygen saturation image is not limited to the image signal exemplified above.
- a hypoxic area an area where the oxygen saturation is 0 to 60%
- a hyperoxic area oxygen saturation 60 to 100% oxygen saturation
- hypoxic regions (0 to 60% oxygen saturation) may be indicated in different colors (pseudo colors).
- a color map corresponding to the corrected oxygen saturation may be generated and used as a corrected oxygen saturation image, or a corrected oxygen saturation image may be generated in which the corrected oxygen saturation is indicated by text information "B%". .
- the oxygen saturation image generation unit 85 or the corrected oxygen saturation image generation unit 87 does not operate when the observation target is far away from the distal end portion 12d of the endoscope 12, or when the illumination light is
- the image signal brightness of the image signal to which the tissue oxygen saturation image generation gain (oxygen saturation image generation gain or corrected oxygen saturation image generation gain) is applied is extremely small If a region exists, a tissue oxygen saturation image may be generated in which the region is displayed in black. In addition, when there is an area where the image signal brightness of the image signal to which the gain for tissue oxygen saturation image generation is applied is extremely large, such as when the reflected light from the observation object contains a lot of specularly reflected light, that area is removed. A tissue oxygen saturation image displayed in white may be generated.
- the exposure control unit 110 generates different exposure control signals based on image signals obtained in the first exposure period and the second exposure period, and performs control (exposure control) according to each exposure control signal.
- the exposure control section 110 includes an exposure control signal generation section 120 and a control amount output section 130, as shown in FIG.
- the control amount output section 130 further includes a brightness calculation section 140 and a brightness difference calculation section 150 .
- the exposure period is a period from the timing at which various types of illumination light are emitted to the timing at which the imaging sensor 43 senses reflected light from an observation target and outputs an image signal. Exposure control is to control units that operate during the exposure period, such as the light source unit 20 and the imaging optical system 40 .
- the exposure control unit 110 receives from the noise reduction unit 62 the observation image signal 111, which is the white light equivalent image signal IS1 or the calculation image signal IS2 acquired during the first exposure period EP1. Also, it receives the correction image signal IS3 acquired in the second exposure period EP2.
- the brightness calculation unit 140 of the control amount output unit 130 calculates the observation image signal brightness Y1 from the observation image signal 111 and the correction image signal brightness Y2 from the correction image signal IS3.
- the brightness calculation unit 140 outputs the image signal brightness from different partial image signals according to the type of the received image signal. Calculating image signal brightness for outputting a control amount from a part of different image signals, thereby performing more suitable exposure control for each of the image signal for observation and the image signal for correction. This is because A specific method for calculating the image signal brightness from part of the acquired image signal will be described later.
- Image signal brightness refers to brightness information possessed by each type of image signal.
- control amount output unit 130 outputs the first control amount CQ1 based on the observation image signal 111, and outputs the second control amount CQ2 based on the correction image signal IS3.
- the control amount is a value that varies according to the image signal brightness. This is because the appropriate amount of exposure varies depending on the type of image signal to be acquired, and further, even when the same type of illumination light is emitted, it also varies depending on the image signal obtained for each frame.
- control amount differs depending on the type of image signal to be acquired.
- Both the white light and the illumination light for calculation are illumination light that combines multiple colors of light, and have similar spectra (see FIGS. 3 and 4). The amounts are also close to each other.
- the correction illumination light has a spectrum that is significantly different from that of the observation illumination light (see FIGS. 3 to 5)
- the amount of control based on the correction image signal output for exposure control also varies depending on the observation light. The value is different from the control amount based on the image signal for use.
- the exposure control signal generator 120 generates a first exposure control signal ECS1 based on the first control amount CQ1, and generates a second exposure control signal ECS2 based on the second control amount CQ2.
- the respective exposure control signals are transmitted from the exposure control section 110 to the central control section 50.
- the first exposure control signal EC1 corresponding to the first exposure control signal ECS1 and the second exposure control signal EC2 corresponding to the second exposure control signal ECS2 is performed on the light source unit 20 and the imaging optical system 40 .
- the first exposure control EC1 and the second exposure control EC2 control the emission of illumination light and the acquisition of the image signal performed in the exposure period chronologically later than the exposure period in which the image signal is acquired. Specific contents of the exposure control will be described later. Since the amount of control that determines the content of each exposure control signal is different, the first exposure control EC1 and the second exposure control EC2 are controls with different content.
- exposure control is performed based on the image signal brightness of each image signal based on mutually different image signals acquired in a plurality of types of frames, and the lack of brightness that occurs between different types of image signals. It is possible to prevent an excessive amount and to obtain image signals captured in later frames in chronological order under more appropriate conditions based on the control amount.
- the control amount is preferably output based on the difference between the image signal brightness calculated from the image signal and the target brightness.
- the brightness calculator 140 calculates the image signal brightness using the image signal.
- the brightness difference calculator 150 calculates a difference (brightness difference) between a preset target brightness and the image signal brightness.
- the target brightness refers to a target value of brightness information of each type of image signal, which is set in advance for each type of image signal.
- the control amount output section 130 outputs the control amount based on the brightness difference. Note that the control amount output method is not limited to this.
- the amount of light emitted from the light source when acquiring the image signal, the aperture value, the exposure time length, etc. may be stored, and the difference between these values and the respective target values may be calculated to output the control amount. good.
- appropriate exposure control can be sequentially performed based on the brightness of each image signal obtained according to the purpose of observation.
- the image signal brightness is calculated, the brightness difference is calculated, the control amount is output from the brightness difference, and the control amount is output in the subsequent frames in chronological order.
- the exposure control signal based on is generated sequentially.
- the brightness calculation unit 140 calculates the observation image signal brightness (first image signal brightness) Y1 from the observation image signal 111, and the correction image signal IS3.
- a correction image signal brightness (second image signal brightness) Y2 is calculated.
- the image signal brightness is calculated according to the image signal obtained in each mode.
- the brightness difference calculation unit 150 calculates the difference between the preset target brightness and each image signal brightness.
- the target brightness an observation image signal target brightness (first target brightness) and a correction image signal target brightness (second target brightness) are set.
- the first target brightness and the second target brightness may be the same value or different values.
- an observation image signal brightness difference ⁇ Y1 which is a difference in brightness between the observation image signal brightness Y1 and the observation image signal target brightness
- a correction image signal brightness difference ⁇ Y2 which is a brightness difference between the correction image signal brightness Y2 and the correction image signal target brightness
- a brightness difference is calculated for each mode.
- the control amount output unit 130 outputs the control amount based on the brightness difference.
- the first control amount CQ1 is calculated based on the observation image signal brightness difference ⁇ Y1.
- the second control amount CQ1 is calculated based on the correction image signal brightness difference ⁇ Y2.
- the observation image signal brightness Y1 and the observation image signal brightness difference ⁇ Y1 are substituted into the first control amount calculation function f(Y1, ⁇ Y1) to calculate the first control amount CQ1
- the correction image signal brightness Y2 and the correction image signal brightness difference ⁇ Y2 are substituted into the second control amount calculation function f(Y2, ⁇ Y2) to calculate the second control amount CQ1.
- the control amount calculation method is not limited to this.
- the exposure control signal generator 120 generates an exposure control signal based on the control amount.
- the first exposure control signal ECS1 is generated based on the first control amount CQ1
- the second exposure control signal ECS2 is generated based on the second control amount CQ2.
- the generated exposure control signal is sent to the central control unit 50, and a first exposure control EC1 corresponding to the first exposure control signal ECS1 and a second exposure control EC2 corresponding to the second exposure control signal ECS2 are performed.
- the second controlled variable CQ2 is preferably larger than the first controlled variable CQ1.
- the reason for this is that the illumination light for observation is bright illumination light obtained by combining light of a plurality of colors, while the illumination light for correction is dark illumination light having monochromatic light.
- the amount of exposure to the imaging sensor 43 during the second exposure period in which the emitted illumination light is dark is smaller than the amount of exposure during the first exposure period. Therefore, by increasing the control amount, the brightness of the image signal obtained in the first exposure period can be increased.
- Another reason is that it is preferable to continuously acquire image signals having a certain degree of image signal brightness in order to accurately calculate the corrected oxygen saturation.
- the brightness of the image signal obtained varies depending on the imaging magnification, etc., but the image signal for correction, which requires a more precise signal value than the image signal for observation, precisely controls the brightness of the image signal, which is particularly necessary for each imaging scene. There is a need to. Therefore, by making the second control amount larger than the first control amount, optimal exposure control for the imaging scene can be continuously performed, and a precise signal value can be obtained.
- the brightness calculation unit 140 of the control amount output unit 130 preferably outputs image signal brightness using an image signal (specific color signal) obtained from pixels of a specific color.
- an image signal for example, it is preferable to use a B image signal (B signal) as the specific color signal.
- B signal B image signal
- the image signal brightness of the B signal (B1 image signal, B2 image signal and B3 image signal) is compared with the G image signal (G signal) and the R image signal (R signal). This is because an image signal having a large image signal brightness can be obtained by performing exposure control in accordance with the B signal.
- the image signal brightness and the brightness difference are calculated, and the first control amount and the second control amount are calculated. Output the amount.
- the target brightness for the specific color signal may be changed according to each image signal.
- the specific color signal may be a G signal, an R signal, or a four-color image signal of CMYG, or a combination thereof, and the target brightness can be arbitrarily set according to each specific color signal.
- the specific color signal used for calculating the image signal brightness may be changed according to the type of the image signal.
- the observation image signal may be the G1 image signal
- the correction image signal may be the B3 image signal.
- the G pixels of the image sensor 43 are divided into Gb pixels and Gr pixels, and the Gb image signal is obtained from the Gb pixel and the Gr image signal is obtained from the Gr pixel.
- Gb, Gr, B, and R are pixel values, and K1, K2, K3, K4, and K5 are arbitrarily set coefficients).
- the brightness difference may be calculated after changing the coefficient according to the type of , and the control amount may be output.
- the control amount output unit 130 preferably calculates the image signal brightness using the image signal in a partial area of the analysis image generated from the image signal.
- the analysis region setting unit 141 generates an analysis image from each image signal and extracts a specific region from the analysis image.
- the area brightness calculator 142 calculates brightness from the image signal in the specific image area.
- the specific area is preferably an area with high reliability and analysis accuracy for the signal value of the image signal.
- an endoscopic image 141a generated with the lumens of hollow organs such as the esophagus, stomach, small intestine, and large intestine as observation targets is viewed so that the inner part of the lumen can be seen. That is, the region 141b is divided into a region 141b closer to the distal end 12d of the endoscope 12 and a farther region 141b from the distal end 12d of the endoscope 12.
- FIG. The area 141b on the far side is difficult for illumination light to reach and does not have sufficient brightness, so the analysis accuracy is low.
- the region 141b on the near side is illuminated with a sufficient amount of light and is therefore bright, and thus has high analysis accuracy and is suitable as a specific region.
- the closer to the edge of the endoscopic image 141a the greater the distortion of the image, and the lower the analysis accuracy.
- the specific region is preferably extracted according to a specific shape preset according to the type of image signal to be acquired.
- a specific shape is a shape set in consideration of analysis accuracy. For example, a shape 141d (shaded area) in which only the most marginal region is removed as shown in FIG. There are a doughnut-shaped shape 141e (hatched portion) and a shape 141f (hatched portion) for extracting a region near the center as shown in FIG. Further, the specific region may be extracted based on the luminance calculated from each image signal.
- a method of extracting a predetermined shape when the inner part of the lumen is reflected on the edge of the endoscopic image, or when the inner part of the lumen is not included in the endoscopic image as a result of high-magnification imaging of the mucous membrane. can be accommodated if it is not suitable.
- the analysis region setting unit 141 extracts a specific region using the image signal corresponding to white light or the image signal for calculation, which is the image signal for observation. Also, a specific region is extracted using the correction image signal. In this case, an observation analysis image (first analysis image) is generated using the observation image signal, and an observation analysis region (first region) is extracted as the specific region. Further, a correction analysis image (second analysis image) is generated using the correction image signal, and a correction analysis region (second region) is extracted as a specific region.
- the area brightness calculation unit 142 calculates observation area brightness (first area brightness) as the area brightness from the first area. Further, the correction area brightness (second area brightness) is calculated from the second area.
- the brightness difference calculation unit 150 calculates an observation image signal area brightness difference as a brightness difference between the first area brightness and the first target brightness. In addition, as the difference in brightness between the second area brightness and the second target brightness, a correction image signal area brightness difference is calculated.
- the control amount output unit 130 outputs a first area control amount based on the observation image signal area brightness difference, and outputs a second area control amount based on the correction image signal area brightness difference.
- the exposure control signal generator 120 generates a first area exposure control signal based on the first area control amount, and generates a second exposure control signal based on the second area control amount. Finally, the first exposure control EC1 corresponding to the first area exposure control signal and the second exposure control EC2 corresponding to the second area exposure control signal are sequentially performed. exposure control is performed.
- Diagnosis using a white light equivalent image (or normal light image) and an oxygen saturation image by a user such as a doctor should be performed using an endoscope, excluding areas near the periphery with large distortion and areas deep in the lumen that are difficult to observe. It is desirable to do this over a wide area of the image (for example, the area included in the shapes shown in FIGS. 23 and 24).
- the image signal of the area near the center of the image with high analysis accuracy for example, the area of the shape included in FIG. 25
- the observation image signal the image signal corresponding to white light and/or the calculation image signal
- the image signal for correction can be made different by changing the analysis region in the image signal used for exposure control. preferable.
- a specific region 151a (first region) is extracted from the first analysis image 151 (in FIG. 26, the observation analysis image of the previous frame).
- a first area exposure control signal is generated using the observation image signal of the first area.
- the brightness of the observation image signal 152 (the endoscopic image (observation illumination light) of the subsequent frame in FIG. 26) acquired in the subsequent first exposure period is adjusted.
- the image signal for correction is acquired, for example, as shown in FIG. 27, a specific region 153a (second region) is extracted from the second analysis image 153 (analysis image for correction of the previous frame in FIG. 27).
- the correction image signal for the second area is used to generate the second area exposure control signal.
- the brightness of the correction image signal 154 (the endoscopic image (correction illumination light) of the later frame in FIG. 27) acquired in the second exposure period later in time series is adjusted.
- the brightness of the image signal is indicated by the density of the shaded area. That is, when exposure control is performed using the first region 151a, which is a relatively bright region suitable for diagnosis among originally relatively bright observation image signals, the amount of control is small, and the image signal obtained later is not affected by the exposure control. The amount of change in brightness is also small. On the other hand, when exposure control is performed using the second region 153a, which is a darker region but whose analysis accuracy is higher, of the originally dark correction image signal, the amount of control is large, and the brightness of the image signal obtained later is large. is also large. In this manner, the image signal used for exposure control can be changed depending on the purpose. With the above configuration, it is possible to obtain an image signal with more appropriate brightness according to the type of image signal.
- the method using the specific color signal and the method using the image signal in the specific region may be combined.
- the G1 image signal included in the specific region shown in FIGS. 23 and 24 is used, and in order to calculate the correction image signal brightness, the specific region shown in FIG.
- the B3 image signal included in the B3 image signal may be used.
- Different exposure control signals are generated based on three types of image signals, namely, the image signal IS1 corresponding to white light, the image signal IS2 for calculation, and the image signal IS3 for correction, so that different exposure controls can be performed. preferable.
- the exposure control signal generator 120 generates the first A exposure control signal ECS1 based on the white light equivalent image signal IS1 acquired in the first illumination period. Also, based on the optical image signal for calculation IS2 acquired in the second illumination period, the exposure control signal generator 120 generates the first B exposure control signal ECS1B. Furthermore, based on the correction image signal IS3 acquired in the third illumination period, the exposure control signal generator 120 generates the second exposure control signal ECS2.
- the exposure control unit 110 transmits respective exposure control signals to the central control unit 50, and finally performs a 1A exposure control EC1A according to the 1A exposure control signal ECS1A and a 1B exposure control signal ECS1B according to the 1B exposure control signal ECS1B.
- a first B exposure control EC1B and a second exposure control EC2 according to the second exposure control signal ECS2 are performed.
- the exposure control performed by the exposure control unit 110 includes control of the amount of light that controls the light source unit 20, control of the aperture value of the diaphragm 47 in the imaging optical system 40, control of the exposure time length that controls the shutter 48, or control of the exposure time length that controls the shutter 48.
- a control of the gain that controls the sensor 43 is preferably included.
- the exposure control unit 110 controls the light source control unit 21 or the imaging control unit 44 via the central control unit 50 by transmitting respective exposure control signals.
- the light source control section 21 controls the light source section 20 to adjust the light amount and the light amount ratio.
- a target light intensity When controlling the light intensity, a target light intensity may be set.
- the exposure control unit 110 transmits a light amount control signal as an exposure control signal to the light source control unit 21 via the central control unit 50 according to the image signal brightness and the brightness difference based on the image signal. Send.
- the light source control section 21 controls the light amount of each light source of the light source section 20 based on the light amount control signal.
- the exposure control unit 110 generates a light amount control signal based on the first control amount CQ1 output using the observation image signal 111, and the light source control unit 21 controls the BS-LED 20b, BL-LED 20c, G- The light quantity and light quantity ratio of the LED 20d and the R-LED 20e are adjusted. Also, a light amount control signal is generated based on the second control amount CQ2 calculated using the correction image signal IS3, and the light source control unit 21 dims the G-LED 20d.
- the exposure control unit 110 generates a light amount control signal based on the first control amount CQ1 output using the observation image signal 111
- the light source control unit 21 controls the BS-LED 20b, BL-LED 20c, G- The light quantity and light quantity ratio of the LED 20d and the R-LED 20e are adjusted.
- a light amount control signal is generated based on the second control amount CQ2 calculated using the correction image signal IS3, and the light source control unit 21 dims the G-LED 20d.
- the imaging control unit 44 controls the diaphragm 47 , the shutter 48 and/or the imaging sensor 43 .
- the exposure control unit 110 sets a target aperture value, generates an exposure control signal, and controls the aperture value to adjust the aperture value.
- the exposure control unit 110 sets a target frame rate and a target shutter speed, generates an exposure control signal, controls the shutter 48, and adjusts the exposure time length. do.
- the exposure control unit 110 sets a target gain, controls the imaging sensor 43, and adjusts the analog gain. Control of the imaging optical system is not limited to this.
- the exposure control method is not limited to the above. Further, the exposure control may be set so as to perform a combination of the above methods. With the above configuration, exposure control can be performed by selecting an appropriate method based on the image signal acquired in each exposure period.
- the present invention is also suitable when a rigid endoscope (laparoscopic) used for surgical operations or the like is used.
- a flexible endoscope an endoscopic image such as a tissue oxygen saturation image obtained by calculating the tissue oxygen saturation of the superficial mucosa is displayed, with the observation target being the superficial mucosa viewed from the lumen side of the hollow organ.
- an endoscopic image such as a tissue oxygen saturation image obtained by calculating the tissue oxygen saturation on the surface of the organ is displayed as an organ viewed from the serosal side.
- the image signal acquisition unit 60 acquires the image signal (S101), the brightness calculation unit 140 calculates the brightness of the image signal (S102), and the brightness between the calculated brightness and the target brightness
- the brightness difference calculation unit 150 calculates the brightness difference (S103), the control amount output unit outputs the control amount (S104), and the exposure control signal generation unit 120 generates an exposure control signal based on the control amount (S105 ), and the exposure control unit 110 performs exposure control for the next frame (S106).
- the “plural types of image signals” refer to normal light image signals, white light equivalent image signals, calculation image signals, or correction image signals as shown in Tables 1 to 3.
- the exposure control of the present embodiment is based on a plurality of types of image signals obtained by irradiating an observation target with illumination light having different acquisition purposes and having significantly different spectra, and is different depending on the exposure period for acquiring the image signals. Since exposure control is performed sequentially, it is possible to prevent insufficient or excessive brightness of each image signal caused by exposure control based on one type of image signal, and obtain an image signal captured under more appropriate conditions.
- the correction mode when calculating the corrected oxygen saturation with reference to the corrected oxygen saturation calculation table 86b (curved surfaces 86c to 86g shown in FIG. 17) corresponding to the dye value, out of the image signals obtained in the correction mode , a part of the image signal may be used.
- selecting the corrected oxygen saturation calculation table 86b according to the dye value is referred to as "correction processing".
- the partial image signal is an image signal in the correction specific area in the correction image described later (see FIG. 31 described later).
- the specific area for correction be an area that is less affected by disturbances that affect the calculation accuracy of the oxygen saturation. In order to determine the degree of influence of disturbance in the correction specific area, the reliability of the image signal in the correction specific area is calculated.
- Disturbances include halation, dark areas, hemorrhage, fat, mucous membranes, etc., which can cause a decrease in the calculation accuracy of oxygen saturation, other than specific pigments, among the observation objects reflected in the endoscopic image captured by the endoscope 12. These are deposits on the surface and the like.
- Halation and dark areas are related to the brightness of the endoscopic image. Halation is a region in which an image is overexposed due to strong light incident on the imaging sensor 43 .
- the dark area is an area in which illumination light is difficult to reach due to shadows of structures in the body such as folds and flexures of the colon, treatment tools, etc., or the depth of the lumen, resulting in a dark image.
- Bleeding includes extraserosal (intraperitoneal) or external bleeding into the gastrointestinal lumen, and internal bleeding within the mucosa.
- Fat includes fat found extraserosally (intraperitoneally) such as omentum, lesser omentum, mesentery, and fat found on the mucosal surface of the gut lumen.
- Attachments on the mucosal surface include attachments of biological origin such as mucus, blood, exudate, etc., attachments of staining liquid, extracorporeal attachments such as water sent from a water supply device, attachments of biological and non-living origin. Included are deposits, which are leftovers or residues with which the deposits are mixed.
- a correction image 200 as shown in FIG. 31 is displayed on the display 15 at the timing of switching to the correction mode. Display of the correction image 200 is controlled by the display control unit 100 . A correction specific region 201 is displayed in the correction image 200 in a manner that can be visually recognized by the user.
- the shape of the correction specific region 201 is not limited to a circular shape as shown in FIG.
- the position of the correction specific region 201 is not limited to the central portion of the image as shown in FIG.
- a donut-shaped region excluding the peripheral portion of the correction image 200 where the influence of distortion due to the curvature of the lens is large and the center portion of the correction image 200 which is a dark portion because it corresponds to the inner part of the lumen is used for correction. It may be a specific area.
- the correction image is preferably a color image (for example, an image corresponding to white light) generated using the B1 image signal, the G1 image signal, and the R1 image signal.
- the correction image may be an image generated using other image signals.
- the correction image is the correction image of the tissue oxygen saturation image generation unit 80, as shown in FIG. It is generated by the generator 210 .
- the tissue oxygen saturation image generator 80 further includes a reliability calculator 220 and a correction determiner 230 in addition to the correction image generator 210 .
- the reliability calculation unit 220 When the correction image 200 as shown in FIG. 31 is displayed on the display 15, when a reliability calculation instruction is input, the reliability calculation unit 220 performs correction based on the image signal in the correction specific region 201. Reliability is calculated for each pixel included in the specific region 201 for use.
- the input of the reliability calculation instruction may be performed according to the input instruction via the user interface, or may be automatically performed at the same timing as the control for displaying the correction image 200 .
- the reliability includes (1) reliability of the brightness of the endoscopic image, (2) reliability of the degree of bleeding included in the endoscopic image, and (3) degree of fat included in the endoscopic image. There is reliability etc. by
- the reliability calculation unit 220 calculates the reliability by using the G2 image signal and referring to the first reliability calculation table 221 as shown in FIG.
- the first reliability calculation table 221 is a pre-generated table that indicates the relationship between the signal value of the G2 image signal and the reliability.
- the signal value of the G2 image signal is, for example, a luminance value obtained by performing conversion processing using the G2 image signal.
- the reliability is calculated as a value between 0 and 1.
- the reliability of the signal value of the G1 image signal outside the certain range Rx is lower than the reliability of the luminance value of the G1 image signal within the certain range Rx.
- the G1 image signal may be used instead of the G2 image signal for calculating the reliability of brightness (see FIG. 60, which will be described later).
- the reliability calculation unit 220 uses the signal ratio ln(R1/G1) and the signal ratio ln(B1/G1), and refers to the second reliability calculation table 222 as shown in FIG. Calculate confidence.
- the definition line DFX is plotted in a two-dimensional coordinate system in which the X axis is ln(R1/G1) and the Y axis is the signal ratio ln(B1/G1).
- coordinates (X1, Y1) calculated by taking the value of the X component as the signal value ln (R1/G1) and the value of the Y component as the signal ratio ln (B1/G1) (ln (R1/G1), ln ( B1/G1)) is calculated such that the lower the lower right position of B1/G1)) in the second reliability calculation table 222, the lower the reliability. Further, when the coordinates (X1, Y1) are located in the upper left area from the definition line DFX, the reliability based on the degree of bleeding is set to a high reliability fixed value.
- the signal ratio ln(R1/G1) is a value obtained by standardizing the R1 image signal with the G1 image signal and converting it into a logarithm.
- the signal ratio ln(B1/G1) is a value obtained by normalizing the B1 image signal with the G1 image signal and converting it into a logarithm.
- the reliability calculation unit 220 uses the signal value ln(R2/G2) and the signal ratio ln(B2/G2), and refers to the third reliability calculation table 223 as shown in FIG. Calculate confidence.
- the third reliability calculation table 223, a definition line DFY is plotted in a two-dimensional coordinate system with ln (R2/G2) on the X axis and signal ratio ln (B2/G2) on the Y axis.
- coordinates (X2, Y2) calculated by taking the value of the X component as the signal value ln (R2/G2) and the value of the Y component as the signal ratio ln (B2/G2) (ln (R2/G2), ln ( B2/G2)) is calculated such that the lower the left position of B2/G2)) is in the third reliability calculation table 223, the lower the reliability.
- the reliability based on the degree of fat is set to a high reliability fixed value.
- the signal ratio ln(R2/G2) is a value obtained by standardizing the R2 image signal with the G2 image signal and converting it into a logarithm.
- the signal ratio ln(B2/G2) is a value obtained by standardizing the B2 image signal with the G2 image signal and converting it into a logarithm.
- the X component value is the signal value ln(R1/G1)
- the reliability calculation unit 220 calculates at least one of the reliability of brightness (first reliability), the degree of bleeding (second reliability), and the degree of fat (third reliability). Calculate one or more confidences.
- the calculated reliability is used as a signal value (signal ratio ln(R1/G1), ln(B2 /G1) and ln(B3/G3)).
- the correction determination unit 230 uses a preset reliability determination threshold to determine the reliability calculated for each pixel in the correction specific region, and determines whether each pixel is a high-reliability pixel or not. Alternatively, it outputs the determination result as to whether it is a low-reliability pixel.
- the correction determination unit 230 treats pixels whose reliability is equal to or higher than the reliability determination threshold as high-reliability pixels, and pixels whose reliability is less than the reliability determination threshold as low-reliability pixels.
- the correction determination unit 230 transmits to the display control unit 100 the determination result of the determination of the reliability of each pixel.
- the display control unit 100 performs control to change the display mode of the correction image 200 displayed on the display 15 according to the determination result.
- the display control unit 100 makes the saturation of the low-reliability area 201a higher than the saturation of the high-reliability area 201b in the specific area 201 for correction.
- a low-confidence region is a set of pixels having low-confidence pixels.
- a high-reliability region is a set of pixels having high-reliability pixels.
- the reliability level used for determining the reliability level is the first reliability level, the second reliability level, or the third reliability level.
- the minimum reliability level may be used.
- a reliability determination threshold may be set for each reliability. For example, a first reliability determination threshold for the first reliability, a second reliability determination threshold for the second reliability, and a third reliability determination threshold for the third reliability are set in advance, and any reliability is less than the reliability determination threshold, the pixel for which the reliability has been calculated may be determined as a low-reliability pixel.
- the correction determination unit 230 may determine the number of high-reliability pixels in addition to the reliability calculated for each pixel. In this case, the display control unit 100 determines whether the number of high-reliability pixels in the correction specific region is equal to or greater than the threshold value for determining the number of high-reliability pixels or is less than the threshold value for determining the number of high-reliability pixels. Change the display mode of the specific area for For example, when the number of high-reliability pixels in the correction specific region is equal to or higher than the high-reliability pixel number determination threshold value, the correction specific region is surrounded by a frame 202 in the first determination result color, as shown in FIG. to display the correction image 200 highlighted by . By highlighting the correction specific area with a frame of the first determination result color, the user can be notified that the correction process can be performed with little influence of disturbance.
- the correction specific area is surrounded by a frame of the second determination result color, which is different from the first determination result color.
- the corrected image 200 may be displayed in a highlighted manner. By highlighting the correction specific region with a frame of the second determination result color, it is possible to inform the user that the number of pixels less affected by disturbance is less than a certain value.
- the display control unit 100 determines whether the number of low-reliability pixels in the correction specific region is equal to or greater than the low-reliability pixel number determination threshold value.
- the display mode of the specific area for correction may be changed depending on whether it is less than the low-reliability pixel count determination threshold value. In this way, using the threshold for determining the number of pixels with high reliability (the threshold for determining the number of pixels with high reliability or the threshold for determining the number of low-reliability pixels), the display mode of the correction image is determined according to the number of pixels with high or low reliability. By changing , it is possible to notify the extent to which disturbance is included in the specific region for correction, and prompt the user to operate the endoscope to appropriately perform the correction process.
- the correction determination unit 230 determines the reliability of each pixel in the specific correction area using the reliability determination threshold and/or the reliability pixel number determination threshold, and the influence of disturbance in the correction specific area is small.
- a message may be displayed on the correction image 200 .
- a message MS1 such as "Correction processing will be performed properly" is superimposed on the correction image 200 and displayed.
- the correction determination unit 230 determines the reliability of each pixel in the specific correction region using the reliability determination threshold and/or the reliability pixel number determination threshold, and determines whether the low reliability region exists in the correction specific region. If it is included, or if the number of low-reliability pixels is greater than or equal to the threshold value for determining the number of reliability pixels, a warning may be displayed. For example, as shown in FIG. 39, a message MS2 such as "Please operate the endoscope for correction processing" is superimposed on the correction image 200 and displayed. Further, when it is determined that the reliability of brightness has a particularly large effect, as shown in FIG. good.
- the user By changing the display mode of the correction image 200 as described above, the user is notified that the correction specific region includes a low-reliability region containing relatively many disturbances, or the correction process is appropriate. can be informed of what can be done In addition to the image displayed on the display 15, the notification may be made by sound.
- the user can be encouraged to operate the endoscope 12 so that the area less affected by the disturbance falls within the correction specific area 201 . That is, it is possible to prompt the user to operate the endoscope 12 so that the low-reliability region does not enter the correction specific region as much as possible and the high-reliability region enters as much as possible.
- the correction process is performed in the correction mode.
- the reliability of each pixel in the correction specific region is determined using the reliability determination threshold and/or the reliability pixel number determination threshold, and it is determined that the influence of disturbance in the correction specific region 201 is small.
- the correction process may be automatically executed without the user's input operation instructing execution of the correction process.
- the reliability of the specific correction area is calculated as internal processing of the processor device 14, and the reliability of each pixel is determined. Correction processing may be performed using the image signal in .
- the reliability calculated for each pixel in the specific region is used to determine whether the B1 image signal, the G1 image signal, the R1 image signal, the B2 image signal, the B3 image signal, and/or the G3 image signal.
- the reliability may be reflected in the correction process by weighting the signal value.
- the average value (average signal value) of the signal values of the B1 image signal, the G1 image signal, the R1 image signal, the B2 image signal, the B3 image signal and/or the G3 image signal in the specific area for correction When calculating the signal ratio ln (R2/G2), the signal ratio ln (B1/G2) and the signal ratio ln (B3/G3) using the weighted average value obtained by weighting the average signal value, these may be calculated.
- the light source unit 20 is a broadband light source 400 that emits broadband light such as a white LED, a xenon lamp, a halogen light source, etc. instead of the color LEDs 20a to 20e shown in the first embodiment.
- the rotary filter 410 the light emitted from the light source device 13 is used as illumination light for illuminating the subject.
- the endoscope system 10 parts different from the first embodiment will be explained, and explanations of common parts will be omitted.
- the light source device 13 of the endoscope system 10 is provided with a broadband light source 400, a rotating filter 410, and a filter switching section 420.
- Filter switching section 420 is controlled by light source control section 21 .
- Other configurations are the same as those of the endoscope system 10 of the first embodiment.
- the imaging sensor 43 is a monochrome imaging sensor.
- the broadband light source 400 emits broadband light having a wavelength band ranging from blue to red.
- Broadband light is, for example, white light.
- the rotary filter 410 includes an inner filter 411 provided inside and an outer filter 412 provided outside.
- the filter switching part 420 moves the rotating filter 410 in the radial direction.
- filter switching unit 420 inserts inner filter 411 of rotary filter 410 into the optical path of white light.
- the filter switching unit 420 inserts the outer filter 412 of the rotary filter 410 into the optical path of the white light in the observation mode or the correction mode.
- the inner filter 411 includes, along the circumferential direction, a B1 filter 411a that transmits light in the wavelength band of the violet light V and the first blue light BS of the white light, and a green filter 411a of the white light.
- a G filter 411b that transmits light in the wavelength band of the light G and an R filter 411c that transmits light in the wavelength band of the red light R of the white light are provided. Therefore, in the normal mode, the illumination light having the wavelength bands of the violet light V and the first blue light BS, the illumination light having the wavelength band of the green light G, and the illumination light having the wavelength band of the red light R are filtered through the rotation filter 410. is emitted from the light source device 13 in accordance with the rotation of .
- the outer filter 412 includes, along the circumferential direction, a B1 filter 412a that transmits light in the wavelength band of the second blue light BL of the white light, A B2 filter 412b that transmits light in the wavelength band of light BS, a G filter 412c that transmits light in the wavelength band of green light G in white light, and a light in the wavelength band of red light R in white light. and a B3 filter 412e for transmitting the blue-green light BG of the white light.
- the blue-green light BG is light in a wavelength band that is transmitted when the correction illumination light is transmitted through the B color filter BF of the image sensor 43, which is a color image sensor (see FIG. 11).
- the illumination light having the wavelength bands of the first blue light BS, the second blue light BL, the green light G, the red light R, and the blue-green light BG is rotated according to the rotation of the rotating filter 410. It is emitted from the light source device 13 .
- the endoscope system 10 captures the reflected light obtained by illuminating the subject with illumination light having the wavelength bands of the violet light V and the first blue light BS with the monochrome image sensor.
- a Bc image signal is output.
- a Gc image signal is output by photographing reflected light obtained by illuminating an object with illumination light having a wavelength band of green light G with a monochrome image sensor.
- an Rc image signal is output by photographing reflected light obtained by illuminating an object with illumination light having a wavelength band of red light R with a monochrome image sensor.
- the reflected light obtained by illuminating the subject with the illumination light having the wavelength band of the first blue light BS is captured by the monochrome image sensor, thereby outputting the B1 image signal.
- a G1 image signal is output by photographing reflected light obtained by illuminating an object with illumination light having a wavelength band of green light G with a monochrome image sensor.
- an R1 image signal is output by photographing reflected light obtained by illuminating an object with illumination light having a wavelength band of red light R with a monochrome image sensor.
- a B2 image signal is output by capturing reflected light obtained by illuminating a subject with illumination light having the wavelength band of the second blue light BL with a monochrome image sensor.
- a B3 image signal is output by photographing the reflected light obtained by illuminating the subject with illumination light having the wavelength band of the blue-green light BG with a monochrome image sensor.
- an oxygen saturation image is generated by the same method as in the first embodiment, and correction processing is performed. produces a corrected oxygen saturation image.
- the signal ratio ln(B3/G3) instead of the signal ratio ln(B3/G3), the signal ratio ln(B3/G1) obtained by standardizing the B3 image signal with the G1 image signal is used.
- a process of selecting the corrected oxygen saturation calculation table 86b according to the dye value may be performed, and the calculation may be performed by referring to the oxygen saturation calculation table 84a.
- a corrected oxygen saturation may be calculated by performing a calculated value correction process of adding or subtracting a correction value obtained from a specific calculation value to or from the calculated oxygen saturation.
- the correction value used for correcting the oxygen saturation is calculated by referring to the two-dimensional coordinate system 430 shown in FIG.
- the vertical axis of the two-dimensional coordinate system 430 is a specific calculation value obtained based on the B1 image signal, G1 image signal, R1 image signal, B2 image signal and B3 image signal, and the horizontal axis is ln(R1/G1). be.
- the specific calculation value is determined by the following formula A).
- a reference line 431a indicating the distribution of predetermined reference baseline information and an actual measurement line 431b indicating the distribution of measured baseline information obtained by actually photographing an observation target are shown.
- a difference value ⁇ Z between the reference line 431a and the measured line 431b is calculated as a correction value.
- the reference baseline information is obtained in the absence of the specific dye and is defined as information that does not depend on oxygen saturation.
- the reference baseline information is a value obtained by adjusting ⁇ so that the above formula A) is constant even if the oxygen saturation changes.
- the endoscope 12 is a rigid endoscope having a camera head 500 at the proximal end portion of the insertion section 12a as shown in FIG.
- the insertion portion 12a is a portion to be inserted into the abdominal cavity of the subject.
- the camera head 500 is equipped with an imaging optical system 40 .
- the imaging optical system 40 having the objective lens 41 and the imaging sensor 43 is provided at the distal end of the endoscope 12.
- the imaging optical system The imaging sensor of 40 is provided in the camera head 500 rather than in the tip.
- the camera head 500 captures reflected light guided from the distal end of the endoscope 12 .
- FIG. 43 omits the angle knob 12e, the mode changeover switch 12f, the still image acquisition instruction switch 12h, and the zoom operation section 12i.
- the parts that are different from the first embodiment and the second embodiment will be explained, and the explanation of the common parts will be omitted.
- the light source device 13 emits normal light including violet light V, first blue light BS, green light G and red light R in the normal mode. In addition, in the observation mode and the correction mode, the light source device 13 emits illumination light (first mixed light). 44 and FIG. 46, FIG. 47, FIG. 48 and FIG. 49, which will be described later, for the sake of simplicity, the spectrum of each illumination light is simplified with the light intensity of the illumination light of each color being a constant value. The light intensity of illumination light of each color is not limited to be constant.
- the camera head 500 includes dichroic mirrors 501, 502 and 503, and imaging sensors 511, 512, 513 and 514 which are monochrome imaging sensors.
- the dichroic mirror 501 reflects light in the wavelength band of the violet light V and the first blue light BS among the light reflected from the object, and reflects the wavelengths of the second blue light BL, the green light G, and the red light R. Transmits a range of light.
- the light reflected by the dichroic mirror 501 and incident on the imaging sensor 511 has the wavelength band of the violet light V or the first blue light BS, as shown in FIG.
- the imaging sensor 511 outputs a Bc image signal in normal mode, and outputs a B1 image signal in oxygen saturation or correction mode.
- the dichroic mirror 502 reflects light in the wavelength band of the second blue light BL and transmits light in the wavelength band of the green light G and red light R.
- the light reflected by the dichroic mirror 502 and incident on the imaging sensor 512 has the wavelength band of the second blue light BL, as shown in FIG.
- the imaging sensor 512 stops outputting the image signal in the normal mode, and outputs the B2 image signal in the observation mode or the correction mode.
- the dichroic mirror 503 reflects the light in the wavelength band of the green light G and transmits the light in the wavelength band of the red light R out of the light transmitted through the dichroic mirror 502 .
- the light reflected by the dichroic mirror 503 and incident on the imaging sensor 513 has a wavelength band of green light G, as shown in FIG.
- the imaging sensor 513 outputs a Gc image signal in the normal mode, and outputs a G1 image signal in the oxygen saturation or correction mode.
- the light transmitted through the dichroic mirror 503 and incident on the imaging sensor 514 has a wavelength band of red light R, as shown in FIG.
- the imaging sensor 514 outputs the Rc image signal in normal mode, and outputs the R1 image signal in observation mode or correction mode.
- the Bc image signal, the Gc image signal, and the Rc image signal are used in the normal mode, and the B1 image signal, the G1 image signal, the R1 image signal, and the B2 image signal are used in the observation mode or the correction mode.
- Output from the camera head Image signals output from the imaging sensors 511 , 512 , 513 and 514 are sent to the processor device 14 .
- the endoscope 12 is a rigid endoscope having a camera head at the proximal end portion of the insertion section 12a.
- the fourth embodiment instead of the camera head 500 of the third embodiment, a camera head 600 as shown in FIG. 50 is provided.
- the camera head 600 includes a dichroic mirror 601 and imaging sensors 611 and 612, as shown in FIG.
- the dichroic mirror 601 reflects light in the wavelength bands of the violet light V, the first blue light BS, the green light G, and the red light R among the light reflected from the object, and also reflects the wavelengths of the second blue light BL. It transmits light in the band (see FIGS. 51(B) and 52(B) which will be described later).
- An imaging sensor 611 that receives light reflected by the dichroic mirror 601 is a color imaging sensor in which B pixels are provided with B color filters BF, G pixels are provided with G color filters GF, and R pixels are provided with R color filters RF. .
- the imaging sensor 612 that receives the light transmitted by the dichroic mirror 601 is a monochrome imaging sensor.
- the imaging sensor 611 which is a color imaging sensor, to generate the Bc image signal, the Gc image signal, and the Rc image signals are output from the imaging sensor 611 respectively.
- the image sensor 612 which is a monochrome image sensor, stops outputting image signals.
- illumination light including first blue light BS, second blue light BL, green light G, and red light R (hereinafter referred to as second mixed light) is emitted from the light source device 13 as shown in FIG. called light.) is emitted.
- the dichroic mirror 601 splits the reflected light from the subject illuminated with the second mixed light by reflecting and transmitting the light.
- FIG. 51B shows the relationship between the reflectance (dashed line 601a) and transmittance (solid line 601b) of light incident on the dichroic mirror 601 and the wavelength of the light.
- the light intensity of the illumination light of each color is assumed to be a constant value. Although the spectrum of light is shown, the light intensity of illumination light of each color is not limited to be constant.
- the imaging sensor 611 which is a color imaging sensor.
- the sensitivities of the B pixel B, G pixel G, and R pixel R of the image sensor 611 and the wavelength of light have a relationship as shown in FIG. 51(C). Therefore, the B pixel B of the imaging sensor 611 outputs the B1 image signal by sensing the light in the wavelength band B1 of the first blue light BS. Also, the G pixel G of the imaging sensor 611 senses the light in the wavelength band G1 of the green light G, thereby outputting a G1 image signal. Furthermore, the R pixel R of the imaging sensor 611 senses the light in the wavelength band R1 of the red light R, thereby outputting an R1 image signal.
- the imaging sensor 612 which is a monochrome imaging sensor.
- the sensitivity of the imaging sensor 612 and the wavelength of light have a relationship as shown in FIG. 52(C). Therefore, the imaging sensor 612 outputs a B2 image signal by sensing the light in the wavelength band B2 of the second blue light BL transmitted by the dichroic mirror 601 .
- FIG. 52(A) shows the wavelength bands of light contained in the second mixed light, like FIG. 51(A).
- FIG. 52B like FIG. 51B, shows the relationship between the reflectance (dashed line 601a) and transmittance (solid line 601b) of light incident on the dichroic mirror 601 and the wavelength of the light. .
- the emission pattern in which the second mixed light ML is emitted is repeated once per frame F. Therefore, in the observation mode of the fourth embodiment, the B1 image signal, the G1 image signal, and the R1 image signal are output from the image sensor 611, which is a color image sensor, and the image signal from the image sensor 612, which is a monochrome image sensor, is output for each frame. A B2 image signal is output. The B1 image signal, the G1 image signal, the R1 image signal and the B2 image signal output from the imaging sensor 611 or the imaging sensor 612 in the observation mode are transmitted to the processor device 14 . The method of calculating the oxygen saturation in the observation mode is the same as in the first embodiment.
- the non-emission state NL for two frames F is displayed.
- the correction illumination light CL for two frames F is emitted
- the second mixed light ML for two frames F is emitted after passing through the non-emission state NL for a plurality of frames.
- a frame in the non-light emitting state NL is a period for switching between the second mixed light ML and the correction illumination light, and neither illumination light is emitted.
- the light emission switching instruction may be input by operating an illumination light switching switch (not shown) provided on the endoscope 12 or the user interface, or may be input by toggling the mode switching switch 12f.
- the image sensor 611 In the correction mode, in a frame in which the second mixed light ML is emitted, the image sensor 611 outputs the B1 image signal, the G1 image signal, and the R1 image signal, and the image sensor 612 outputs the B2 image signal, as in the observation mode. output.
- correction illumination light (correction illumination light) including green light G is emitted from the light source device 13 as shown in FIG. .
- the image sensor 611 which is a color image sensor, receives the reflected light from the subject reflected by the dichroic mirror 601 (see FIG. 55B).
- the B pixel B of the image sensor 611 senses the light in the wavelength band B3 of the green light G and outputs a B3 image signal.
- FIG. 55(C) receives the reflected light from the subject reflected by the dichroic mirror 601 (see FIG. 55B).
- the B pixel B of the image sensor 611 senses the light in the wavelength band B3 of the green light G and outputs a B3 image signal.
- FIG. 55(C) the B pixel B of the image sensor 611 senses the light in the wavelength band B3 of the green light G and outputs a B3 image signal.
- the G pixel G of the imaging sensor 611 senses the light in the wavelength band G3 of the green light G, thereby outputting a G3 image signal. Also, the R pixel R of the imaging sensor 611 outputs an R3 image signal by sensing light in the wavelength band of the green light G (not shown).
- FIG. 56A shows the wavelength band of light included in the correction illumination light, like FIG. 55A.
- FIGS. 55B and 56B show the reflectance (dashed line 601a) and transmittance (solid line 601b) of light incident on the dichroic mirror 601, and the wavelength and shows the relationship between 55(C) and 56(C).
- 1(C) the relationship between the sensitivity of the B pixel B, G pixel G, and R pixel R of the image sensor 611 and the wavelength of light is shown.
- the B1 image signal, the G1 image signal, the R1 image signal, the B2 image signal, the B3 image signal and the G3 image signal output from the image sensor 611 or the image sensor 612 in the correction mode are transmitted to the processor device 14 . Calculation of reliability in the fourth embodiment will be described below.
- the correction image 200 In the first embodiment, an example of displaying the correction image 200 and calculating the reliability for each pixel included in the correction specific region 201 included in the correction image 200 was shown.
- an image a white light equivalent image and a second blue light image obtained in a frame in which the second mixed light ML is emitted and the correction illumination light CL are emitted.
- the reliability is calculated for each correction area.
- the correction area corresponds to the specific correction area in the first embodiment.
- the term "correction region” refers to "a set of divided small regions" or "the small region itself (the Nth correction region, where N is a natural number equal to or greater than 1)". Used as a term.
- a white-light equivalent image is an endoscopic image generated using the B1 image signal, the G1 image signal, and the R1 image signal, which are output in the frame in which the second mixed light ML is emitted.
- the second blue light image is an endoscopic image generated using the B2 image signal output in the frame in which the second mixed light ML is emitted.
- the correction illumination light image is an endoscopic image generated using the B3 image signal, the G3 image signal, and the R3 image signal, which are output in the frame in which the correction illumination light CL is emitted.
- the white light equivalent image, the second blue light image, and the correction illumination light image are generated by the DSP 61 .
- the white light equivalent image, the second blue light image, and the correction illumination light image are transmitted to the feature quantity calculation unit 620 of the processor device 14 shown in FIG.
- the feature amount calculator 620 is preferably configured by a processor different from the central controller 50 in the processor device 14 .
- the feature amount calculator 620 is preferably configured by an FPGA (Field Programmable Gate Array).
- the feature amount calculation unit 620 calculates area feature amounts for each of the plurality of correction areas shown in FIG. 58 among the white light equivalent image, the second blue light image, and the correction illumination light image.
- the area feature amount will be described later.
- the correction area 622 is a small area divided into a plurality of areas in the white light equivalent image 621, as shown in FIG. In the example shown in FIG. 58, the correction area 622 has the horizontal length a of the white light equivalent image 621 set to a1, a2, and a3, and the vertical length b set to b1, b2, and b3, respectively. 58A), and the area where the column of a2 and the row of b2 intersect is further divided into 16 equal areas (see FIG. 58A).
- the position of the area used as the correction area 622 and the number of dividing the area used as the correction area 622 are not limited to this. For example, the correction area 622 may be divided into 9 equal parts or 25 equal parts.
- FIG. 58(B) is an enlarged view of the correction area 622 shown in FIG. 58(A). As shown in FIG. 58B, the correction area 622 is divided into 16 areas from a first correction area 622a to a sixteenth correction area 622p. In FIG. 58B, numbers from 1 to 16 indicate that the correction region 622 is divided into 16 regions from the first correction region 622a to the sixteenth correction region 622p. .
- the feature amount calculation unit 620 configures each correction area for each of the Nth correction area (first to sixteenth correction areas in the example shown in FIG. 58). A determination is made as to whether or not the pixel is a valid pixel. Determination as to whether a pixel is valid or not is performed by setting channel thresholds of lower and upper limits for each channel (B channel, G channel, R channel) of each pixel.
- a B channel lower threshold and a B channel upper threshold are provided.
- a G channel lower threshold and a G channel upper threshold are provided.
- an R channel lower threshold and an R channel upper threshold are provided.
- the feature amount calculation unit 620 determines that the pixel values of all color channels of each pixel in each correction region are equal to or greater than the channel lower limit threshold of each color. If the pixel is within the range less than the channel upper limit threshold, the pixel is determined to be a valid pixel.
- the pixel value of the B channel of each pixel constituting the white light equivalent image and the correction illumination light image is within the range of the B channel lower limit threshold value or more and the B channel upper limit threshold value
- the pixel value of the G channel is within the range of the G channel lower limit threshold or more and less than the G channel upper limit threshold
- the pixel value of the R channel is within the range of the R channel lower limit threshold or more and less than the R channel upper limit threshold
- the pixel is determined as an effective pixel.
- the pixel value of each pixel is within the range from the monochrome image channel lower limit value to less than the monochrome image channel upper limit value, the pixel is determined to be an effective pixel.
- the feature amount calculation unit 620 calculates area feature amounts for each of the correction areas from the first correction area to the sixteenth correction area.
- the area feature amount is the number of effective pixels, the sum of pixel values of effective pixels, the sum of squares of pixel values of effective pixels, the variance of pixel values of effective pixels, and the like.
- the feature amount calculation unit 620 calculates the area feature amount for each correction area of each channel of the white light equivalent image. Also, the region feature amount is calculated for each correction region of each channel of the correction illumination light image. Also, an area feature amount is calculated for each correction area of the second blue light image. The area feature amount of each correction area of each channel of each endoscopic image calculated by the feature amount calculation unit 620 is transmitted to the reliability calculation unit 220 of the tissue oxygen saturation image generation unit 80 .
- the reliability calculation unit 220 calculates the reliability for determining the degree of influence of disturbance in the correction area.
- the reliability calculation unit 220 also calculates a dye value for determining the degree of motion of the endoscope 12 .
- the degree of motion of the endoscope 12 is the degree for determining whether the endoscope 12 has been moved during the switching of the illumination light in the correction mode of the fourth embodiment (that is, the non-light emitting state NL). be. If the endoscope 12 moves in the non-light-emitting state NL, the observation target in the endoscopic image also moves, so the correction process may not be performed appropriately.
- the movement of the endoscope 12 can be determined based on the degree of movement of the endoscope 12 as described later. If the degree of movement of the endoscope 12 is large, the user can be notified not to move the endoscope 12 .
- the correction determination unit 230 of the tissue oxygen saturation image generation unit 80 determines the degree of influence of disturbance using the reliability and/or the endoscope 12 using the pigment value. Determine the degree of movement.
- the reliability calculation unit 220 has a region reliability calculation unit 630 and a dye value calculation unit 650, as shown in FIG.
- the correction determination section 230 also has a region reliability determination section 640 and a pigment value determination section 660 .
- the area reliability calculation unit 630 of the reliability calculation unit 220 calculates the white light equivalent image, the second blue light image, and the correction illumination light image generated from the image signal output in each frame.
- a region reliability is calculated using the region feature amount of the region.
- the area reliability includes the average value of pixel values in the correction area, the standard deviation of the pixel values in the correction area, the effective pixel ratio in the correction area, the reliability of the brightness in the correction area, and the correction There is reliability depending on the degree of bleeding contained in the region for correction, reliability depending on the degree of fat contained in the region for correction, and the like. Note that the region reliability is one aspect of the "reliability" in the first embodiment.
- the average value of pixel values in the correction area is calculated using the number of pixels in the correction area and the pixel values of the effective pixels in the correction area.
- the standard deviation of the pixel values in the correction area is calculated using the number of pixels in the correction area and the variance of the pixel values of the effective pixels.
- the effective pixel ratio in the correction area is calculated using the number of pixels in the correction area and the number of effective pixels.
- the average value of the G1 image signal in the correction area (that is, the pixel value in the correction area of the G channel of the white light equivalent image) is shown in FIG.
- the horizontal axis of the first reliability calculation table 221 (see FIG. 33) is applied to the first reliability calculation table 221 in which the signal value of the G1 image signal is used.
- the average value of the G1 image signal is preferably the average value of luminance values obtained by performing conversion processing using the G1 image signal.
- the reliability of the degree of bleeding included in the correction region is the average value of the B1 image signal, the average value of the G1 image signal, and the average value of the R1 image signal in each correction region of the white light equivalent image (that is, Using the average of the pixel values in each correction area of each color channel of the image corresponding to white light, the area average signal ratio ln(R1/G1) and the area average signal ratio ln(B1/G1) are calculated, and these is applied to the second reliability calculation table 222 (see FIG. 34).
- the reliability of the degree of fat contained in the correction region is determined by the average value of the G1 image signal and the average value of the R1 image signal (i.e., the G channel of the white light equivalent image) in each correction region of the white light equivalent image. and the average of pixel values in each correction region of the R channel) and the average value of the B2 image signal in each correction region of the second blue light image, the region average signal ratio ln (R1/ G1) and the area average signal ratio ln (B2/G1) are calculated, and these signal ratios are plotted on the vertical axis of the third reliability calculation table 223 (see FIG. 35) as shown in FIG. It is calculated by applying it to the third reliability calculation table 223 of ln(B2/G1).
- the region reliability calculated by the region reliability calculator 630 is transmitted to the region reliability determiner 640 of the correction determiner 230 (see FIG. 59).
- the region reliability determination unit 640 performs high-reliability correction on each correction region in the white light equivalent image, the second blue light image, and the correction illumination light image using a preset threshold value for region reliability determination. It outputs the determination result as to whether it is an area for use or an area for low-reliability correction.
- the region reliability determination threshold may be set according to the type of region reliability. For example, the first region reliability determination threshold is set for the “average pixel value in the correction region”, and the “average pixel value in the correction region” is the first region reliability determination threshold. In the above cases, the correction area is determined to be the "high-reliability correction area”. On the other hand, if the "average value of pixel values in the correction region" is less than the first region reliability determination threshold value, the correction region is determined to be a "low-reliability correction region".
- the second region reliability determination threshold is applied to the “standard deviation of pixel values in the correction region”
- the third region reliability determination threshold is applied to the “valid pixel ratio in the correction region”.
- the fifth region reliability for "reliability according to degree of fat contained in correction region”
- a determination threshold value is set for each, and a determination result is output.
- Region reliability determination section 640 uses the result of determining whether each correction region is a high-reliability correction region or a low-reliability correction region. Reliability determination is performed for the blue light image and the illumination light image for correction. In this case, among all the correction regions in the white light equivalent image, the second blue light image, and the correction illumination light image, the image Output the judgment result.
- the image determination result is output by, for example, presetting a first image determination result output threshold value.
- the number of low reliability correction regions for the white light equivalent image is 10. If the number is greater than or equal to 1, the reliability of the entire correction area is high, that is, the image determination result that the influence of disturbance is small and the correction process can be appropriately performed is output. On the other hand, if the number of low-reliability correction areas in the white light equivalent image is less than 10, the reliability of the correction areas as a whole is low. Output the judgment result.
- the calculation of the region reliability and the output of the image determination result may be performed for all of the white light equivalent image, the second blue light image, and the correction illumination light image. 2 This may be performed on the blue light image and the illumination light image for correction. This is for speeding up the calculation process.
- the image determination result output by the region reliability determination unit 640 is transmitted to the display control unit 100 .
- the display control unit 100 preferably changes the display mode on the display 15 according to the image determination result. For example, when an image determination result of "the reliability of the entire correction area is low" is output, the display control unit 100 displays a message on the display 15 indicating that the correction process can be properly performed (see FIG. 38). On the other hand, if the result of image determination is that ⁇ reliability of the entire correction area is high'' is output, a message such as ⁇ Please operate the endoscope for correction processing'' is displayed on the display 15 as a warning display. (See Figure 39). Note that such a message may be superimposed on the image corresponding to white light displayed on the display.
- the region reliability determination unit 640 may calculate the average reliability for image determination using each correction region in the white light equivalent image, the second blue light image, and the correction illumination light image.
- the average reliability for image determination is calculated, for example, by dividing the sum of the reliability of all the correction areas of the white light equivalent image by the number of correction areas.
- the region reliability determination unit 640 presets a second image determination result output threshold for the image determination average reliability, and if the image determination average reliability is equal to or higher than the second image determination result output threshold, If there is, the image determination result is output as "the reliability of the entire correction area is high".
- the display control unit 100 preferably changes the display mode on the display 15 according to the image determination result.
- each correction region in the white light equivalent image, the second blue light image, and the correction illumination light image output by the region reliability determination unit 640 is a high-reliability correction region or a low-reliability region.
- the determination result as to whether it is a correction area is transmitted to the pigment value calculation unit 650 (see FIG. 59).
- the dye value calculation unit 650 calculates the dye value of the correction region determined as the “low-reliability correction region” among the correction regions in the white light equivalent image, the second blue light image, and the correction illumination light image. It is preferable to perform an exclusion process to exclude from the calculation of .
- the pigment value calculation unit 650 preferably uses part of the white light equivalent image, the second blue light image, and the correction illumination light image as the images to be excluded. Specifically, for example, as shown in FIG. 62, in the light emission pattern in the correction mode of the fourth embodiment (see FIG.
- the white light equivalent image 652a, the second blue light image 652b, and the correction illumination light image 652c are referred to as a first image set 652d.
- the white light equivalent image 653a, the second blue light image 653b, and the correction illumination light image 653c are called a second image set 653d.
- the pigment value calculation unit 650 preferably performs exclusion processing on the images included in the first image set 652d and the images included in the second image set 653d.
- a correction area determined as a "high-reliability correction area” that is not subject to exclusion processing will be referred to as an effective area.
- a correction area determined as a "low-reliability correction area" to be excluded is called an exclusion area.
- the pigment value calculation unit 650 calculates the position of each effective region and the position of each exclusion region included in the first image set 652d in the white light equivalent image 652a, the second blue light image 652b, and the correction illumination light image 652c. Exclusion processing is performed so as to correspond between
- the exclusion regions of the white light equivalent image 652a are defined as correction regions 654d and 654h. Let the area be the valid area.
- the exclusion regions of the second blue light image 652b are defined as correction regions 655d and 655h, and of the entire correction region 655, the correction regions other than the correction regions 655d and 655h are defined as effective regions.
- the exclusion areas of the correction illumination light image 652c are defined as correction areas 656d and 656h, and the correction areas other than the correction areas 656d and 656h of the entire correction area 656 are defined as effective areas.
- the dye value calculator 650 performs exclusion processing on each image set using a preset threshold value for exclusion processing.
- the exclusion processing threshold is set as a plurality of values so that the area reliability of each correction area can be evaluated and calculated in five stages from “1" to "5". Note that it is preferable to set the threshold value for exclusion processing according to the type of region reliability.
- the dye value calculation unit 650 first calculates five levels of reliability for region determination for each correction region of the white light equivalent image, the second blue light image, and the correction illumination light image included in the image set. Next, among the corresponding correction regions of the white light equivalent image, the second blue light image, and the correction illumination light image included in the image set, the correction region having the minimum region determination reliability is selected. .
- a region reliability determination threshold value for determining a "high-reliability correction region” or a "low-reliability correction region” is applied to the correction region having the minimum region determination reliability, and " A correction area determined as a "low-reliability correction area” is set as an exclusion area.
- all the correction areas of the white light equivalent image, the second blue light image, and the correction illumination light image corresponding to the correction area determined as the "low-reliability correction area” are excluded areas. .
- the pigment value calculation unit 650 calculates pigment values from the first image set 652d and the second image set 653d. Calculation of the dye value will be specifically described below.
- the area Average signal ratio ln(R1/G1), regional average signal ratio ln(B2/G1), and regional average signal ratio ln(B3/G3) are calculated for each effective region.
- the area average signal ratio ln(R1/G1) is the average value of the R1 image signal in each effective area of the white light equivalent image 652a and the average value of the G1 image signal in each effective area (that is, the white light equivalent image and the average of the pixel values in each effective area of the G channel).
- the area average signal ratio ln(B2/G1) is the average value of the B1 image signal in each effective area of the second blue-light image 652b (that is, the average of the pixel values in each effective area of the second blue-light image).
- the average value of the G1 image signals in each effective area of the white light equivalent image 652a is the average value of the B1 image signal in each effective area of the second blue-light image 652b (that is, the average of the pixel values in each effective area of the second blue-light image).
- the area average signal ratio ln(B3/G3) is the average value of the B3 image signals in each effective area of the correction illumination light image 652c and the average value of the G3 image signals in each effective area (that is, the correction illumination light image 652c). It is calculated using the average of the pixel values in each effective region of the B channel of the optical image and the average of the pixel values in each effective region of the G channel of the optical image.
- the pigment value calculation unit 650 calculates the area average signal ratio ln(R1/G1), the area average signal ratio ln(B2/G1), and the area average signal ratio ln( B3/G3) is calculated by referring to the pigment value calculation table 86a (see FIG. 17).
- the dye value calculation table 86a includes a three-dimensional coordinate system with the signal ratio ln(R1/G1) on the X axis, the signal ratio ln(B2/G1) on the Y axis, and the signal ratio ln(B3/G3) on the Z axis. , curved surfaces CV0 to CV4 are distributed according to the density of the yellow pigment.
- the pigment value calculator 650 calculates a pigment value for each valid area of the first image set 652d. Similarly, the dye values of the second image set 653d are also calculated for each valid area.
- the pigment value calculated for each effective area of the first image set 652d and the pigment value calculated for each effective area of the second image set 653d are sent to the pigment value determination section 660 of the correction determination section 230. Also, the values of the X component, the Y component, and the Z component of the coordinates (X3, Y3, Z3) calculated for each valid area of the first image set 652d, and each valid area of the second image set 653d It is preferable to transmit the X component value, the Y component value, and the Z component value of the coordinates (X3, Y3, Z3) calculated to the pigment value determination unit 660 .
- the pigment value determination unit 660 determines the pigment value 661 calculated for each effective area of the first image set 652d, the pigment value 662 calculated for each effective area of the second image set 653d, and the , the correlation coefficient 663 is obtained.
- pigment values 661 and 662 calculated for each effective area are represented by the pigment value on the vertical axis and the number of the correction area assigned to the effective area on the horizontal axis (that is, the N-th correction area). 'N' number).
- the pigment value determination unit 660 determines that "the degree of movement of the endoscope is large” when the correlation coefficient is smaller than a preset threshold value for motion determination. On the other hand, when the correlation coefficient is larger than the motion determination threshold, it is determined that "the degree of motion of the endoscope is small". In this case, the pigment value determination unit 660 outputs the determination result of “the extent of movement of the endoscope is large” or “the extent of movement of the endoscope is small” as the motion determination result, and outputs the determination result to the display control unit 100. Send.
- the display control unit 100 preferably changes the display mode on the display 15 according to the motion determination result. For example, when the motion determination result that "the degree of motion of the endoscope is small” is output, the display control unit 100 displays a message on the display 15 indicating that the correction process can be performed properly (see FIG. 38). On the other hand, when the motion determination result "the degree of movement of the endoscope is large” is output, a message MS4 such as "please stop the endoscope for correction processing" as shown in FIG. It is displayed on the display 15 as a warning display.
- the movement of the endoscope 12 may increase during switching. In such a case, it may not be possible to appropriately perform correction processing according to the influence of the density of the specific dye. Therefore, by determining the degree of movement of the endoscope 12 and notifying the user when the degree of movement is large, the user can be urged not to move the endoscope 12 . As a result, when the degree of movement of the endoscope 12 is reduced, correction processing can be performed appropriately.
- the operation for appropriately performing the correction process can be performed by: User can be prompted.
- the dye value is calculated by using the first image set and the second image set, and the dye value for each correction area is calculated by a robust estimation method. It is preferable to perform a correction process of obtaining a value and selecting the corrected oxygen saturation calculation table 86b corresponding to the pigment value.
- Correction processing may be performed by obtaining the pigment value using the area average signal ratio in the correction area determined as the "correction area.”
- the hardware structure of a processing unit that executes various processes such as the exposure control unit 110 is various processors as described below.
- Various processors include CPU (Central Processing Unit), GPU (Graphical Processing Unit), FPGA, etc., which are general-purpose processors that run software (programs) and function as various processing units.
- Programmable Logic Devices which are processors that can be changed, and dedicated electric circuits, which are processors with circuitry specifically designed to perform various processes, are included.
- One processing unit may be composed of one of these various processors, or a combination of two or more processors of the same or different type (for example, a plurality of FPGAs, a combination of CPU and FPGA, or a combination of CPU and A combination of GPUs, etc.).
- a plurality of processing units may be configured by one processor.
- configuring a plurality of processing units in one processor first, as represented by computers such as clients and servers, one processor is configured by combining one or more CPUs and software, There is a form in which this processor functions as a plurality of processing units.
- SoC System On Chip
- the various processing units are configured using one or more of the above various processors as a hardware structure.
- the hardware structure of these various processors is, more specifically, an electric circuit in the form of a combination of circuit elements such as semiconductor elements.
- the hardware structure of the storage unit is a storage device such as an HDD (hard disc drive) or SSD (solid state drive).
- endoscope system 12 endoscope 12a insertion portion 12b operation portion 12c bending portion 12d tip portion 12e angle knob 12f mode changeover switch 12h still image acquisition instruction switch 12i zoom operation portion 12j forceps port 13 light source device 14 processor device 15 display 16 User interface 20 Light source unit 20a V-LED 20b BS-LED 20c BL-ELD 20d G-LED 20e R-LED 21 light source control unit 22 optical path coupling unit 23 light guide 30 illumination optical system 31 illumination lens 40 imaging optical system 41 objective lens 42 zoom lens 43, 511, 512, 513, 514, 611, 612 imaging sensor 44 imaging control unit 45 CDS/ AGC circuit 46 A/D converter 47 diaphragm 48 shutter 50 central control unit 60 image signal acquisition unit 61 DSP 62 noise reduction unit 63 image processing switching unit 70 normal light image generation unit 80 tissue oxygen saturation image generation unit 81 white light equivalent image generation unit 82 base image generation unit 83 signal ratio calculation unit 84 oxygen saturation image calculation unit 84a oxygen saturation degree calculation table 86b corrected oxygen saturation calculation tables
Landscapes
- Health & Medical Sciences (AREA)
- Life Sciences & Earth Sciences (AREA)
- Surgery (AREA)
- Physics & Mathematics (AREA)
- Engineering & Computer Science (AREA)
- Medical Informatics (AREA)
- Public Health (AREA)
- Biophysics (AREA)
- Biomedical Technology (AREA)
- Heart & Thoracic Surgery (AREA)
- Optics & Photonics (AREA)
- Molecular Biology (AREA)
- Veterinary Medicine (AREA)
- Animal Behavior & Ethology (AREA)
- General Health & Medical Sciences (AREA)
- Pathology (AREA)
- Nuclear Medicine, Radiotherapy & Molecular Imaging (AREA)
- Radiology & Medical Imaging (AREA)
- Spectroscopy & Molecular Physics (AREA)
- Signal Processing (AREA)
- Endoscopes (AREA)
Abstract
Description
図1に示すように、内視鏡システム10は、内視鏡12、光源装置13、プロセッサ装置14、ディスプレイ15及びユーザーインターフェース16を有する。内視鏡12は、光源装置13と光学的に接続され、且つ、プロセッサ装置14と電気的に接続される。
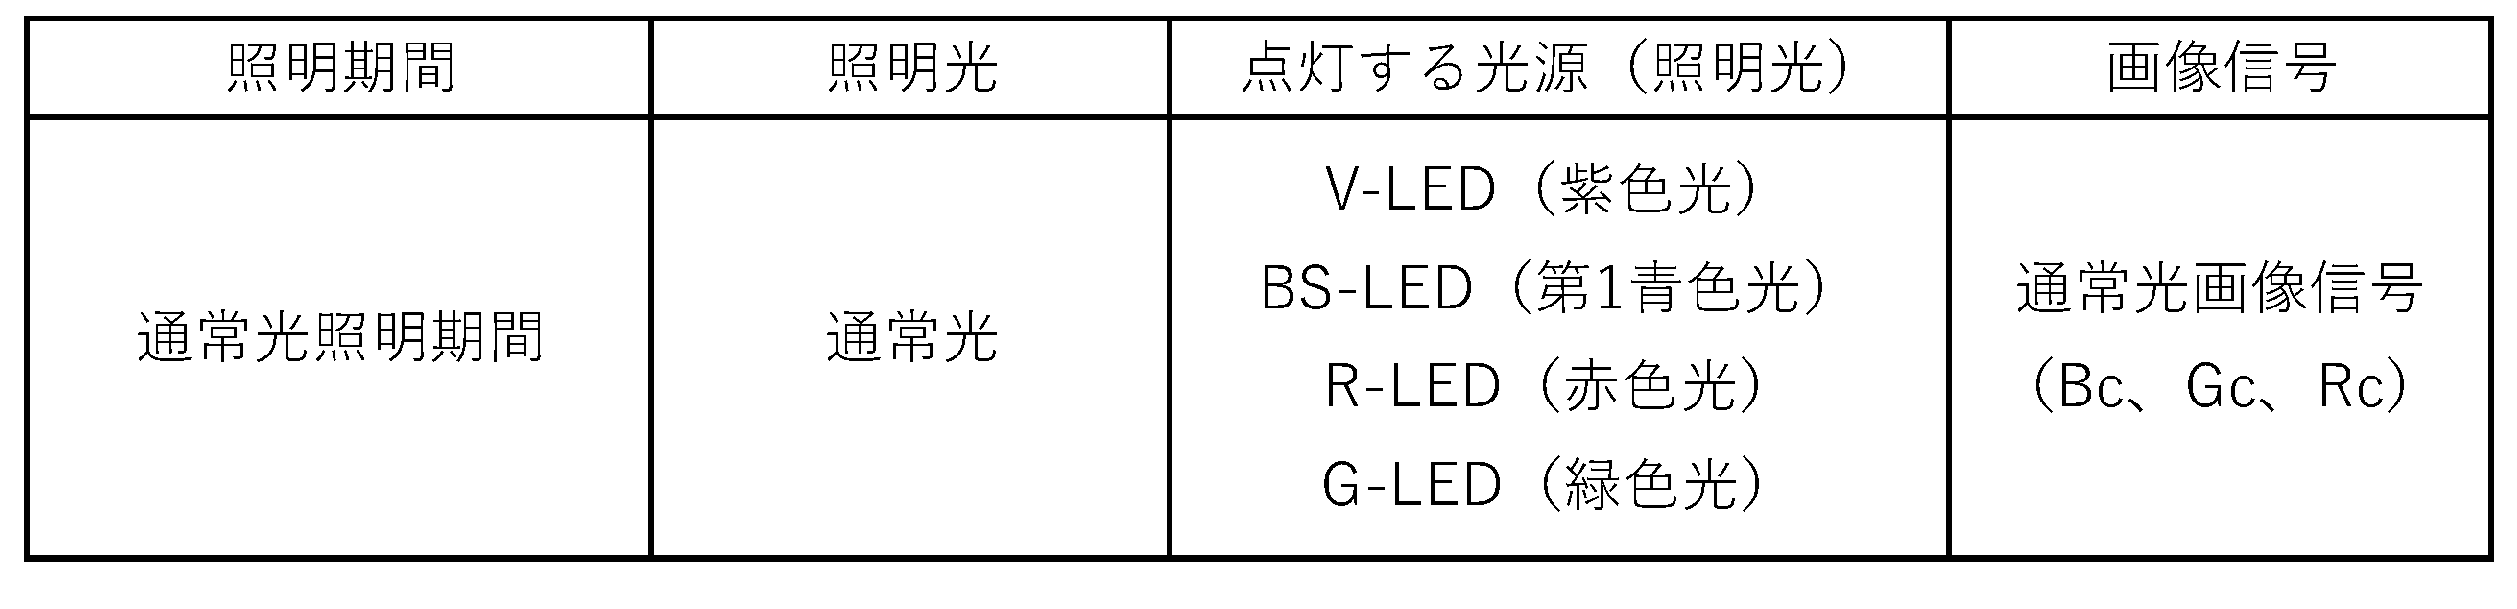


第2実施形態においては、光源部20を、第1実施形態に示す各色LED20a~20eの代わりに、白色LED、キセノンランプ、ハロゲン光源等の広帯域光を発光する広帯域光源400とし、広帯域光源400と、回転フィルタ410とを組み合わせることによって光源装置13から出射される光を、被写体を照明する照明光とする。以下、内視鏡システム10において、第1実施形態と相違する部分を説明し、共通する部分については、説明を省略する。
式A)B2/G1×cosφ-B3/G1×sinφ
第3実施形態においては、内視鏡12を、図43に示すような、挿入部12aの基端部分にカメラヘッド500を備える硬性内視鏡とする。なお、内視鏡12を腹腔鏡とする場合、挿入部12aは、被検者の腹腔内に挿入する部分である。カメラヘッド500には、撮像光学系40が備えられる。第1実施形態及び第2実施形態においては、内視鏡12の先端部に、対物レンズ41及び撮像センサ43を有する撮像光学系40が設けられているが、第3実施形態では、撮像光学系40のうち撮像センサが、先端部ではなくカメラヘッド500に備えられる。カメラヘッド500では、内視鏡12の先端部から導光された反射光が撮影される。カメラヘッド500において撮影された画像信号は、プロセッサ装置14に送信される。なお、図43では、アングルノブ12e、モード切替スイッチ12f、静止画像取得指示スイッチ12h及びズーム操作部12iは省略している。以下、内視鏡システム10において、第1実施形態及び第2実施形態と相違する部分を説明し、共通する部分については、説明を省略する。
第4実施形態においては、第3実施形態と同じく、内視鏡12を、挿入部12aの基端部分にカメラヘッドを備える硬性内視鏡とする。以下、第1実施形態、第2実施形態、第3実施形態とは異なる部分について説明し、共通する部分については省略する。第4実施形態においては、第3実施形態のカメラヘッド500に代えて、図50に示すような、カメラヘッド600を備える。
1(C)と同じく、撮像センサ611のB画素B、G画素G、R画素Rの感度と、光の波長との関係を示している。
12 内視鏡
12a 挿入部
12b 操作部
12c 湾曲部
12d 先端部
12e アングルノブ
12f モード切替スイッチ
12h 静止画取得指示スイッチ
12i ズーム操作部
12j 鉗子口
13 光源装置
14 プロセッサ装置
15 ディスプレイ
16 ユーザーインターフェース
20 光源部
20a V-LED
20b BS-LED
20c BL―ELD
20d G-LED
20e R-LED
21 光源制御部
22 光路結合部
23 ライトガイド
30 照明光学系
31 照明レンズ
40 撮像光学系
41 対物レンズ
42 ズームレンズ
43、511、512、513、514、611、612 撮像センサ
44 撮像制御部
45 CDS/AGC回路
46 A/Dコンバータ
47 絞り
48 シャッター
50 中央制御部
60 画像信号取得部
61 DSP
62 ノイズ低減部
63 画像処理切替部
70 通常光画像生成部
80 組織酸素飽和度画像生成部
81 白色光相当画像生成部
82 ベース画像生成部
83 信号比算出部
84 酸素飽和度画像算出部
84a 酸素飽和度算出用テーブル
86b 補正酸素飽和度算出用テーブル
84b、84c 等高線
84d、84e 吸光係数グラフ
85 酸素飽和度画像生成部
86 補正酸素飽和度算出部
86a 色素値算出用テーブル
86c、86d、86e、86f、86g 曲面
87 補正酸素飽和度画像生成部
100 表示制御部
111 観察用画像信号
110 露光制御部
120 露光制御信号生成部
130 制御量出力部
140 明るさ算出部
141 解析領域設定部
141a 内視鏡画像
141b、141c 内視鏡画像の領域
141d、141e、141f 解析画像の領域
142 領域明るさ算出部
150 明るさ差分算出部
151 第1解析画像
151a 第1領域
152 観察用画像信号
153 第2解析画像
153a 第2領域
154 補正用画像信号
200 補正用画像
201 補正用特定領域
201a 低信頼度領域
201b 高信頼度領域
202 枠
210 補正用画像生成部
220 信頼度算出部
221 第1信頼度算出用テーブル
222 第2信頼度算出用テーブル
223 第3信頼度算出用テーブル
230 補正判定部
400 広帯域光源
410 回転フィルタ
411 内側フィルタ
411a、412a B1フィルタ
411b、412c Gフィルタ
411c、412d Rフィルタ
412 外側フィルタ
412b B2フィルタ
412e B3フィルタ
420 フィルタ切替え部
430 2次元座標系
431a 基準線
431b 実測線
500、600 カメラヘッド
501、502、503、601 ダイクロイックミラー
620 特徴量算出部
621、652a、653a 白色光相当画像
622、654、654d、654h、655、655d、655h、656、656d、656h 補正用領域
622a 第1補正用領域
622p 第16補正用領域
630 領域信頼度算出部
640 領域信頼度判定部
650 色素値算出部
601a 反射率
601b 透過率
651a、651b、651c、651d、651e、651f フレーム
652b、653b 第2青色光画像
652c、653c 補正用照明光画像
652d 第1画像セット
653d 第2画像セット
660 色素値判定部
661、662 色素値
663 相関係数
Claims (13)
- 観察対象を照明し、前記観察対象からの反射光を撮像する内視鏡システムにおいて、
少なくとも1つ以上の光源を発光させ、観察用照明光と、前記観察用照明光と異なるスペクトルを有する補正用照明光とを、前記観察対象に出射する光源装置と、
前記反射光を撮像する撮像光学系と、
プロセッサと、を備え、
前記プロセッサは、
前記観察用照明光が出射される第1露光期間と、前記補正用照明光が出射される第2露光期間とで、互いに異なる複数種類の画像信号を取得し、
前記画像信号のうち、互いに異なる一部の前記画像信号から画像信号明るさを算出し、
前記画像信号明るさに応じて変動する制御量を出力し、
前記制御量が互いに異なる複数種類の露光制御信号を生成し、
前記露光制御信号に応じて前記光源及び前記撮像光学系を制御する内視鏡システム。 - 前記制御量は、前記画像信号明るさと、予め設定された目標明るさとの差分に基づいて出力される請求項1に記載の内視鏡システム。
- 前記プロセッサは、
前記第1露光期間に前記画像信号としての観察用画像信号を取得し、
前記第2露光期間に前記画像信号としての補正用画像信号を取得し、
前記観察用画像信号を用いて算出する前記画像信号明るさである第1画像信号明るさと、前記目標明るさである第1目標明るさとの差分に基づいて前記制御量としての第1制御量を出力し、
前記補正用画像信号を用いて算出する前記画像信号明るさである第2画像信号明るさと、前記画像信号明るさである第2目標明るさとの差分に基づいて前記第1制御量と異なる前記制御量としての第2制御量を出力し、
前記第1制御量に基づく前記露光制御信号としての第1露光制御信号を生成し、
前記第2制御量に基づく前記露光制御信号としての第2露光制御信号を生成する請求項2に記載の内視鏡システム。 - 前記第2制御量は、前記第1制御量よりも大きい請求項3に記載の内視鏡システム。
- 前記プロセッサは、
前記画像信号のうち、特定色信号を用いて前記画像信号明るさを算出する請求項3又は4に記載の内視鏡システム。 - 前記特定色信号はB信号である請求項5に記載の内視鏡システム。
- 前記プロセッサは、
前記画像信号を用いて解析画像を生成し、
前記解析画像から特定領域を抽出し、
前記特定領域における前記画像信号を用いて前記画像信号明るさを算出する請求項3又は4に記載の内視鏡システム。 - 前記特定領域は、特定形状に従って抽出される請求項7に記載の内視鏡システム。
- 前記プロセッサは、
前記観察用画像信号を用いて生成する前記解析画像である第1解析画像から、前記特定領域としての第1領域を抽出し、
前記第1領域を用いて算出する前記画像信号明るさとしての第1領域明るさと、前記第1目標明るさとの差分に基づいて前記制御量としての第1領域制御量を出力し、
前記補正用画像信号を用いて生成した前記解析画像である第2解析画像から、前記特定領域としての第2領域を抽出し、
前記第2領域を用いて算出する前記画像信号明るさとしての第2領域明るさと、前記第2目標明るさとの差分に基づいて前記制御量としての第2領域制御量を出力し、
前記第1領域制御量に基づく前記露光制御信号としての第1領域露光制御信号を生成し、
前記第2領域制御量に基づく前記露光制御信号としての第2領域露光制御信号を生成する請求項8に記載の内視鏡システム。 - 前記プロセッサは、
前記観察用画像信号を取得する観察モード、並びに、前記観察用画像信号及び前記補正用画像信号を取得する補正モードを切り替え、
前記観察モードで前記第1露光制御信号を生成し、
前記補正モードで前記第1露光制御信号及び前記第2露光制御信号を生成する請求項3に記載の内視鏡システム。 - 前記第1露光期間は、前記観察用照明光に含まれる白色相当光が出射される第1照明期間と、前記観察用照明光に含まれる算出用照明光が出射される第2照明期間とを含み、
前記第2露光期間は、前記補正用照明光を取得する第3照明期間を含み、
前記プロセッサは、
前記第1照明期間と、前記第2照明期間と、前記第3照明期間を自動的に切り替え、
前記第1照明期間に前記画像信号としての白色光相当画像信号を取得し、
前記第2照明期間に前記画像信号としての算出用画像信号を取得し、
前記第3照明期間に前記補正用画像信号を取得し、
前記白色光相当画像信号に基づいて前記露光制御信号としての第1A露光制御信号を生成し、
前記算出用画像信号に基づいて前記露光制御信号としての第1B露光制御信号を生成し、
前記補正用画像信号に基づいて前記第2露光制御信号を生成し、
前記第1A露光制御信号、前記第1B露光制御信号及び前記第2露光制御信号に応じて前記光源及び前記撮像光学系を制御する請求項3に記載の内視鏡システム。 - 前記光源の制御は、光量の制御を含み、
前記撮像光学系の制御は、絞り値の制御、露光時間長さの制御、及びゲインの制御が含まれる請求項1に記載の内視鏡システム。 - 観察対象を照明し、前記観察対象からの反射光を撮像する内視鏡システムの作動方法において、光源装置と、撮像光学系と、プロセッサと、を備え、
前記光源装置が、少なくとも1つ以上の光源を発光させ、観察用照明光と、前記観察用照明光と異なるスペクトルを有する補正用照明光とを、前記観察対象に出射するステップと、
前記撮像光学系が、前記反射光を撮像するステップと、
前記プロセッサが、
前記観察用照明光が出射される第1露光期間と、前記補正用照明光が出射される第2露光期間とで、互いに異なる複数種類の画像信号を取得するステップと、
前記画像信号のうち、互いに異なる一部の前記画像信号から画像信号明るさを算出するステップと、
前記画像信号明るさに応じて変動する制御量を出力するステップと、
前記制御量が互いに異なる複数種類の露光制御信号を生成するステップと、
前記露光制御信号に応じて前記光源及び前記撮像光学系を制御するステップと、を有する内視鏡システムの作動方法。
Priority Applications (3)
| Application Number | Priority Date | Filing Date | Title |
|---|---|---|---|
| EP22918774.5A EP4461202B1 (en) | 2022-01-05 | 2022-12-09 | Endoscope system and operation method of same |
| JP2023572393A JPWO2023132188A1 (ja) | 2022-01-05 | 2022-12-09 | |
| US18/764,326 US20240358244A1 (en) | 2022-01-05 | 2024-07-04 | Endoscope system and method of operating the same |
Applications Claiming Priority (4)
| Application Number | Priority Date | Filing Date | Title |
|---|---|---|---|
| JP2022-000464 | 2022-01-05 | ||
| JP2022000464 | 2022-01-05 | ||
| JP2022-130626 | 2022-08-18 | ||
| JP2022130626 | 2022-08-18 |
Related Child Applications (1)
| Application Number | Title | Priority Date | Filing Date |
|---|---|---|---|
| US18/764,326 Continuation US20240358244A1 (en) | 2022-01-05 | 2024-07-04 | Endoscope system and method of operating the same |
Publications (1)
| Publication Number | Publication Date |
|---|---|
| WO2023132188A1 true WO2023132188A1 (ja) | 2023-07-13 |
Family
ID=87073506
Family Applications (1)
| Application Number | Title | Priority Date | Filing Date |
|---|---|---|---|
| PCT/JP2022/045537 Ceased WO2023132188A1 (ja) | 2022-01-05 | 2022-12-09 | 内視鏡システム及びその作動方法 |
Country Status (4)
| Country | Link |
|---|---|
| US (1) | US20240358244A1 (ja) |
| EP (1) | EP4461202B1 (ja) |
| JP (1) | JPWO2023132188A1 (ja) |
| WO (1) | WO2023132188A1 (ja) |
Cited By (1)
| Publication number | Priority date | Publication date | Assignee | Title |
|---|---|---|---|---|
| WO2025070479A1 (ja) * | 2023-09-28 | 2025-04-03 | 富士フイルム株式会社 | 内視鏡システム、その作動方法、及び内視鏡システムの作動プログラム |
Citations (5)
| Publication number | Priority date | Publication date | Assignee | Title |
|---|---|---|---|---|
| JP2013188365A (ja) | 2012-03-14 | 2013-09-26 | Fujifilm Corp | 内視鏡システム、内視鏡システムのプロセッサ装置、及び内視鏡システムにおける露光量調整方法 |
| JP2015160012A (ja) * | 2014-02-27 | 2015-09-07 | 富士フイルム株式会社 | 内視鏡システム、内視鏡システム用プロセッサ装置、内視鏡システムの作動方法、内視鏡システム用プロセッサ装置の作動方法 |
| JP2016007353A (ja) * | 2014-06-24 | 2016-01-18 | 富士フイルム株式会社 | 内視鏡システム及びその作動方法 |
| JP2017018503A (ja) * | 2015-07-14 | 2017-01-26 | 富士フイルム株式会社 | 内視鏡システム及び内視鏡システムの作動方法 |
| JP6412252B2 (ja) | 2015-04-02 | 2018-10-24 | 富士フイルム株式会社 | プロセッサ装置及び内視鏡システム |
-
2022
- 2022-12-09 EP EP22918774.5A patent/EP4461202B1/en active Active
- 2022-12-09 JP JP2023572393A patent/JPWO2023132188A1/ja active Pending
- 2022-12-09 WO PCT/JP2022/045537 patent/WO2023132188A1/ja not_active Ceased
-
2024
- 2024-07-04 US US18/764,326 patent/US20240358244A1/en active Pending
Patent Citations (5)
| Publication number | Priority date | Publication date | Assignee | Title |
|---|---|---|---|---|
| JP2013188365A (ja) | 2012-03-14 | 2013-09-26 | Fujifilm Corp | 内視鏡システム、内視鏡システムのプロセッサ装置、及び内視鏡システムにおける露光量調整方法 |
| JP2015160012A (ja) * | 2014-02-27 | 2015-09-07 | 富士フイルム株式会社 | 内視鏡システム、内視鏡システム用プロセッサ装置、内視鏡システムの作動方法、内視鏡システム用プロセッサ装置の作動方法 |
| JP2016007353A (ja) * | 2014-06-24 | 2016-01-18 | 富士フイルム株式会社 | 内視鏡システム及びその作動方法 |
| JP6412252B2 (ja) | 2015-04-02 | 2018-10-24 | 富士フイルム株式会社 | プロセッサ装置及び内視鏡システム |
| JP2017018503A (ja) * | 2015-07-14 | 2017-01-26 | 富士フイルム株式会社 | 内視鏡システム及び内視鏡システムの作動方法 |
Non-Patent Citations (1)
| Title |
|---|
| See also references of EP4461202A4 |
Cited By (1)
| Publication number | Priority date | Publication date | Assignee | Title |
|---|---|---|---|---|
| WO2025070479A1 (ja) * | 2023-09-28 | 2025-04-03 | 富士フイルム株式会社 | 内視鏡システム、その作動方法、及び内視鏡システムの作動プログラム |
Also Published As
| Publication number | Publication date |
|---|---|
| EP4461202B1 (en) | 2026-04-08 |
| US20240358244A1 (en) | 2024-10-31 |
| JPWO2023132188A1 (ja) | 2023-07-13 |
| EP4461202A4 (en) | 2025-04-30 |
| EP4461202A1 (en) | 2024-11-13 |
Similar Documents
| Publication | Publication Date | Title |
|---|---|---|
| JP6785941B2 (ja) | 内視鏡システム及びその作動方法 | |
| US20240389829A1 (en) | Endoscope system | |
| JP6285383B2 (ja) | 画像処理装置、内視鏡システム、画像処理装置の作動方法、及び内視鏡システムの作動方法 | |
| JPWO2018159083A1 (ja) | 内視鏡システム、プロセッサ装置、及び、内視鏡システムの作動方法 | |
| JP6839773B2 (ja) | 内視鏡システム、内視鏡システムの作動方法及びプロセッサ | |
| JP7692961B2 (ja) | 内視鏡システム及びその作動方法 | |
| JP7702294B2 (ja) | 内視鏡システム及びその作動方法 | |
| JP6979510B2 (ja) | 内視鏡システム及びその作動方法 | |
| US20230029239A1 (en) | Medical image processing system and method for operating medical image processing system | |
| US12430820B2 (en) | Image processing apparatus | |
| JP7610342B2 (ja) | 内視鏡システム | |
| JPWO2020039932A1 (ja) | 内視鏡システム | |
| JP7835746B2 (ja) | 内視鏡システム及びその作動方法 | |
| WO2023132188A1 (ja) | 内視鏡システム及びその作動方法 | |
| WO2023119795A1 (ja) | 内視鏡システム及びその作動方法 | |
| EP4223203A1 (en) | Image processing device, endoscope system, method for operating image processing device, and program for image processing device | |
| US20240358245A1 (en) | Processor device, method for operating the same, and endoscope system | |
| JP2024052487A (ja) | プロセッサ装置及び内視鏡システム並びにその作動方法 | |
| JP7196196B2 (ja) | 内視鏡システム | |
| JPWO2018079217A1 (ja) | 内視鏡システム及びその作動方法 | |
| US20240335092A1 (en) | Endoscope system and method for operating the same | |
| US20250176876A1 (en) | Endoscope system and method for operating the same | |
| JP2025058760A (ja) | 内視鏡システム、画像処理装置、内視鏡システムの作動方法、及び内視鏡システム用プログラム | |
| JP6999597B2 (ja) | プロセッサ装置及びその作動方法並びに内視鏡システム | |
| WO2025070479A1 (ja) | 内視鏡システム、その作動方法、及び内視鏡システムの作動プログラム |
Legal Events
| Date | Code | Title | Description |
|---|---|---|---|
| 121 | Ep: the epo has been informed by wipo that ep was designated in this application |
Ref document number: 22918774 Country of ref document: EP Kind code of ref document: A1 |
|
| WWE | Wipo information: entry into national phase |
Ref document number: 2023572393 Country of ref document: JP |
|
| WWE | Wipo information: entry into national phase |
Ref document number: 2022918774 Country of ref document: EP |
|
| NENP | Non-entry into the national phase |
Ref country code: DE |
|
| ENP | Entry into the national phase |
Ref document number: 2022918774 Country of ref document: EP Effective date: 20240805 |
|
| WWG | Wipo information: grant in national office |
Ref document number: 2022918774 Country of ref document: EP |