WO2024150464A1 - 溶融物高さの検出方法、溶融物高さの検出装置および溶融物の製造方法 - Google Patents
溶融物高さの検出方法、溶融物高さの検出装置および溶融物の製造方法 Download PDFInfo
- Publication number
- WO2024150464A1 WO2024150464A1 PCT/JP2023/032420 JP2023032420W WO2024150464A1 WO 2024150464 A1 WO2024150464 A1 WO 2024150464A1 JP 2023032420 W JP2023032420 W JP 2023032420W WO 2024150464 A1 WO2024150464 A1 WO 2024150464A1
- Authority
- WO
- WIPO (PCT)
- Prior art keywords
- vibration
- molten material
- height
- frequency
- furnace
- Prior art date
- Legal status (The legal status is an assumption and is not a legal conclusion. Google has not performed a legal analysis and makes no representation as to the accuracy of the status listed.)
- Ceased
Links
Images




Classifications
-
- G—PHYSICS
- G01—MEASURING; TESTING
- G01F—MEASURING VOLUME, VOLUME FLOW, MASS FLOW OR LIQUID LEVEL; METERING BY VOLUME
- G01F23/00—Indicating or measuring liquid level or level of fluent solid material, e.g. indicating in terms of volume or indicating by means of an alarm
- G01F23/22—Indicating or measuring liquid level or level of fluent solid material, e.g. indicating in terms of volume or indicating by means of an alarm by measuring physical variables, other than linear dimensions, pressure or weight, dependent on the level to be measured, e.g. by difference of heat transfer of steam or water
- G01F23/28—Indicating or measuring liquid level or level of fluent solid material, e.g. indicating in terms of volume or indicating by means of an alarm by measuring physical variables, other than linear dimensions, pressure or weight, dependent on the level to be measured, e.g. by difference of heat transfer of steam or water by measuring the variations of parameters of electromagnetic or acoustic waves applied directly to the liquid or fluent solid material
- G01F23/296—Acoustic waves
- G01F23/2965—Measuring attenuation of transmitted waves
-
- F—MECHANICAL ENGINEERING; LIGHTING; HEATING; WEAPONS; BLASTING
- F27—FURNACES; KILNS; OVENS; RETORTS
- F27D—DETAILS OR ACCESSORIES OF FURNACES, KILNS, OVENS OR RETORTS, IN SO FAR AS THEY ARE OF KINDS OCCURRING IN MORE THAN ONE KIND OF FURNACE
- F27D21/00—Arrangement of monitoring devices; Arrangement of safety devices
-
- C—CHEMISTRY; METALLURGY
- C21—METALLURGY OF IRON
- C21B—MANUFACTURE OF IRON OR STEEL
- C21B5/00—Making pig-iron in the blast furnace
- C21B5/006—Automatically controlling the process
-
- C—CHEMISTRY; METALLURGY
- C21—METALLURGY OF IRON
- C21B—MANUFACTURE OF IRON OR STEEL
- C21B7/00—Blast furnaces
- C21B7/24—Test rods or other checking devices
-
- C—CHEMISTRY; METALLURGY
- C21—METALLURGY OF IRON
- C21C—PROCESSING OF PIG-IRON, e.g. REFINING, MANUFACTURE OF WROUGHT-IRON OR STEEL; TREATMENT IN MOLTEN STATE OF FERROUS ALLOYS
- C21C5/00—Manufacture of carbon-steel, e.g. plain mild steel, medium carbon steel or cast steel or stainless steel
- C21C5/28—Manufacture of steel in the converter
- C21C5/42—Constructional features of converters
- C21C5/46—Details or accessories
- C21C5/4673—Measuring and sampling devices
-
- F—MECHANICAL ENGINEERING; LIGHTING; HEATING; WEAPONS; BLASTING
- F27—FURNACES; KILNS; OVENS; RETORTS
- F27B—FURNACES, KILNS, OVENS OR RETORTS IN GENERAL; OPEN SINTERING OR LIKE APPARATUS
- F27B1/00—Shaft or like vertical or substantially vertical furnaces
- F27B1/10—Details, accessories or equipment specially adapted for furnaces of these types
- F27B1/28—Arrangements of monitoring devices, of indicators, of alarm devices
-
- F—MECHANICAL ENGINEERING; LIGHTING; HEATING; WEAPONS; BLASTING
- F27—FURNACES; KILNS; OVENS; RETORTS
- F27D—DETAILS OR ACCESSORIES OF FURNACES, KILNS, OVENS OR RETORTS, IN SO FAR AS THEY ARE OF KINDS OCCURRING IN MORE THAN ONE KIND OF FURNACE
- F27D21/00—Arrangement of monitoring devices; Arrangement of safety devices
- F27D21/0028—Devices for monitoring the level of the melt
-
- G—PHYSICS
- G01—MEASURING; TESTING
- G01F—MEASURING VOLUME, VOLUME FLOW, MASS FLOW OR LIQUID LEVEL; METERING BY VOLUME
- G01F25/00—Testing or calibration of apparatus for measuring volume, volume flow or liquid level or for metering by volume
- G01F25/20—Testing or calibration of apparatus for measuring volume, volume flow or liquid level or for metering by volume of apparatus for measuring liquid level
-
- C—CHEMISTRY; METALLURGY
- C21—METALLURGY OF IRON
- C21C—PROCESSING OF PIG-IRON, e.g. REFINING, MANUFACTURE OF WROUGHT-IRON OR STEEL; TREATMENT IN MOLTEN STATE OF FERROUS ALLOYS
- C21C5/00—Manufacture of carbon-steel, e.g. plain mild steel, medium carbon steel or cast steel or stainless steel
- C21C5/52—Manufacture of steel in electric furnaces
- C21C2005/5288—Measuring or sampling devices
Definitions
- the present invention relates to a molten material height detection method, a molten material height detection device, and a molten material manufacturing method that detects the molten material height inside a blast furnace, where the inside of the furnace cannot be directly observed, from the vibrations of the blast furnace.
- a blast furnace is a facility that uses high-temperature gas to heat and react the iron ore, the raw material for iron, and the coke, the fuel, to produce pig iron.
- the molten pig iron and slag produced in the blast furnace accumulate as a liquid pool at the bottom, and are discharged outside the furnace approximately once every three hours to be supplied to the next process.
- Patent Document 1 discloses a technology that takes two or more images of the molten material discharge flow from a blast furnace to determine the discharge speed, and calculates the molten material height by substituting the discharge speed into an energy balance equation.
- Patent Document 2 discloses a technology that inputs elastic waves into a blast furnace and measures the molten material height from the wave height of the reflected echo.
- Patent Document 3 discloses a technology that measures the vibration intensity of the furnace wall at the bottom of the blast furnace, analyzes the frequency of the vibration intensity to calculate the vibration intensity of a frequency band that is correlated with fluctuations in the molten metal and slag height, and calculates the molten metal and slag height in the blast furnace using the intensity of the calculated frequency band.
- JP 2017-160498 A Japanese Patent Application Publication No. 10-185654 International Publication No. 2022/201717
- Patent Document 1 utilizes the positive correlation between the discharge speed of the molten material and the height of the molten material, so there is an issue that when the discharge speed of the molten material decreases due to clogging of the discharge hole, it is not possible to detect the rise in the liquid level.
- visibility around the discharge hole is poor due to dust in the factory, and the molten material may violently eject from the discharge hole. In such cases, there is an issue that the discharge flow surface cannot be accurately photographed, and the liquid level height of the molten material cannot be calculated.
- Patent Document 2 In the technology of Patent Document 2, it is predicted that there are many factors that affect the reflection characteristics of elastic waves, such as crack propagation in the furnace wall bricks that make up the blast furnace and solidification of the molten material inside the furnace, and it may not be possible to accurately measure the molten material height. In the technology of Patent Document 3, since the molten metal and slag height in an actual blast furnace is unknown, it is difficult to identify a frequency band that is correlated with fluctuations in the molten metal and slag height.
- the present invention has been made in consideration of these circumstances, and its purpose is to provide a molten material height detection method and molten material height detection device that can easily identify a frequency at which the molten material height in a blast furnace can be detected, and that can detect the molten material height using the vibration intensity of that frequency.
- a molten material height detection method for detecting a molten material height in a blast furnace comprising: measuring vibrations at one or more positions on a furnace wall in a lower part of the blast furnace; analyzing the frequency of the vibrations to calculate a vibration intensity of a frequency correlated with vibrations generated by introducing gas into an inlet in the lower part of the furnace; and detecting the molten material height using a corrected vibration intensity that removes the influence of the amount of gas introduced from the inlet from the vibration intensity of the frequency.
- [2] The method for detecting the height of a molten material described in [1], in which a frequency correlated with the vibration generated by introducing gas into the inlet is identified by confirming the correlation between the vibration intensity of a frequency band having a predetermined width and the volume of the gas blown.
- [3] The method for detecting a molten material height according to [1] or [2], wherein when the time progression of the corrected vibration intensity becomes a maximum or minimum, it is detected that the molten material height in the blast furnace is the position where the vibration is being measured.
- [4] The method for detecting a molten material height according to any one of [1] to [3], wherein the vibration is measured at two or more different positions in the height direction of the furnace wall in the lower part of the furnace.
- [5] The method for detecting a smelt height according to [1] or [2], in which a correspondence relationship between the corrected vibration intensity and the smelt height is determined in advance, and the smelt height in a blast furnace is detected using the corrected vibration intensity obtained from the vibration measurement and the correspondence relationship.
- [6] A method for detecting a molten material height according to [5], in which the vibration is measured at a position of 0.90 or more and 1.00 or less in the height direction of the furnace wall in the lower part of the furnace, where the upper end position of the discharge hole is 0 and the lower end position of the inlet is 1.
- a molten material height detection device for detecting a molten material height in a blast furnace, comprising: one or more vibration meters provided on a furnace wall in a lower part of the blast furnace for measuring vibration of the furnace wall; and a calculation device for performing frequency analysis of the vibrations measured by the vibration meters to calculate vibration intensity of a frequency correlated with vibration generated by introducing gas into an inlet in the lower part of the furnace, and detecting the molten material height using a corrected vibration intensity obtained by removing the influence of the amount of gas introduced from the inlet from the vibration intensity.
- the molten material height detection device further comprising two or more vibration meters, the two or more vibration meters being provided at two or more different positions in the height direction of the furnace wall in the lower part of the furnace.
- the melt height detection device wherein the calculation device detects the melt height using a correspondence relationship between the corrected vibration intensity and the melt height.
- the molten material height detection device described in [9] wherein, in the height direction of the furnace wall at the lower part of the furnace, when the upper end position of the discharge hole is 0 and the lower end position of the inlet is 1, the vibration meter is provided at a position of 0.90 or more and 1.00 or less.
- a method for producing a molten material using a blast furnace comprising: measuring vibrations at one or more positions on a furnace wall in a lower part of the blast furnace; analyzing the frequency of the vibrations to calculate a vibration intensity of a frequency correlated with vibrations generated by introducing a gas into an inlet in the lower part of the furnace; detecting a molten material height in the blast furnace using a corrected vibration intensity obtained by removing the influence of the amount of gas introduced from the inlet from the vibration intensity of the frequency; and adjusting production conditions for the molten material so that the detected molten material height is within a range of a target molten material height.
- the frequency of vibration intensity at which the height of the molten material in a blast furnace can be detected is determined by identifying a frequency that is correlated with the vibrations generated by introducing gas into the inlet of the blast furnace, so that the frequency of vibration intensity at which the height of the molten material in a blast furnace can be detected can be easily identified. Then, by using a corrected vibration intensity that removes the influence of the volume of gas introduced from the inlet from the vibration intensity of the identified frequency, the height of the molten material in a blast furnace, whose interior cannot be directly observed with the naked eye, can be detected with high accuracy.
- FIG. 1 is a schematic partial cross-sectional view of a lower part of a blast furnace 10.
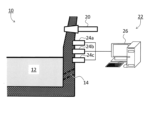
- FIG. 2 is a schematic partial cross-sectional view showing a lower part of the blast furnace 10 and a molten material height detection device 22 according to the first embodiment.
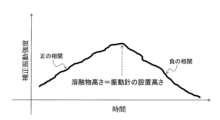
- FIG. 3 is a graph showing the change in corrected vibration strength over time.
- FIG. 4 is a flow diagram illustrating a method for identifying a frequency correlated with vibrations caused by introducing a gas.
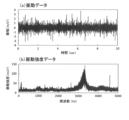
- FIG. 5 is a graph showing vibration data and vibration intensity data obtained by FTT processing of the vibration data.
- FIG. 6 is a schematic partial cross-sectional view showing a lower part of a blast furnace 10 and a molten material height detection device 30 according to a second embodiment.
- FIG. 1 is a schematic partial cross-sectional view of a lower part of a blast furnace 10.
- FIG. 2 is a schematic partial cross-sectional view showing a lower part of the blast furnace 10 and a molten material height detection device 22 according to the
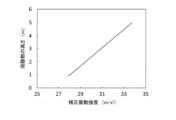
- FIG. 7 is a graph showing the relationship between corrected vibration strength and melt height.
- FIG. 8 is a schematic diagram showing the configuration of the vibrometer of the first embodiment and its peripheral devices.
- FIG. 9 is a contour diagram showing the coefficient of determination (R 2 ) between the vibration intensity and the airflow volume calculated from the measurements of the vibration meters 24a and 24b.
- FIG. 10 is a graph showing the relationship between the vibration intensity of the vibration meters 24a to 24c and the airflow rate.
- FIG. 11 is a graph showing the time transition of the molten height and the time transition of the corrected vibration intensity obtained from the operational data.
- FIG. 12 is a graph showing a regression equation between corrected vibration intensity and melt height.
- FIG. 13 is a graph showing the relationship between the detected value of the molten material height calculated from the corrected vibration intensity and the actual value of the molten material height obtained from operational data.
- FIG. 1 is a partial cross-sectional schematic diagram of a lower part of a blast furnace 10.
- Molten pig iron and slag (hereinafter, the molten pig iron and slag will be referred to as "molten material 12") are accumulated in the lower part of the blast furnace 10.
- the molten material 12 is discharged from a discharge hole 14, and a molten material flow 16 is generated.
- a blast tuyere 20 for introducing a gas 18 is provided in the lower part of the blast furnace 10.
- the blast tuyere 20 is an example of an inlet for introducing the gas 18 into the furnace.
- FIG. 2 is a partial cross-sectional schematic diagram showing the lower part of the blast furnace 10 and the molten material height detection device 22 according to the first embodiment.
- the molten material height detection device 22 has, for example, three vibration meters 24a-24c and a calculation device 26.
- the three vibration meters 24a-24c are provided on the furnace wall between the discharge hole 14 and the blower tuyere 20 so as to be equally spaced in the height direction, and measure the vibration of the furnace wall to generate vibration data.
- the vibration meters 24a-24c are, for example, piezoelectric elements.
- the vibration data generated by the vibration meters 24a to 24c is output to and recorded by the calculation device 26.
- the calculation device 26 is a general-purpose computer such as a personal computer having a calculation unit such as a CPU and a storage unit such as a memory.
- the calculation device 26 performs frequency analysis on the vibration data acquired from the vibration meters 24a to 24c, and calculates the vibration intensity of a frequency that is correlated with the vibration generated by introducing gas from the blower tuyere 20.
- the calculation device 26 corrects the vibration strength to a corrected vibration strength using the following formula (1) to remove the effect of the airflow volume from the calculated vibration strength. By correcting the vibration strength to a corrected vibration strength in this way, it is possible to remove the effect of fluctuations in the airflow volume on the vibration strength.
- G 0 G+(BV 0 -BV) ⁇ a...(1)
- G 0 is the corrected vibration strength (m/s 2 )
- G is the vibration strength before correction (m/s 2 )
- BV 0 is a reference arbitrary air flow rate (Nm 3 /min)
- BV is the airflow (Nm 3 /min) at the time when the vibration data from which G is calculated was measured
- a is the vibration intensity of a frequency correlated with the vibration caused by airflow on the y-axis.
- the x-axis is the airflow rate
- the x-axis is the slope of the regression line.
- Figure 3 is a graph showing the time progression of corrected vibration intensity.
- the horizontal axis is time and the vertical axis is corrected vibration intensity.
- the corrected vibration intensity has a positive correlation with the height of the molten material 12 when the height of the molten material 12 is lower than the installation height of the vibration meter.
- the corrected vibration intensity has a negative correlation with the height of the molten material 12 when the height of the molten material 12 is higher than the installation height of the vibration meter.
- the time progression of the corrected vibration intensity shown in Figure 3 is the corrected vibration intensity calculated from the vibration data generated by the vibration meter 24b, the height of the molten material 12 at the time when the corrected vibration intensity changes from a positive correlation to a negative correlation and reaches its maximum becomes the installation height of the vibration meter 24b.
- the change in the corrected vibration intensity from positive correlation to negative correlation is the result of the vibration meter capturing the phenomenon of the liquid level of the molten material rising.
- the corrected vibration intensity also changes from positive correlation to negative correlation. In this case, too, the height of the molten material 12 at the time when the corrected vibration intensity changes from positive correlation to negative correlation and reaches its maximum becomes the installation height of the vibration meter.
- the calculation device 26 monitors the time progression of the corrected vibration intensity obtained from the vibration data generated by the vibration meters 24a to 24c, and identifies a vibrometer for which the corrected vibration intensity has changed from positive correlation to negative correlation. When the calculation device 26 identifies a vibrometer, it detects the height of the molten material 12 by assuming that the installation height of the identified vibrometer is the height of the molten material 12.
- the calculation device 26 detects the height of the molten material 12 by assuming that the height is between the installation heights of those vibrometers. In this way, the calculation device 26 detects the height of the molten material 12 in the blast furnace 10 from the vibration data generated by the vibration meters 24a to 24c.
- the molten material height detection device 22 has three vibration meters 24a to 24c, but is not limited to this.
- the molten material height detection device 22 only needs to have at least one vibration meter, and the height of the molten material 12 can be detected if there is a change from positive correlation to negative correlation in the corrected vibration intensity obtained from the vibration data generated by this vibration meter.
- the molten material height detection device 22 has two or more vibration meters installed at different positions in the height direction of the lower part of the blast furnace 10. This makes it possible to expand the detection range of the height of the molten material 12 in the lower part of the blast furnace 10 in the height direction.
- FIG. 4 is a flow diagram explaining a method for identifying a frequency correlated with vibrations caused by introducing gas.
- This frequency identification is preferably performed using a vibration meter 24a installed in a position closest to the blast tuyere 20, and is preferably performed during a period when the operation of the blast furnace 10 is stable.
- a period when the operation of the blast furnace 10 is stable means a period when the coke ratio in the blast furnace operation is within a target range and the fluctuation in the air permeability inside the blast furnace is low.
- the vibration meter 24a measures the vibration of the lower part of the blast furnace 10 to generate vibration data (step S101).
- FFT processing (step S102) is performed on the vibration data to perform frequency analysis of the vibration data. Note that overlap processing, smoothing processing, and window function processing may be performed on the vibration data before FFT processing as necessary.
- Figure 5 is a graph showing vibration data and vibration intensity data obtained by FFT processing of the vibration data.
- Figure 5(a) shows the vibration data
- Figure 5(b) shows the vibration intensity data.
- the vibration data shown in Figure 5(a) is converted into the vibration intensity data shown in Figure 5(b) by FFT processing. It is preferable to use this vibration intensity data to calculate the vibration intensity at all frequencies.
- the vibration intensity may be the vibration intensity in a frequency band having a specified width around the target frequency. For example, if the specified width is ⁇ 100 Hz, the vibration intensity at a frequency of 1100 Hz will be the arithmetic mean of the vibration intensity of each frequency between 1000 and 1200 Hz.
- the interval between frequencies in the frequency band is set arbitrarily by FFT processing of the vibration data. For example, if the sampling frequency of the vibrometer is 10,000 Hz and the recording length is 10 sec, the frequency interval will be 3.3 Hz.
- step S103 If the vibration intensity data is not obtained multiple times under conditions with different airflow rates (step S103: No), the airflow rate is changed (step S104), and the processes of steps S101 and S102 are repeated again. On the other hand, if the vibration intensity data is obtained multiple times under conditions with different airflow rates (step S103: Yes), the coefficient of determination ( R2 ) between the airflow rate and the vibration intensity at all frequencies is calculated (step S105).
- the frequency with the largest coefficient of determination is identified as the frequency correlated with the vibration caused by the introduction of gas (step S106). In this way, the frequency correlated with the vibration caused by the introduction of gas is identified in advance.
- the frequency correlated with the vibration generated by introducing the gas may be identified using multiple vibration meters.
- the coefficient of determination ( R2 ) between the airflow rate and the vibration intensity at all frequencies is calculated for these vibration meters, and the coefficients of determination of the vibration meters 24a and 24b are averaged to identify the frequency at which this average value is largest.
- the coefficient of determination (R 2 ) when determining the coefficient of determination between the airflow rate and the vibration intensity, it is preferable to calculate the coefficient of determination (R 2 ) by considering a predetermined frequency width for each frequency.
- the coefficient of determination may be calculated by considering a frequency width of ⁇ 25 Hz to ⁇ 300 Hz for each frequency.
- the coefficient of determination (R 2 ) at each frequency and each frequency width corresponding to the frequency is confirmed, and the frequency at which the average value of these coefficients of determination is the largest is identified as the frequency correlated with the vibration generated by introducing gas.
- the difference between the coefficients of determination at each frequency becomes large, and it becomes easier to identify the frequency with a large coefficient of determination.
- the height of the molten material 12 is detected using the vibration intensity of a frequency that is correlated with the vibration generated by introducing gas from the air blower tuyeres 20.
- the frequency that is correlated with the vibration generated by introducing gas into the inlet of the blast furnace can be easily identified by acquiring vibration data with different air blow rates, so that the frequency of the vibration intensity at which the molten material height in the blast furnace can be detected can be easily identified.
- the molten material height in a blast furnace whose interior cannot be directly observed with the naked eye, can be detected with high accuracy using a corrected vibration intensity that removes the influence of the air blow rate of the gas introduced from the inlet from the vibration intensity of the identified frequency.
- the molten material production conditions can be adjusted to reduce the amount of raw material charged or to increase the amount of molten material discharged. Furthermore, if the molten material height is likely to be lower than the target range, the molten material production conditions can be adjusted to increase the amount of raw material charged or to reduce the amount of molten material discharged.
- a second embodiment of the present invention will be described using an example of detecting the height of molten material 12 accumulated in the hearth of a blast furnace 10, which is an example of a blast furnace, in the same manner as in the first embodiment.
- Fig. 6 is a partial cross-sectional schematic diagram showing a lower part of the blast furnace 10 and a molten material height detection device 30 according to the second embodiment.
- the molten material height detection device 30 has one vibration meter 32 and a calculation device 34.
- the same components as those in Fig. 2 are given the same reference numbers, and their description will be omitted.
- the vibration meter 32 measures the vibration of the furnace wall at the bottom of the furnace and creates vibration data.
- the vibration meter 32 is, for example, a piezoelectric element.
- the vibration data generated by the vibration meter 32 is output to and recorded by the calculation device 34.
- the calculation device 34 is also a general-purpose computer such as a personal computer having a calculation unit such as a CPU and a storage unit such as a memory.
- the calculation device 34 performs frequency analysis on the vibration data obtained from the vibration meter 32, and calculates the vibration intensity of a frequency that is correlated with the vibration generated by introducing gas from the blower tuyere 20. In order to remove the influence of the blowing volume from the calculated vibration intensity, the calculation device 34 corrects the vibration intensity to a corrected vibration intensity using the above formula (1).
- Fig. 7 is a graph showing the relationship between the corrected vibration intensity and the height of the melt.
- the horizontal axis is the corrected vibration intensity (m/ s2 )
- the vertical axis is the height of the melt (m).
- a regression equation showing the correspondence between the corrected vibration intensity and the height of the melt 12 as shown in Fig. 7 is calculated and stored in advance in the computing device 34. It is preferable to create the regression equation showing the correspondence between the corrected vibration intensity and the height of the melt 12 using operation data from as long a period as possible.
- the calculation device 34 After calculating the corrected vibration intensity, the calculation device 34 reads out the regression equation showing the correspondence between the corrected vibration intensity and the height of the molten material shown in FIG. 7, and detects the height of the molten material 12 using the regression equation and the calculated corrected vibration intensity. In this way, the molten material height detection device 30 according to the second embodiment detects the height of the molten material 12 in the blast furnace 10.
- the vibration meter 32 is preferably installed at a position close to the blast tuyere 20. This makes it easier for the vibration meter 32 to detect vibrations caused by the blast.
- the vibration meter 32 In the height direction of the furnace wall at the lower part of the blast furnace 10, if the upper end position of the discharge hole 14 is 0 and the lower end position of the blast tuyere 20 is 1, the vibration meter 32 is preferably installed at a position between 0.90 and 1.00, more preferably between 0.95 and 1.00, and even more preferably at 1.00. It is not preferable to install the vibration meter 32 at a position higher than the lower end position of the blast tuyere 20, because the vibrations measured by the vibration meter 32 will be affected by the vibrations caused by the descent of the raw materials inside the blast furnace.
- the height of the molten material 12 is detected using the vibration intensity of a frequency correlated with the vibration generated by introducing gas from the blower tuyere 20.
- the frequency correlated with the vibration generated by introducing gas into the inlet of the blast furnace can be easily identified by acquiring vibration data with different blower volumes, so that the frequency of the vibration intensity at which the molten material height in the blast furnace can be detected can be easily identified.
- the molten material height in a blast furnace, where the inside of the furnace cannot be directly observed can be detected with high accuracy.
- Example 1 Next, in order to confirm the validity of the present invention, Example 1 will be described, in which the height of molten material accumulated in the lower part of a large blast furnace with a capacity of 5000 m3 was detected.
- an apparatus having the same configuration as the molten material height detection apparatus 22 shown in Fig. 2 was used.
- the vibration meters 24a to 24c were installed at equal intervals between the blast tuyere 20 and the discharge hole 14 provided in the lower part of the blast furnace 10.
- the installation heights of the vibration meters 24a to 24c from the hearth bottom, and the heights of the blast tuyere and the discharge hole are shown in Table 1 below.
- FIG. 8 is a schematic diagram showing the configuration of the vibration meter and its peripheral devices in Example 1.
- Amplifiers 40a to 40c for amplifying vibration data were connected to the vibration meters 24a to 24c.
- the vibration data amplified by the amplifiers 40a to 40c was stored in data loggers 42a to 42c.
- the vibration data stored in the data loggers 42a to 42c was processed using the computing device 26.
- the conditions for measuring vibration were a sampling frequency of 10,000 Hz and a recording length of 10 sec, assuming the vibration frequency caused by the air blowing measured in a blast furnace. Under these conditions, the vibration of the furnace wall was measured every three minutes for four days, and vibration data for that period was obtained.
- the vibration data prior to FFT analysis, was subjected to overlap processing, smoothing processing, and window function processing.
- overlap processing the raw vibration data was divided into 3/10 of the recording length, and processed so that half of the data overlapped.
- a Gaussian filter was used to smooth each divided frame.
- a Hanning window was also applied in window function processing. After processing the divided frames in this manner, an FFT analysis was performed and the average value of vibration intensity calculated by FFT analysis of all divided frames was used.
- the vibration intensity of all frequencies was calculated. At this time, the frequency interval was 3.3 Hz.
- vibrations with frequencies of 5000 Hz or less were measured by the vibration meters 24a to 24c.
- the frequency of the vibration was considered as being divided into a reference vibration frequency f (Hz) and a frequency width ⁇ f (Hz).
- the average value of the vibration intensity of each frequency included in the frequency band f ⁇ f was taken as the vibration intensity of the reference vibration frequency f (Hz) taking into account the frequency width ⁇ f (Hz), and f was changed from 300 Hz to 4700 Hz in 50 Hz increments, and ⁇ f was changed from 25 Hz to 300 Hz in 25 Hz increments.
- the vibration strength at each frequency was calculated, and then the coefficient of determination ( R2 ) between the vibration strength and the air flow rate was calculated.
- the coefficient of determination (R2) was calculated using the vibration data of the vibration meters 24a and 24b measured on the day when the height of the molten material was the lowest during the four - day measurement period.
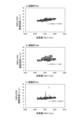
- Fig. 9 is a contour diagram showing the coefficient of determination ( R2 ) between the vibration intensity and the airflow rate calculated from the measured values of the vibration meters 24a and 24b.
- Fig. 9(a) is a contour diagram of the vibration meter 24a
- Fig. 9(b) is a contour diagram of the vibration meter 24b.
- the vibration intensity was corrected for the airflow volume.
- the correction was carried out by using the vibration intensity and airflow volume for two days out of the four days for which vibration data was measured, when the amount of molten material accumulated in the lower part of the furnace was small, to obtain the regression line to be used in the above formula (1).
- Fig. 10 is a graph showing the relationship between the vibration intensity of the vibration meters 24a to 24c and the airflow rate.
- Fig. 10(a) shows the graph of the vibration meter 24a and the regression line
- Fig. 10(b) shows the graph of the vibration meter 24b and the regression line
- Fig. 10(c) shows the graph of the vibration meter 24c and the regression line.
- the horizontal axis of these graphs is the airflow rate (Nm 3 /min)
- the vertical axis is the vibration intensity (m/s 2 ).
- G 0 G + (BV - BV 0 ) x 2.00 x 10 -3 ... (2)
- G 0 G + (BV - BV 0 ) x 1.72 x 10 -3 ... (3)
- G 0 G + (BV - BV 0 ) x 1.04 x 10 -3 ... (4)
- the corrected vibration intensity was calculated by removing the effects of the air flow rate using the above formulas (2) to (4).
- the calculated corrected vibration intensity was used to detect the molten material height.
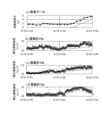
- Fig. 11 is a graph showing the time progression of the molten height and the time progression of the corrected vibration intensity obtained from the operational data.
- Fig. 11(a) is a graph showing the time progression of the molten height obtained from the operational data, with the horizontal axis representing time and the vertical axis representing the molten height (m).
- Fig. 11(b) to (d) are graphs showing the time progression of the corrected vibration intensity of the vibration meters 24a to 24c, with the horizontal axis representing time and the vertical axis representing the corrected vibration intensity (m/ s2 ).
- the corrected vibration intensity value for vibration meter 24c has been decreasing since 16:30 on 4/19, but continues to increase for vibration meters 24a and 24b. Therefore, it can be seen that the molten material height was between 4.8 and 5.2 m, between vibration meters 24b and 24c, from 16:30 to 23:59 on 4/19. Looking at the molten material height values estimated and calculated at the same time, it rose from approximately 4.4 m to 5.2 m between 16:30 and 23:59 on 4/19. In this way, the molten material height detected from the vibration intensity and the molten material height estimated and calculated from the operational data are almost the same, confirming that the molten material height can be detected by the method of Example 1.
- Example 2 Next, Example 2 will be described, in which it was confirmed that the molten material height can be detected using a single vibrometer.
- the molten material height of a large blast furnace with the same capacity of 5000 m3 as Example 1 was detected using vibration data from the vibrometer 24a.
- the vibration data acquired from the vibrometer 24a was subjected to overlap processing, smoothing processing, and window function processing, as in Example 1, and then FFT analysis.
- the vibration intensity of this frequency from 00:00 to 23:59 on 4/19 was corrected using the above formula (2) to calculate the corrected vibration intensity.
- the molten material height in the blast furnace was calculated using the operation data obtained from the blast furnace from 00:00 to 23:59 on 4/19 and the following formula (5).
- h is the molten height (m)
- Wi is the weight of the molten pig iron at the bottom (kg)
- ⁇ i is the density of the molten pig iron (kg/m 3 )
- Ws is the weight of the molten slag at the bottom (kg)
- ⁇ s is the density of the molten slag (kg/m 3 )
- ⁇ is the void fraction at the bottom (-)
- Sb is the cross-sectional area of the bottom (m 3 ).
- (-) means dimensionless.
- the weights of the molten pig iron and molten slag at the bottom of the hearth were calculated by adding up the amounts of pig iron and slag obtained at each tapping operation and subtracting the amounts of pig iron and slag produced by the amounts of tapping iron and slag produced, and correcting the error of the weighing machine of the actual equipment.
- the density of the molten pig iron was set to 6800 kg/ m3
- the density of the molten slag was set to 2650 kg/ m3
- the void ratio at the bottom of the hearth was set to 0.35.
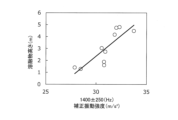
- Fig. 12 is a graph showing a regression equation between corrected vibration intensity and molten material height.
- the horizontal axis is corrected vibration intensity (m/ s2 ) and the vertical axis is molten material height (m).
- the regression equation shown in Fig. 12 is a calibration curve for detecting the molten material height from the corrected vibration intensity.
- the regression equation obtained from the graph of Fig. 12 is the following equation (6).
- G 0 is the corrected vibration intensity (m/s 2 ).
- the molten material height was detected using this formula (6).
- the molten material height was calculated using the corrected vibration intensity at four points around midnight on August 31st and the above formula (6).
- the calculation was performed using the operation data at four points at the same time and the above formula (5).
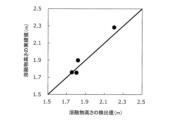
- FIG. 13 is a graph showing the relationship between the detected molten material height value calculated from the corrected vibration intensity and the actual molten material height value calculated from the operational data.
- the horizontal axis represents the detected molten material height value (m) calculated from the corrected vibration intensity
- the vertical axis represents the actual molten material height value (m).
- the detected molten material height value calculated from the regression equation (6) and the actual molten material height value calculated from the operational data were almost the same. This result confirmed that the molten material height can be detected by the method of Example 2.
Landscapes
- Engineering & Computer Science (AREA)
- Chemical & Material Sciences (AREA)
- Mechanical Engineering (AREA)
- General Engineering & Computer Science (AREA)
- Physics & Mathematics (AREA)
- Materials Engineering (AREA)
- Metallurgy (AREA)
- Organic Chemistry (AREA)
- Manufacturing & Machinery (AREA)
- General Physics & Mathematics (AREA)
- Fluid Mechanics (AREA)
- Thermal Sciences (AREA)
- Electromagnetism (AREA)
- Acoustics & Sound (AREA)
- Waste-Gas Treatment And Other Accessory Devices For Furnaces (AREA)
- Blast Furnaces (AREA)
- Vertical, Hearth, Or Arc Furnaces (AREA)
- Length Measuring Devices With Unspecified Measuring Means (AREA)
Abstract
Description
[1]溶鉱炉の溶融物高さを検出する溶融物高さ検出方法であって、前記溶鉱炉の炉下部における炉壁の1以上の位置で振動を測定し、前記振動の周波数を解析して前記炉下部の流入口に気体を導入することで発生する振動に相関のある周波数の振動強度を算出し、前記周波数の振動強度から前記流入口から導入される気体の送風量の影響を除去した補正振動強度を用いて前記溶融物高さを検出する、溶融物高さの検出方法。
[2]前記流入口に気体を導入することで発生する振動に相関のある周波数は、所定の幅を有する周波数帯の振動強度と、前記気体の送風量との相関を確認することで特定される、[1]に記載の溶融物高さの検出方法。
[3]前記補正振動強度の時間推移が極大または極小となった場合に、前記溶鉱炉における溶融物高さが前記振動を測定している位置であると検出する、[1]または[2]に記載の溶融物高さの検出方法。
[4]前記炉下部における炉壁の高さ方向に異なる2以上の位置で前記振動を測定する、[1]から[3]のいずれかに記載の溶融物高さの検出方法。
[5]前記補正振動強度と前記溶融物高さとの対応関係を予め求めておき、前記振動の測定から得られる補正振動強度と前記対応関係とを用いて溶鉱炉の溶融物高さを検出する、[1]または[2]に記載の溶融物高さの検出方法。
[6]前記炉下部における炉壁の高さ方向において、排出孔の上端位置を0とし、前記流入口の下端位置を1とした場合に、0.90以上1.00以下の位置で前記振動を測定する、[5]に記載の溶融物高さの検出方法。
[7]溶鉱炉の溶融物高さを検出する溶融物高さ検出装置であって、前記溶鉱炉の炉下部における炉壁に設けられ、前記炉壁の振動を測定する1以上の振動計と、前記振動計によって測定された振動を周波数解析して、前記炉下部の流入口に気体を導入することで発生する振動に相関のある周波数の振動強度を算出し、前記振動強度から前記流入口から導入される気体の送風量の影響を除去した補正振動強度を用いて前記溶融物高さを検出する演算装置と、を有する、溶融物高さの検出装置。
[8]2以上の前記振動計を有し、前記2以上の振動計は、前記炉下部における炉壁の高さ方向に異なる2以上の位置に設けられる、[7]に記載の溶融物高さの検出装置。
[9]前記演算装置は、前記補正振動強度と前記溶融物高さとの対応関係を用いて前記溶融物高さを検出する、[7]に記載の溶融物高さの検出装置。
[10]前記炉下部における炉壁の高さ方向において、排出孔の上端位置を0とし、前記流入口の下端位置を1とした場合に、前記振動計は0.90以上1.00以下の位置に設けられる、[9]に記載の溶融物高さの検出装置。
[11]溶鉱炉を用いた溶融物の製造方法であって、前記溶鉱炉の炉下部における炉壁の1以上の位置で振動を測定し、前記振動の周波数を解析して前記炉下部の流入口に気体を導入することで発生する振動に相関のある周波数の振動強度を算出し、前記周波数の振動強度から前記流入口から導入される気体の送風量の影響を除去した補正振動強度を用いて前記溶鉱炉の溶融物高さを検出し、検出された溶融物高さが、目標とする溶融物高さの範囲内になるように前記溶融物の製造条件を調整する、溶融物の製造方法。
[12]前記補正振動強度と前記溶融物高さとの対応関係を予め求めておき、前記振動の測定から得られる補正振動強度と前記対応関係とを用いて前記溶融物高さを検出する、[11]に記載の溶融物の製造方法。
以下、本発明の第1実施形態を溶鉱炉の一例である高炉を用い、高炉の炉底部に蓄積される溶融物である溶銑滓の高さを検出する例を用いて説明する。図1は、高炉10の炉下部の部分断面模式図である。高炉10の炉下部には銑鉄とスラグで構成される溶銑滓(以後、溶銑滓を「溶融物12」と記載する。)が蓄積されている。溶融物12は、排出孔14から排出され、溶融物流れ16が生じる。また、高炉10の炉下部には、気体18を導入させるための送風羽口20が設けられている。送風羽口20は、炉内に気体18を導入する流入口の一例である。
上記(1)式において、G0は補正振動強度(m/s2)であり、Gは補正前の振動強度(m/s2)であり、BV0は基準となる任意の送風量(Nm3/min)であり、BVはGの計算元となる振動データが測定された時刻における送風量(Nm3/min)であり、aは送風による振動に相関のある周波数の振動強度をy軸とし、送風量をx軸とした際の回帰直線の傾きである。
次に、本発明の第2実施形態を、第1の実施形態と同様に、溶鉱炉の一例である高炉10を用い、高炉10の炉底部に蓄積される溶融物12の高さを検出する例を用いて説明する。図6は、高炉10の炉下部と第2実施形態に係る溶融物高さの検出装置30を示す部分断面模式図である。溶融物高さの検出装置30は、1つの振動計32と演算装置34とを有する。なお、図6に示した例において、図2と同じ構成要素には同じ参照番号を付し、その説明を省略する。
次に、本発明の妥当性を確認することを目的として、容量が5000m3の大型高炉の炉下部に蓄積される溶融物高さを検出した実施例1を説明する。本実施例では、図2に示した溶融物高さの検出装置22と同じ構成の装置を用いた。振動計24a~24cは、高炉10の炉下部に設けられた送風羽口20と排出孔14との間に等間隔で設置した。振動計24a~24cの炉底からの設置高さ、送風羽口および排出孔の高さを下記表1に示す。

次に、単一の振動計を用いて溶融物高さを検出できることを確認した実施例2を説明する。実施例2では、実施例1と同じ容量が5000m3の大型高炉の溶融物高さを振動計24aの振動データを用いて検出した。振動計24aから取得した振動データは、実施例1と同様に、オーバーラップ処理、平滑化処理および窓関数処理した上でFFT解析した。
12 溶融物
14 排出孔
16 溶融物流れ
18 気体
20 送風羽口
22 溶融物高さの検出装置
24a~24c 振動計
26 演算装置
30 溶融物高さの検出装置
32 振動計
40a~40c アンプ
42a~42c データロガー
Claims (12)
- 溶鉱炉の溶融物高さを検出する溶融物高さ検出方法であって、
前記溶鉱炉の炉下部における炉壁の1以上の位置で振動を測定し、
前記振動の周波数を解析して前記炉下部の流入口に気体を導入することで発生する振動に相関のある周波数の振動強度を算出し、
前記周波数の振動強度から前記流入口から導入される気体の送風量の影響を除去した補正振動強度を用いて前記溶融物高さを検出する、溶融物高さの検出方法。 - 前記流入口に気体を導入することで発生する振動に相関のある周波数は、所定の幅を有する周波数帯の振動強度と、前記気体の送風量との相関を確認することで特定される、請求項1に記載の溶融物高さの検出方法。
- 前記補正振動強度の時間推移が極大となった場合に、前記溶鉱炉における溶融物高さが前記振動を測定している位置であると検出する、請求項1または請求項2に記載の溶融物高さの検出方法。
- 前記炉下部における炉壁の高さ方向に異なる2以上の位置で前記振動を測定する、請求項1から請求項3のいずれか一項に記載の溶融物高さの検出方法。
- 前記補正振動強度と前記溶融物高さとの対応関係を予め求めておき、
前記振動の測定から得られる補正振動強度と前記対応関係とを用いて溶鉱炉の溶融物高さを検出する、請求項1または請求項2に記載の溶融物高さの検出方法。 - 前記炉下部における炉壁の高さ方向において、排出孔の上端位置を0とし、前記流入口の下端位置を1とした場合に、0.90以上1.00以下の位置で前記振動を測定する、請求項5に記載の溶融物高さの検出方法。
- 溶鉱炉の溶融物高さを検出する溶融物高さ検出装置であって、
前記溶鉱炉の炉下部における炉壁に設けられ、前記炉壁の振動を測定する1以上の振動計と、
前記振動計によって測定された振動を周波数解析して、前記炉下部の流入口に気体を導入することで発生する振動に相関のある周波数の振動強度を算出し、前記周波数の振動強度から前記流入口から導入される気体の送風量の影響を除去した補正振動強度を用いて前記溶融物高さを検出する演算装置と、
を有する、溶融物高さの検出装置。 - 2以上の前記振動計を有し、
前記2以上の振動計は、前記炉下部における炉壁の高さ方向に異なる2以上の位置に設けられる、請求項7に記載の溶融物高さの検出装置。 - 前記演算装置は、前記補正振動強度と前記溶融物高さとの対応関係を用いて前記溶融物高さを検出する、請求項7に記載の溶融物高さの検出装置。
- 前記炉下部における炉壁の高さ方向において、排出孔の上端位置を0とし、前記流入口の下端位置を1とした場合に、前記振動計は0.90以上1.00以下の位置に設けられる、請求項9に記載の溶融物高さの検出装置。
- 溶鉱炉を用いた溶融物の製造方法であって、
前記溶鉱炉の炉下部における炉壁の1以上の位置で振動を測定し、
前記振動の周波数を解析して前記炉下部の流入口に気体を導入することで発生する振動に相関のある周波数の振動強度を算出し、
前記周波数の振動強度から前記流入口から導入される気体の送風量の影響を除去した補正振動強度を用いて前記溶鉱炉の溶融物高さを検出し、
検出された溶融物高さが、目標とする溶融物高さの範囲内になるように前記溶融物の製造条件を調整する、溶融物の製造方法。 - 前記補正振動強度と前記溶融物高さとの対応関係を予め求めておき、
前記振動の測定から得られる補正振動強度と前記対応関係とを用いて前記溶融物高さを検出する、請求項11に記載の溶融物の製造方法。
Priority Applications (5)
| Application Number | Priority Date | Filing Date | Title |
|---|---|---|---|
| KR1020257021813A KR20250116111A (ko) | 2023-01-12 | 2023-09-05 | 용융물 높이의 검출 방법, 용융물 높이의 검출 장치 및 용융물의 제조 방법 |
| EP23916084.9A EP4617384A4 (en) | 2023-01-12 | 2023-09-05 | METHOD FOR DETECTING THE HEIGHT OF MELTED MATERIAL, DEVICE FOR DETECTING THE HEIGHT OF MELTED MATERIAL AND METHOD FOR PRODUCING MELTED MATERIAL |
| JP2024500138A JP7485247B1 (ja) | 2023-01-12 | 2023-09-05 | 溶融物高さの検出方法、溶融物高さの検出装置および溶融物の製造方法 |
| CN202380090124.0A CN120435572A (zh) | 2023-01-12 | 2023-09-05 | 熔融物高度的检测方法、熔融物高度的检测装置和熔融物的制造方法 |
| US19/145,266 US20260219092A1 (en) | 2023-01-12 | 2023-09-05 | Molten material height detection method, molten material height detection apparatus, and method for manufacturing molten material |
Applications Claiming Priority (2)
| Application Number | Priority Date | Filing Date | Title |
|---|---|---|---|
| JP2023002761 | 2023-01-12 | ||
| JP2023-002761 | 2023-01-12 |
Publications (1)
| Publication Number | Publication Date |
|---|---|
| WO2024150464A1 true WO2024150464A1 (ja) | 2024-07-18 |
Family
ID=91896837
Family Applications (1)
| Application Number | Title | Priority Date | Filing Date |
|---|---|---|---|
| PCT/JP2023/032420 Ceased WO2024150464A1 (ja) | 2023-01-12 | 2023-09-05 | 溶融物高さの検出方法、溶融物高さの検出装置および溶融物の製造方法 |
Country Status (6)
| Country | Link |
|---|---|
| US (1) | US20260219092A1 (ja) |
| EP (1) | EP4617384A4 (ja) |
| JP (1) | JP7485247B1 (ja) |
| CN (1) | CN120435572A (ja) |
| TW (1) | TWI877787B (ja) |
| WO (1) | WO2024150464A1 (ja) |
Cited By (1)
| Publication number | Priority date | Publication date | Assignee | Title |
|---|---|---|---|---|
| JP7740605B1 (ja) * | 2024-07-09 | 2025-09-17 | Jfeスチール株式会社 | 溶融物高さの検出方法、溶融物高さの検出装置および溶融物の製造方法 |
Families Citing this family (1)
| Publication number | Priority date | Publication date | Assignee | Title |
|---|---|---|---|---|
| WO2026069955A1 (ja) * | 2024-09-24 | 2026-04-02 | Jfeスチール株式会社 | 溶融物高さの検出方法、溶融物高さの検出装置および溶融物の製造方法 |
Citations (7)
| Publication number | Priority date | Publication date | Assignee | Title |
|---|---|---|---|---|
| JPH09145452A (ja) * | 1995-11-22 | 1997-06-06 | Kawasaki Steel Corp | 炉内溶融物の液面レベル測定方法およびその装置 |
| JPH10185654A (ja) | 1996-12-20 | 1998-07-14 | Kawasaki Steel Corp | 炉内溶融物の液面レベル検出方法 |
| JP2009162430A (ja) * | 2008-01-08 | 2009-07-23 | Jfe Steel Corp | 竪型炉の操業方法 |
| KR20120023404A (ko) * | 2010-09-03 | 2012-03-13 | 주식회사 포스코 | 고로의 용선 레벨 측정 장치 및 그 방법 |
| JP2017160498A (ja) | 2016-03-10 | 2017-09-14 | 株式会社神戸製鋼所 | 竪型炉における溶融物レベルの推定方法、及びその推定装置 |
| JP2019535995A (ja) * | 2016-11-24 | 2019-12-12 | ポスコPosco | 湯面高さの測定装置及び測定方法 |
| WO2022201717A1 (ja) * | 2021-03-23 | 2022-09-29 | Jfeスチール株式会社 | 溶銑滓高さ検出方法および溶銑滓高さ検出装置 |
Family Cites Families (3)
| Publication number | Priority date | Publication date | Assignee | Title |
|---|---|---|---|---|
| US11992876B2 (en) * | 2017-02-17 | 2024-05-28 | Southwire Company, Llc | Ultrasonic grain refining and degassing procedures and systems for metal casting including enhanced vibrational coupling |
| CN110564905B (zh) * | 2019-10-08 | 2020-10-09 | 中南大学 | 一种对高炉炉衬冲击回波检测的信号处理方法及系统 |
| IT201900020470A1 (it) * | 2019-11-06 | 2021-05-06 | Danieli Off Mecc | Procedimento per la rilevazione di perdite di acqua da forni fusori in impianti di produzione di metalli o leghe e relativo impianto |
-
2023
- 2023-09-05 CN CN202380090124.0A patent/CN120435572A/zh active Pending
- 2023-09-05 US US19/145,266 patent/US20260219092A1/en active Pending
- 2023-09-05 EP EP23916084.9A patent/EP4617384A4/en active Pending
- 2023-09-05 JP JP2024500138A patent/JP7485247B1/ja active Active
- 2023-09-05 WO PCT/JP2023/032420 patent/WO2024150464A1/ja not_active Ceased
- 2023-09-14 TW TW112135133A patent/TWI877787B/zh active
Patent Citations (7)
| Publication number | Priority date | Publication date | Assignee | Title |
|---|---|---|---|---|
| JPH09145452A (ja) * | 1995-11-22 | 1997-06-06 | Kawasaki Steel Corp | 炉内溶融物の液面レベル測定方法およびその装置 |
| JPH10185654A (ja) | 1996-12-20 | 1998-07-14 | Kawasaki Steel Corp | 炉内溶融物の液面レベル検出方法 |
| JP2009162430A (ja) * | 2008-01-08 | 2009-07-23 | Jfe Steel Corp | 竪型炉の操業方法 |
| KR20120023404A (ko) * | 2010-09-03 | 2012-03-13 | 주식회사 포스코 | 고로의 용선 레벨 측정 장치 및 그 방법 |
| JP2017160498A (ja) | 2016-03-10 | 2017-09-14 | 株式会社神戸製鋼所 | 竪型炉における溶融物レベルの推定方法、及びその推定装置 |
| JP2019535995A (ja) * | 2016-11-24 | 2019-12-12 | ポスコPosco | 湯面高さの測定装置及び測定方法 |
| WO2022201717A1 (ja) * | 2021-03-23 | 2022-09-29 | Jfeスチール株式会社 | 溶銑滓高さ検出方法および溶銑滓高さ検出装置 |
Non-Patent Citations (1)
| Title |
|---|
| See also references of EP4617384A1 |
Cited By (2)
| Publication number | Priority date | Publication date | Assignee | Title |
|---|---|---|---|---|
| JP7740605B1 (ja) * | 2024-07-09 | 2025-09-17 | Jfeスチール株式会社 | 溶融物高さの検出方法、溶融物高さの検出装置および溶融物の製造方法 |
| WO2026014015A1 (ja) * | 2024-07-09 | 2026-01-15 | Jfeスチール株式会社 | 溶融物高さの検出方法、溶融物高さの検出装置および溶融物の製造方法 |
Also Published As
| Publication number | Publication date |
|---|---|
| US20260219092A1 (en) | 2026-07-30 |
| TWI877787B (zh) | 2025-03-21 |
| JP7485247B1 (ja) | 2024-05-16 |
| CN120435572A (zh) | 2025-08-05 |
| JPWO2024150464A1 (ja) | 2024-07-18 |
| EP4617384A4 (en) | 2026-03-11 |
| EP4617384A1 (en) | 2025-09-17 |
| TW202428884A (zh) | 2024-07-16 |
Similar Documents
| Publication | Publication Date | Title |
|---|---|---|
| JP7485247B1 (ja) | 溶融物高さの検出方法、溶融物高さの検出装置および溶融物の製造方法 | |
| US7780906B2 (en) | Method for controlling a molten metal bath bubbling in a metallurgical vessel and a device for carrying out said method | |
| WO2016015386A1 (zh) | 一种转炉化渣监控方法和系统 | |
| WO2022201717A1 (ja) | 溶銑滓高さ検出方法および溶銑滓高さ検出装置 | |
| JP7694749B1 (ja) | 溶融物高さの検出方法、溶融物高さの検出装置、及び溶融物の製造方法 | |
| JPWO2024150464A5 (ja) | ||
| JP7740605B1 (ja) | 溶融物高さの検出方法、溶融物高さの検出装置および溶融物の製造方法 | |
| KR20250116111A (ko) | 용융물 높이의 검출 방법, 용융물 높이의 검출 장치 및 용융물의 제조 방법 | |
| WO2026069955A1 (ja) | 溶融物高さの検出方法、溶融物高さの検出装置および溶融物の製造方法 | |
| EP4524218A1 (en) | Operation method of vertical dry distillation furnace, production method of ferrocoke and vertical dry distillation furnace equipment | |
| CN113514104B (zh) | 转炉的实时炉渣状态监测方法 | |
| JPH08302413A (ja) | 転炉における吹錬の終点制御方法 | |
| JP7831423B2 (ja) | 高炉のガス流速分布計算装置、ガス流速計算方法及び操業方法 | |
| TWI853731B (zh) | 高爐爐內之熔融物位準之量測方法、高爐爐內之熔融物位準之量測裝置,以及高爐之操作方法 | |
| JP7740490B2 (ja) | 高炉炉内の溶融物レベルの計測方法、高炉炉内の溶融物レベルの計測装置、及び高炉の操業方法 | |
| CN113504725B (zh) | 转炉的实时炉渣状态监测装置 | |
| JP7694748B1 (ja) | 高炉炉内の溶融物レベルの計測方法、高炉炉内の溶融物レベルの計測装置、及び高炉の操業方法 | |
| WO2025182169A1 (ja) | 高炉炉内の溶融物レベルの計測方法、高炉炉内の溶融物レベルの計測装置、及び高炉の操業方法 | |
| JP2025126958A (ja) | 高炉の滴下溶銑温度の推定方法及び高炉の操業方法 | |
| JPH03219007A (ja) | スロッピング検出方法、その検出装置及びその検出装置の校正方法 | |
| JPH06248321A (ja) | 精錬炉におけるスロッピング予知方法 | |
| JPS59162211A (ja) | 高炉操業方法 | |
| JPS58106424A (ja) | 転炉における炉外飛散物の計量装置 | |
| JPS61119610A (ja) | 水吹込みによる高炉のバランス制御法 | |
| JPH05271726A (ja) | 高炉装入原料の棚吊り検出方法 |
Legal Events
| Date | Code | Title | Description |
|---|---|---|---|
| WWE | Wipo information: entry into national phase |
Ref document number: 2024500138 Country of ref document: JP |
|
| 121 | Ep: the epo has been informed by wipo that ep was designated in this application |
Ref document number: 23916084 Country of ref document: EP Kind code of ref document: A1 |
|
| WWE | Wipo information: entry into national phase |
Ref document number: 202517050780 Country of ref document: IN |
|
| WWE | Wipo information: entry into national phase |
Ref document number: 2023916084 Country of ref document: EP |
|
| WWP | Wipo information: published in national office |
Ref document number: 202517050780 Country of ref document: IN |
|
| ENP | Entry into the national phase |
Ref document number: 2023916084 Country of ref document: EP Effective date: 20250613 |
|
| WWE | Wipo information: entry into national phase |
Ref document number: 202380090124.0 Country of ref document: CN |
|
| REG | Reference to national code |
Ref country code: BR Ref legal event code: B01A Ref document number: 112025013263 Country of ref document: BR |
|
| WWP | Wipo information: published in national office |
Ref document number: 1020257021813 Country of ref document: KR |
|
| WWP | Wipo information: published in national office |
Ref document number: 202380090124.0 Country of ref document: CN |
|
| NENP | Non-entry into the national phase |
Ref country code: DE |
|
| WWP | Wipo information: published in national office |
Ref document number: 2023916084 Country of ref document: EP |
|
| ENP | Entry into the national phase |
Ref document number: 112025013263 Country of ref document: BR Kind code of ref document: A2 Effective date: 20250626 |