WO2025041336A1 - Dispositif à faisceau d'ions et procédé de réglage de faisceau de particules chargées - Google Patents
Dispositif à faisceau d'ions et procédé de réglage de faisceau de particules chargées Download PDFInfo
- Publication number
- WO2025041336A1 WO2025041336A1 PCT/JP2023/030529 JP2023030529W WO2025041336A1 WO 2025041336 A1 WO2025041336 A1 WO 2025041336A1 JP 2023030529 W JP2023030529 W JP 2023030529W WO 2025041336 A1 WO2025041336 A1 WO 2025041336A1
- Authority
- WO
- WIPO (PCT)
- Prior art keywords
- ion beam
- lens
- power supply
- charged particle
- voltage
- Prior art date
- Legal status (The legal status is an assumption and is not a legal conclusion. Google has not performed a legal analysis and makes no representation as to the accuracy of the status listed.)
- Pending
Links
Images


Classifications
-
- H—ELECTRICITY
- H01—ELECTRIC ELEMENTS
- H01J—ELECTRIC DISCHARGE TUBES OR DISCHARGE LAMPS
- H01J37/00—Discharge tubes with provision for introducing objects or material to be exposed to the discharge, e.g. for the purpose of examination or processing thereof
- H01J37/02—Details
- H01J37/04—Arrangements of electrodes and associated parts for generating or controlling the discharge, e.g. electron-optical arrangement or ion-optical arrangement
- H01J37/08—Ion sources; Ion guns
-
- H—ELECTRICITY
- H01—ELECTRIC ELEMENTS
- H01J—ELECTRIC DISCHARGE TUBES OR DISCHARGE LAMPS
- H01J37/00—Discharge tubes with provision for introducing objects or material to be exposed to the discharge, e.g. for the purpose of examination or processing thereof
- H01J37/02—Details
- H01J37/04—Arrangements of electrodes and associated parts for generating or controlling the discharge, e.g. electron-optical arrangement or ion-optical arrangement
- H01J37/10—Lenses
- H01J37/12—Lenses electrostatic
Definitions
- the present invention relates to an ion beam device and a method for adjusting a charged particle beam.
- the structure of the sample surface can be observed by focusing an electron beam through an electromagnetic lens, scanning it while irradiating it onto the sample, and detecting the charged particles (secondary electrons) emitted from the sample. This is called a Scanning Electron Microscope (SEM).
- SEM Scanning Electron Microscope
- GFIS Gas Field Ionization Source
- GFIS Gas Field Ionization Source
- GFIS applies a high voltage to a metallic emitter tip, preferably with a radius of curvature of approximately 100 nm or less, concentrates an electric field at the tip, and introduces gas (ionized gas) in the vicinity, field ionizing the gas molecules and extracting them as an ion beam.
- the ion beam emitted from a GFIS has a narrower energy range and a smaller light source size than ion beams emitted from liquid metal ion sources or ion sources using plasma phenomena, so a scanning ion microscope using a GFIS (GFIS-SIM) can finely focus the ion beam.
- GFIS-SIM scanning ion microscope using a GFIS
- the tip of its emitter needs to be sharpened at the atomic level.
- the GFIS has the unique feature of being able to change the ion species extracted by changing the gas molecules.
- small mass ions such as hydrogen or helium are extracted, and when processing the surface of a sample, large mass ions such as neon or argon are extracted. This can reduce damage to the sample during observation or, conversely, increase the processing speed when processing the sample.
- Another feature of the ion beam emitted from the GFIS is that it has a shorter wavelength than an electron beam at the same acceleration. This reduces aberration caused by diffraction, and allows the beam opening angle to be made smaller. This means that the focal depth of the observation image (SIM image) is deeper. This is advantageous when simultaneously observing objects at different positions in the depth direction.
- Another feature is that it is possible to obtain secondary electron detection signals that do not damage information on the sample surface even when irradiating the sample with high acceleration, making it possible to perform observations that are both sensitive to the sample surface and have high resolution.
- the acceleration of the electron beam is usually reduced to obtain images that are sensitive to the sample surface, but reducing the acceleration generally has the disadvantage of reducing the resolution.
- Patent document 1 discloses a retarding field analyzer for a charged particle beam system.
- the retarding field analyzer uses existing components of the charged particle beam system, eliminating the need to insert a separate retarding field analyzer.
- existing column components By using existing column components, the time required to analyze the beam is reduced. Also, by using the imaging capabilities of the existing column, alignment of the beam and the analyzer is made easier.
- the emitter tip in order to obtain a practical level of ion beam brightness with GFIS, the emitter tip must be sharp enough to terminate at just a few atoms. Furthermore, the structure may be suddenly destroyed, in which case the sharpness must be restored with good reproducibility. Furthermore, since it is generally not possible to observe the sample using the device during the formation and restoration processes used to obtain the atomic sharpness, these processes must generally be completed within a very short period of time.
- the lens that focuses the ion beam has aberration, which increases the diameter (probe diameter) at the point where the ion beam is narrowest.
- aberration There are several types of aberration, and among these, chromatic aberration is known to increase in proportion to the energy width of the ion beam mentioned above. For this reason, a narrow energy width of the ion beam is desirable in order to observe samples with high resolution.
- the energy width of an ion beam varies depending on the conditions under which the ion beam is extracted from the ion source.
- the electric field at the emitter tip is extremely important.
- the emitter tip needs to be sharp enough to terminate at just a few atoms, and since the electric field at the emitter tip can change depending on the number of atoms, this change can be particularly noticeable. For this reason, it is difficult to identify the conditions for improving the resolution in a GFIS.
- the energy width of the ion beam can be actually measured. Therefore, if the energy width of the ion beam is confirmed before use, it is possible to operate the device under conditions that are favorable for obtaining high-resolution microscope images.
- devices that measure the energy width of the ion beam are generally large and expensive, and introducing additional devices poses a cost issue.
- Patent Document 1 there is a method for measuring the energy width of an ion beam using a focusing lens, which is an original component of the optical column of an ion beam device.
- a voltage is applied to an electrode having an opening through which the ion beam passes, generating a spatial potential distribution at the opening.
- This potential distribution can be diverted to the use of measuring the energy width of the ion beam.
- the focusing lens is used as a retarding type energy analyzer that uses the phenomenon of shielding the ion beam by this spatial potential distribution.
- the energy distribution of the ion beam can be known by measuring the amount of the ion beam passing while changing the voltage applied to the focusing lens. With this method, it is possible to confirm conditions favorable for obtaining a high-resolution microscope image and operate the device under those conditions without wasting additional costs or space on existing equipment.
- Another suppression method is to inject an ion beam so as to focus it at the center of the potential distribution.
- a focusing lens is used that is located on the ion source side rather than the focusing lens that generates the potential distribution for the energy analysis.
- this method can limit both the spatial spread and the amount of current of the ion beam to be analyzed.
- the energy resolution is significantly impaired due to a misalignment between the ion beam and the potential distribution.
- this method poses a trade-off between energy resolution and analytical throughput, and to resolve this issue, it is necessary to accurately measure the positional deviation between the ion beam and the potential distribution.
- the ion beam device makes it possible to accurately align an ion beam to the saddle point of the potential distribution of the focusing lens. This makes it possible to quickly determine the energy distribution of the ion beam that is incident on a focusing trajectory into the potential distribution of the focusing lens with high energy resolution.
- FIG. 1 is a configuration example of an ion beam device.
- 1 is a histogram showing the energy distribution of an ion beam.
- FIG. 13 is a diagram showing the results of calculating the potential distribution of an electrostatic focusing lens.
- FIG. 2 is a diagram showing the electric potential distribution on the axis of an electrostatic focusing lens.
- FIG. 1 is a diagram showing a radial potential distribution on a surface including a maximum value of the potential distribution on the axis of an electrostatic focusing lens.
- FIG. 2 is a detailed diagram showing the radial potential distribution on a surface including the maximum value of the axial potential distribution of the electrostatic focusing lens.
- 1A and 1B are diagrams illustrating differences in the passing positions of an ion beam incident on a potential distribution.
- FIG. 13 is a diagram showing the influence of the trajectory of an incident ion beam on the potential distribution.
- FIG. 13 is a diagram showing the relationship between the retarding voltage and the degree of inhibition of an ion beam.
- FIG. 13 is a diagram showing the relationship between the deflector output and the retarding voltage at which a characteristic point appears.
- 2 is a configuration example of a deflector.
- 1 is a diagram showing the relationship between the focusing action of a focusing lens and the energy spread.
- FIG. 13 is a diagram showing the relationship between the focusing action of a focusing lens and the energy spread.
- 1 is an example of the energy distribution of an ion beam emitted from a hydrogen gas field ion source.
- 1 is an example of an energy distribution of a filtered ion beam.
- 1 shows a configuration example of an ion beam apparatus that filters a hydrogen ion beam using an RFA. This is an example of a coordination procedure before an energy analysis. 1 is an example of an ion beam position adjustment procedure. 13 is an example of a focusing lens focusing effect adjustment procedure.
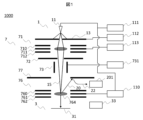
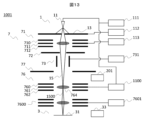
- FIG. 1 is a configuration diagram of an ion beam device 1000 according to this embodiment.
- the configuration as an ion beam device including a gas field ion source is described, but a liquid metal ion source, a plasma ion source, or a magnetic optical trap ion source (MOTIS) can also be used as the ion source.
- MOTIS magnetic optical trap ion source
- it can be configured as a charged particle beam device including an electron source rather than an ion source.
- the ion source side may be referred to as the upstream side according to the flow of the ion beam, and the sample side, which is the final destination, as the downstream side.
- the gas field ion source 1 comprises an emitter electrode (emitter tip) 11 with a needle-shaped tip, an extraction electrode 13, and high-voltage power supplies 111 and 112.
- the extraction electrode 13 has an opening at a position opposite the emitter electrode 11.
- the emitter electrode 11 is cooled as necessary by a refrigerator or a cryogen such as liquid nitrogen or liquid helium.
- the high-voltage power supply 111 applies a voltage to the emitter electrode 11, and the high-voltage power supply 112 applies a voltage to the extraction electrode 13, and the potential difference between the two forms an electric field that positively ions the gas near the tip of the emitter electrode 11.
- High voltage power supply 111 and high voltage power supply 112 can be controlled independently of each other, which allows the acceleration voltage of the ion beam and the extraction voltage for forming an ionization electric field to be controlled independently.
- high voltage power supply 112 connected to extraction electrode 13 is a power supply capable of outputting both positive and negative polarities, or a power supply of negative polarity based on the potential supplied by high voltage power supply 111. This makes it possible to set the acceleration voltage of the ion beam below the extraction voltage required to extract ions.
- a high voltage is applied between the emitter electrode 11 and the extraction electrode 13.
- the application of high voltage concentrates an electric field at the tip of the emitter electrode 11.
- the strength of the electric field formed at the tip is set to be strong enough to positively ionize hydrogen, and in this state, if a gas containing hydrogen gas is introduced near the emitter electrode 11 using the gas introduction mechanism, a hydrogen ion beam will be emitted from the tip of the emitter electrode 11.
- gases such as helium, neon, argon, krypton, nitrogen, and oxygen by appropriate voltage adjustment and gas introduction.
- the vacuum chamber containing the gas field ion source 1 is preferably kept at an ultra-high vacuum of 10 ⁇ 7 Pa or less.
- the start-up operation of the gas field ion source 1 may include so-called baking, in which the entire vacuum chamber is heated to 100 degrees or more.
- the refrigerator cools the inside of the gas field ion source 1, the emitter electrode 11, the extraction electrode 13, etc.
- the refrigerator may be, for example, a mechanical refrigerator such as a Gifford McMahon type (GM type) or a pulse tube type, or a refrigerant such as liquid helium, liquid nitrogen, or solid nitrogen.
- GM type Gifford McMahon type
- a pulse tube type or a refrigerant such as liquid helium, liquid nitrogen, or solid nitrogen.
- a separate drive mechanism may be provided for the emitter electrode 11 so that the position and angle of the emitter electrode 11 can be adjusted to favorable conditions for focusing the ion beam 15.
- the emitter electrode drive mechanism may be configured so that it can be manually adjusted by the user or automatically adjusted by an emitter electrode drive mechanism controller.
- the ion beam device 1000 comprises a gas field ion source 1, a beam irradiation column 7, and a sample chamber 3.
- a gas field ion source 1 When observing the sample surface, an ion beam 15 emitted from the gas field ion source 1 passes through the beam irradiation column 7 and is irradiated onto a sample 31 placed on a sample stage inside the sample chamber 3. Secondary particles (e.g., secondary electrons) emitted from the sample 31 are detected by a secondary particle detector 33.
- Secondary particles e.g., secondary electrons
- the beam irradiation column 7 comprises a focusing lens 71, an aperture 72, a deflector 73, and an objective lens 76.
- the focusing lens 71, the deflector 73, and the objective lens 76 are supplied with voltages by a focusing lens power supply 113, a deflector power supply 731, and an objective lens power supply 110, respectively.
- the electrodes of the deflector 73 can be configured with multiple electrodes that generate an electric field, such as 4 poles, 8 poles, or 16 poles, as required. The number of poles of the deflector power supply must be increased depending on the number of electrodes.
- the focusing lens 71 is an example of an electrostatic lens composed of three electrodes, electrodes 710, 711, and 712. A high voltage is supplied to electrode 711, which is located in the center, from the focusing lens power supply 113. Electrodes 710 and 712 are typically installed so that they are at ground potential, but a power supply may be provided to supply voltage as necessary.
- Objective lens 76 is an example of an electrostatic lens composed of three electrodes, electrodes 760, 761, and 762. A high voltage is supplied to electrode 761, which is located in the center, from objective lens power supply 110. Electrodes 760 and 762 are typically installed so as to be at ground potential, but a power supply may be provided to supply voltage as necessary.
- the ion beam 15 is focused by a focusing lens 71, the beam diameter is restricted by an aperture 72, and the beam is further focused by an objective lens 76 to form a fine shape on the sample surface.
- the deflector 73 is used for axial adjustment to reduce aberrations caused by focusing by the lens, and for scanning the ion beam on the sample.
- the distribution width of the energy (hereafter referred to as energy width) is the width 21 when the energy possessed by a particle is expressed as a frequency by the number of particles that actually possess that energy, as shown in histogram 2 in Figure 2, for example.
- the width 21 can be determined by various scales. For example, the full width at half maximum (FWHM), which is the width at the half-value position relative to the peak of the distribution, can be used.
- the width can also be determined by fitting the energy distribution to a known function such as a Gaussian distribution.
- the energy width of the ion beam 15 varies depending on the conditions under which the ion beam is extracted. Among these, the voltage difference (extraction voltage) between the emitter 11 and the extraction electrode 13 is an important condition that determines the energy width. In other words, setting the optimum value of the extraction voltage to reduce the energy width is important when observing the sample surface.
- the energy width depends on the strength of the electric field formed at the tip of the emitter 11. Because the strength of the electric field also depends on the shape of the emitter 11, the same extraction voltage value is not always optimal.
- the shape of the emitter 11 may change due to the chemical or physical influence of surrounding gas molecules when emitting an ion beam. In addition, if the atomic structure formed at the tip to improve the sharpness of the emitter 11 changes, it may change due to some work to repair it. Once the emitter 11 is introduced into the device, it is very difficult to confirm its shape, and it is similarly difficult to confirm the strength of the electric field formed at the tip.
- the actual measurement of the energy width of the ion beam is a useful function for keeping the device in the best condition at all times.
- the energy width of the ion beam and the absolute value of the energy can be measured using a retarding electric field analyzer (RFA).
- the RFA applies a voltage to an electrode so that the retarding electric field that stops the beam is increased or decreased in stages.
- This electrode is an electrode on a grid or an electrode with an opening, and is usually configured so that the beam passes through it.
- the energy of the particles that make up the beam can be analyzed from the relationship between the applied voltage and the amount of beam passing through. To use the RFA, it is usually necessary to install an additional device in addition to the ion beam device.
- the positional relationship between the beam and the above-mentioned electrode is an important parameter that determines the energy resolution of the energy analysis, and there is an issue that it takes time because it is necessary to highly adjust the position of the electrode or the position of the beam.
- a focusing lens in an ion beam device as a retarding electrode for use in RFA. Even in this case, the beam position needs to be adjusted precisely.
- a method typically used when observing a sample in an ion beam device can be used. For example, the voltage applied to the focusing lens is wobbled and it is observed whether the position of the ion beam changes in accordance with the wobbled state.
- the voltage applied to the focusing lens is adjusted in advance so that the ion beam is focused on the surface of a sample placed in the device, it is possible to know whether the position of the ion beam has changed by detecting whether the microscope image of the sample oscillates in accordance with the above-mentioned wobbled state.
- the retarding voltage for blocking the ion beam with the focusing lens is strictly different from the voltage for focusing the ion beam on the surface of the sample with the focusing lens, precise position adjustment is difficult with this wobbler method.
- the ion beam device of this embodiment uses a focusing lens to enable a high degree of compatibility between a mode in which the ion beam is focused on the sample surface for observation, and a mode in which the ion beam is subjected to energy analysis. Furthermore, it enables the above energy analysis to be performed quickly and with high throughput.
- a voltage is applied to the electrode 761 of the objective lens 76 using the objective lens power supply 110 to generate a potential distribution 764.
- This potential distribution 764 can be used to select whether to make the ion beam 15 follow a trajectory that focuses the ion beam 15 on the surface of the sample 31, or to make the potential distribution large enough to stop the ion beam 15 and gradually change the magnitude of the potential distribution to perform energy analysis.
- the objective lens power supply 110 is floated by the output voltage of the high voltage power supply 111 that supplies voltage to the emitter electrode 11.
- the maximum required output voltage of the objective lens power supply 110 can be reduced.
- the voltage applied to the electrode 761 required to stop the ion beam 15 is almost the same as the voltage applied to the emitter electrode 11.
- the high voltage power supply 111 is connected and its output is added, so that the maximum output voltage required of the objective lens power supply 110 can be significantly reduced. Normally, in a constant voltage power supply, the larger the maximum output voltage, the larger the minimum setting range of the output voltage tends to be.
- the maximum output voltage of the objective lens power supply 110 can be reduced, and therefore the setting range of the output voltage can be reduced, making it possible to set the retarding voltage more precisely. Precise setting of the retarding voltage makes it possible to measure ion beams with a narrow energy spread.
- the greater the maximum output voltage or the greater the actual output voltage the greater the time fluctuation in voltage. Since the relative value of the potential on the particle emission side and the potential on the retarding side is important in an RFA, by floating the objective lens power supply 110 using the high voltage power supply 111, it is possible to offset most of the power supply fluctuations and reduce their impact. This has the effect of stabilizing the magnitude of the potential distribution 764 for the ion beam 15 for a long period of time, making it possible to align the ion beam 15 and adjust the focusing action of the focusing lens 71, as will be described later.
- a second objective lens power supply which is a high voltage power supply of a normal configuration that is not floating at the output voltage of the high voltage power supply 111, may be provided separately, and it may be possible to switch between the objective lens power supply 110 and the second objective lens power supply.
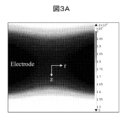
- the potential distribution 764 generally has a saddle point near the center of the electrode.
- Figure 3A shows the result of using the finite element method to determine the potential distribution of the opening of the central electrode of an objective lens with three electrodes, that is, the electrode corresponding to electrode 761 (see Figure 1). Note that Figure 3A shows the potential distribution when a voltage of 20 kV is applied to electrode 761, and the electrodes corresponding to electrodes 760 and 762 are grounded.
- the potential distribution generated by the objective lens has a saddle point near the center of the aperture.
- the energy resolution of energy analysis using the retarding method can be improved by aligning the ion beam to this saddle point.
- the voltage applied to electrode 761 is a value that causes the beam to focus directly above sample 31, and is smaller than the voltage required to stop the beam, making precise position adjustment difficult.
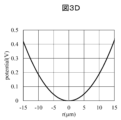
- Figure 4 shows the effect of misalignment between the ion beam and the potential distribution.
- the width 153 of the potential distribution through which the ion beam passes is at most about 0.05 V.
- the energy resolution in energy analysis is reduced due to the influence of the width of the potential distribution of approximately 0.05 V.
- the width 154 of the potential distribution increases to approximately 0.55 V.
- the typical energy width of the GFIS is about 0.5 to 2.0 eV, depending on the conditions and ion species, so this degradation of the energy resolution due to the axis misalignment is not acceptable.
- the diameter of the ion beam 15 can be limited using the aperture 72 to reduce the potential distribution width and reduce degradation of the energy resolution.
- the current amount of the ion beam 15 is limited, and the analysis throughput is significantly reduced.
- the current density of the ion beam 158 is assumed to be the same as that of the ion beam 152, the current amount is 1/4. Therefore, it takes four times as long to obtain analysis results with the same signal-to-noise ratio as the analysis results using the ion beam 152.
- the amount of current of the ion beam can be increased by making the beam a focused trajectory with respect to the potential distribution 764.
- Figure 5 shows a schematic diagram of an ion beam that takes a focused trajectory above the saddle point of the potential distribution, on the ion source side, and is incident with an axial deviation from the center.
- the width 157 of the potential distribution is approximately 0.25 V. Energy analysis under these conditions is affected by this potential distribution width of about 0.25 V, and the energy resolution decreases. If the focusing effect of the focusing lens 71 is increased and the focal point is further shifted upward from the ion beam 156, the potential distribution width will increase further.
- each optical element S01
- this step may be omitted.
- this is the position and angle of the emitter 11 and the position of the aperture.
- the positional deviation of the position and angle of the emitter 11 and the aperture position can be roughly detected by the oscillation (wobbler) of the focusing lens power supply 113 connected to the focusing lens 71.
- each optical element is mechanically adjusted so that the position of the ion beam 15 on the sample 31 does not fluctuate in response to fluctuations in the output voltage of the focusing lens power supply 113.
- the alignment of the ion beam 15 with the potential distribution 764 is performed by actually restraining the ion beam 15 with the potential distribution 764 (S02, S03).
- the degree to which the ion beam 15 is restrained can be observed by observing the ion beam 20 recoiled by the potential distribution 764.
- the ion beam 20 can be observed via a conversion plate 77 that converts ions into secondary electrons 22.
- the secondary electrons 22 are detected by a detector 201.
- the method of observing the degree to which the ion beam 15 is inhibited is not limited to observing the recoiled ion beam 20.
- the amount of ion beam 15 that passes through the potential distribution 764 may be converted into secondary electrons in the sample 31 and detected by a secondary electron detector (secondary particle detector) 33.
- a secondary electron detector secondary particle detector
- the space in which the sample is installed may change depending on the user's usage method, and the amount detected may change depending on the surface condition of the sample and the surrounding magnetic field.
- a Faraday cup it takes time to move the position of the sample and set it so that the ion beam is incident on the Faraday cup. Observing the degree of inhibition using the detector 201 can solve these problems.
- the output of the objective lens power supply 110 i.e., the retarding voltage
- the degree to which the ion beam is stopped changes with the change in the retarding voltage
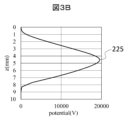
- the degree of ion beam stoppage 221 evaluated by the amount of current detected by the detector 201 changes as shown in FIG. 6.
- the change in the degree of stoppage 221 has several characteristic points for a certain retarding voltage. For example, there is a start point 222 of the stoppage, an inflection point 223, and an end point 224 of the stoppage.
- These feature points contain information about where the ion beam 15 is located relative to the potential distribution 764. In other words, if the ion beam 15 is located at a point in the potential distribution where the potential is high, these feature amounts are detected with a relatively small retarding voltage. Conversely, if the ion beam is located at a point where the potential is low, these feature amounts are detected with a relatively large retarding voltage.
- the position through which the ion beam 15 must pass in order to improve the resolution of the energy analysis is the saddle point 225.
- the potential is at its smallest as shown in FIG. 3C, and therefore the retarding voltage required for the above-mentioned characteristic point to appear is at its largest.
- the position of the ion beam 15 at which the retarding voltage at which the above-mentioned characteristic point appears is the position that provides the best energy resolution for the energy analysis.
- each output i.e., the characteristic quantity for each position of the ion beam 15, for example, the retarding voltage at which the inflection point 223 is observed, is illustrated as shown in FIG. 7.
- the retarding voltage at which the inflection point 223 appears is larger for the deflector output A than for the deflector output B. Therefore, the ion beam position given by the deflector output A is closer to the saddle point 225.
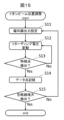
- FIG. 15 shows a flow for controlling the deflector 73 to search for the saddle point 225.
- the deflector output is set (S11), the retarding voltage is varied to detect the retarding voltage that gives a characteristic point (e.g., inflection point 223) of the degree of ion beam inhibition (S12, S13), and the data point is recorded (S14).
- a characteristic point e.g., inflection point 223 of the degree of ion beam inhibition
- S14 the data point is recorded (S14).
- the inhibition start point 222 and inhibition end point 224 may also be used as the characteristic point.
- the data points recorded by steps S11 to S14 correspond to the circles shown in FIG. 7.
- the position through which the ion beam 15 passes when the output of the deflector 73 is set to the deflector output that gives the maximum point of the envelope 233 can be identified as the saddle point 225.
- FIG. 8 shows an example of the configuration of the deflector 73.
- FIG. 8 shows a configuration including four electrodes arranged to surround the ion beam 15, it can also be configured to include more than four electrodes, for example, eight electrodes.
- the deflector 73 shown in FIG. 8 can be considered as a combination of a first deflector (Deflector A) and a second deflector (Deflector B), and the direction in which the deflector A deflects the ion beam 15 is perpendicular to the direction in which the deflector B deflects the ion beam 15.
- the deflector A also has electrodes 732a and b facing each other, and the first deflector power supply 7320 is connected to the electrode 732a, and the electrode 732b is connected to a ground potential.
- a power supply that outputs a voltage of the opposite polarity to the first deflector power supply 7320 may be connected to the electrode 732b.
- deflector B has electrodes 733a and 733b facing each other, with electrode 733a connected to the second deflector power supply 7330 and electrode 733b connected to ground potential.
- electrode 733b may be connected to a power supply that outputs a voltage of the opposite polarity to that of the second deflector power supply 7330.
- Figure 16 shows the flow of adjusting the focusing action of the focusing lens 71.
- the energy width width 21 (see Figure 2)
- data points shown as circles are obtained (S21-S23).
- the focusing action of the focusing lens 71 is manipulated incrementally or incrementally, and the width 21 at each focusing action is evaluated. This results in multiple data points, and an envelope 241 is obtained by fitting to these data points.
- the focusing action that gives the minimum point of the envelope 241 becomes the optimal adjustment value 242 of the desired focusing action (S24).
- the outputs of the high voltage power supplies 111 and 112 are constant during the alignment adjustment of the ion beam 15 (S02-S03) and the adjustment of the focusing action of the focusing lens 71 (S04).
- the changes in the inhibition start point 222, inflection point 223, inhibition end point 224, and width 21 depend only on the conditions downstream of the extraction electrode 13, that is, the energy analysis conditions, which is advantageous for optimizing the conditions of the energy analysis.
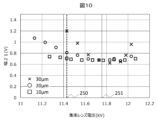
- Figure 10 shows the experimental results that clearly show this effect.
- Figure 10 shows the results of measuring the width 21 after adjusting the position of the ion beam 15 using the above procedure and then changing the focusing action of the focusing lens 71.
- the conditions of the voltages applied to the emitter tip 11 and the extraction electrode 13 are constant.
- the acceleration of the ion beam 15 is 20 kV
- the energy width of the ion beam is measured based on the potential distribution generated in the objective lens 76 after restricting the ion beam 15 using apertures 72 with diameters of 30 ⁇ m, 20 ⁇ m, and 10 ⁇ m.
- the parallel beam condition 250 is near 11.4 kV.
- the width 21 is smallest when the beam is restricted by the smallest aperture (10 ⁇ m), and the width 21 is largest when the beam is restricted by the largest aperture (30 ⁇ m). This is consistent with the discussion of the width of the ion beam at the potential distribution position and the width of the potential distribution described above.
- the energy resolution for a parallel beam is improved by reducing the aperture diameter.
- the energy analysis under the focusing lens condition is optimal for any aperture diameter, and that the energy resolution does not depend on the aperture diameter.
- the focusing point 2510 and saddle point 225 of the ion beam 156 coincide, and it is considered that the effect of the potential distribution width is minimized regardless of the aperture diameter.
- the RFA made of electrostatic lenses can function not only as an energy analysis of the ion beam 15, but also as a filter that unifies the ion species mixed in the ion beam.
- gas field ionization ion sources it is known that a hydrogen field ionization ion source that ionizes hydrogen gas emits three types of ions, H + , H 2 + , and H 3 + .
- H 3 + has higher energy than the other two hydrogen ion species.
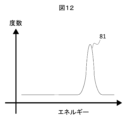
- the energy distribution of an ion beam made of H 2 + and H 3 + is as shown in FIG. 11, with a spectrum 80 made of relatively low-energy H 2 + and a spectrum 81 made of relatively high-energy H 3 + .
- the ion beam may be separated into small parts by the geomagnetism, and the observed image may appear multiplexed.
- ion beam device 1001 configuring the ion beam device 1001 as shown in Fig. 13, it becomes possible to irradiate the sample 31 with an ion beam composed of a single ion species, H3 + .
- components common to the ion beam device 1000 shown in Fig. 1 are denoted by the same reference numerals, and description of the overlapping components will be omitted.
- the ion beam 1500 filtered by the first objective lens 76 has an energy distribution as shown in Fig. 12.
- the ion species is singled, and the energy width of the ion beam as a whole is reduced, which has the effect of improving the focusing performance of the ion beam. It is also possible to pass only H2 + by adjusting the output voltage of the filter power supply 1100.
Landscapes
- Chemical & Material Sciences (AREA)
- Analytical Chemistry (AREA)
- Electron Sources, Ion Sources (AREA)
Abstract
Ce dispositif à faisceau d'ions comprend : une source d'ions d'ionisation de champ de gaz 1 qui comporte un émetteur 11 et une électrode d'extraction 13 faisant face à l'émetteur ; une première alimentation électrique en tension 111 qui génère un champ électrique dans l'émetteur ; une deuxième alimentation électrique en tension 112 qui génère un champ électrique dans l'électrode d'extraction ; une colonne d'irradiation de faisceau 7 qui comprend une première lentille 71 et une seconde lentille 76 qui peuvent focaliser un faisceau d'ions qui est émis à partir de la source d'ions d'ionisation de champ de gaz, et un déflecteur 73 qui est disposé entre la première lentille et la seconde lentille et qui peut dévier le faisceau d'ions ; et une troisième alimentation électrique en tension 110 qui est connectée à la seconde lentille, la seconde lentille étant disposée plus près d'un côté chambre d'échantillon que la première lentille, et la troisième alimentation électrique en tension étant connectée à la première alimentation électrique en tension et étant amenée à flotter par la tension de sortie de la première alimentation électrique en tension.
Priority Applications (2)
| Application Number | Priority Date | Filing Date | Title |
|---|---|---|---|
| JP2025541274A JPWO2025041336A1 (fr) | 2023-08-24 | 2023-08-24 | |
| PCT/JP2023/030529 WO2025041336A1 (fr) | 2023-08-24 | 2023-08-24 | Dispositif à faisceau d'ions et procédé de réglage de faisceau de particules chargées |
Applications Claiming Priority (1)
| Application Number | Priority Date | Filing Date | Title |
|---|---|---|---|
| PCT/JP2023/030529 WO2025041336A1 (fr) | 2023-08-24 | 2023-08-24 | Dispositif à faisceau d'ions et procédé de réglage de faisceau de particules chargées |
Publications (1)
| Publication Number | Publication Date |
|---|---|
| WO2025041336A1 true WO2025041336A1 (fr) | 2025-02-27 |
Family
ID=94731972
Family Applications (1)
| Application Number | Title | Priority Date | Filing Date |
|---|---|---|---|
| PCT/JP2023/030529 Pending WO2025041336A1 (fr) | 2023-08-24 | 2023-08-24 | Dispositif à faisceau d'ions et procédé de réglage de faisceau de particules chargées |
Country Status (2)
| Country | Link |
|---|---|
| JP (1) | JPWO2025041336A1 (fr) |
| WO (1) | WO2025041336A1 (fr) |
Citations (2)
| Publication number | Priority date | Publication date | Assignee | Title |
|---|---|---|---|---|
| US20100187436A1 (en) * | 2009-01-23 | 2010-07-29 | Ict Integrated Circuit Testing Gesellschaft Fur Halbleiterpruftechnik Mbh | High resolution gas field ion column |
| JP2014089953A (ja) * | 2012-10-25 | 2014-05-15 | Fei Co | 粒子ビーム・カラムと一体のリターディング電界型分析器 |
-
2023
- 2023-08-24 WO PCT/JP2023/030529 patent/WO2025041336A1/fr active Pending
- 2023-08-24 JP JP2025541274A patent/JPWO2025041336A1/ja active Pending
Patent Citations (2)
| Publication number | Priority date | Publication date | Assignee | Title |
|---|---|---|---|---|
| US20100187436A1 (en) * | 2009-01-23 | 2010-07-29 | Ict Integrated Circuit Testing Gesellschaft Fur Halbleiterpruftechnik Mbh | High resolution gas field ion column |
| JP2014089953A (ja) * | 2012-10-25 | 2014-05-15 | Fei Co | 粒子ビーム・カラムと一体のリターディング電界型分析器 |
Also Published As
| Publication number | Publication date |
|---|---|
| JPWO2025041336A1 (fr) | 2025-02-27 |
Similar Documents
| Publication | Publication Date | Title |
|---|---|---|
| EP1150327B1 (fr) | Dispositif multi-faisceaux de particules chargées | |
| JP5498955B2 (ja) | 試料を分析及び/又は加工するための装置及び方法 | |
| KR102373865B1 (ko) | 하전 입자 빔 시료 검사 시스템 및 그 동작 방법 | |
| JP6554288B2 (ja) | 荷電粒子線装置 | |
| US6825475B2 (en) | Deflection method and system for use in a charged particle beam column | |
| US11430630B2 (en) | Charged particle beam apparatus | |
| US7851768B2 (en) | Ultra high precision measurement tool with control loop | |
| JP4527289B2 (ja) | オージェ電子の検出を含む粒子光学装置 | |
| US8866102B2 (en) | Electron beam device with tilting and dispersion compensation, and method of operating same | |
| JP2015216086A (ja) | 荷電粒子線装置及び当該装置を用いる検査方法 | |
| WO2017018432A1 (fr) | Dispositif à faisceau de particules chargées | |
| US6380546B1 (en) | Focusing assembly and method for a charged particle beam column | |
| US8803102B2 (en) | Retarding field analyzer integral with particle beam column | |
| US9741525B1 (en) | Charged-particle microscope with astigmatism compensation and energy-selection | |
| WO2003100815A2 (fr) | Colonne a faisceau de particules chargees et procede de direction d'un faisceau de particules chargees | |
| JP6802628B2 (ja) | 高分解能荷電粒子ビーム装置および該装置を動作させる方法 | |
| US7638777B2 (en) | Imaging system with multi source array | |
| EP2110844A1 (fr) | Mesure sans contact d'un courant de faisceau dans un système de faisceaux chargés de particules | |
| EP2124245A1 (fr) | Outil de mesure à précision très élevée | |
| JP2018190731A (ja) | 粒子ビームを生成するための粒子源及び粒子光学装置 | |
| JP6737539B2 (ja) | 荷電粒子線装置 | |
| WO2025041336A1 (fr) | Dispositif à faisceau d'ions et procédé de réglage de faisceau de particules chargées | |
| US9543115B2 (en) | Electron microscope | |
| JP5592136B2 (ja) | チップ先端構造検査方法 | |
| US20250046562A1 (en) | Objective lens and charged particle beam apparatus including same |
Legal Events
| Date | Code | Title | Description |
|---|---|---|---|
| 121 | Ep: the epo has been informed by wipo that ep was designated in this application |
Ref document number: 23949792 Country of ref document: EP Kind code of ref document: A1 |
|
| ENP | Entry into the national phase |
Ref document number: 2025541274 Country of ref document: JP Kind code of ref document: A |
|
| WWE | Wipo information: entry into national phase |
Ref document number: 2025541274 Country of ref document: JP |