CN111982949A - A method for separating overlapping peaks of EDXRF spectrum by combining the fourth derivative with three-spline wavelet transform - Google Patents
A method for separating overlapping peaks of EDXRF spectrum by combining the fourth derivative with three-spline wavelet transform Download PDFInfo
- Publication number
- CN111982949A CN111982949A CN202010837453.5A CN202010837453A CN111982949A CN 111982949 A CN111982949 A CN 111982949A CN 202010837453 A CN202010837453 A CN 202010837453A CN 111982949 A CN111982949 A CN 111982949A
- Authority
- CN
- China
- Prior art keywords
- peak
- signal
- derivative
- overlapping
- spectrum
- Prior art date
- Legal status (The legal status is an assumption and is not a legal conclusion. Google has not performed a legal analysis and makes no representation as to the accuracy of the status listed.)
- Granted
Links
Images


Classifications
-
- G—PHYSICS
- G01—MEASURING; TESTING
- G01N—INVESTIGATING OR ANALYSING MATERIALS BY DETERMINING THEIR CHEMICAL OR PHYSICAL PROPERTIES
- G01N23/00—Investigating or analysing materials by the use of wave or particle radiation, e.g. X-rays or neutrons, not covered by groups G01N3/00 – G01N17/00, G01N21/00 or G01N22/00
- G01N23/22—Investigating or analysing materials by the use of wave or particle radiation, e.g. X-rays or neutrons, not covered by groups G01N3/00 – G01N17/00, G01N21/00 or G01N22/00 by measuring secondary emission from the material
- G01N23/223—Investigating or analysing materials by the use of wave or particle radiation, e.g. X-rays or neutrons, not covered by groups G01N3/00 – G01N17/00, G01N21/00 or G01N22/00 by measuring secondary emission from the material by irradiating the sample with X-rays or gamma-rays and by measuring X-ray fluorescence
Landscapes
- Physics & Mathematics (AREA)
- Health & Medical Sciences (AREA)
- Life Sciences & Earth Sciences (AREA)
- Chemical & Material Sciences (AREA)
- Analytical Chemistry (AREA)
- Biochemistry (AREA)
- General Health & Medical Sciences (AREA)
- General Physics & Mathematics (AREA)
- Immunology (AREA)
- Pathology (AREA)
- Analysing Materials By The Use Of Radiation (AREA)
- Investigating, Analyzing Materials By Fluorescence Or Luminescence (AREA)
Abstract
Description
技术领域technical field
本发明涉及一种X射线荧光光谱分析的检测方法,具体为一种四次导数结合三样条小波变换分离EDXRF光谱重叠峰方法。The invention relates to a detection method for X-ray fluorescence spectrum analysis, in particular to a method for separating overlapping peaks of EDXRF spectrum by combining four derivatives with three-spline wavelet transformation.
背景技术Background technique
能量色散X射线荧光(EDXRF)光谱分析是放射线物质的一种重要检测方法,广泛的应用在地质、环境和考古等领域。其中,X荧光光谱的重叠峰分解是至关重要的环节。近年来,国内外研究人员提出了多种重叠峰分解方法。主要包括:傅里叶变换法、导数法、小波变换法、等等。但是傅里叶变换法实际操作中难度过大,导数法对信噪比要求很高,小波基的选择对小波变换法起至关重要的作用且重叠峰分离度较低时分峰误差过大。林兆培,李钰,吴慧文等人的论文:基于二次微分和小波变换的色谱重叠峰分析将二次微分与近似对称的紧支集正交系列小波变换应用于色谱的重叠峰分解,但只对分离度高于0.4的重叠峰进行分解且没有进行误差分析。而四次导对比二次微分能有效的提高分离度和去除杂峰,结合三样条小波变换法可以更准确的分离重叠峰。当X射线能量与元素接近时,会出现X荧光光谱严重重叠甚至完全重叠的情况。对于这一问题,本文提出一种四次导结合三样条小波变换的方法来解决重叠峰严重重叠的问题。Energy dispersive X-ray fluorescence (EDXRF) spectroscopy is an important detection method for radioactive substances, which is widely used in the fields of geology, environment and archaeology. Among them, the decomposition of overlapping peaks of X-ray fluorescence spectrum is a crucial link. In recent years, researchers at home and abroad have proposed a variety of overlapping peak decomposition methods. Mainly include: Fourier transform method, derivative method, wavelet transform method, and so on. However, the Fourier transform method is too difficult in practical operation, the derivative method has high requirements on the signal-to-noise ratio, the selection of the wavelet base plays a crucial role in the wavelet transform method, and the peak-division error is too large when the overlapping peak separation degree is low. The paper by Lin Zhaopei, Li Yu, Wu Huiwen, et al.: Chromatographic Overlapped Peak Analysis Based on Quadratic Differentiation and Wavelet Transform The quadratic differential and the approximately symmetric compactly supported orthogonal series wavelet transform are applied to the overlapping peak decomposition of chromatograms, but only Overlapping peaks with a resolution higher than 0.4 were resolved and no error analysis was performed. The quadratic derivative can effectively improve the resolution and remove the impurity peaks compared with the quadratic derivative. Combined with the three-spline wavelet transform method, the overlapping peaks can be separated more accurately. When the X-ray energy is close to the element, the X-ray fluorescence spectrum will be seriously overlapped or even completely overlapped. For this problem, this paper proposes a method of quadratic derivative combined with three-spline wavelet transform to solve the problem of serious overlapping of overlapping peaks.
发明内容SUMMARY OF THE INVENTION
本发明的目的在于提供一种四次导数结合三样条小波变换分离EDXRF光谱重叠峰方法,此方法能有效的分解分离度较低的重叠峰,且在解决EDXRF光谱的重叠峰现象具有实用性。The object of the present invention is to provide a method for separating overlapping peaks of EDXRF spectrum by combining four-derivative and three-spline wavelet transform, this method can effectively decompose overlapping peaks with lower separation degree, and has practicality in solving the overlapping peak phenomenon of EDXRF spectrum .
本发明采用的技术方案如下:一种四次导数结合三样条小波变换分离EDXRF光谱重叠峰方法,其特征是步骤如下:The technical scheme adopted in the present invention is as follows: a method for separating the overlapping peaks of EDXRF spectrum by combining four derivative with three-spline wavelet transform, which is characterized in that the steps are as follows:
第1步,对EDXRF光谱信号进行四次微分处理,使重叠峰的分离度变大;The first step is to perform four differential processing on the EDXRF spectral signal to make the separation degree of the overlapping peaks larger;
第2步,利用三样条小波变换对四次微分处理过的信号进行多尺度分解,找出重叠峰所在的合适尺度高频离散细节信号;The second step is to use the three-spline wavelet transform to perform multi-scale decomposition on the signal processed by the quadratic differentiation, and find the appropriate scale high-frequency discrete detail signal where the overlapping peak is located;
第3步,对高频离散细节信号乘以一个大于1的系数进行一定比例的放大;The third step is to multiply the high-frequency discrete detail signal by a coefficient greater than 1 to amplify a certain proportion;
第4步,利用放大后的高频离散细节信号进行小波反变换重构信号,得到分离的重叠峰。Step 4: Use the amplified high-frequency discrete detail signal to perform wavelet inverse transform to reconstruct the signal to obtain separated overlapping peaks.
本发明所述四次导数法定义为:假设一个离散信号为X={x1,x2,...,xn},那么他的导数谱可以表示为:The fourth derivative method of the present invention is defined as: assuming a discrete signal is X={x 1 , x 2 ,..., x n }, then its derivative spectrum can be expressed as:

上式中,n为导数阶数,n≥1;h为步长;导数谱有如下性质;In the above formula, n is the derivative order, n≥1; h is the step size; the derivative spectrum has the following properties;
(1)信号函数的偶数阶导数极值点或奇数阶导数的零点是原始信号函数的极值点;(1) The extremum point of the even-order derivative of the signal function or the zero point of the odd-order derivative is the extremum point of the original signal function;
(2)信号函数的偶数阶导数极值点或奇数阶导数的极值点点是原始信号函数的形变点;(2) The extreme point of the even-order derivative or the extreme point of the odd-order derivative of the signal function is the deformation point of the original signal function;
(3)信号函数额波形随着导数阶数增加,峰宽变得越来越小,且峰型变得越来越尖锐。(3) As the derivative order of the signal function increases, the peak width becomes smaller and the peak shape becomes sharper.
本发明所述三样条小波变换进行重叠峰分解的方法为:选择尺度函数和小波函数,然后将重叠信号进行离散化小波变换,进而得到不同尺度上的分量,其中高频部分代表能谱峰信号,对高频信号进行乘以一个加权系数而将其进行分解;The method for decomposing overlapping peaks by the three-spline wavelet transform of the present invention is as follows: selecting a scale function and a wavelet function, then discretizing the overlapping signal by wavelet transform, and then obtaining components on different scales, wherein the high-frequency part represents energy spectrum peaks signal, the high-frequency signal is multiplied by a weighting coefficient to decompose it;
设m为自然数,则定义m阶B样条Nm(x)如下:Let m be a natural number, then define the m-order B-spline N m (x) as follows:


通过递推的形式可以得到B样条,首先,取N1(x)为Haar尺度函数,然后通过Nm-1(x)和N1(x)作卷积来定义Nm(x);如果将(2)式中取:The B-spline can be obtained by recursion. First, take N 1 (x) as the Haar scale function, and then define N m (x) by convolution of N m-1 (x) and N 1 (x); If the formula (2) is taken as:

并定义
本发明所述第1步中分离度的定义具体为:分离度R是描述相邻两峰之间重叠度的一个指标,其定义为The definition of the degree of separation in the first step of the present invention is specifically: the degree of separation R is an index describing the degree of overlap between two adjacent peaks, which is defined as

R的值越小,重叠度越高;The smaller the value of R, the higher the degree of overlap;
重叠谱峰通常有三种峰信号进行模拟分别是Gaussian峰信号、Lorentzian峰信号以及Tsallis峰信号;Overlapping spectral peaks usually have three peak signals for simulation: Gaussian peak signal, Lorentzian peak signal and Tsallis peak signal;
Gaussian峰信号:Gaussian peak signal:

Lorentzian峰信号:Lorentzian peak signal:
f(x)=Aσ2/[(x-μ)2+σ2] (7)f(x)=Aσ 2 /[(x-μ) 2 +σ 2 ] (7)
Tsallis峰信号:Tsallis peak signal:

上式中,σ是峰的宽度,A表示峰值,μ是峰的顶点位置;而Gaussian峰和Lorentzian峰可以通过Tsallis峰调节q得到;当q接近1为Gaussian峰,q=2的时候为Lorentzian峰;选用Tsallis峰信号进行建模。In the above formula, σ is the width of the peak, A represents the peak value, and μ is the apex position of the peak; while the Gaussian peak and the Lorentzian peak can be obtained by adjusting the q of the Tsallis peak; when q is close to 1, it is the Gaussian peak, and when q=2, it is the Lorentzian peak. peak; select the Tsallis peak signal for modeling.
如取q=1.8,同时取A的值分别为2,1.5,1.5;σ分别取4,2,1;μ分别取20,24,28;即峰位位20,24,28;而峰1和峰2的R1为0.33,峰2和峰3的R2为0.67。If q=1.8, the values of A are 2, 1.5, 1.5 respectively; σ is 4, 2, 1; μ is 20, 24, 28; that is, the peak positions are 20, 24, 28; and the
本发明的优点是:本方案提出了一种四次导结合三样条小波变换分解重叠峰的新方法;通过模拟实验证明可以有效的分解重叠峰。然后,用此方法处理了仿真能量色散X荧光(EDXRF)光谱以及实测X荧光光谱,都实现了重叠峰的分解且误差较小,可以实现元素的辨别。结果证明:此方法能有效的分解分离度较低的重叠峰,且在解决EDXRF光谱的重叠峰现象具有实用性。The advantages of the invention are as follows: the scheme proposes a new method for decomposing overlapping peaks by combining quartic derivative and three-spline wavelet transform; simulation experiments prove that overlapping peaks can be effectively decomposed. Then, the simulated energy dispersive X-fluorescence (EDXRF) spectrum and the measured X-fluorescence spectrum were processed with this method, and the decomposition of overlapping peaks was achieved with less error, and element identification could be achieved. The results show that this method can effectively decompose overlapping peaks with low resolution, and is practical in solving the overlapping peak phenomenon of EDXRF spectrum.
附图说明Description of drawings
图1为本发明三阶样条小波bior3.5分解低通滤波器系数示意图。FIG. 1 is a schematic diagram of the coefficients of a low-pass filter decomposed by a third-order spline wavelet bior3.5 according to the present invention.
图2为本发明三阶样条小波bior3.5分解高通滤波器系数示意图。FIG. 2 is a schematic diagram of the coefficients of the high-pass filter decomposed by the third-order spline wavelet bior3.5 according to the present invention.
图3为本发明三阶样条小波bior3.5重构通滤波器系数示意图。FIG. 3 is a schematic diagram of the coefficients of the third-order spline wavelet bior3.5 reconstructed pass filter according to the present invention.
图4为本发明三阶样条小波bior3.5重构低通滤波器系数示意图。FIG. 4 is a schematic diagram of the low-pass filter coefficients reconstructed by the third-order spline wavelet bior3.5 according to the present invention.
图5为本发明模拟信号重叠峰示意图。FIG. 5 is a schematic diagram of overlapping peaks of analog signals of the present invention.
图6为本发明四次导初步处理模拟信号示意图。FIG. 6 is a schematic diagram of an analog signal preliminarily processed by the fourth derivative of the present invention.
图7为本发明重叠峰分解模拟结果示意图。FIG. 7 is a schematic diagram of the simulation result of overlapping peak decomposition according to the present invention.
图8为本发明重叠峰分解仿真结果示意图。FIG. 8 is a schematic diagram of a simulation result of overlapping peak decomposition in the present invention.
图9为本发明实测T铅黄铜元素的X荧光光谱示意图。9 is a schematic diagram of the X-ray fluorescence spectrum of the measured T lead brass element of the present invention.
图10为本发明实测T铅黄铜元素的重叠峰分解结果示意图。FIG. 10 is a schematic diagram of the decomposition results of the overlapping peaks of the measured T lead brass element of the present invention.
图11为本发明实测轻元素的X荧光光谱示意图。FIG. 11 is a schematic diagram of the X-fluorescence spectrum of the light element measured in the present invention.
图12为本发明实测轻元素的分解结果示意图。FIG. 12 is a schematic diagram of the decomposition result of the measured light elements in the present invention.
具体实施方式Detailed ways
本发明是这样来工作和实施的,能量色散X射线荧光(EDXRF)光谱中待测元素的信息包含在特征峰峰位和特征峰净峰面积中。对于特征峰的准确检测是EDXRF光谱分析的关键。很多元素的特征X射线之间的能量差非常小,特别是在在低原子序数中,荧光光谱产生过程中又存在各种干扰导致实测X荧光数据的谱峰会严重的重叠,本发明以重叠峰作为研究对象,提出一种四次导数结合三样条小波变换处理重叠峰的方法。通过数学模型模拟重叠峰检测了该方法的可行性,并仿真了实测X荧光光谱数据进行检测得到良好的效果,最后使用了CIT-3000SY X荧光元素录井仪实测T铅黄铜数据和混合轻元素数据荧光光谱作为验证。The present invention works and is carried out in such a way that the information of the analyte in the energy dispersive X-ray fluorescence (EDXRF) spectrum is contained in the characteristic peak position and the characteristic peak net peak area. Accurate detection of characteristic peaks is the key to EDXRF spectral analysis. The energy difference between the characteristic X-rays of many elements is very small, especially in the low atomic number, there are various interferences in the fluorescence spectrum generation process, resulting in the serious overlapping of the spectral peaks of the measured X-fluorescence data. The present invention uses the overlapping peaks. As the research object, a method of dealing with overlapping peaks with the combination of the fourth derivative and the three-spline wavelet transform is proposed. The feasibility of the method was tested by simulating overlapping peaks with a mathematical model, and the measured X fluorescence spectrum data was simulated to obtain good results. Finally, the CIT-3000SY X fluorescence element logging instrument was used to measure the T lead-brass data and mixed light Elemental data fluorescence spectra were used as validation.
本发明首先详细介绍了导数法以及三样条小波法分解重叠的原理。导数法阶数越高信号越畸形但可以有效提高重峰分离度,而三样条小波变换对低分离度重峰处理较为无力但能有效的保持峰型。通过模拟数据发现,其中三个重叠峰中的峰1和峰2的分离度R=0.33,峰2和峰3的分离度R=0.67,经过四阶导之后信号存在一定的重叠,但是四阶导处理后不仅保留了信号的峰位值,并且出现了分离度变大的现象,结合三样条小波变换的特点,通过调节分解层次的数值以及对高频信号乘以一个大于1的系数进行一定比例的放大再进行重构,结果实现了对模拟重叠峰的分解。其中对三样条小波的分解层数为四层高频放大系数为六倍。然后,进行了仿真K元素的重叠光谱,实现了重叠峰的分解,通过仿真实验表明新方法能准确的识别峰位,且误差在1%以内,证明了新方法对X荧光光谱重叠峰分解的适用性。验证了此方法对分解重叠峰具有可行性。最后用此方法对CIT-3000SY X荧光元素录井仪实测T铅黄铜元素数据以及混合轻元素数据X荧光光谱进行处理,实现了对重叠峰的分解,且分解后的峰位误差控制在1%之内,具有较高的准确率。The present invention first introduces the principle of the derivative method and the three-spline wavelet method for decomposing and overlapping in detail. The higher the derivative method is, the more deformed the signal is, but it can effectively improve the resolution of the double peaks, while the three-spline wavelet transform is weaker to deal with the low resolution double peaks, but it can effectively maintain the peak shape. Through the simulation data, it is found that the separation degree of
1、导数法。1. Derivative method.
导数的定义:假设一个离散信号为X={x1,x2,...,xn},那么他的导数谱可以表示为:Definition of derivative: Assuming a discrete signal is X={x 1 , x 2 ,...,x n }, then its derivative spectrum can be expressed as:

上式中,n为导数阶数,n≥1;h为步长。导数谱有如下性质;In the above formula, n is the derivative order, n≥1; h is the step size. The derivative spectrum has the following properties;
(1)信号函数的偶数阶导数极值点或奇数阶导数的零点是原始信号函数的极值点。(1) The extremum point of the even-order derivative of the signal function or the zero point of the odd-order derivative is the extremum point of the original signal function.
(2)信号函数的偶数阶导数极值点或奇数阶导数的极值点点是原始信号函数的形变点。(2) The extremum point of the even-order derivative or the extremum point of the odd-order derivative of the signal function is the deformation point of the original signal function.
(3)信号函数额波形随着导数阶数增加,峰宽变得越来越小,且峰型变得越来越尖锐。(3) As the derivative order of the signal function increases, the peak width becomes smaller and the peak shape becomes sharper.
有文献表明,四阶导数法能有效去除谱中的细小杂峰,可将重叠的特征峰分离,四阶导数对重叠峰的分辨效果优于一阶和二阶导数。导数用于定位X荧光能谱特征峰的理论成熟简单,适用性广。根据导数谱的上述性质可知,对能谱信号进行四阶导数法之后,信号的每一个极值点和零点都能清晰的显示出来,同时使得信号的半峰宽变小,峰型变尖锐,从而使得严重重叠的重叠峰信号出现初步的分离,并且具有对重叠峰进行分辨的基础,并能精确的的判断信号的精细的结构。但是由于导数使用阶数越高噪声随之放大的特点在具体使用过程中不能得到更广泛的推广,所以急需一种方法能让导数发挥作用。Some literatures show that the fourth-order derivative method can effectively remove the small impurity peaks in the spectrum, and can separate the overlapping characteristic peaks. The theory of using derivative to locate characteristic peaks of X-ray fluorescence spectrum is mature and simple, and has wide applicability. According to the above properties of the derivative spectrum, after the fourth-order derivative method is performed on the energy spectrum signal, each extreme point and zero point of the signal can be clearly displayed, and the half-peak width of the signal becomes smaller and the peak shape becomes sharper. Thereby, the signals of the overlapping peaks that are seriously overlapped are initially separated, and the basis for distinguishing the overlapping peaks is provided, and the fine structure of the signal can be accurately judged. However, due to the characteristic that the higher the derivative is used, the noise will be amplified, which cannot be widely promoted in the specific application process, so a method is urgently needed to make the derivative work.
2、三样条小波变换理论。2. Three-spline wavelet transform theory.
对于不同的样条小波基,由于其滤波器不相同的,因此分解重叠峰的效果也不相同。二阶样条小波基分解出的峰型为锯齿状,四阶样条小波基分解出的峰位值误差较大。三阶样条小波基的重叠峰分解效果较好,分解重叠峰后所得的信号的峰位置不变、峰面积误差也较小,鉴于样条小波的优势。所以选用三阶样条小波基。For different spline wavelet bases, because of the different filters, the effect of decomposing overlapping peaks is also different. The peak shape decomposed by the second-order spline wavelet base is jagged, and the peak position value decomposed by the fourth-order spline wavelet base has a large error. The overlapping peak decomposition effect of the third-order spline wavelet base is better, the peak position of the signal obtained after decomposing the overlapping peak remains unchanged, and the peak area error is also small, considering the advantages of spline wavelet. Therefore, the third-order spline wavelet basis is used.
2.1、样条小波的性质和定义:利用小波变换进行重叠峰分解的基本思路为:首先选择适当的尺度函数和小波函数,然后将重叠信号进行离散化小波变换,进而得到不同尺度上的分量,其中高频部分代表能谱峰信号,最后对高频信号进行乘以一个加权系数而将其进行分解。2.1. The nature and definition of spline wavelet: The basic idea of using wavelet transform to decompose overlapping peaks is: first select the appropriate scale function and wavelet function, and then perform discrete wavelet transform on the overlapping signal, and then obtain components on different scales, The high frequency part represents the peak signal of the energy spectrum, and finally the high frequency signal is multiplied by a weighting coefficient to decompose it.
设m为自然数,则定义m阶B样条Nm(x)如下:Let m be a natural number, then define the m-order B-spline N m (x) as follows:


通过递推的形式可以得到B样条,首先,取N1(x)为Haar尺度函数,然后通过Nm-1(x)和N1(x)作卷积来定义Nm(x)。如果将(2)式中取:The B-spline can be obtained by recursion. First, take N 1 (x) as the Haar scale function, and then define N m (x) by convolution of N m-1 (x) and N 1 (x). If the formula (2) is taken as:

并定义
如图1-4所示给出了三阶样条小波bior3.5的低通和高通滤波器系数。The low-pass and high-pass filter coefficients of the third-order spline wavelet bior3.5 are shown in Figure 1-4.
2.2、四阶导数法结合三阶B样条小波算法实现步骤如下:2.2. The fourth-order derivative method combined with the third-order B-spline wavelet algorithm realizes the following steps:
第1步,对信号进行四次微分处理,使重叠峰的分离度变大;Step 1: Differentiate the signal four times to make the separation of overlapping peaks larger;
第2步,利用小波变换对四次微分处理过的信号进行多尺度分解,找出重叠峰所在的合适尺度高频离散细节信号;Step 2: Use wavelet transform to perform multi-scale decomposition on the signal processed by the quadratic differentiation, and find out the appropriate scale high-frequency discrete detail signal where the overlapping peaks are located;
第3步,对高频信号乘以一个大于1的系数进行一定比例的放大;The third step is to multiply the high-frequency signal by a coefficient greater than 1 to amplify a certain proportion;
第4步,利用放大后的高频细节信号进行小波反变换重构信号,得到分离的重叠峰。Step 4: Use the amplified high-frequency detail signal to perform wavelet inverse transform to reconstruct the signal to obtain separated overlapping peaks.
3、四次导结合三样条小波变换分解低分离度重叠峰。3. Quadratic derivative combined with three-spline wavelet transform to decompose overlapping peaks with low separation degree.
分离度R是描述相邻两峰之间重叠度的一个指标,其定义为The degree of separation R is an index describing the degree of overlap between two adjacent peaks, which is defined as

R的值越小,重叠度越高。The smaller the value of R, the higher the degree of overlap.
重叠谱峰通常有三种峰信号进行模拟分别是Gaussian峰信号、Lorentzian峰信号以及Tsallis峰信号。There are usually three kinds of peak signals for overlapping spectral peaks to simulate: Gaussian peak signal, Lorentzian peak signal and Tsallis peak signal.
Gaussian峰信号:Gaussian peak signal:

Lorentzian峰信号:Lorentzian peak signal:
f(x)=Aσ2/[(x-μ)2+σ2] (7)f(x)=Aσ 2 /[(x-μ) 2 +σ 2 ] (7)
Tsallis峰信号:Tsallis peak signal:

上式中,σ是峰的宽度,A表示峰值,μ是峰的顶点位置。而Gaussian峰和Lorentzian峰可以通过Tsallis峰调节q得到。当q接近1为Gaussian峰,q=2的时候为Lorentzian峰。因此,选用Tsallis峰信号进行建模更具有代表性。In the above formula, σ is the width of the peak, A represents the peak value, and μ is the position of the apex of the peak. The Gaussian and Lorentzian peaks can be obtained by adjusting the q of the Tsallis peak. When q is close to 1, it is a Gaussian peak, and when q=2, it is a Lorentzian peak. Therefore, it is more representative to use the Tsallis peak signal for modeling.
取q=1.8,同时取A的值分别为2,1.5,1.5。σ分别取4,2,1。μ分别取20,24,28。即峰位位20,24,28。而峰1和峰2的R1为0.33,峰2和峰3的R2为0.67。图5可以看出峰1峰2严重重叠峰2峰三部分重叠,并且接近实际的重叠峰信号。Take q=1.8, and take the value of A as 2, 1.5, and 1.5 respectively. σ takes 4, 2, and 1 respectively. μ is taken as 20, 24, and 28 respectively. That is, the peak positions are 20, 24, and 28. While R1 for
如图6所示,通过四阶导初步处理后峰的位置和峰数都显示清楚,所以利用四阶导进行初步处理是可行,但同时可以看到经过四阶导之后信号存在一定的重叠,所以需要另一种方法进行进一步的处理。As shown in Figure 6, the position and number of peaks are clearly displayed after preliminary processing by the fourth-order derivative, so it is feasible to use the fourth-order derivative for preliminary processing, but at the same time, it can be seen that there is a certain overlap in the signals after the fourth-order derivative. So another method is needed for further processing.
如图7所示,通过对模拟信号进行四阶导初步处理在进行三样条小波处理,模拟信号峰的峰位为20,24,28。处理后的峰位为19.9,24.2和27.8峰位的误差分别为0.05%,0.83%以及0.71%。分解效果理想误差小,可以达到定量定性分析要求。结果表明四次导结合三样条小波变换可以有效分解重叠峰。As shown in FIG. 7 , the three-spline wavelet processing is performed by performing preliminary processing of the fourth-order derivative on the analog signal, and the peak positions of the analog signal peaks are 20, 24, and 28. The errors of the processed peak positions at 19.9, 24.2 and 27.8 are 0.05%, 0.83% and 0.71%, respectively. The decomposition effect is ideal and the error is small, which can meet the requirements of quantitative and qualitative analysis. The results show that the quartic derivative combined with the three-spline wavelet transform can effectively decompose the overlapping peaks.
表1峰位结果分析Table 1 Analysis of peak position results
Table 1 Peak position analysisTable 1 Peak position analysis

4、光谱仿真实验分析。4. Analysis of spectral simulation experiments.
据X射线能量表:K元素的Kα为3.313keV,Kβ为3.589keV,能量仅差279keV;当光谱仪测量K元素时,光谱峰会产生严重的重叠。已知一组K系谱线不重叠的光谱,识别其能量峰道址为标准能量峰道址,进行能量线性刻度E=0.0307keV/ch。K元素的KαKβ能量道址分别为113与122。用式(8)进行模拟EDXRF光谱中存在的低分离度重叠峰。KαKβ能量峰的比值为5:1。模拟表达式如(9)所示,结果如图8所示。According to the X-ray energy table: K α of K element is 3.313 keV, K β is 3.589 keV, and the energy difference is only 279 keV; when the K element is measured by the spectrometer, the spectral peaks are seriously overlapped. Knowing a set of spectra with non-overlapping K series lines, identify its energy peak track address as the standard energy peak track address, and carry out the energy linear scale E=0.0307keV/ch. The K α K β energy addresses of element K are 113 and 122, respectively. The low-resolution overlapping peaks present in the EDXRF spectra were simulated using equation (8). The ratio of KαKβ energy peaks is 5:1. The simulation expression is shown in (9), and the result is shown in Figure 8.

如图8所示,模拟EDXRF光谱的重叠峰得到了分解,且图8中的原始谱线中的重叠峰用肉眼已经很难观察。识别分解后的峰位,结果如表2所示,重叠峰分解结果误差小于1%。根据结果表明,四次导结合三样条小波变换能较好的分解EDXRF光谱中的重叠峰。As shown in Figure 8, the overlapping peaks of the simulated EDXRF spectrum are decomposed, and the overlapping peaks in the original spectral line in Figure 8 are already difficult to observe with the naked eye. Identify the peak positions after decomposition, and the results are shown in Table 2. The error of the decomposition results of overlapping peaks is less than 1%. According to the results, the quartic derivative combined with the three-spline wavelet transform can better decompose the overlapping peaks in the EDXRF spectrum.
表2峰位结果分析Table 2 Analysis of peak position results
Table 2 Peak position analysisTable 2 Peak position analysis

5、实测X荧光数据解析结果。5. Measured X-ray fluorescence data analysis results.
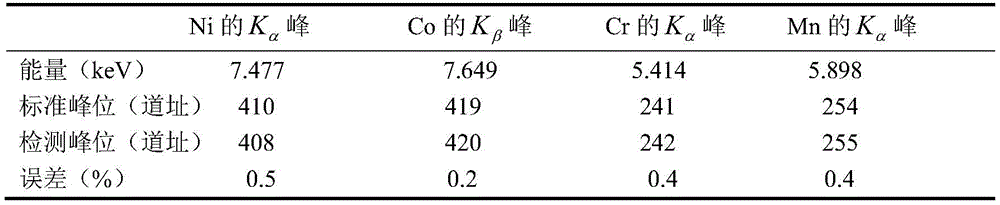
在本实验中采用的是CIT-3000SY X荧光元素录井仪实测的T铅黄铜元素数据以及混合轻元素数据,在T铅黄铜数据中在道址400-430之间Ni的Kα以及Co的Kβ能量分别为7.477和7.649kev,仅相差0.172kev,处于严重重叠状态。而在轻元素数据中,可以观察到在道址230-270之间的Cr和Mn元素存在严重重叠,能量相差0.484kev,对于元素辨别造成较大困难。对这两组本组数据已经进行过谱光滑本底扣除等预处理,然后进行四阶微分结合三样条小波分解,其中小波分解层数为四层,放大系数为6倍。分解结果如下图9-12所示。In this experiment, the T lead brass element data and mixed light element data measured by the CIT-3000SY X fluorescence element logging instrument are used. In the T lead brass data, the K α of Ni and the The K β energies of Co are 7.477 and 7.649 kev, respectively, with a difference of only 0.172 kev, which is in a state of severe overlap. In the light element data, it can be observed that the Cr and Mn elements between the sites 230-270 have a serious overlap, and the energy difference is 0.484kev, which makes it difficult to distinguish the elements. These two groups of data have been preprocessed by spectral smoothing background subtraction, and then the fourth-order differential combined with three-spline wavelet decomposition, in which the number of wavelet decomposition layers is four, and the amplification factor is 6 times. The decomposition result is shown in Figure 9-12 below.
已知Ni的Kα标准峰位410,Co的Kβ为419道址,用寻峰法识别分解后的光谱峰位为408、420道址,误差仅为0.5%,0.2%,Cr和Mn的标准峰位分别为241道址和254道址,分解后的误差仅为0.4%。且重叠峰分解效果明显,结果表明:四阶导结合三样条小波分解实际X荧光谱中分离度较低的重叠峰具有精确的结果。It is known that the standard peak position of K α of Ni is 410, and the K β of Co is 419. The peak positions of the decomposed spectrum are identified by the peak-finding method as 408 and 420, and the error is only 0.5%, 0.2%, Cr and Mn. The standard peak positions of 241 and 254 are respectively, and the error after decomposition is only 0.4%. And the decomposition effect of the overlapping peaks is obvious. The results show that the fourth-order derivative combined with the three-spline wavelet decomposes the overlapping peaks with low resolution in the actual X-fluorescence spectrum to obtain accurate results.
表3峰位值结果分析Table 3 Analysis of peak value results
Table 3 Peak position analysisTable 3 Peak position analysis
6、研究结果。6. Research results.
本发明详细研究了导数法以及样条小波法,提出了一种四次导结合三样条小波变换分解重叠峰的新方法。通过模拟实验证明可以有效的分解重叠峰。然后,用此方法处理了仿真能量色散X荧光光谱以及实测EDXRF光谱,都实现了重叠峰的分解且误差较小,可以实现元素的辨别。结果证明:此方法能有效的分解分离度较低的重叠峰,且在解决EDXRF光谱的重叠峰现象具有实用性。The invention studies the derivative method and the spline wavelet method in detail, and proposes a new method of decomposing overlapping peaks by combining the quadratic derivative and the three-spline wavelet transform. It is proved by simulation experiments that overlapping peaks can be decomposed effectively. Then, the simulated energy dispersive X-ray fluorescence spectrum and the measured EDXRF spectrum were processed with this method, and the decomposition of overlapping peaks was achieved with less error, and the identification of elements could be realized. The results show that this method can effectively decompose overlapping peaks with low resolution, and is practical in solving the overlapping peak phenomenon of EDXRF spectrum.
Claims (5)


Priority Applications (1)
| Application Number | Priority Date | Filing Date | Title |
|---|---|---|---|
| CN202010837453.5A CN111982949B (en) | 2020-08-19 | 2020-08-19 | Method for separating EDXRF spectrum overlapping peak by combining fourth derivative with three-spline wavelet transform |
Applications Claiming Priority (1)
| Application Number | Priority Date | Filing Date | Title |
|---|---|---|---|
| CN202010837453.5A CN111982949B (en) | 2020-08-19 | 2020-08-19 | Method for separating EDXRF spectrum overlapping peak by combining fourth derivative with three-spline wavelet transform |
Publications (2)
| Publication Number | Publication Date |
|---|---|
| CN111982949A true CN111982949A (en) | 2020-11-24 |
| CN111982949B CN111982949B (en) | 2022-06-07 |
Family
ID=73435544
Family Applications (1)
| Application Number | Title | Priority Date | Filing Date |
|---|---|---|---|
| CN202010837453.5A Active CN111982949B (en) | 2020-08-19 | 2020-08-19 | Method for separating EDXRF spectrum overlapping peak by combining fourth derivative with three-spline wavelet transform |
Country Status (1)
| Country | Link |
|---|---|
| CN (1) | CN111982949B (en) |
Cited By (1)
| Publication number | Priority date | Publication date | Assignee | Title |
|---|---|---|---|---|
| CN113189035A (en) * | 2021-05-07 | 2021-07-30 | 福建加谱新科科技有限公司 | Step-stacked Fourier transform differential method |
Citations (39)
| Publication number | Priority date | Publication date | Assignee | Title |
|---|---|---|---|---|
| EP0299652A1 (en) * | 1987-07-15 | 1989-01-18 | Hewlett-Packard Company | Baseline correction for chromatography |
| EP1128311A2 (en) * | 2000-02-15 | 2001-08-29 | Mark W. Perlin | A method and system for DNA analysis |
| EP1209454A1 (en) * | 1997-05-19 | 2002-05-29 | Bookham Technology PLC | Apparatus and method for light spectrum measurement |
| US20030063854A1 (en) * | 2001-09-28 | 2003-04-03 | Andrzej Barwicz | Method for extracting spectral parameters of channels from non-channelised light |
| WO2004038602A1 (en) * | 2002-10-24 | 2004-05-06 | Warner-Lambert Company, Llc | Integrated spectral data processing, data mining, and modeling system for use in diverse screening and biomarker discovery applications |
| WO2004111609A2 (en) * | 2003-06-12 | 2004-12-23 | Predicant Biosciences, Inc. | Methods for accurate component intensity extraction from separations-mass spectrometry data |
| WO2005040985A2 (en) * | 2003-10-20 | 2005-05-06 | Cerno Bioscience Llc | Methods for calibrating mass spectrometry (ms) and other instrument systems and for processing ms and other data |
| CA2533961A1 (en) * | 2005-03-24 | 2006-09-24 | F. Hoffmann-La Roche Ag | Method for processing a set of spectra, particularly nmr spectra |
| US20070095157A1 (en) * | 2002-06-03 | 2007-05-03 | Lingren Clinton L | Method and apparatus for analysis of elements in bulk substance |
| CN101430276A (en) * | 2008-12-15 | 2009-05-13 | 北京航空航天大学 | Wavelength variable optimization method in spectrum analysis |
| US20090171591A1 (en) * | 2007-12-28 | 2009-07-02 | Weyerhaeuser Company | Methods for classification of somatic embryos comprising hyperspectral line imaging |
| JP2010145258A (en) * | 2008-12-19 | 2010-07-01 | Yazaki Corp | Gas analyzer |
| WO2012065267A1 (en) * | 2010-11-16 | 2012-05-24 | Thunder Bay Regional Research Institute | Methods and apparatus for alignment of interferometer |
| CN102636454A (en) * | 2012-05-15 | 2012-08-15 | 武汉工业学院 | Method for quickly measuring content of low carbon number fatty acid in edible oil by near infrared spectrum |
| CN102636509A (en) * | 2012-04-20 | 2012-08-15 | 中华人民共和国北仑出入境检验检疫局 | Method for analyzing ferrous iron in iron ore based on X fluorescence spectrum |
| CN102749381A (en) * | 2012-06-16 | 2012-10-24 | 中南大学 | Method for separating overlapping peaks of linear scanning polarographic curve |
| CN103853929A (en) * | 2014-03-17 | 2014-06-11 | 东华理工大学 | Low-resolution gamma energy spectrum inversion analysis process and method based on Monte Carlo response matrix |
| WO2014094039A1 (en) * | 2012-12-19 | 2014-06-26 | Rmit University | A background correction method for a spectrum of a target sample |
| CN103913764A (en) * | 2014-02-24 | 2014-07-09 | 东华理工大学 | NaI (TI) scintillation detector gamma energy spectrum high-resolution inversion analysis process and method based on gauss response matrix |
| CN103983617A (en) * | 2014-05-04 | 2014-08-13 | 华中科技大学 | Improved laser probe quantitative analysis method based on wavelet transform |
| WO2014200155A1 (en) * | 2013-06-13 | 2014-12-18 | 전북대학교산학협력단 | Apparatus for separating overlapping peak in spectrum and x-ray fluorescence analysis apparatus using same |
| WO2015033478A1 (en) * | 2013-09-09 | 2015-03-12 | 株式会社島津製作所 | Peak detection method |
| JP2015081908A (en) * | 2013-10-24 | 2015-04-27 | アトナープ株式会社 | Analysis method |
| CN104931518A (en) * | 2015-06-09 | 2015-09-23 | 东南大学 | Method of X-ray fluorescence spectrum background rejection |
| CN105067650A (en) * | 2015-08-03 | 2015-11-18 | 东南大学 | Method for calculating characteristic peak of derivative detection spectrum through using wavelet |
| CN105067732A (en) * | 2015-07-07 | 2015-11-18 | 天津大学 | Overlapped chromatographic peak quantitative method based on second-order Gaussian function fitting |
| WO2016065469A1 (en) * | 2014-10-27 | 2016-05-06 | Jesse Goodman | System and method for monitoring aortic pulse wave velocity and blood pressure |
| CN105675778A (en) * | 2016-01-06 | 2016-06-15 | 东南大学 | Chromatographic overlapping peak decomposition method based on dual-tree complex wavelet transform |
| CN105891397A (en) * | 2015-01-26 | 2016-08-24 | 大连达硕信息技术有限公司 | Comprehensive-two-dimensional-gas-chromatography peak detecting method |
| DE102015010602A1 (en) * | 2015-08-18 | 2017-02-23 | Hochschule Aschaffenburg | Method for analyzing a data set of a time-of-flight mass spectrometry measurement and a device |
| CN106814061A (en) * | 2016-12-13 | 2017-06-09 | 华中科技大学 | A kind of method for improving LIBS overlap peak accuracy of quantitative analysis |
| CN107860845A (en) * | 2017-11-09 | 2018-03-30 | 宁夏医科大学 | The method that automatic parsing GC MS overlap peaks accurately identify compound |
| CN107871155A (en) * | 2016-09-28 | 2018-04-03 | 成都理工大学 | A Decomposition Method of Spectral Overlapping Peaks Based on Particle Swarm Optimization |
| CN108007881A (en) * | 2017-11-30 | 2018-05-08 | 中国农业大学 | A kind of aquaculture water quality total nitrogen content detection method based on spectral technique |
| CN109085282A (en) * | 2018-06-22 | 2018-12-25 | 东南大学 | A kind of chromatographic peaks analytic method based on wavelet transformation and Random Forest model |
| JP2019045396A (en) * | 2017-09-05 | 2019-03-22 | 学校法人早稲田大学 | Raman spectroscopy measuring apparatus and Raman spectroscopy measuring method |
| CN110084212A (en) * | 2019-04-30 | 2019-08-02 | 河南师范大学 | A kind of spectral signature peak recognition positioning method based on improvement sine and cosine algorithm |
| CN110553989A (en) * | 2019-09-03 | 2019-12-10 | 无锡创想分析仪器有限公司 | method for removing spectrum baseline |
| WO2020002705A1 (en) * | 2018-06-29 | 2020-01-02 | Universiteit Antwerpen | Item inspection by radiation imaging using an iterative projection-matching approach |
-
2020
- 2020-08-19 CN CN202010837453.5A patent/CN111982949B/en active Active
Patent Citations (40)
| Publication number | Priority date | Publication date | Assignee | Title |
|---|---|---|---|---|
| EP0299652A1 (en) * | 1987-07-15 | 1989-01-18 | Hewlett-Packard Company | Baseline correction for chromatography |
| EP1209454A1 (en) * | 1997-05-19 | 2002-05-29 | Bookham Technology PLC | Apparatus and method for light spectrum measurement |
| EP1128311A2 (en) * | 2000-02-15 | 2001-08-29 | Mark W. Perlin | A method and system for DNA analysis |
| US20030063854A1 (en) * | 2001-09-28 | 2003-04-03 | Andrzej Barwicz | Method for extracting spectral parameters of channels from non-channelised light |
| US20070095157A1 (en) * | 2002-06-03 | 2007-05-03 | Lingren Clinton L | Method and apparatus for analysis of elements in bulk substance |
| WO2004038602A1 (en) * | 2002-10-24 | 2004-05-06 | Warner-Lambert Company, Llc | Integrated spectral data processing, data mining, and modeling system for use in diverse screening and biomarker discovery applications |
| WO2004111609A2 (en) * | 2003-06-12 | 2004-12-23 | Predicant Biosciences, Inc. | Methods for accurate component intensity extraction from separations-mass spectrometry data |
| WO2005040985A2 (en) * | 2003-10-20 | 2005-05-06 | Cerno Bioscience Llc | Methods for calibrating mass spectrometry (ms) and other instrument systems and for processing ms and other data |
| EP1685517A2 (en) * | 2003-10-20 | 2006-08-02 | Cerno Bioscience LLC | Methods for calibrating mass spectrometry (ms) and other instrument systems and for processing ms and other data |
| CA2533961A1 (en) * | 2005-03-24 | 2006-09-24 | F. Hoffmann-La Roche Ag | Method for processing a set of spectra, particularly nmr spectra |
| US20090171591A1 (en) * | 2007-12-28 | 2009-07-02 | Weyerhaeuser Company | Methods for classification of somatic embryos comprising hyperspectral line imaging |
| CN101430276A (en) * | 2008-12-15 | 2009-05-13 | 北京航空航天大学 | Wavelength variable optimization method in spectrum analysis |
| JP2010145258A (en) * | 2008-12-19 | 2010-07-01 | Yazaki Corp | Gas analyzer |
| WO2012065267A1 (en) * | 2010-11-16 | 2012-05-24 | Thunder Bay Regional Research Institute | Methods and apparatus for alignment of interferometer |
| CN102636509A (en) * | 2012-04-20 | 2012-08-15 | 中华人民共和国北仑出入境检验检疫局 | Method for analyzing ferrous iron in iron ore based on X fluorescence spectrum |
| CN102636454A (en) * | 2012-05-15 | 2012-08-15 | 武汉工业学院 | Method for quickly measuring content of low carbon number fatty acid in edible oil by near infrared spectrum |
| CN102749381A (en) * | 2012-06-16 | 2012-10-24 | 中南大学 | Method for separating overlapping peaks of linear scanning polarographic curve |
| WO2014094039A1 (en) * | 2012-12-19 | 2014-06-26 | Rmit University | A background correction method for a spectrum of a target sample |
| WO2014200155A1 (en) * | 2013-06-13 | 2014-12-18 | 전북대학교산학협력단 | Apparatus for separating overlapping peak in spectrum and x-ray fluorescence analysis apparatus using same |
| WO2015033478A1 (en) * | 2013-09-09 | 2015-03-12 | 株式会社島津製作所 | Peak detection method |
| JP2015081908A (en) * | 2013-10-24 | 2015-04-27 | アトナープ株式会社 | Analysis method |
| CN103913764A (en) * | 2014-02-24 | 2014-07-09 | 东华理工大学 | NaI (TI) scintillation detector gamma energy spectrum high-resolution inversion analysis process and method based on gauss response matrix |
| CN103853929A (en) * | 2014-03-17 | 2014-06-11 | 东华理工大学 | Low-resolution gamma energy spectrum inversion analysis process and method based on Monte Carlo response matrix |
| CN103983617A (en) * | 2014-05-04 | 2014-08-13 | 华中科技大学 | Improved laser probe quantitative analysis method based on wavelet transform |
| WO2016065469A1 (en) * | 2014-10-27 | 2016-05-06 | Jesse Goodman | System and method for monitoring aortic pulse wave velocity and blood pressure |
| CN105891397A (en) * | 2015-01-26 | 2016-08-24 | 大连达硕信息技术有限公司 | Comprehensive-two-dimensional-gas-chromatography peak detecting method |
| CN104931518A (en) * | 2015-06-09 | 2015-09-23 | 东南大学 | Method of X-ray fluorescence spectrum background rejection |
| CN105067732A (en) * | 2015-07-07 | 2015-11-18 | 天津大学 | Overlapped chromatographic peak quantitative method based on second-order Gaussian function fitting |
| CN105067650A (en) * | 2015-08-03 | 2015-11-18 | 东南大学 | Method for calculating characteristic peak of derivative detection spectrum through using wavelet |
| DE102015010602A1 (en) * | 2015-08-18 | 2017-02-23 | Hochschule Aschaffenburg | Method for analyzing a data set of a time-of-flight mass spectrometry measurement and a device |
| CN105675778A (en) * | 2016-01-06 | 2016-06-15 | 东南大学 | Chromatographic overlapping peak decomposition method based on dual-tree complex wavelet transform |
| CN107871155A (en) * | 2016-09-28 | 2018-04-03 | 成都理工大学 | A Decomposition Method of Spectral Overlapping Peaks Based on Particle Swarm Optimization |
| CN106814061A (en) * | 2016-12-13 | 2017-06-09 | 华中科技大学 | A kind of method for improving LIBS overlap peak accuracy of quantitative analysis |
| JP2019045396A (en) * | 2017-09-05 | 2019-03-22 | 学校法人早稲田大学 | Raman spectroscopy measuring apparatus and Raman spectroscopy measuring method |
| CN107860845A (en) * | 2017-11-09 | 2018-03-30 | 宁夏医科大学 | The method that automatic parsing GC MS overlap peaks accurately identify compound |
| CN108007881A (en) * | 2017-11-30 | 2018-05-08 | 中国农业大学 | A kind of aquaculture water quality total nitrogen content detection method based on spectral technique |
| CN109085282A (en) * | 2018-06-22 | 2018-12-25 | 东南大学 | A kind of chromatographic peaks analytic method based on wavelet transformation and Random Forest model |
| WO2020002705A1 (en) * | 2018-06-29 | 2020-01-02 | Universiteit Antwerpen | Item inspection by radiation imaging using an iterative projection-matching approach |
| CN110084212A (en) * | 2019-04-30 | 2019-08-02 | 河南师范大学 | A kind of spectral signature peak recognition positioning method based on improvement sine and cosine algorithm |
| CN110553989A (en) * | 2019-09-03 | 2019-12-10 | 无锡创想分析仪器有限公司 | method for removing spectrum baseline |
Non-Patent Citations (13)
Cited By (2)
| Publication number | Priority date | Publication date | Assignee | Title |
|---|---|---|---|---|
| CN113189035A (en) * | 2021-05-07 | 2021-07-30 | 福建加谱新科科技有限公司 | Step-stacked Fourier transform differential method |
| CN113189035B (en) * | 2021-05-07 | 2024-04-19 | 福建加谱新科科技有限公司 | Stepped superposition type Fourier transform differentiation method |
Also Published As
| Publication number | Publication date |
|---|---|
| CN111982949B (en) | 2022-06-07 |
Similar Documents
| Publication | Publication Date | Title |
|---|---|---|
| CN104931518B (en) | A kind of method for X-ray fluorescence spectra background rejection | |
| CN115700544A (en) | A Chromatographic Signal Denoising Method Combined with Empirical Mode Decomposition and Wavelet Soft Thresholding | |
| CN110503060B (en) | A spectral signal denoising method and system thereof | |
| CN106198482A (en) | The method whether being added with Western medicine in detection health product based on Raman spectrum | |
| CN107632010A (en) | A kind of quantitative approach of combination LIBS to steel samples | |
| CN114417937A (en) | Deep learning-based Raman spectrum denoising method | |
| CN109785272A (en) | A kind of method that Optimal wavelet bases are chosen in mineral spectra feature extraction | |
| CN103543132B (en) | A kind of coal characteristic measuring method based on wavelet transformation | |
| CN108918446A (en) | A kind of super low concentration sulfur dioxide ultraviolet difference feature extraction algorithm | |
| Nikakhtar et al. | Optimal transport reconstruction of biased tracers in redshift space | |
| CN114018861A (en) | Spectral reconstruction method based on characteristic peak | |
| CN111982949A (en) | A method for separating overlapping peaks of EDXRF spectrum by combining the fourth derivative with three-spline wavelet transform | |
| CN107389571A (en) | A kind of fine discrimination method of mineral constituent high-spectrum remote-sensing | |
| CN113092447B (en) | LIBS quantitative analysis method for screening nonlinear PLS based on cyclic variables | |
| CN106650819A (en) | Soil classification method through combination of multi-layer perceptron neural networks with spectral characteristic parameters | |
| CN113538361A (en) | A near-infrared spectral denoising method combining lifting wavelet and SG filtering | |
| CN117493936A (en) | A method to build a spectral diagnostic model that integrates amplitude, frequency and domain features | |
| Green | Magnetic profile analysis | |
| CN120558881B (en) | Mineralogy component testing method and system based on multispectral data fusion | |
| CN111122469A (en) | Method for determining feldspar content in igneous rock | |
| CN114387260A (en) | Interpolation reconstruction method based on pepper spectrum characteristic peak | |
| Xiong et al. | Sparse representations for fault signatures via hybrid regularization in adaptive undecimated fractional spline wavelet transform domain | |
| CN104346516B (en) | The optimal Decomposition order system of selection of the wavelet de-noising of LIBS | |
| CN107894434A (en) | A kind of Fourier transformation denoising method based on cross validation | |
| CN113281276A (en) | Ore component information extraction method, equipment and storage medium |
Legal Events
| Date | Code | Title | Description |
|---|---|---|---|
| PB01 | Publication | ||
| PB01 | Publication | ||
| SE01 | Entry into force of request for substantive examination | ||
| SE01 | Entry into force of request for substantive examination | ||
| GR01 | Patent grant | ||
| GR01 | Patent grant |