Disclosure of Invention
The invention aims to provide a method for separating the EDXRF spectrum overlapped peaks by combining the fourth derivative with the three-spline wavelet transform, which can effectively decompose the overlapped peaks with lower separation degree and has practicability in solving the phenomenon of the overlapped peaks of the EDXRF spectrum.
The technical scheme adopted by the invention is as follows: a method for separating EDXRF spectrum overlapping peaks by combining four derivatives with three-spline wavelet transform is characterized by comprising the following steps:
step 1, carrying out four times of differential processing on the EDXRF spectrum signal to increase the separation degree of overlapped peaks;
step 2, performing multi-scale decomposition on the signals subjected to the four-time differential processing by utilizing three-spline wavelet transform to find out appropriate-scale high-frequency discrete detail signals where the overlapping peaks are located;
step 3, multiplying the high-frequency discrete detail signal by a coefficient more than 1 to amplify in a certain proportion;
and 4, performing wavelet inverse transformation on the amplified high-frequency discrete detail signal to reconstruct a signal to obtain a separated overlapping peak.
The fourth derivative method of the present invention is defined as: let X be X ═ X for a discrete signal1,x2,...,xnThen his derivative spectrum can be expressed as:
in the above formula, n is the derivative order, and n is more than or equal to 1; h is the step length; the derivative spectrum has the following properties;
(1) the extreme point of the even-order derivative or the zero point of the odd-order derivative of the signal function is the extreme point of the original signal function;
(2) the extreme point of the even-order derivative or the extreme point of the odd-order derivative of the signal function is the deformation point of the original signal function;
(3) the signal function magnitude waveform becomes smaller and smaller as the derivative order increases, and the peak pattern becomes sharper and sharper.
The method for decomposing the overlapped peak by the three-spline wavelet transform comprises the following steps: selecting a scale function and a wavelet function, then carrying out discretization wavelet transformation on the overlapped signals to further obtain components on different scales, wherein a high-frequency part represents energy spectrum peak signals, and multiplying the high-frequency signals by a weighting coefficient to decompose the high-frequency signals;
defining an m-order B-spline N by setting m as a natural numberm(x) The following were used:
b-spline can be obtained by recursion, firstly, taking N1(x) Is a Haar scale function, then passes through Nm-1(x) And N1(x) Convolution to define Nm(x) (ii) a If the formula (2) is taken:
and define
m>1. At this time, M is weighed
m(x) Is an m-th order central B-spline.
The definition of the separation degree in the step 1 of the invention is specifically as follows: the degree of separation R is an index describing the degree of overlap between two adjacent peaks and is defined as
The smaller the value of R, the higher the degree of overlap;
the overlapped spectrum peak generally has three peak signals which are simulated to be a Gaussian peak signal, a Lorentzian peak signal and a Tsallis peak signal respectively;
gaussian peak signal:
lorentzian peak signal:
f(x)=Aσ2/[(x-μ)2+σ2] (7)
tsallis peak signal:
in the above formula, σ is the width of the peak, a represents the peak value, μ is the peak position of the peak; the Gaussian peak and the Lorentzian peak can be obtained by adjusting q through the Tsallis peak; when q is close to 1, the peak is Gaussian peak, and when q is 2, the peak is Lorentzian peak; and selecting a Tsallis peak signal for modeling.
If q is 1.8, and the values of A are 2,1.5 and 1.5 respectively; sigma is respectively 4,2 and 1; mu, respectively taking 20,24 and 28; peak positions 20,24, 28; and R of Peak 1 and Peak 21R for 0.33, Peak 2 and Peak 32Is 0.67.
The invention has the advantages that: the scheme provides a new method for decomposing overlapped peaks by combining quartic derivation with three-spline wavelet transformation; the simulation experiment proves that the overlapped peaks can be effectively decomposed. Then, the simulated energy dispersive X-ray fluorescence (EDXRF) spectrum and the actually measured X-ray fluorescence spectrum are processed by the method, so that the decomposition of overlapped peaks is realized, the error is small, and the element identification can be realized. The results prove that: the method can effectively decompose the overlapped peaks with lower separation degree, and has practicability in solving the phenomenon of overlapped peaks of EDXRF spectrum.
Detailed Description
The invention has been made and practiced in such a way that information on the elements to be measured in an energy dispersive X-ray fluorescence (EDXRF) spectrum is contained in the characteristic peak position and the characteristic peak net peak area. Accurate detection of characteristic peaks is key to EDXRF spectroscopic analysis. The invention provides a method for processing overlapping peaks by combining four derivatives with three-spline wavelet transform, which takes the overlapping peaks as a research object and provides a method for processing the overlapping peaks. The feasibility of the method is detected by simulating an overlapping peak through a mathematical model, the measured X-ray fluorescence spectrum data is simulated to obtain a good effect, and finally the measured T-lead brass data and the mixed light element data fluorescence spectrum of the CIT-3000SY X fluorescent element logging instrument are used for verification.
The invention firstly introduces the principle of decomposing the superposition by the derivative method and the three-spline wavelet method in detail. The higher the order of the derivative method, the more malformed the signal, but the more peak separation degree can be effectively improved, and the three-spline wavelet transform is weaker for the low-separation-degree peak separation treatment, but can effectively maintain the peak type. The analog data shows that the separation degree R of the peak 1 and the peak 2 in the three overlapping peaks is 0.33, the separation degree R of the peak 2 and the peak 3 in the three overlapping peaks is 0.67, the signals are overlapped to a certain extent after the fourth derivative processing, but the peak position value of the signals is kept after the fourth derivative processing, the phenomenon that the separation degree is increased occurs, and the decomposition of the analog overlapping peaks is realized by adjusting the numerical value of the decomposition level and amplifying the high-frequency signals by a coefficient which is larger than 1 in a certain proportion and then reconstructing the high-frequency signals by combining the characteristics of the three-spline wavelet transformation. The decomposition layer number of the three-spline wavelet is six times of four layers of high-frequency amplification coefficients. Then, simulation experiments show that the new method can accurately identify the peak position, the error is within 1 percent, and the applicability of the new method to X fluorescence spectrum overlapping peak decomposition is proved. The feasibility of the method for decomposing the overlapped peak is verified. Finally, the method is used for processing the actually measured T lead brass element data and the mixed light element data X fluorescence spectrum of the CIT-3000SY X fluorescence element logging instrument, so that the decomposition of the overlapped peak is realized, the peak position error after the decomposition is controlled within 1 percent, and the method has higher accuracy.
1. Derivative method.
Definition of the derivatives: let X be X ═ X for a discrete signal1,x2,...,xnThen his derivative spectrum can be expressed as:
in the above formula, n is the derivative order, and n is more than or equal to 1; h is the step size. The derivative spectrum has the following properties;
(1) the extreme points of the even order derivative or the zero points of the odd order derivative of the signal function are the extreme points of the original signal function.
(2) The extreme point of the even order derivative or the extreme point of the odd order derivative of the signal function is the deformation point of the original signal function.
(3) The signal function magnitude waveform becomes smaller and smaller as the derivative order increases, and the peak pattern becomes sharper and sharper.
The literature shows that the fourth derivative method can effectively remove fine miscellaneous peaks in the spectrum, can separate overlapped characteristic peaks, and has better resolution effect on the overlapped peaks than the first derivative and the second derivative. The theory of the derivative for positioning the characteristic peak of the X fluorescence energy spectrum is mature and simple, and the applicability is wide. According to the properties of the derivative spectrum, after the fourth-order derivative method is carried out on the energy spectrum signal, each extreme point and zero point of the signal can be clearly displayed, the half-peak width of the signal is reduced, the peak shape is sharpened, and therefore the overlapped peak signals which are overlapped seriously are initially separated, the basis for distinguishing the overlapped peaks is provided, and the fine structure of the signal can be accurately judged. However, since the characteristics of noise amplification along with higher order of the derivative cannot be widely popularized in the specific using process, a method for enabling the derivative to play a role is urgently needed.
2. Theory of three-spline wavelet transform.
The effect of decomposing overlapping peaks is different for different spline wavelet bases because their filters are different. The peak type decomposed by the second-order spline wavelet base is sawtooth-shaped, and the peak position value error decomposed by the fourth-order spline wavelet base is larger. The third-order spline wavelet base has better decomposition effect of the overlapped peak, the peak position of the signal obtained after the overlapped peak is decomposed is unchanged, and the error of the peak area is smaller, considering the advantages of the spline wavelet. So a third-order spline wavelet basis is chosen.
2.1, Properties and Definitions of the spline wavelet: the basic idea of utilizing wavelet transform to carry out overlapped peak decomposition is as follows: firstly, selecting proper scale function and wavelet function, then making discretization wavelet transformation on the overlapped signal so as to obtain components on different scales, in which the high-frequency portion represents energy spectrum peak signal, finally making multiplication on the high-frequency signal by a weighting coefficient to make decomposition.
Defining an m-order B-spline N by setting m as a natural numberm(x) The following were used:
b-spline can be obtained by recursion, firstly, taking N1(x) Is a Haar scale function, then passes through Nm-1(x) And N1(x) Convolution to define Nm(x) In that respect If the formula (2) is taken:
and define
m>1. This is achieved byAt first, scale M
m(x) Is an m-th order central B-spline.
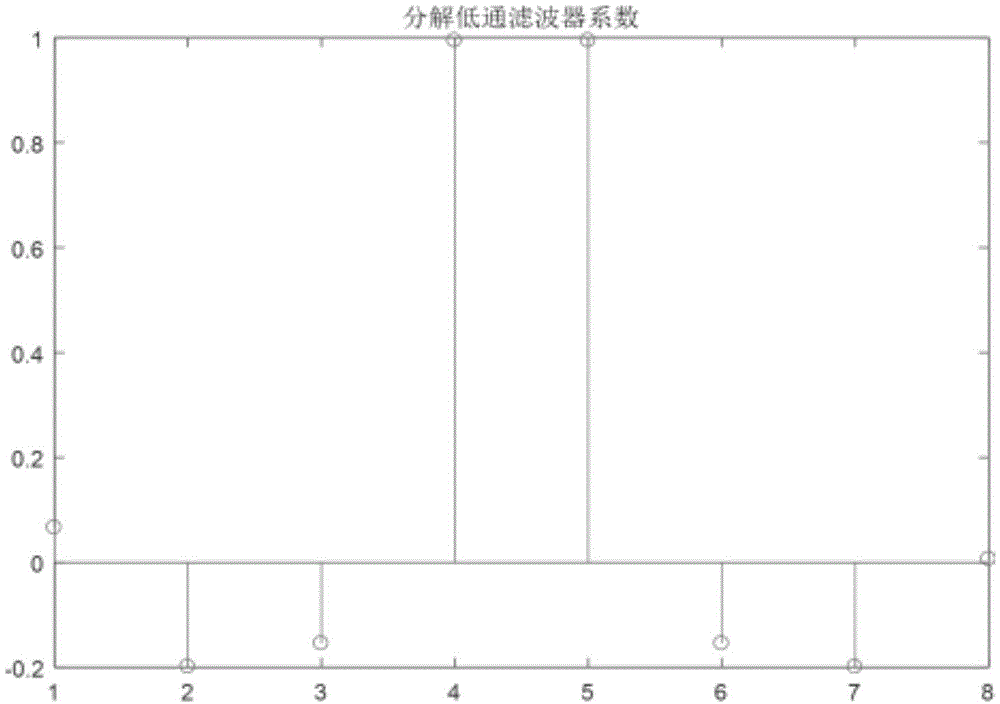
The low-pass and high-pass filter coefficients of the third-order spline wavelet bior3.5 are given as shown in fig. 1-4.
2.2, the fourth derivative method is combined with a third-order B spline wavelet algorithm to realize the following steps:
1, performing differential processing on the signal for four times to increase the separation degree of the overlapped peaks;
step 2, performing multi-scale decomposition on the signals subjected to the four-time differential processing by utilizing wavelet transformation to find out appropriate-scale high-frequency discrete detail signals where the overlapping peaks are located;
step 3, multiplying the high-frequency signal by a coefficient more than 1 to amplify in a certain proportion;
and 4, performing wavelet inverse transformation on the amplified high-frequency detail signal to reconstruct a signal to obtain a separated overlapping peak.
3. The four-derivative combined with the three-spline wavelet transform decomposes the low-resolution overlapping peaks.
The degree of separation R is an index describing the degree of overlap between two adjacent peaks and is defined as
The smaller the value of R, the higher the degree of overlap.
Overlapping spectral peaks are typically modeled with three peak signals, a Gaussian peak signal, a Lorentzian peak signal, and a Tsallis peak signal.
Gaussian peak signal:
lorentzian peak signal:
f(x)=Aσ2/[(x-μ)2+σ2] (7)
tsallis peak signal:
in the above formula, σ denotes the width of the peak, a denotes the peak value, and μ denotes the peak position of the peak. Whereas Gaussian and Lorentzian peaks can be obtained by adjusting q by the Tsallis peak. When q is close to 1, the peak is Gaussian, and when q is 2, the peak is Lorentzian. Therefore, the Tsallis peak signal is more representative to be used for modeling.
Q is 1.8, and a is 2,1.5, 1.5. σ is 4,2, 1 respectively. Mu are respectively 20,24 and 28. Namely peak positions 20,24, 28. While peaks 1 and 2 had an R1 of 0.33 and peaks 2 and 3 had an R2 of 0.67. It can be seen in fig. 5 that peak 1, peak 2, and peak 2 overlap strongly, and that the peak 2 and peak overlap by three parts, and approach the actual overlapping peak signal.
As shown in fig. 6, the position and number of peaks after the initial processing by the fourth order derivative are clearly shown, so the initial processing by the fourth order derivative is feasible, but at the same time, it can be seen that there is some overlap of signals after the fourth order derivative, so another method is needed for further processing.
As shown in fig. 7, the peak positions of the analog signal peaks are 20,24, and 28 by performing the four-step derivative preliminary processing on the analog signal and performing the three-spline wavelet processing. The peak positions after treatment were 19.9, and the errors of the peak positions of 24.2 and 27.8 were 0.05%, 0.83% and 0.71%, respectively. The ideal error of the decomposition effect is small, and the requirement of quantitative and qualitative analysis can be met. The result shows that the four-lead combined with the three-spline wavelet transform can effectively decompose the overlapped peak.
TABLE 1 analysis of peak position results
Table 1 Peak position analysis
4. And (5) performing experimental analysis on the spectrum simulation.
According to the X-ray energy scale: k of the element KαIs 3.313keV, Kβ3.589keV, the energy difference is only 279 keV; when the spectrometer measures the K element, the spectral peaks can overlap significantly. A set of spectra with K-series spectral lines that do not overlap is known,and identifying the energy peak address as a standard energy peak address, and performing energy linear scale E of 0.0307 keV/ch. K of the element KαKβThe energy addresses are 113 and 122, respectively. The low resolution overlapping peaks present in the simulated EDXRF spectra were performed using formula (8). KαKβThe ratio of the energy peaks was 5: 1. The simulation expression is shown in (9), and the result is shown in fig. 8.
As shown in fig. 8, the overlapping peaks of the simulated EDXRF spectra were resolved, and the overlapping peaks in the original lines in fig. 8 were difficult to observe by the naked eye. The peak positions after decomposition are identified, and the result is shown in table 2, and the error of the decomposition result of the overlapped peaks is less than 1%. According to results, the four-lead combined with the three-spline wavelet transform can better decompose overlapped peaks in the EDXRF spectrum.
TABLE 2 analysis of peak position results
Table 2 Peak position analysis
5. And (5) actually measuring the X fluorescence data analysis result.
In the experiment, T lead brass element data and mixed light element data which are actually measured by a CIT-3000SY X fluorescent element logging instrument are adopted, and K of Ni is between 400-430 channel sites in the T lead brass dataαAnd K of CoβThe energy was 7.477 and 7.649kev, respectively, differing by only 0.172kev, in a severe overlapping state. In the light element data, it can be observed that there is a serious overlap between the Cr and Mn elements in the channel addresses 230-270, and the energy difference is 0.484kev, which causes great difficulty in element identification. The two groups of data are preprocessed by spectral smooth background deduction and the like, and then four-order differential combined three-spline wavelet decomposition is carried out, wherein the number of layers of the wavelet decomposition is four, and the amplification coefficient is 6 times. The decomposition results are shown in FIGS. 9-12 below.
K of known NiαStandard peak position 410, K of CoβAnd for 419 channels, identifying spectral peak positions of 408 and 420 channels by a peak searching method, wherein the errors are only 0.5 percent and 0.2 percent, the standard peak positions of Cr and Mn are 241 channels and 254 channels respectively, and the errors after decomposition are only 0.4 percent. And the decomposition effect of the overlapped peak is obvious, and the result shows that: the fourth-order derivative has accurate result by combining the overlapped peaks with lower separation degree in the three-spline wavelet decomposition actual X fluorescence spectrum.
TABLE 3 analysis of peak position results
Table 3 Peak position analysis
6. And (5) research results.
The invention researches a derivative method and a spline wavelet method in detail and provides a novel method for decomposing overlapped peaks by combining four-derivative with three-spline wavelet transform. The simulation experiment proves that the overlapped peaks can be effectively decomposed. Then, the simulated energy dispersion X fluorescence spectrum and the actually measured EDXRF spectrum are processed by the method, so that the decomposition of overlapping peaks is realized, the error is small, and the element identification can be realized. The results prove that: the method can effectively decompose the overlapped peaks with lower separation degree, and has practicability in solving the phenomenon of overlapped peaks of EDXRF spectrum.