EP0064230A2 - Verfahren und Einrichtung zur Messung von Antigen-Antikörper-Reaktionen - Google Patents
Verfahren und Einrichtung zur Messung von Antigen-Antikörper-Reaktionen Download PDFInfo
- Publication number
- EP0064230A2 EP0064230A2 EP82103412A EP82103412A EP0064230A2 EP 0064230 A2 EP0064230 A2 EP 0064230A2 EP 82103412 A EP82103412 A EP 82103412A EP 82103412 A EP82103412 A EP 82103412A EP 0064230 A2 EP0064230 A2 EP 0064230A2
- Authority
- EP
- European Patent Office
- Prior art keywords
- antigen
- antibody
- measuring
- scatter
- hapten
- Prior art date
- Legal status (The legal status is an assumption and is not a legal conclusion. Google has not performed a legal analysis and makes no representation as to the accuracy of the status listed.)
- Withdrawn
Links
Images



Classifications
-
- G—PHYSICS
- G01—MEASURING; TESTING
- G01N—INVESTIGATING OR ANALYSING MATERIALS BY DETERMINING THEIR CHEMICAL OR PHYSICAL PROPERTIES
- G01N33/00—Investigating or analysing materials by specific methods not covered by groups G01N1/00 - G01N31/00
- G01N33/48—Biological material, e.g. blood, urine; Haemocytometers
- G01N33/50—Chemical analysis of biological material, e.g. blood, urine; Testing involving biospecific ligand binding methods; Immunological testing
- G01N33/53—Immunoassay; Biospecific binding assay; Materials therefor
- G01N33/543—Immunoassay; Biospecific binding assay; Materials therefor with an insoluble carrier for immobilising immunochemicals
- G01N33/54313—Immunoassay; Biospecific binding assay; Materials therefor with an insoluble carrier for immobilising immunochemicals the carrier being characterised by its particulate form
-
- G—PHYSICS
- G01—MEASURING; TESTING
- G01N—INVESTIGATING OR ANALYSING MATERIALS BY DETERMINING THEIR CHEMICAL OR PHYSICAL PROPERTIES
- G01N21/00—Investigating or analysing materials by the use of optical means, i.e. using sub-millimetre waves, infrared, visible or ultraviolet light
- G01N21/17—Systems in which incident light is modified in accordance with the properties of the material investigated
- G01N21/47—Scattering, i.e. diffuse reflection
-
- Y—GENERAL TAGGING OF NEW TECHNOLOGICAL DEVELOPMENTS; GENERAL TAGGING OF CROSS-SECTIONAL TECHNOLOGIES SPANNING OVER SEVERAL SECTIONS OF THE IPC; TECHNICAL SUBJECTS COVERED BY FORMER USPC CROSS-REFERENCE ART COLLECTIONS [XRACs] AND DIGESTS
- Y10—TECHNICAL SUBJECTS COVERED BY FORMER USPC
- Y10S—TECHNICAL SUBJECTS COVERED BY FORMER USPC CROSS-REFERENCE ART COLLECTIONS [XRACs] AND DIGESTS
- Y10S436/00—Chemistry: analytical and immunological testing
- Y10S436/805—Optical property
-
- Y—GENERAL TAGGING OF NEW TECHNOLOGICAL DEVELOPMENTS; GENERAL TAGGING OF CROSS-SECTIONAL TECHNOLOGIES SPANNING OVER SEVERAL SECTIONS OF THE IPC; TECHNICAL SUBJECTS COVERED BY FORMER USPC CROSS-REFERENCE ART COLLECTIONS [XRACs] AND DIGESTS
- Y10—TECHNICAL SUBJECTS COVERED BY FORMER USPC
- Y10S—TECHNICAL SUBJECTS COVERED BY FORMER USPC CROSS-REFERENCE ART COLLECTIONS [XRACs] AND DIGESTS
- Y10S436/00—Chemistry: analytical and immunological testing
- Y10S436/807—Apparatus included in process claim, e.g. physical support structures
-
- Y—GENERAL TAGGING OF NEW TECHNOLOGICAL DEVELOPMENTS; GENERAL TAGGING OF CROSS-SECTIONAL TECHNOLOGIES SPANNING OVER SEVERAL SECTIONS OF THE IPC; TECHNICAL SUBJECTS COVERED BY FORMER USPC CROSS-REFERENCE ART COLLECTIONS [XRACs] AND DIGESTS
- Y10—TECHNICAL SUBJECTS COVERED BY FORMER USPC
- Y10S—TECHNICAL SUBJECTS COVERED BY FORMER USPC CROSS-REFERENCE ART COLLECTIONS [XRACs] AND DIGESTS
- Y10S436/00—Chemistry: analytical and immunological testing
- Y10S436/815—Test for named compound or class of compounds
- Y10S436/817—Steroids or hormones
Definitions
- This invention relates to a method and apparatus for measuring the degree of an antigen-antibody reaction in order to determine the antigen, antibody or hapten level. More specifically, the invention relates to an immunological quantitative method and apparatus in which use is made of a suspension of insoluble microscopic carrier particles having antigen or antibody molecules bonded thereto, wherein the agglutination reaction among the carrier particles based on the antigen-antibody reaction is measured by optical means. Alternatively, the immunological quantitative method and apparatus to which the invention pertains are adapted to optically measure the degree of a so-called agglutination inhibiting reaction... This is a reaction in which a specimen of interest is introduced, along with an antibody, .
- Radioimmuno assay RIA
- enzymeimmuno assay EIA
- the RIA method requires special facilities and trained technicians for the handling of radioactive isotopes, and an attendant problem is the treatment of wastes following analysis.
- the RIA method is disadvantageous in that it requires the implementation of a complex operation known as B/F separation, in which an antibody with a bonded antigen (or an antigen with a bonded antibody). is separated from a free antibody (or free antigen).
- the EIA technique does not employ radioactive material, but does generally call for the B/F separation.
- a homogeneous immunoassay technique does exist in which B/F separation is unnecessary.
- the antigen is bonded to an enzyme, and it is required to maintain the antigenic property of the antigen molecules as well as the activity of the enzyme.
- enzyme activity is difficult to maintain, so there is a restriction upon the kind of antigen molecules to which this method can be- applied.
- Latex particles are employed to effect the agglutination reaction.
- U.S.P. 4,174,952 issued to David S. Cannel et al., as well as the periodical Molecular Immunology (Vol. 17, 1980, pp. 81-92) discloses determining the degree of agglutination reactions by measuring the ratio of intensities of light scattered at angles of 90° and 10° with respect to the path of the incident light. According to the disclosed methodology, an agglutination reaction gives rise to an increase in average particle diameter and a simultaneous decrease in the total number of particles. The intensity of light scattered at 90° therefore will decrease as agglutination proceeds, while the scatter intensity at 10° will increase.
- Light beating spectroscopy provides a high level of sensitivity since detection is possible even at the stage where the carrier particles are in the form of microscopic polymers before growing into large visible or microscopic clumps.
- light beating spectroscopy requires the installation of costly measuring instruments such as a spectrum analyzer or correlator, as well as considerable skill in operation and maintenance.
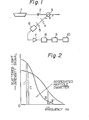
- a basic arrangement for light beating spectroscopy is as shown in Fig. 1.
- a laser beam of a fixed wavelength emitted by an He-Ne, Ar-ion or other laser 1 is focused by a lens 2 and irradiates a scattering cell 3 containing the specimen of interest.
- Light scattered through an angle 8 with respect to the optic axis of the laser beam is detected by a photodetector 6, such as a photomultiplier tube, after passing through slits, 4, 5 which determine the field of view.
- the output signal from the multiplier tube 6 is subjected to a frequency selection operation by a spectrum analyzer 10 after amplification by a preamplifier 7.
- the signal then is applied to a recorder 10 via a squaring circuit 9 to provide an indication of the frequency spectrum.
- the present invention has been developed in view of the foregoing circumstances and seeks to improve the sensitivity and accuracy of quantitative measurement.
- the underlying principle of the invention which is based on the analysis of agglutination reactions via light beating spectroscopy, resides in selectively detecting scattered light intensity signals originating from aggregates of all particle diameter ranges formed as a result of agglutination promoting or inhibiting reactions which take place among insoluble carrier particles, and then establishing a correlation between the detected signals and the antigen, antibody and hapten concentration.
- the scattered light is photoelectrically converted to provide an output current, the frequency spectrum thereof generally gives a Lorentz curve for the spherical particles, as set forth above. As is apparent from Fig.
- an increase in the diameter of the aggregated particles mitigates the influence of the solvent molecules and lowers the rate of Brownian motion exhibited by the particles, with a correspond- .ingly smaller frequency difference (Doppler shift) appearing between the light incident upon the scattering cell and the scattered light.
- Doppler shift there is an increase in the proportion of the signal component indicative of the frequency of the irradiating light and, conversely, a decrease in the proportion of the signal component whose frequency is remote-from the irradiating light frequency.
- .I denotes a scatter output signal from a photodetector in the low-frequency region before particle aggregation proceeds, and I' the same signal after a high degree of aggregation is reached.
- II represents a scatter output signal in the high-frequency region under a low degree of aggregation, and II' the same signal under a high degree of aggregation. Examining the ratio of the signals reveals that I'/I gives a value much larger than II'/II. In other words, when the frequency difference between the irradiating (incident) laser light and the scattered light is plotted along the horizontal axis and the scattered light intensity for each frequency region is plotted along the vertical axis, and when these are plotted along with particle aggregation, the result is an indication of spectral variation in accordance with a Lorentz curve.
- the degree of aggregation when the degree of aggregation is high, the photoelectric output signal or signal intensity is high on the low-frequency side and low on the high-frequency side. Accordingly, if a signal output representative of a specific frequency band, a.signal output representative of a reference frequency band, and the ratio of these two outputs are measured, then the degree to which carrier particles aggregate through intervening antigens, antibodies or haptens can be determined, allowing a quantitative correlation to be established beeween the degree of aggregation and the composition of a specimen of interest, with a high level of accuracy and sensitivity.
- a single frequency band or a plurality thereof may be used, with the number being adjusted up or down in accordance with the mode of the agglutination promoting or inhibiting reaction system.
- the scattered light may be detected at a plurality of scatter angles, and output signals indicative of such scatter may be detected simultaneously.
- signal intensity is extracted from the signal frequency band or from each of the plural frequency bands, and can be utilized in a prescribed calibration. If the'number of frequency bands is increased or the band width broadened, then the magnitude of the scatter output signal can be enlarged to enhance the signal-to-noise ratio.
- care must be taken since too many frequency bands and too broad a bandwidth will destroy the signal singularity and diminish analytical sensitivity and accuracy.
- the carrier particle characteristics, the type of antigen, antibody or hapten in the specimen, the type of solvent, the incident laser wavelength and the set scatter angle it is possible to quantify the agglutination system by finding the power value, corresponding to the scatter intensiy, from the photoelectric current, namely the scatter output signal representative of the single frequency band or of each of the plural frequency bands, as mentioned above, or even by measuring the ratio of the total power value of all frequency bands or of a specific frequency band, to a value which may or may not include a Schottky noise component (due to a photoelectric converter) in the power value of each frequency band.
- the high-frequency band signal or power will include almost no scatter spectrum information in the above- mentioned Lorentz curve. Accordingly, if the high-frequency band power is extracted as noise power and is then subtracted from the power value of each specific frequency band, the result will be the essential power.
- the essential power reflects the scatter spectrum information, namely the agglutination promoting or inhibit reaction system, with greatly improved accuracy. In such case calculations may be carried out with the width of the high-frequency band from which the noise power is extracted, set equal to the width of each of the other low-frequency bands. Alternatively, when the two band widths involved in the calculation are difference, it will be necessary to compute the essential strength (power), or the essential output signal, by calibrating the signal. or signal intensity of each specific frequency band based on the ratio of the two bandwidths.
- any microscopic particles which are insoluble in the solution to.be analyzed can be utilized as carrier particles.
- the average particle is 0.1 to 10 microns, preferably 0.2 to 1.0 micron.
- carrier particles which can be used are polymeric latex particles, glass spheres, microscopic oxide powders of alumina, silica-alumina or the like, or biological particles such as coccus-type bacteria, rickettsia, viruses, cell membrane fragments or red blood cells.
- antigen which can be analyzed are micro-organisms, tissue antigen including antigen differentiated by particular organs, hormones, enzymes, blood cell antigen and blood-type antigen.
- An example of the antibody is one which includes an autoantibody.
- the bonding between the insoluble carrier particles and the antibody, antigen or hapten is induced by physical bonding, namely the electrostatic attraction or repulsion or the molecular label, or by chemical bonding due to covalent bonds, using a condensation agent such as carbodiimide, a cross-linking agent such as glutaric aldehyde, etc.
- the present invention is based on the fact that when an agglutination promoting or agglutination inhibiting reaction exhibited by insoluble carrier particles changes as a function of the quantity of antigen, antibody or hapten in the specimen, the scattered light spectrum will represent the degree of carrier particle agglutination, or the value of a frequency shift peculiar to the distribution of the agglutination degree.
- the present invention makes use of this fact by measuring the scattered light intensity of a frequency band having a constant shift to compute the degree of agglutination, enabling the antigen, antibody or hapten level to be.analyzed with high sensitivity and accuracy.
- the invention makes'it possible to actually measure, in a technically simple and inexpensive manner, the scatter spectrum intensity component of a specific frequency band corresponding to the abovesaid frequency shift.
- This may be achieved by incorporating an electrical filter in a system for processing the signals indicative of the received light, which filter will be designed to set the pass band in accordance with the kind of insoluble carrier particles and the type of antigen, antibody or hapten which is the object of analysis.
- An electrical filter satisfying the above requirement is cheaper and easier to manufacture and operate than the frequency analyzers or correlators ordinarily employed in light beating spectroscopy.
- the present invention provides a technique for measuring the degree of an antigen-antibody reaction by preparing a suspension of insoluble microscopic carrier particles of at least one type carrying an antigen, antibody or hapten, forming an agglutination promoting or inhibiting reaction system among the insoluble carrier particles based on an antigen-antibody reaction using the suspension and one or more antigens, antibody or hapten, irradiating the solution of the reaction system with laser light and detecting the light scattered from the reaction system at one or more specific angles, detecting a signal indicative of one or more specific frequency bands from the resulting scatter spectrum, and thenceforth calculating the quantity of antigen, antibody or hapten in a specimen on the basis of the detected signal.
- the present invention provides a technique for measuring the degree of an antigen-antibody reaction by detecting scatter spectra at a.plurality of specific scatter angles and detecting the respective signals representative of specific frequency bands for these spectra to compute the ratios of the signals, or by detecting signals from a plurality of frequency bands for a scatter spectrum obtained at.a specific scatter angle,. namely from both bands of low- and high-frequency (of which the latter or high-frequency band possesses little scatter information) to find either the ratio of the low-frequency band component to the high-frequency band component, or the essential signal magnitude by subtracting the high-frequency component from the low-frequency component before computing the ratio.
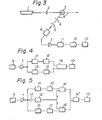
- Fig. 3 shows the basic arrangement of a system, which includes a single filter, for measuring the degree of an agglutination promoting or inhibiting reaction based on light beating spectroscopy.
- Numerals 1 through 7 denote the similarly labeled components already described in connection with Fig. 1.
- the signal from.the preamplifier 7 is applied to a filter 14 for frequency band selection.
- the intensity spectrum output of the filter 11, which exits from the filter is the form of a square root, is converted back into the original intensity spectrum by means of a squaring circuit 12, whose output is recorded by the recorder 10.
- the optical system and the light scattering cell 3 are set so that the scattered light is received at an angle e with respect to the incident laser beam.
- the scatter angle is freely adjustable.
- Fig. 4 The arrangement shown in Fig. 4 is provided with two filter systems based on filters 14, 15 each of which receives the output of the photodetector 6 following amplification by amplifier 7. Each filter is adapted to select'an intensity spectrum of a different frequency band. Each resulting spectrum signal is squared by the squaring circuit 12 and then applied to a divider 16 which finds the intensity ratio of one band to the other (namely the ratio of the corresponding photoelectrically converted power values). The result is recorded by the recorder 10.
- Fig. 5 shows another arrangement which, besides selecting the power values of two different frequency bands by means of the two filters 14, 15 and squaring circuits 12 following amplification of the photodetector output by the amplifier 7, is further provided with a capacitor 17 and a.squaring circuit 12! which process the amplified photodetector output to detect the AC component of the scatter intensity spectrum.
- the divider 16 and an additional divider 16' compute the ratio of the overall AC component to the passed component of each frequency band, after which a multiplier 16" takes the product of the two divider outputs and applies the result to the recorder 10, whereby the degree of agglutination can- be measured.
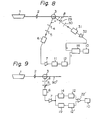
- the photodetector 6 which receives the scattered light from the scattering cell has its output amplified by the amplifier 7, as before.
- the amplified output is discriminated as three scatter intensity signals of three respective bandwidths by three filters 14, 15, 19.
- the filters 14, 15 extract two different low-frequency band components to pick out the power components of each frequency band, namely signals related to the two scatter spectrum intensities, and the filter 19 extracts the high-frequency band component as noise power.
- the output of filter 19 is.converted back into an intensity signal by the squaring circuit 12' and then applied to amplifiers 20, 21 for frequency band calibration.
- calibration is so effected as to establish equivalence between the high-frequency bandwidth extracted as the noise power and each of the low-frequency bandwidths.
- the onise power of this high-frequency band then is subtracted from the.scatter intensity signals of the two low-frequency bands by means of subtraction circuits 22, 23, the results of the subtraction operations being applied to the divider 16.
- the divider 16 finds the ratio of the two low-frequency band outputs, the results is actually the ratio of the essential low-frequency power values. This arrangement makes it possible to detect even minute changes in agglutination degree, with a high.sensitivity and accuracy.
- Fig. 7 illustrates a circuit arrangement which facilitates signal processing after the amplifier 7 amplifies the output. of the photodetector 6.
- the arrangement is provided with a programmable switch capacitor filter 24, an AD converter 25, interfaces 26, 27, and a microcomputer 28.
- the microcomputer 28 sets the programmable filter 24 to a frequency band specified in advance by a program. This enables scatter outputs corresponding to a plurality of frequency bands to be measured successively, and permits various arithmetic operations among these measured values to be specified at will.
- An additional-advantage is that in programming frequency selection, it is possible to vary the pass band of the scatter spectrum signal with facility in accordance with the type of antigen-antibody reaction, the measurement conditions, reagekt composition and carrier particle diameter.
- F ig. 8 shows another arrangement in which scattered light from the cell 3 is detected at two scatter angles a, S by respective photodetectors 6, 31 after passage through corresponding slits 4, 5 and 29, 30 for limiting the field of view.
- Light scattered along angle a travels close to the optical axis of the incident laser beam.
- the optical response of the agglutination system is measured with far greater precision by detecting the scatter intensity at scatter angle a to provide scatter information on the agglutination system over all frequency bands, .and then by computing the ratio of the spectrum intensity for a specific frequency band at the scatter angle a, to the aforementioned intensity.
- the output of the photodetector 31 is amplified by a preamplifier 32 and applied to the divider 16 where it will serve-as the denominator in the computed ratio.
- the other input to the divider 16 is the signal extracted by the filter 11 for passing the specific frequency'band and converted back into the intensity signal by the squaring circuit 12. This signal will serve as the numerator.
- the divider 16 thus computes the ratio between these inputs and applies the result to the recorder 10 as agglutination system data.
- the scattered light from the cell 3 is detected at a fixed angle of 90°.
- the photodetector output following amplification in amplifier 7, is extracted as scatter spectrum information by a low-pass filter 14, squared by the squaring circuit 12 and delivered to an operational amplifier 22' which has a multiplying function.
- the photoelectric output also is applied to a band-pass filter 19 whose bandwidth has a lower limit close to the upper bandwidth limit of the low-pass filter 14.
- Band-pass filter 19 isolates the power of its photoelectric signal input and applies it to the squaring circuit 12' for conversion back into the light intensity signal. This signal also is fed into the operational amplifier 22 where it is multiplied by the scatter intensity signal of the low-frequency band.
- the product is coupled to the recorder 10.
- the signal which indicates the scatter spectrum of the low-frequency band intensifies while the high-frequency band signal grows weaker. Therefore, by multiplying these two signals as in the above arrangement, the variation in the scatter spectrum can be extracted in more augmented form, enabling keener observation of the agglutination system through a simple set-up.
- Polybead carboxylate monodisperse microspheres (0.20 pm average diameter) obtained from Polyscience Company (USA) were used as the carrier particles.
- Human chorionic gonadotropic hCG was bonded to the carrier particles with l-ethyl-3-(3-dimethyl aminopropyl) carbodiimide serving as the condensation agent.
- the concentraion of the latex particles was adjusted to 200 ⁇ g/ml by dilution in 0.15 mol pH 8.0 tris- hydrochloric acid buffer, thereto to prepare a latex suspension reagent.
- Goat antiserum hCG was diluted 1000 times with the above buffer solution to prepare an antibody solution.
- the buffer solution was used to prepare a series of hCG standard solutions having concentrations of 0, 1.5, 5, 15, 50 and 150 mIU/ml.
- 100 ⁇ l of each of these hCG standard solutions was taken in a small test tube, to each of which 0.1 ml of the above antibody solution was added.
- 0.1 ml of the above latex solution was added and each mixture was reacted for another 3 hrs.
- 1 ml of the above buffer solution was added to each reactant solution, and light scattering measurements were performed using a linearly polarized helium-neon laser run at 5 mW output with an oscillating wavelength of 633 nm to irradiate the light scattering cell.
- the adopted scatter angle was 90°, using the scattered light photometry and signal processing system of Fig. 4.
- band-pass filter 14 was varied over three pass bands (10-50 Hz, 150-200 Hz, 400-450 Hz), while filter 15 was set to a single pass band of 10-10000 Hz.
- the ratio of the scatter spectrum intensity of each of the three pass bands to that of the single wide pass band was detected as described above in connection with Fig. 4..
- the ratios determined were plotted along the vertical axis, and the hCG concentration in the reaction tube (the light scattering cell) was plotted along the horizontal axis. The result is shown in Fig. 10.
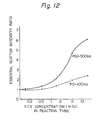
- Fig. 9 The arrangement of Fig. 9 was employed in the same manner to plot calibration curves, shown in Fig. 12, by extracting the power of a 950-1000 Hz band through the highpass filter 19 and the scatter spectra of two frequency bands (50-100 Hz, 450-500 Hz) through the filter 14. In this case, both of the filters 14, 19 have a bandwidth of 50 Hz. It may be understood, therefore, that the amplifiers 20, 21, of the type shown in Fig. 6 for bandwidth calibration, are unnecessary.
Landscapes
- Health & Medical Sciences (AREA)
- Immunology (AREA)
- Life Sciences & Earth Sciences (AREA)
- Chemical & Material Sciences (AREA)
- Engineering & Computer Science (AREA)
- Analytical Chemistry (AREA)
- Biomedical Technology (AREA)
- Hematology (AREA)
- Pathology (AREA)
- Molecular Biology (AREA)
- Urology & Nephrology (AREA)
- General Physics & Mathematics (AREA)
- General Health & Medical Sciences (AREA)
- Biochemistry (AREA)
- Physics & Mathematics (AREA)
- Cell Biology (AREA)
- Medicinal Chemistry (AREA)
- Food Science & Technology (AREA)
- Biotechnology (AREA)
- Microbiology (AREA)
- Investigating Or Analysing Materials By Optical Means (AREA)
Applications Claiming Priority (2)
| Application Number | Priority Date | Filing Date | Title |
|---|---|---|---|
| JP56062237A JPS57175957A (en) | 1981-04-24 | 1981-04-24 | Measuring method and device for antigen- antibody reaction |
| JP62237/81 | 1981-04-24 |
Publications (2)
| Publication Number | Publication Date |
|---|---|
| EP0064230A2 true EP0064230A2 (de) | 1982-11-10 |
| EP0064230A3 EP0064230A3 (de) | 1984-03-28 |
Family
ID=13194341
Family Applications (1)
| Application Number | Title | Priority Date | Filing Date |
|---|---|---|---|
| EP82103412A Withdrawn EP0064230A3 (de) | 1981-04-24 | 1982-04-22 | Verfahren und Einrichtung zur Messung von Antigen-Antikörper-Reaktionen |
Country Status (3)
| Country | Link |
|---|---|
| US (1) | US4446239A (de) |
| EP (1) | EP0064230A3 (de) |
| JP (1) | JPS57175957A (de) |
Cited By (8)
| Publication number | Priority date | Publication date | Assignee | Title |
|---|---|---|---|---|
| GB2129549A (en) * | 1982-11-09 | 1984-05-16 | Univ London | Detecting particles and changes in particle size in a suspension |
| EP0118894A3 (de) * | 1983-03-11 | 1986-01-08 | E.I. Du Pont De Nemours And Company | Messung der Verteilung der Grösse eines Reagensteilchens für Immuntest |
| GB2173004A (en) * | 1985-03-29 | 1986-10-01 | Toshiba Kk | Biological microparticle inspection apparatus |
| US4665020A (en) * | 1984-05-30 | 1987-05-12 | United States Department Of Energy | Flow cytometer measurement of binding assays |
| US4766083A (en) * | 1982-04-04 | 1988-08-23 | Wako Pure Chemical Industries, Ltd. | Method for the photometric determination of biological agglutination |
| EP0418874A3 (en) * | 1989-09-20 | 1992-02-26 | Mitsubishi Rayon Kabushiki Kaisha | Method and apparatus for scattered light measurements |
| EP0455702A4 (en) * | 1989-01-26 | 1992-04-08 | Seradyn, Inc. | Quantitative immunoassay system |
| EP2762885A1 (de) * | 2013-01-31 | 2014-08-06 | Sysmex Corporation | Immunoassay-Verfahren und Immunoassay-Vorrichtung |
Families Citing this family (38)
| Publication number | Priority date | Publication date | Assignee | Title |
|---|---|---|---|---|
| JPS58187860A (ja) * | 1982-04-26 | 1983-11-02 | Wako Pure Chem Ind Ltd | 免疫学的凝集反応の光学的測定方法 |
| JPS59187264A (ja) * | 1983-03-30 | 1984-10-24 | Kyowa Hakko Kogyo Co Ltd | 抗原−抗体反応速度の測定法 |
| US4554257A (en) * | 1983-04-29 | 1985-11-19 | Aladjem Frederick J | Assaying immunoreactive and like substances by measurement of aggregate classes |
| US5082790A (en) * | 1985-12-23 | 1992-01-21 | Beckman Instruments, Inc. | Apparatus and method for dynamic blanking of non-specific light scattering during rate nephelometric reactions |
| US4835110A (en) * | 1985-12-23 | 1989-05-30 | Beckman Instruments, Inc. | Method for enhancing analysis timing in kinetic nephelometry |
| US4745279A (en) * | 1986-01-02 | 1988-05-17 | American Hospital Supply Corporation | Hematocrit measuring apparatus |
| JP2591750B2 (ja) * | 1986-06-26 | 1997-03-19 | オ−ソ・ダイアグノステイツク・システムズ・インコ−ポレ−テツド | 免疫分析システム |
| US5252493A (en) * | 1986-09-22 | 1993-10-12 | Nippon Telegraph And Telephone Corporation | Laser magnetic immunoassay method and apparatus therefor |
| US5238810A (en) * | 1986-09-22 | 1993-08-24 | Nippon Telegraph And Telephone Corporation | Laser magnetic immunoassay method and apparatus thereof |
| FR2604526B1 (fr) * | 1986-09-30 | 1990-12-21 | Indicia Ste Civile Etu Rech | Procede et dispositif de dosage de substances d'interet clinique reactives immunologiquement |
| US4988630A (en) * | 1987-04-27 | 1991-01-29 | Hoffmann-La Roche Inc. | Multiple beam laser instrument for measuring agglutination reactions |
| US5380490A (en) * | 1991-01-18 | 1995-01-10 | Canon Kabushiki Kaisha | Apparatus for measuring a test specimen |
| US5292641A (en) * | 1991-12-13 | 1994-03-08 | Sangstat Medical Corporation | Alloantigen testing by binding assay |
| US5371021A (en) * | 1992-07-17 | 1994-12-06 | Beckman Instruments, Inc. | Initial rate photometric method for immunoassay |
| TW239881B (de) * | 1992-12-22 | 1995-02-01 | Sienna Biotech Inc | |
| US6200820B1 (en) | 1992-12-22 | 2001-03-13 | Sienna Biotech, Inc. | Light scatter-based immunoassay |
| US6984526B2 (en) | 1995-02-08 | 2006-01-10 | University Of South Florida | Spectrophotometric method for determining the viability of a sample containing platelets |
| US5976891A (en) * | 1995-08-22 | 1999-11-02 | U.S. Philips Corporation | Method for investigating non-linear optical behavior of a layer formed from first and second reactants |
| US5858648A (en) * | 1996-11-04 | 1999-01-12 | Sienna Biotech, Inc. | Assays using reference microparticles |
| US5891740A (en) * | 1997-04-02 | 1999-04-06 | The Perkin-Elmer Corporation | Detection of low level hydrophobic analytes in environmental samples using agglutination reaction capillary slide test and apparatus therefor |
| US6893877B2 (en) * | 1998-01-12 | 2005-05-17 | Massachusetts Institute Of Technology | Methods for screening substances in a microwell array |
| ATE477850T1 (de) | 1998-01-12 | 2010-09-15 | Massachusetts Inst Technology | Vorrichtung zur mikrotestdurchführung |
| US6177983B1 (en) * | 1998-09-17 | 2001-01-23 | Microtrac, Inc. | Method and system for the measurement of specific characteristics of small particles |
| AU756982B2 (en) * | 1999-03-19 | 2003-01-30 | Life Technologies Corporation | Multi-through hole testing plate for high throughput screening |
| US6330058B1 (en) | 1999-04-14 | 2001-12-11 | University Of South Florida | Spectrophotometric method and apparatus for blood typing |
| US20020151040A1 (en) | 2000-02-18 | 2002-10-17 | Matthew O' Keefe | Apparatus and methods for parallel processing of microvolume liquid reactions |
| WO2001061054A2 (en) * | 2000-02-18 | 2001-08-23 | Board Of Trustees Of The Leland Stanford Junior University | Apparatus and methods for parallel processing of micro-volume liquid reactions |
| US8277753B2 (en) * | 2002-08-23 | 2012-10-02 | Life Technologies Corporation | Microfluidic transfer pin |
| WO2004042403A2 (en) * | 2002-11-04 | 2004-05-21 | Ludwig-Maximilian-Uni Versität München | Methods, device and instrument for detection of analytes |
| AU2003302264A1 (en) | 2002-12-20 | 2004-09-09 | Biotrove, Inc. | Assay apparatus and method using microfluidic arrays |
| US20050280811A1 (en) * | 2003-09-19 | 2005-12-22 | Donald Sandell | Grooved high density plate |
| US20050225751A1 (en) * | 2003-09-19 | 2005-10-13 | Donald Sandell | Two-piece high density plate |
| EP1735097B1 (de) | 2004-03-12 | 2016-11-30 | Life Technologies Corporation | Ladung eines nanoliter-arrays |
| US12070731B2 (en) | 2004-08-04 | 2024-08-27 | Life Technologies Corporation | Methods and systems for aligning dispensing arrays with microfluidic sample arrays |
| US20060105453A1 (en) | 2004-09-09 | 2006-05-18 | Brenan Colin J | Coating process for microfluidic sample arrays |
| US10023869B2 (en) * | 2013-02-05 | 2018-07-17 | Auramer Bio Limited | Bio-sensor for the detection of small molecules |
| US12533058B2 (en) * | 2023-07-11 | 2026-01-27 | Ii-Vi Delaware, Inc. | Biochemical detection with ultra wideband coherent optical combs |
| CN119601251B (zh) * | 2025-02-10 | 2025-05-02 | 中国人民解放军空军军医大学 | 基于结构化电子病历的日间手术术后病程管理系统 |
Family Cites Families (7)
| Publication number | Priority date | Publication date | Assignee | Title |
|---|---|---|---|---|
| US4080264A (en) * | 1976-03-01 | 1978-03-21 | Massachusetts Institute Of Technology | Immunoassay by light scattering spectroscopy |
| US4268171A (en) * | 1977-07-18 | 1981-05-19 | Beckman Instruments, Inc. | Method determining concentration in rate nephelometric immunochemical analysis |
| US4174952A (en) * | 1978-01-23 | 1979-11-20 | Massachusetts Institute Of Technology | Immunoassay by light scattering intensity anisotropy measurements |
| JPS54108693A (en) * | 1978-02-14 | 1979-08-25 | Mitsubishi Chem Ind | Method and device for optically measuring antigennantibody reaction |
| US4204837A (en) * | 1978-03-14 | 1980-05-27 | Beckman Instruments, Inc. | Method of rate immunonephelometric analysis |
| JPS5925460B2 (ja) * | 1978-05-19 | 1984-06-18 | 株式会社日立製作所 | ネフェロメトリック・イムノアッセイ法及び装置 |
| US4213764A (en) * | 1978-08-09 | 1980-07-22 | Akzona Incorporated | Method for determining immunochemical substances |
-
1981
- 1981-04-24 JP JP56062237A patent/JPS57175957A/ja active Pending
-
1982
- 1982-04-15 US US06/368,610 patent/US4446239A/en not_active Expired - Fee Related
- 1982-04-22 EP EP82103412A patent/EP0064230A3/de not_active Withdrawn
Cited By (9)
| Publication number | Priority date | Publication date | Assignee | Title |
|---|---|---|---|---|
| US4766083A (en) * | 1982-04-04 | 1988-08-23 | Wako Pure Chemical Industries, Ltd. | Method for the photometric determination of biological agglutination |
| GB2129549A (en) * | 1982-11-09 | 1984-05-16 | Univ London | Detecting particles and changes in particle size in a suspension |
| EP0118894A3 (de) * | 1983-03-11 | 1986-01-08 | E.I. Du Pont De Nemours And Company | Messung der Verteilung der Grösse eines Reagensteilchens für Immuntest |
| US4665020A (en) * | 1984-05-30 | 1987-05-12 | United States Department Of Energy | Flow cytometer measurement of binding assays |
| GB2173004A (en) * | 1985-03-29 | 1986-10-01 | Toshiba Kk | Biological microparticle inspection apparatus |
| US4747685A (en) * | 1985-03-29 | 1988-05-31 | Kabushiki Kaisha Toshiba | Biological microparticle inspection apparatus |
| EP0455702A4 (en) * | 1989-01-26 | 1992-04-08 | Seradyn, Inc. | Quantitative immunoassay system |
| EP0418874A3 (en) * | 1989-09-20 | 1992-02-26 | Mitsubishi Rayon Kabushiki Kaisha | Method and apparatus for scattered light measurements |
| EP2762885A1 (de) * | 2013-01-31 | 2014-08-06 | Sysmex Corporation | Immunoassay-Verfahren und Immunoassay-Vorrichtung |
Also Published As
| Publication number | Publication date |
|---|---|
| EP0064230A3 (de) | 1984-03-28 |
| JPS57175957A (en) | 1982-10-29 |
| US4446239A (en) | 1984-05-01 |
Similar Documents
| Publication | Publication Date | Title |
|---|---|---|
| US4446239A (en) | Light scattering immunoassay involving particles with selective frequency band apparatus | |
| EP0118894A2 (de) | Messung der Verteilung der Grösse eines Reagensteilchens für Immuntest | |
| US3990851A (en) | Process and device for measuring antigen-antibody reactions | |
| RU2111488C1 (ru) | Способ агглютинации частиц для одновременного исследования нескольких аналитов в одном образце | |
| US4421860A (en) | Homogeneous fluoroimmunoassay involving autocorrelation processing of optically sensed signals | |
| EP0091636A2 (de) | Verfahren zur photometrischen Bestimmung biologischer Agglutinaten | |
| KR970048449A (ko) | 혈소판을 동정 및 정량하고, 전혈 샘플을 사용한 혈소판 활성화 상태를 결정하기 위한 고도로 민감하고 정확한 자동화 방법 | |
| US4204837A (en) | Method of rate immunonephelometric analysis | |
| CA1081497A (en) | System for rate immunonephelometric analysis | |
| CN108279229B (zh) | 一种全血crp检测装置 | |
| US8697351B2 (en) | Method for measurement of physiologically active substance derived from organism and measurement apparatus | |
| JPS63298137A (ja) | イメ−ジファイバを用いた検体分析装置 | |
| JPH06174724A (ja) | 免疫学的測定装置 | |
| CN114981656A (zh) | 血液凝固测定装置、血液凝固时间的测定方法、血液凝固反应的完成判定方法以及血液自动离心分离装置 | |
| JPS61173138A (ja) | 光強度ゆらぎによる免疫反応測定方法 | |
| GB1600139A (en) | Method and apparatus for the measurement of antigens and antibodies | |
| JPS62116263A (ja) | 直線偏光の多重散乱を用いる免疫反応の測定方法および装置 | |
| JPH0619349B2 (ja) | 体液成分分析方法およびその装置 | |
| JPH0650314B2 (ja) | 免疫反応測定装置 | |
| JPS63247644A (ja) | 免疫反応測定方法 | |
| JPS6165144A (ja) | 光強度ゆらぎを用いる免疫反応測定装置 | |
| JPS61173139A (ja) | 光強度ゆらぎによる免疫反応測定方法 | |
| JPH03274462A (ja) | 検体検査方法及び装置、並びに検体検査用試薬 | |
| JPH0552848A (ja) | 免疫測定法および装置 | |
| JPH0421821B2 (de) |
Legal Events
| Date | Code | Title | Description |
|---|---|---|---|
| PUAI | Public reference made under article 153(3) epc to a published international application that has entered the european phase |
Free format text: ORIGINAL CODE: 0009012 |
|
| AK | Designated contracting states |
Designated state(s): AT BE CH DE FR GB IT NL SE |
|
| PUAL | Search report despatched |
Free format text: ORIGINAL CODE: 0009013 |
|
| AK | Designated contracting states |
Designated state(s): AT BE CH DE FR GB IT LI NL SE |
|
| STAA | Information on the status of an ep patent application or granted ep patent |
Free format text: STATUS: THE APPLICATION IS DEEMED TO BE WITHDRAWN |
|
| 18D | Application deemed to be withdrawn |
Effective date: 19850329 |
|
| RIN1 | Information on inventor provided before grant (corrected) |
Inventor name: TSUJI, YASUHIRO Inventor name: WAKABAYASHI, KIYOSHIGE |