EP0177058A2 - Verfahren und Einrichtung zur Histogrammberechnung - Google Patents
Verfahren und Einrichtung zur Histogrammberechnung Download PDFInfo
- Publication number
- EP0177058A2 EP0177058A2 EP85112606A EP85112606A EP0177058A2 EP 0177058 A2 EP0177058 A2 EP 0177058A2 EP 85112606 A EP85112606 A EP 85112606A EP 85112606 A EP85112606 A EP 85112606A EP 0177058 A2 EP0177058 A2 EP 0177058A2
- Authority
- EP
- European Patent Office
- Prior art keywords
- histogram
- storage
- items
- histogrammer
- word length
- Prior art date
- Legal status (The legal status is an assumption and is not a legal conclusion. Google has not performed a legal analysis and makes no representation as to the accuracy of the status listed.)
- Withdrawn
Links
Images


Classifications
-
- G—PHYSICS
- G06—COMPUTING OR CALCULATING; COUNTING
- G06F—ELECTRIC DIGITAL DATA PROCESSING
- G06F17/00—Digital computing or data processing equipment or methods, specially adapted for specific functions
- G06F17/10—Complex mathematical operations
- G06F17/18—Complex mathematical operations for evaluating statistical data, e.g. average values, frequency distributions, probability functions, regression analysis
Definitions
- This invention relates to a method for calculating a histogram, in accordance with the preamble of claim 1 and a device for calculating such histograms.
- a histogram is a basic statistical information for image processing such as the quantization of an image, classification, and pattern recognition. To understand this, take the quantization of a color image for an example.
- Quantization means classification of sample values and mapping of the sample values in the same group of single values.
- 2 8x3 sample values must be assigned to 256 variable display colors.
- false contours will be actualized.
- fine classification is made for the sample value range where the frequency is high
- coarse classification is made for the sample value range where the frequency is low (tapered quantization).
- a histogram is used as the reference.
- the dimensions of color image to be processed are normally 3, and each dimension is usually displayed with 8 bits.
- the image data obtained by scanning a photograph with a digitizer is typically of 3 dimensions (red, green and blue) with 8 bits given to each dimension.
- Sensors for remote sensing have normally 5-8 dimensions. When a sensor for pattern recognition will be developed, images with more than 3 dimensions will have to be processed.
- the histogram indicates both images having completely different characteristics. Since the maximum value of frequencies cumulated in any word location is arranged to be the same as the number of picture elements of the image (as is obvious when single-color pictures are considered), a word length exceeding 20 is required for an image consisting of 1,024 x 1,024 picture elements, a word length exceeding 22 is required for an image consisting of 2,048 x 2,048 picture elements, and a word length exceeding 24 is required for an image consisting of 4,096 x 4,096 picture elements. It is unrealistic from the viewpoint of costs to have a storage for the histogrammer to satisfy the requirements of the number of word locations and word length.
- the invention proposes a storage for histogram with an enormous number of word locations having short word length. Using this storage, the histogram of an image is obtained in one or several phases of processing. Since this storage for histogram has a short word length, the number of word locations can be made larger than that in conventional storages, and the repetition of histogram calculations can be reduced.
- an auxiliary storage with a word length long enough to prevent overflow, and a relatively small number of word locations is also provided.
- the items for which the histogram is calculated are divided into a plurality of groups, and each of the resulting item groups is connected to each of the word locations of the auxiliary storage.
- the content of the auxiliary storage is incremented at the corresponding location.
- histogram calculation for items extracted is performed using the auxiliary storage, and the values of histograms previously obtained with the storage for histogram are corrected by the results of histogram calculation.
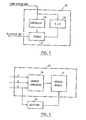
- Figure 1 shows schematically an embodiment of a display system for executing image display after color quantization, for example, an IBM 7350 Image Processing System to which this invention is applied.
- the host 1 is connected to the system bus 3 of the image processing system 2 through the I/O controller 4. Also connected to the system bus 3 are the histogram unit 5, the refresh buffer 6, the color lookup table 7, and other system resources not shown.
- the display data are stored in the refresh buffer 6, and the refresh buffer 6 is accessed in synchronism with the vertical and horizontal scanning of the CRT 8.
- the outputs of the refresh buffer 6 are converted with the color lookup table 7, then, supplied to, for example, D/A converters 9, 10 and 11 corresponding to primary color signals of red, green and blue, respectively, and the CRT 8 is driven by the outputs of these D/A converters 9, 10 and 11.
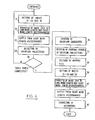
- FIG. 2 shows the operation of picture processing by quantizing with the system shown in Figure 1.
- histogram calculation is first executed (Step 12).
- the input image data obtained from the digitizer (not shown) are supplied to the histogram-unit 5 from the host 1, and a histogram is produced.
- the detail of the histogram unit 5 will be described later.
- the histogram is then transferred to the host 1, and the host 1 executes the predetermined quantization algorithm referring to this histogram and produces the mapping table for the quantization of colors (Step 13).
- the host 1 divides the assumed color space into a number of small color spaces equal to the number of colors which can be displayed on the CRT 8 at the same time, and selects the optimum color to represent each of these small color spaces.
- the sample value, or original colors in each small color space is mapped to the corresponding color selected.
- the sample value, or original colors in each small color space is mapped to the corresponding color selected.
- Colors selected by such quantization algorithm are set to entries 0 - 4,095 of the color lookup table CLT 7 (Step 14).
- image data are converted to color numbers 0 - 4,095 (corresponding to entries 0 - 4,095) according to the mapping table described above, transferred to the refresh buffer 6, and stored (Step 15). Then, the data are displayed on the CRT 8 according to the data stored in the refresh buffer 6 (Step 16).
- Figure 3 shows the configuration of the histogram unit 5. It is shown to process image data with three dimensions of red, green and blue. Of course it can be arranged for image data of more than three dimensions.
- overflow detection and correction tables 21, 22 and 23 corresponding to each of red, green and blue band, respectively, are connected to the system bus 3.
- Each output of the tables 21, 22 and 23 is supplied to the adder 24, where addition is executed.
- the output of the adder 24 is supplied to the long word length histogrammer 25, and the output of this long word length histogrammer is supplied to the host 1 through the system bus 3 and the I/O controller 4.
- the long word length histogrammer 25 has a relatively small number of long word length registers. When this invention is applied to an IBM 7350 Image Processing System, the histogrammer consisting of 4,096 32-bit registers is used as the long word length histogrammer 25.
- An image having 1,024 x 1,024 picture elements can be processed with 20-bit words, and images having 2,048 x 2,048 and 4,096 x 4,096 picture elements can be processed with 22-bit and 24-bit words, respectively. From this is obvious that the long word length histogrammer 25 is sufficient for the histogram calculation of normal pictures.
- the long word length histogrammer 25 consists of the controller 26, the storage 27 and the ALU 28.
- the content of corresponding location in the storage 27 is accessed, 1 is added to the content at the ALU 28, and the content is returned to the original location.
- the short word length histogrammer 29 and the selection table 30 are also connected to the system bus 3.
- the short word length histogrammer 29 is used to produce a histogram over all the sample values tentatively. It has a storage with a relatively large number of short word length word locations.
- the word length of this storage is, for example, 10 bits, and it is anticipated that overflow occurs at some locations during usual histogram calculation.
- the refresh buffer 6 ( Figure 1) can be used as the histogrammer 29.
- a 1/16 region of the refresh buffer 6 can be used for the transfer of a 3-dimension, 6-bit image in 4 times of image data transfer.
- image data transfer is required 16 times in total, even if the total capacity of 1,048,576 locations is used in the refresh buffer.
- the address converter 6a shown in Figure 6 is required for accessing the locations of the refresh buffer 6 by image element data.
- the X-Y random access processor can be used. It should be noted that the number of locations in a conventional histogrammer was 4,096, and that 4,096 repetitions or phases were required to process a 3-dimension, 8-bit image.
- the selection table 30 will be described later.
- the selection table 30 and overflow detection/correction Table 21 - 23 are set (Step 31).
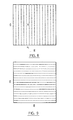
- the selection Table 30 masks the regions other than the first region (S1 in Figure 7) occupying 1/4 of the entire space of sample values, and invalidates picture elements corresponding to second, third and fourth regions (S2, S3, and S4 in Figure 7) transferred to the short word length histogrammer 29.
- picture element data corresponding to the first region, Sl is transferred to the short word length histogrammer 29, 1 is added to the content of corresponding locations of the storage, and the histogram calculation is performed (Step 32).
- overflow detection/correction tables 21 - 23 operate together with the adder 24, and divide the sample value space according to the red display bits R of the sample values to make the sample value in the same division a single value.
- This step is schematically shown in Figure 8.
- the sample value space is shown to be of 2 dimensions of red and green, this is only for the simplification of description.
- the red display bits in the picture element data are supplied to the adder 24 through the Table 21, whereas the output of Tables 22 and 23 are set to "0" regardless of the values of green and blue display bits.
- Step 32 When the picture element data are converted by Tables 21, 22 and 23, and the adder 24, and are supplied to the long word length histogrammer 25, the frequencies of sample values are cumulated for each division shown in Figure 8 (Step 32). This is as if the frequencies of sample values are projected on the red axis. If the sample value indicated by X in Figure 8 is assumed to overflow out of the short word length histogrammer 29, the accumulated value of the projections i, on the corresponding red axis becomes equal to or greater than the overflow value. When the accumulated value of projections on the red axis is equal to or greater than the overflow value, it is reasonable to make these projections the candidates of overflown sample values (Step 34).
- the histogram of the first region Sl is calculated with the short word length histogrammer 29, and the projection of the candidates of overflow sample values on the red axis is obtained using the long word length histogrammer 25. Similar sequences are repeated twice.
- the selection Table 30 is set to send an enable signal to the short word length histogrammer 29 when the upper two bits are, for example, "01" and "10", respectively, and as the result, histograms of second and third regions, S2 and S3, in Figure 7 are calculated.
- the overflow detection/correction Tables 21, 22 and 23, and the adder 24 divide the picture as shown in Figure 9, and the projection of the candidates of overflown sample values on the green axis is produced.
- the projection of the candidates of overflown sample values on the blue axis is produced by the long word length histogrammer 25.
- the candidates of overflown sample values are extracted based on the projections of the candidates of overflown sample values on red, green and blue axes (Step 36). If the projections of the candidates of overflown sample values on red, green and blue axes are represented by i 1 , i 2 , and i3, respectively, (i 1 , i 2 , - i3) is the candidate of overflown sample values.
- the normal histogram for the candidate of overflown sample values (i 1 , i 2 , i3) is produced using the long word length histogrammer 25.
- the cardinal numbers C 1 , C 2 , and C 3 for the projections i 1 , i 2 , and i3 of the candidates of overflown sample values on red, green and blue axes, respectively, are determined (Step 37), and the mapping rule between the candidates of overflown sample values (i 1 , i 2 , i3) and the storage locations of the long word length histogrammer 25 is decided in accordance with these cardinal numbers C 1 , C 2 , and C 3 (Step 38).
- Step 39 the overflow detection/correction Tables 21, 22 and 23 are set according to this mapping rule.
- the image data are transferred from the host 1 to the system 2, and the histogram for the candidates of overflown sample values (i 1 , i 2 , i3) is calculated with the long word length histogrammer 25 (Step 40).
- the candidates of overflown sample values (i 1, i 2 , i3) are mapped in the location l, of the long word length histogrammer 25 according to the mapping rule of: corresponding where n 1 (i 1 ) is the ordinal number of the projection on the red axis, i 1 , and n 2 (i 2 ) and n 3 (i 3 ) are the ordinal numbers of the projections on the green and blue axes i 2 and i3, respectively.
- the Tables 21, 22 and 23 which realize such a mapping rule are as follows: First, the Table 21 outputs zero whenever a value other than i l is input, and outputs n 1 (i 1 ) x 1 when i 1 is input. The Table 22 outputs zero whenever a value other than i 2 is input, and outputs n 2 (i 2 ) x 1 x (C 1 +1) when i 2 is input. The Table 23 outputs zero whenever a value other than i3 is input.
- mapping rule l(i 1 , i 2 , i3) is:
- Tables 21, 22 and 23 are set according to this rule as shown in Figures 11, 12 and 13, respectively.
- Tables 21, 22 and 23 After setting such tables, when the candidate of an overflown sample value (ii l , i 21' i 31 ) is transferred, Tables 21, 22 and 23 output "1", “7” and "42", respectively, and the content of the location of "5 0 " in the long word length histogrammer 25 is increased.
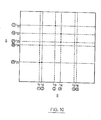
- Figure 14 shows the storage locations of candidates of overflown sample values in the long word length histogrammer 25.
- the candidate (i 13 , i 22 , i 31 ) is mapped at locations indicated by X.
- the important numbers for the mapping of the candidate (i 13 , i 22 , i 31 ) are underscored.
- a sample value other than the candidates of overflown sample values are transferred, at least one of Tables 21, 22 and 23 becomes zero.
- the hatched region in Figure 14A is the location corresponding to the case where the blue display bit in the picture element data is not i3.
- the hatched region in Figure 14B is the location corresponding to the case where the green display bit in the picture element data is not i 2 .
- the point indicated by o is the location corresponding to the case where the red display bit is not i l . It is obvious that other regions directly correspond to overflown sample values (i 1 , i 2 , i3).
- Step 39 the selection Table 30 is also set, then in Step 40, the histogram of the region S4 in Figure 7 is calculated by the short word length histogrammer 29. This histogram is transferred to the host 1 (Step 41), and the complete histogram for a picture is obtained even tentatively. Then, the histogram of the candidate of overflown sample values (i i , i 2 , i3) obtained using the long word length histogrammer 25 is transferred to the host 1, and the above completed histogram is corrected (Step 42). Histogram calculation is thus completed.
- n Tables 21, 22 and 23 must be prepared. It is also possible to use a table means divided into n regions. In fact, the input lookup table is divided into a plurality of segments in an IBM 7350 Image Processing System. The selection table can also be realized by using this input lookup table.
- mapping rule for the n-dimensional case is then:
Landscapes
- Engineering & Computer Science (AREA)
- Physics & Mathematics (AREA)
- Data Mining & Analysis (AREA)
- General Physics & Mathematics (AREA)
- Mathematical Optimization (AREA)
- Pure & Applied Mathematics (AREA)
- Theoretical Computer Science (AREA)
- Mathematical Physics (AREA)
- Computational Mathematics (AREA)
- Mathematical Analysis (AREA)
- Databases & Information Systems (AREA)
- Operations Research (AREA)
- Probability & Statistics with Applications (AREA)
- Bioinformatics & Cheminformatics (AREA)
- Algebra (AREA)
- Evolutionary Biology (AREA)
- Life Sciences & Earth Sciences (AREA)
- Software Systems (AREA)
- General Engineering & Computer Science (AREA)
- Bioinformatics & Computational Biology (AREA)
- Image Analysis (AREA)
- Ultra Sonic Daignosis Equipment (AREA)
- Apparatus For Radiation Diagnosis (AREA)
Applications Claiming Priority (2)
| Application Number | Priority Date | Filing Date | Title |
|---|---|---|---|
| JP207243/84 | 1984-10-04 | ||
| JP59207243A JPS6190277A (ja) | 1984-10-04 | 1984-10-04 | ヒストグラム計算方法 |
Publications (2)
| Publication Number | Publication Date |
|---|---|
| EP0177058A2 true EP0177058A2 (de) | 1986-04-09 |
| EP0177058A3 EP0177058A3 (de) | 1990-01-31 |
Family
ID=16536580
Family Applications (1)
| Application Number | Title | Priority Date | Filing Date |
|---|---|---|---|
| EP85112606A Withdrawn EP0177058A3 (de) | 1984-10-04 | 1985-10-04 | Verfahren und Einrichtung zur Histogrammberechnung |
Country Status (2)
| Country | Link |
|---|---|
| EP (1) | EP0177058A3 (de) |
| JP (1) | JPS6190277A (de) |
Cited By (2)
| Publication number | Priority date | Publication date | Assignee | Title |
|---|---|---|---|---|
| DE4213717A1 (de) * | 1992-04-25 | 1993-10-28 | Asea Brown Boveri | Verfahren zur Ermittlung eines Häufigkeits-Zeitprofils von Ereignissen sowie Vorrichtung zur Durchführung des Verfahrens |
| CN110443743A (zh) * | 2019-07-31 | 2019-11-12 | 中山市奥珀金属制品有限公司 | 一种图像矩阵内存防止溢出处理方法及系统 |
Family Cites Families (3)
| Publication number | Priority date | Publication date | Assignee | Title |
|---|---|---|---|---|
| US3760377A (en) * | 1970-07-17 | 1973-09-18 | Ibm | Histogram data processor |
| US4445138A (en) * | 1981-12-21 | 1984-04-24 | Hughes Aircraft Company | Real time dynamic range compression for image enhancement |
| CA1248218A (en) * | 1983-07-29 | 1989-01-03 | William R. Wray | Method and apparatus for image processing with field portions |
-
1984
- 1984-10-04 JP JP59207243A patent/JPS6190277A/ja active Granted
-
1985
- 1985-10-04 EP EP85112606A patent/EP0177058A3/de not_active Withdrawn
Cited By (3)
| Publication number | Priority date | Publication date | Assignee | Title |
|---|---|---|---|---|
| DE4213717A1 (de) * | 1992-04-25 | 1993-10-28 | Asea Brown Boveri | Verfahren zur Ermittlung eines Häufigkeits-Zeitprofils von Ereignissen sowie Vorrichtung zur Durchführung des Verfahrens |
| US5359533A (en) * | 1992-04-25 | 1994-10-25 | Asea Brown Boveri Ltd. | Method for determining a frequency/time profile of hits, and device for carrying out the method |
| CN110443743A (zh) * | 2019-07-31 | 2019-11-12 | 中山市奥珀金属制品有限公司 | 一种图像矩阵内存防止溢出处理方法及系统 |
Also Published As
| Publication number | Publication date |
|---|---|
| EP0177058A3 (de) | 1990-01-31 |
| JPS6190277A (ja) | 1986-05-08 |
| JPH0410669B2 (de) | 1992-02-26 |
Similar Documents
| Publication | Publication Date | Title |
|---|---|---|
| KR970002145B1 (ko) | 칼라 화상 신호의 처리 방법 및 장치 | |
| EP1014699B1 (de) | Verfahren zur Selektion von Farbblockpunkten für die Blockkodierung | |
| US5412766A (en) | Data processing method and apparatus for converting color image data to non-linear palette | |
| US5539843A (en) | Image processing system | |
| US6411730B1 (en) | Histogram for generating a palette of colors | |
| US20030146925A1 (en) | Generating and using a color palette | |
| EP0576786B1 (de) | Fehlerdiffusionsprozessor und Verfahren zur Umwandlung eines Bildes mit Grauskalaelementen in ein Bild mit Binärwertelementen | |
| US5398123A (en) | Image processing method and apparatus capable of automatic color masking | |
| JPH0795430A (ja) | 色変換装置及び方法 | |
| JPH07203234A (ja) | カラー画像変換装置 | |
| US4607340A (en) | Line smoothing circuit for graphic display units | |
| US5195180A (en) | Method for displaying an image including characters and a background | |
| US7443544B2 (en) | Accelerating color conversion using a temporary palette cache | |
| US6693644B1 (en) | Graphic accelerator reducing and processing graphics data | |
| US5283840A (en) | Method and apparatus for extracting image data | |
| EP0177058A2 (de) | Verfahren und Einrichtung zur Histogrammberechnung | |
| US5264946A (en) | Apparatus and method for image extraction with threshold adjustment | |
| US5987182A (en) | Markov model image encoding device and method | |
| JPH05135162A (ja) | 画像処理装置 | |
| US5905821A (en) | Compression/expansion circuit having transfer means and storage means with address management of the storage means | |
| JP2730399B2 (ja) | イメージデータ縮小装置 | |
| JP3055390B2 (ja) | 画像処理装置 | |
| US5103487A (en) | Image processing method | |
| JP2605734B2 (ja) | 画像信号圧縮方法 | |
| JPH09186898A (ja) | 画像処理装置及びその方法 |
Legal Events
| Date | Code | Title | Description |
|---|---|---|---|
| PUAI | Public reference made under article 153(3) epc to a published international application that has entered the european phase |
Free format text: ORIGINAL CODE: 0009012 |
|
| AK | Designated contracting states |
Kind code of ref document: A2 Designated state(s): DE FR GB IT |
|
| 17P | Request for examination filed |
Effective date: 19860819 |
|
| PUAL | Search report despatched |
Free format text: ORIGINAL CODE: 0009013 |
|
| AK | Designated contracting states |
Kind code of ref document: A3 Designated state(s): DE FR GB IT |
|
| 17Q | First examination report despatched |
Effective date: 19911105 |
|
| STAA | Information on the status of an ep patent application or granted ep patent |
Free format text: STATUS: THE APPLICATION HAS BEEN WITHDRAWN |
|
| 18W | Application withdrawn |
Withdrawal date: 19920311 |
|
| RIN1 | Information on inventor provided before grant (corrected) |
Inventor name: TOZAWA, YOSHIO |