EP0188894A1 - Technique utilisant une méthode statistique spécifique pour obtenir des informations associées à la pression sanguine d'un patient - Google Patents
Technique utilisant une méthode statistique spécifique pour obtenir des informations associées à la pression sanguine d'un patient Download PDFInfo
- Publication number
- EP0188894A1 EP0188894A1 EP19850309205 EP85309205A EP0188894A1 EP 0188894 A1 EP0188894 A1 EP 0188894A1 EP 19850309205 EP19850309205 EP 19850309205 EP 85309205 A EP85309205 A EP 85309205A EP 0188894 A1 EP0188894 A1 EP 0188894A1
- Authority
- EP
- European Patent Office
- Prior art keywords
- patient
- pressure
- cuff
- systolic
- diastolic
- Prior art date
- Legal status (The legal status is an assumption and is not a legal conclusion. Google has not performed a legal analysis and makes no representation as to the accuracy of the status listed.)
- Granted
Links
- 230000036772 blood pressure Effects 0.000 title claims abstract description 149
- 238000000034 method Methods 0.000 title claims abstract description 91
- 230000035488 systolic blood pressure Effects 0.000 claims abstract description 123
- 230000035487 diastolic blood pressure Effects 0.000 claims abstract description 108
- 230000009466 transformation Effects 0.000 claims abstract description 98
- 238000012544 monitoring process Methods 0.000 claims abstract description 13
- 238000005259 measurement Methods 0.000 claims description 52
- 230000003205 diastolic effect Effects 0.000 claims description 49
- 210000001367 artery Anatomy 0.000 claims description 38
- 230000008859 change Effects 0.000 claims description 34
- 230000007423 decrease Effects 0.000 claims description 34
- 230000003466 anti-cipated effect Effects 0.000 claims description 23
- 239000008280 blood Substances 0.000 claims description 6
- 210000004369 blood Anatomy 0.000 claims description 5
- 101100222276 Drosophila melanogaster cuff gene Proteins 0.000 claims 67
- 238000012935 Averaging Methods 0.000 claims 2
- 238000010586 diagram Methods 0.000 description 7
- 238000010420 art technique Methods 0.000 description 4
- 230000010354 integration Effects 0.000 description 4
- 230000035485 pulse pressure Effects 0.000 description 4
- 230000008901 benefit Effects 0.000 description 3
- 230000010349 pulsation Effects 0.000 description 3
- 230000002123 temporal effect Effects 0.000 description 3
- 238000004364 calculation method Methods 0.000 description 2
- 230000001419 dependent effect Effects 0.000 description 2
- 238000011156 evaluation Methods 0.000 description 2
- 230000006870 function Effects 0.000 description 2
- 230000035945 sensitivity Effects 0.000 description 2
- 241000124008 Mammalia Species 0.000 description 1
- 210000004712 air sac Anatomy 0.000 description 1
- 238000004458 analytical method Methods 0.000 description 1
- 238000013459 approach Methods 0.000 description 1
- 230000004872 arterial blood pressure Effects 0.000 description 1
- 238000002555 auscultation Methods 0.000 description 1
- 238000009530 blood pressure measurement Methods 0.000 description 1
- 230000003247 decreasing effect Effects 0.000 description 1
- 230000000694 effects Effects 0.000 description 1
- 239000000284 extract Substances 0.000 description 1
- 230000001788 irregular Effects 0.000 description 1
- 238000004519 manufacturing process Methods 0.000 description 1
- 230000003534 oscillatory effect Effects 0.000 description 1
- 230000008569 process Effects 0.000 description 1
- 230000009467 reduction Effects 0.000 description 1
- 230000004044 response Effects 0.000 description 1
- 238000001228 spectrum Methods 0.000 description 1
- 238000001356 surgical procedure Methods 0.000 description 1
Images








Classifications
-
- A—HUMAN NECESSITIES
- A61—MEDICAL OR VETERINARY SCIENCE; HYGIENE
- A61B—DIAGNOSIS; SURGERY; IDENTIFICATION
- A61B5/00—Measuring for diagnostic purposes; Identification of persons
- A61B5/02—Detecting, measuring or recording for evaluating the cardiovascular system, e.g. pulse, heart rate, blood pressure or blood flow
- A61B5/021—Measuring pressure in heart or blood vessels
- A61B5/022—Measuring pressure in heart or blood vessels by applying pressure to close blood vessels, e.g. against the skin; Ophthalmodynamometers
-
- A—HUMAN NECESSITIES
- A61—MEDICAL OR VETERINARY SCIENCE; HYGIENE
- A61B—DIAGNOSIS; SURGERY; IDENTIFICATION
- A61B5/00—Measuring for diagnostic purposes; Identification of persons
- A61B5/02—Detecting, measuring or recording for evaluating the cardiovascular system, e.g. pulse, heart rate, blood pressure or blood flow
- A61B5/021—Measuring pressure in heart or blood vessels
- A61B5/02108—Measuring pressure in heart or blood vessels from analysis of pulse wave characteristics
- A61B5/02116—Measuring pressure in heart or blood vessels from analysis of pulse wave characteristics of pulse wave amplitude
Definitions
- the present invention relates generally to blood pressure evaluation procedures and more particularly to non-invasive techniques for determining certain information associated with blood pressure.
- the systolic and diastolic pressures are determined by listening to certain sounds (Korotkoff sounds) which occur as a result of the cuff first being pressurized and then depressurized whereas oscillometry actually measures changes in pressure in the cuff as a result of changes in blood pressure as the cuff is first pressurized and then depressurized.
- a more specific object of the present invention is to provide a different uncomplicated and yet reliable technique for generating non-invasively a waveform closely approximating an individual's true blood pressure waveform which, heretofore, has been obtainable by invasive means only.
- Another particular object of the present invention is to provide a new way for measuring and calculating the mean arterial pressure of an individual.
- Another specific object of the present invention is to provide a new, uncomplicated and yet reliable technique for generating a transformation curve unique to a given patient.
- Still another specific object of the present invention is to provide a technique for successively monitoring certain parameters of a patient's blood pressure including his systolic and diastolic pressures over closely spaced intervals of time without having to subject the patient to cuff pressures much greater than his diastolic pressure, other than initially (for purposes of calibration).
- Yet another specific object of the present invention is to provide a technique for measuring a patient's diastolic and systolic blood pressures at any given instance without ever having to subject the patient to cuff pressures much greater than his diastolic pressure.
- a suitably sized cuff for example one which is 20 inches long and 5 inches wide, is positioned around the upper arm of an individual, a human being specifically or a mammal in general (hereinafter referred to as the patient) and initially pressurized to a certain minimum level.
- this minimum level need not be much greater than the patient's diastolic pressure to obtain certain information about the patient's blood pressure including his diastolic and systolic pressures.
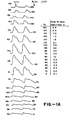
- FIG 1 diagrammatically illustrates three successive cuff pressure waveforms 10h, 10i and 10j which correspond to the change in arterial volume in a pressurized cuff, as described above, at three different cuff pressures, specifically cuff pressures of 90 Torr, 80 Torr and 70 Torr respectively.
- cuff pulses a greater number of cuff pressure waveforms (hereinafter referred to as cuff pulses) are generated starting at a high cuff pressure such as 160 Torr and ending at a cuff pressure of zero, as will be seen in Figure 1A.
- each waveform has what may be referred to as a systolic rise S at one end of the waveform, a diastolic decline D d at the opposite end and a maximum amplitude A.
- P c (dc) the applied cuff pressure to which the patient is subjected
- P c (ac) the cuff pulses themselves are the result of a fluctuation in cuff pressure with time (due to the change in the patient's blood pressure), they will sometimes be referred to herein as P c (ac).
- P c (dc) may assume values from 0 to 250 Torr whereas the cuff pulses P c (ac) usually have peak to peak values less than 10 Torr.
- the systolic rise S r, the diastolic decline D d and the amplitude A vary from pulse to pulse for reasons to be explained hereinafter. It is because of these variations that the techniques disclosed in the Link and Link et al patents recited above can be used to determine the diastolic and systolic pressures. Specifically, as will be seen, when the diastolic pressure of a patient is equal to the applied cuff pressure P c (dc), the cuff pulse P c (ac) generated has a final diastolic decline which is greater in slope than the diastolic decline of any of the other cuff pulses.
- the generally S-shaped transformation curve 12 illustrated is shown within a horizontal/vertical coordinate system where the horizontal axis is the transmural pressure or the wall pressure P across the artery wall of a given patient, within the confines of the applied cuff.
- the vertical axis corresponds to the arterial volume V of the artery within the cuff, as measured by the internal volume of the cuff itself.
- the transformation curve transforms applied blood pressure waveforms (which directly effect P w on the horizontal axis) to cuff pulses P c (ac) (which are dependent on arterial volume V within the cuff on the vertical axis).
- the vertical axis of the S-shaped curve of Figure 2 may be labelled by V or P (ac) interchangeably depending on the phenomena being described.
- the proportionality of P c (ac) to V is valid over the central regions of the S-shaped curve of Figure 2 but may be less valid for very small cuff pressures P c (dc).
- P the wall pressure or transmural pressure
- P b (D) the wall pressure or transmural pressure
- P b (S) the wall pressure or transmural pressure
- the patient's actual blood pressure waveform 15 is superimposed on the V/P coordinate system in Figure 2 within the pulse pressure band 14. As seen there, this waveform is made up of a series of actual blood pressure pulses 16 (pressure versus time), each of which corresponds to a single beat of the patient's heart.
- each pulse starts at a minimum pressure (the diastolic pressure of the patient) at a given time t o and sharply increases along its leading edge which is the systolic rise S r until it reaches a maximum (the patient's systolic blood pressure), at which time it drops back down along a trailing edge which includes a dichrotic notch and a diastolic decline D d to the minimum pressure again at a second time t o .
- a minimum pressure the diastolic pressure of the patient
- each of the cuff pulses 10 in Figure 2 has a systolic rise S r and a diastolic decline Dd corresponding to the systolic rise and diastolic decline of each blood pressure pulse 16.
- a blood pressure increase causes an arterial volume increase.
- This arterial volume increase causes a cuff bladder air volume decrease which in turn causes a cuff bladder air-pressure increase. Therefore, at a given applied cuff pressure P c (dc), a blood pressure increase results in a cuff air pressure increase.
- the amplitude A of the resultant cuff pulse 10 is about one-half of the amplitude of the cuff pulse having a maximum amplitude. Therefore, a patient's systolic blood pressure can be determined by first generating a series of cuff pulses across the cuff pressure spectrum, as in Figure lA. From these pulses, the one having maximum amplitude Amax is determined and then the cuff pulse having half that amplitude (at a greater cuff pressure) is found. The cuff pressure P c (dc) used to generate that pulse corresponds to the patient's systolic pressure.
- each blood pressure pulse 16 making up this waveform is identical to the next one. Both of these aspects of the waveform are assumed for purposes herein. Moreover, each pulse has its own systolic rise S and diastolic decline D d , as mentioned heretofore. It should also be noted that the transformation curve 12 dictates the relationship between V or P c (ac) (on the vertical axis) and P w or P c (dc) (on the horizontal axis) at each and every point on the individual blood pressure pulse 16, not merely at the extreme diastolic and systolic end points of each pulse.
- the transformation curve dictates the relationship between the amplitude P c (ac) at any point on the blood pressure pulse 16 for any given applied cuff pressure P c (dc).
- the measuring band e.g. the pressure difference between the two measuring points
- ⁇ V 1 ' is determined for a cuff pressure P c (dc) of zero using the pressure band 18 which encompasses a small part of the diastolic decline of each blood pressure pulse 16.
- ⁇ V 2 ' is determined for a cuff pressure of P c (dc) of 50 Torr by shifting the band to 18' and, ⁇ V 3 ' is determined for a cuff pressure P c (dc) of 80 Torr (e.g. the patient's diastolic blood pressure) by shifting the band to 18". Finally ⁇ V 4 ' is determined at an even higher cuff pressure by shifts to band 18"'., Note that ⁇ V' is maximum when the applied cuff pressure P c (dc) is equal to the patient's diastolic blood pressure.
- the one cuff pressure producing a maximum volume change will correspond to the patient's diastolic blood pressure.
- the lowest pressure part of the diastolic decline D d forming part of each pulse 16 is particularly suitable for this purpose since it can be readily located during each cycle of the waveform. This is because it immediately precedes the systolic rise S which is readily distinguishable each time it appears. This procedure is described in more detail in the previously recited Link Patent 3,903,872 along with means for carrying out this procedure electronically.
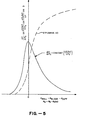
- Figure 5 in this patent illustrates the first time derivative of the measured cuff pressure pulse (hereinafter p) at a time t within a patient's actual blood pressure pulse as a function of applied cuff pressure P c (dc).
- the first derivative corresponds to ⁇ V and the time t corresponds to the temporal center of band 18, 18' and so on where t is on the diastolic decline of the blood pressure pulse close to the start of the next systolic rise.
- the first time derivative of the measured cuff pressure and ⁇ V will be used herein interchangably.
- ⁇ V reflects actual changes in arterial volume
- the first time derivative is a result of actual changes in cuff pressure (which correspond directly to AV).
- a straight forward variable to measure in the cuff pulse waveform is the slope of the pulse near the end of the diastolic decline; thus ⁇ P c (ac)/ ⁇ t or p near the end of pulse or just prior to the next systolic blood pressure rise.
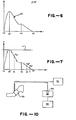
- FIGs 6-8 attention is now directed to a technique provided in accordance with the present invention for generating a waveform which closely approximates an individual patient's actual blood pressure waveform (for example, the blood pressure pulse 16 in Figure 2) without using an invasive device.
- the assumed actual blood pressure pulse is shown graphically in Figure 6 at 20 where the patient's blood pressure (the vertical axis) is measured against time (the horizontal axis).
- the horizontal (time) axis can be made to represent the patient's diastolic blood pressure with t being provided at the vertical axis, indicating the beginning of the waveform and t ' a second point indicating the end of that waveform and the beginning of the next one.
- a dotted horizontal line L 1 can then be drawn above the time axis at the patient's systolic blood pressure.
- a patient's diastolic blood pressure can be determined electronically by varying the applied cuff pressure P c (dc) and detecting the resultant change in cuff volume ⁇ V or ⁇ (the first time derivative of the measured cuff pressure pulses) within the same pressure or measuring band (e.g., the band 18, 18' and so on in Figure 4) in the patient's actual blood pressure waveform, that is, along the diastolic decline just before the systolic rise.
- the cuff pressure P c (dc) resulting in a maximum change in arterial volume ⁇ Vmax or in a maximum p corresponds to the patient's diastolic blood pressure.
- the physical components for carrying out this process are described in the '872 patent and reference is made thereto. These components include means serving as a generator for detecting the beginning of the patient's systolic rise and measuring back therefrom, for example 50 milliseconds, in order to provide repeatedly a 50 millisecond measuring band. During that time the change in cuff volume ⁇ V or p is measured by cooperating means for each applied cuff pressure P c (dc). Means are also provided for determining when ⁇ V or p is at a maximum and for reading out the cuff pressure P c (dc) at ⁇ Vmax or p max, this latter cuff pressure corresponding to the patient's diastolic pressure.
- the generator just recited can be used to provide a series of identical measuring bands of width ⁇ t moving back in time from the systolic rise at t o ', specifically from and generally from as shown in Figure 8, rather than a single band as in Figure 4. These bands are indicated at 22 1 , 22 2 , 22 n and so on.
- the generator means forming part of the components described in the '872 patent can be readily used or easily modified to provide these different points in time and therefore the different bands 22 1 , 22 2 , 22 n and so on.
- the cuff pressure P c (dc) is varied in order to find the cuff pressure which results in a maximum change in cuff volume ⁇ Vmax or maximum p. That cuff pressure corresponds to the patient's actual blood pressure at that point in time in the actual blood pressure curve.
- P c (dc) is found to equal P b 1 at a p max than the patient's actual blood pressure at the time t 1 (where t 1 is temporally the center point of band 22 1 ) is equal to P b l.
- any other position on the waveform at general time t can be located by observing the general applied cuff pressure P c (n) at which the slope of the cuff pressure pulse has a maximum at time t n .
- the observed cuff pressure P c (n) may then be plotted against t as a valid point on the waveform. This is made clear in Figure 7 in which the areas of the waveform which are unmeasurable or poorly measurable by this method are indicated by dotted lines. It is also described generally in Link United States Patent 3,903,872, although not in detail.
- FIG. 9a-d diagrammatically illustrate a number of waveforms having different mean values.
- the mean pressure P b (M) of a blood pressure waveform is equal to the diastolic blood pressure P b (D) plus a particular fraction K of the difference between the patient's systolic blood pressure P b (S) and his diastolic blood pressure. Equation 2A shows this and equation 2B shows the same thing in a ⁇ convenient short hand notation.
- the mean pressure M can be calculated by integrating the waveform (its pressure amplitude P) over time T (the duration of the waveform) so that: and:
- the Figure 9a waveform can be shown to have a K value (which is commonly referred to as the blood pressure constant) of about 0.50.
- the Figure 9b waveform approximates a K value of 0.6 while the Figure 9c waveform approximates a K value of 0.2.
- the Figure 9d waveform approximates a K value of 0.33.
- a diagnostic tool can be provided which not only provides a patient's diastolic and systolic blood pressures non-invasively but also provides a close approximation of the patient's actual blood pressure waveform as well as his mean pressure and blood pressure constant, again non-invasively.
- This tool or arrangement is shown in Figure 10 including suitable cuff means generally indicated at 30 in position around the arm of a patient in the normal operating manner and maintained at different pressure levels from zero pressure to, for example, 160 Torr by suitable means 32.
- the resultant cuff pulses are monitored by transducer 34.
- Suitable and readily providable electronic means 35 serve to receive these pulses and from this information can provide the patient's diastolic and systolic blood pressures along with his transformation curve in accordance with the Link and Link et al patents.
- Means 35 also includes readily providable circuitry for providing the intermediate pressure points at times t 1 t 2 , t 3 , and so on shown in Figures 6-8 and with this information further readily providable circuitry for graphing the waveform in Figure 7 on an oscilloscope or monitor 36.
- means 35 can also include circuitry for calculating the mean pressure P b (M) and blood pressure constant K from this waveform and equations 2-4 above. An actual working embodiment of this overall arrangement is shown by block diagram in Figure 21B which will be discussed hereafter.
- Figure 1A illustrates a particular patient's cuff pulses 10a, 10b and so on, as read out on an oscilloscope, for varying applied cuff pressures P c (dc) starting with a cuff pressure of 160 Torr (pulse 10a) and ending with a cuff pressure of zero (pulse 10q). Note that the peak to peak amplitude (A) of each cuff pulse has been measured and so indicated in Figure lA.
- the peak to peak amplitude values (A) measured from Figure 1A have been graphically plotted against applied cuff pressure and a resultant curve 40 drawn.
- the S-shaped transformation curve 42 of Figure 8 may be plotted.
- the patient's diastolic and systolic pressures together provide a pulse pressure band (e.g. a measuring band) corresponding to the band 14 illustrated in Figure 2. Assuming the patient's diastolic blood pressure is 80 Torr and his systolic blood pressure is 120 Torr, this band is precisely 40 Torr wide.
- the transformation curve 42 is plotted in an x-y coordinate system in which the x-axis (the transmural axis) corresponds to P (the wall pressure of the patient's artery) and the y-axis corresponds to relative arterial volume or P c (ac), as previously described with respect to Figure 2.
- the measuring band is between 80 Torr and 120 Torr and the peak to peak amplitude of the cuff pulse is 0.1 Torr which corresponds (is in direct proportion) to the change in arterial volume (AV) resulting from this cuff pressure.
- V changes an amount so as to produce a cuff pulse amplitude A of 0.1 Torr.
- This point can be plotted in Figure 12 as point 1 on the transformation curve which transforms variations in blood pressure Pb or wall pressure P into cuff pulses P c (ac).
- the wall pressure P oscillates back and forth within the 40 Torr measuring band between 80 Torr and 40 Torr. As seen in Figures 1A, 11 and 12, this results in a peak to peak amplitude of 0.50 Torr and a directly proportionate change in ⁇ V. This may be plotted as point 2. Additional points 3, 4 and 5 have been plotted in Figure 12 corresponding to cuff pressures of 80, 120 and 160. While only five points were plotted, it should be understood that points corresponding to all of the cuff pressures actually measured in Figure 1A and even those interpolated from the curve of Figure 11 could have been plotted. From these points, the transformation curve 42 illustrated in Figure 12 can be readily drawn.
- Figure 14 illustrates means 44 for receiving the various cuff pulses corresponding to those in Figure 1A from a given individual through a cuff (45) applied to the individuals arm and a transducer forming part of means 44.
- Means 44 then extracts the peak to peak information and upon receiving the patient's diastolic and systolic blood pressures from suitable inputs shown in Figure 14 is able to act on this information so as to generate the transformation P c (ac) vs P w and its derivative ⁇ P c (ac)/ ⁇ P w curves 42 and 43, respectively, which can be permanently recorded or placed on an oscilloscope, as generally indicated at 46.
- the electronics necessary to make means 44 function in this manner can be readily provided in view of the teachings herein.
- the block diagram of Figure 21B serves as an actual working embodiment of this arrangement of Figure 14.
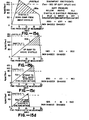
- Figures 15-21 correspond to what may be referred to as a rapid or stat mode for monitoring a patient's systolic, diastolic and mean pressures over an extended period of time by taking successive measurements at closely spaced intervals through out the period. Moreover, while this monitoring technique requires that the patient be subjected to elevated cuff pressures over this period, the present invention minimizes the discomfort resulting from being subjected to these pressures. In order to more fully appreciate this, attention is first directed to Figure 15a which graphically illustrates how a patient is subjected to cuff pressure during one full down-ramp cycle.
- the horizontal axis represents time while the vertical axis represents the cuff pressure to which the patient is subjected during the full cycle (which is shown to be 20 seconds long).
- the curve (or full cycle as it will be called) is indicated at 50a and shows that the patient is subjected to an initial pressure pump up and then to a down-ramping pressure starting with a cuff pressure of 170 Torr and ending at a cuff pressure of zero.
- Figures 15b, c and d illustrate up-ramp cycles to be discussed hereinafter.
- curves 50a, 50b, 50c and 50d are linear and can be made so in accordance with devices such as described in applicant's copending European Patent Application No. 85308945.6 filed 9th December 1985 entitled LINEAR PRESSURIZING AND DEPRESSURIZING DEVICE AND ITS METHOD OF USE (attorney docket number A-41660/SCS).
- the ramps could also be non-linear as is typical in the prior art.
- FIG. 15a not only depicts a typical prior-art full-cycle down-ramp but also can be shown to represent the level of comfort to the patient by taking the areas under the curves.
- a patient's discomfort from taking a blood pressure measurement as the product of the cuff pressure and the time of pressurization.
- the total area under curve 50a is equal to 1960 Torr-seconds. This may be referred to as the patient's "discomfort coefficient". Obviously, the greater this coefficient the less comfortable the patient is. This is especially true if it is necessary to monitor the patient over an extended period of time and thereby subject him to a number of pressure cycles, as illustrated, for example, in Figure 16a. As shown there, the patient's diastolic, systolic and mean pressures (also referred to herein as' critical pressures) are monitored over a period of 100 seconds requiring five full cycles of the type illustrated in Figure 15a. Therefore, over this entire extended period, the patient's total discomfort coefficient is equal to 9800 Torr-seconds (5 cycles at 1960 Torr-seconds/cycle). This is typical for existing "down-ramp" machines.
- the full cycle mode can be initially provided in duplicate as a back to back up-ramp and down-ramp.
- the full cycle or "parameter determining" cycle as it may be referred to can be duplicated in order to obtain two direct measurements for the patient's critical pressures initially.
- the patient's particular transformation curve 54 can be generated during the initial full cycle 50b along with the patient's diastolic, systolic and mean pressures.-In the following stat cycle (and all of the subsequent stat cycles) it is not possible to obtain the patient's systolic pressure in the same manner since he is not subjected to a cuff pressure at least as great as his systolic pressure. Nevertheless, it is possible to obtain the patient's systolic pressure at that time by using the transformation curve generated during the first cycle, as will be seen.
- the diastolic pressure is obtained in the manner described in Link patent 3,903,872 utilizing the curve illustrated in Figure 18.
- this curve corresponds to the curve in Figure 5 of this latter patent for cuff pressures within the stat cycle, that is up to a maximum of 100 Torr.
- the horizontal axis represents applied cuff pressures P c (dc) up to 100 Torr and the vertical axis represents the first derivative (P) of the measured cuff pressure pulses at a specific time in the patient's actual blood pressure pulse or cycle.
- the applied cuff pressure P c (dc) responsible for generating p max on the curve in Figure 18 is equal to the patient's diastolic pressure.
- P c (dc) responsible for generating p max on the curve in Figure 18 (corresponding the maximum change in arterial volume at the diastolic end point) is equal to the patient's diastolic pressure.
- the patient's diastolic pressure is 80 Torr.
- a cuff pulse P c (ac) is generated corresponding to the then applied cuff pressure P c (dc).
- These pulses three of which are illustrated in Figures 19a, 19b and 19c, are used to generate the curve of Figure 18 to determine the patients diastolic pressure.
- At least one of these- cuff pulses is used in conjunction with the patient's transformation curve 54 illustrated in Figure 17 and the patient's diastolic pressure of 80 Torr produced as a result of the curve in Figure 18 to determine the patient's systolic pressure during that cycle.
- the cuff pulse 56a generated at a cuff pressure of 50 Torr is used in conjunction with the transformation curve and the patient's diastolic pressure.
- the base of the cuff pulse 56a (its diastolic level) on the vertical axis of the transformation curve 54.
- the transmural pressure on the horizontal axis (P w) corresponding to the patient's diastolic pressure at a cuff pressure of 50 Torr is located.
- This point is the diastolic blood pressure of the patient minus the cuff pressure or 80 Torr minus 50 Torr which is 30 Torr.
- This 30 Torr point is located as illustrated in Figure 17 and a vertical line 57 (actually a series of arrows) is drawn up to the point at which it intersects the transformation curve.
- the cuff pulse is set on line 58 as shown.
- a horizontal line 60 is generated from the systolic level of the cuff pulse to the transformation curve.
- a further vertical line 62 is drawn downward to its point of intersection with the transmural pressure axis.
- this point of intersection is at 90 Torr.
- This 90 Torr value corresponds to P as described previously at a cuff pressure P c (dc) of 50 Torr.
- the systolic pressure of a patient can be obtained during a stat cycle, that is, without subjecting the patient to pressures as high as his systolic pressure so long as a prior parameter determining full cycle is carried out to determine the patient's systolic pressure directly at least once in order to generate the transformation curve 54.
- a prior parameter determining full cycle is carried out to determine the patient's systolic pressure directly at least once in order to generate the transformation curve 54.
- additional cuff pulses at other pressures for example cuff pulses 56b and 56c in addition to the cuff pulse 56a.
- the systolic pressures obtained from these different measurements are different, they can be averaged to provide an average systolic pressure.
- N r once the patient's diastolic and systolic pressures are determined as a result of the stat cycle, techniques previously described herein can be utilized to obtain the patient's mean pressure during that same stat cycle i.e., the entire cuff pulse curve 56a can be transformed through the transformation curve 54 and the mean blood pressure curve obtained by integration.
- Figure 20 graphically illustrates the results of the monitoring procedure just described.
- the horizontal axis represents time and the vertical axis represents the patient's diastolic, mean and systolic pressures at different times corresponding to the different measurements.
- the first measurement corresponds to a full cycle mode while the subsequent ones may correspond to stat modes or it may be desirable to provide a full cycle mode periodically in order to reconfirm or modify the patient's transformation curve 54. In either case, the patient is subjected to a lower discomfort coeffi - cient then would be the case if each measurement required a full operating cycle.
- FIG. 21A this Figure functionally illustrates an apparatus 64 for carrying out the procedure just described.
- This apparatus includes a suitable blood pressure cuff 66 positioned at the appropriate location adjacent an artery of a patient.
- Means generally indicated at 68 are provided for pressurizing the cuff to different levels sufficient to provide the full cycle 50b and the stat cycle 50d.
- the resultant cuff pulses including those illustrated in Figures 19a, b, and c are produced by suitable circuitry 70 capable of holding the cuff pulses including, for example, those illustrated in Figures 19a, b and c, in memory.
- Circuitry generally indicated at 72 is responsive to the cuff pulses produced during the initial parameter determining cycle for determining the patient's diastolic and systolic pressures during that cycle. These values and the cuff pulses produced by circuitry 70 are input to circuitry 74 for generating the patient's transformation curve which is stored in memory therein. At the same time, circuitry 74 includes suitable means for determining the patient's mean pressure during the parameter determining cycle.
- circuitry 70 pressurizes cuff 66 to provide the stat cycle 50d and circuitry 70 produces the corresponding cuff pulses.
- Circuitry 72 is responsive to these cuff pulses for determining the patient's diastolic pressure only since the cuff 66 is not pressurized to a sufficiently high level to determine the patient's systolic pressure.
- the diastolic pressure determined during this stat cycle is input to circuitry 76 along with the cuff pulses from circuitry 70 for at least one or a group of the cuff pulses such as those illustrated in Figures 19a, b and c and the patient's transformation curve is held in the memory of circuitry 74.
- Circuitry 76 acts on this information to determine the patient's systolic blood pressure by carrying out the procedure described with regard to Figure 17. This pressure value may be fed back into circuitry 74 so that the latter can also provide the patient's mean pressure during this latter cycle.
- Figure 21a is a functional illustration of an apparatus 64 for carrying out the technique associated with Figures 15-20.
- Figure 21b is a block diagram of an actual working embodiment of this apparatus, which in Figure 21b is indicated at 64'.
- the apparatus shown there includes a blood pressure cuff or pressure pad 66' positioned at an appropriate location around (in the case of a cuff) or adjacent (in the case of a pad) a suitable artery of a patient.
- a blood pressure cuff or pressure pad 66' positioned at an appropriate location around (in the case of a cuff) or adjacent (in the case of a pad) a suitable artery of a patient.
- a cuff or a pad may be utilized.
- a pad could be readily substituted therefore, although a different artery may have to be selected.
- a pump and suitable pneumatic controls generally indicated at 68' are provided for pressurizing the cuff (or pad) to different pressure levels sufficient to provide the full up-ramp cycle 50b and the stat cycle 50d illustrated in Figures 15b and d, respectively, or any other type of cycle such as the cycle 50a and 50c illustrated in Figures 15a and c, respectively.
- a pressure transducer illustrated at 69' couples the cuff or pressure pad to a combination of amplifiers and band pass filters generally indicated at 70' for producing cuff pulses such as the ones illustrated in Figures 19a, b, and c.
- the microcomputer or computer generally is controlled by a suitable program stored in ROM 74' in order to carry out the necessary steps of the overall apparatus 64'. This program may vary in length from for example 1k bytes to as much as 32k bytes, depending on accuracy and other factors.
- the digitized value of cuff pressure P c (ac) and P c (dc) and other necessary information, e.g., the transformation curve generated during each initial parameter determining cycle, are stored by the computer 73' in a RAM 75'.
- the computer having calculated the various blood pressures, outputs the results to a monitor 76', printer 77', LED display 78' or perhaps to another computer 79'. It can be seen that the RAM memory 75' must be sufficiently large to store the various cuff pulses as well as the transformation curves described above.
- FIG. 21b The block diagram illustrated in Figure 21b has been described specifically with respect to apparatus 64', that is, as an apparatus for carrying out the technique associated with Figures 15-21a. However, it is to be understood that this same arrangement illustrated in Figure 21b may serve as an actual working embodiment for carrying out the functional steps associated with the arrangements of Figures 10 and 14.
- the ROM 74' would contain a suitable program for operating the microcomputer or computer 73' so as to act on the digitized cuff pressures in a way which produces the necessary information to generate and output the curve of Figure 7.
- a suitable program would be contained in the RAM to operate the microcomputer or computer in order to generate the transformation curve of Figure 12.
- the same components forming arrangement 64' with still another program serves as an actual working embodiment for the technique to be described hereinafter with regard to Figures 22-25.
- the patient is subjected to cuff pressures only somewhat greater than the anticipated diastolic pressure of the patient and, in any event, pressures which are less than the patient's systolic pressure.
- the up-ramp cycle of Figure 15c is illustrative of such pressures. Note that the patient during this cycle is subjected to at most about 120 Torr.
- the patient's blood pressure cuff is varied through a range of pressures below the anticipated systolic pressure of the patient but including levels above and below the anticipated blood pressures of the patient at the selected points in time t 1 and t 2 on his actual waveform, thereby producing cuff pulses at these different pressure levels.
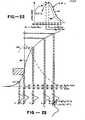
- the two curves 64 and 66 illustrated in Figure 22 can be generated.
- the solid line curve corresponds to ⁇ at the time t 1 and the dotted line curve corresponds to p at t 2 .
- t 1 is the temporal center for the band ⁇ t 1 illustrated in Figure 23
- t 2 is the temporal center for the band ⁇ t 2 in Figure 23.
- the maximum value for each of these curves determines the patient's actual blood pressure at the associated time t 1 or t 2 .
- the patient's blood pressure at the time t 1 in his waveform is 80 Torr (indicated at D 1 ) and the pressure at time t 2 is 100 Torr (D 2 ).
- Figure 23 diagrammatically illustrates the patient's transformation curve in association with his actual blood pressure pulses in order to illustrate the relationship between time t l and its associated band ⁇ t 1 .
- the band is located within the diastolic decline of the actual blood pressure pulse.
- the resultant time derivative of the measured cuff pulse ( ⁇ ) first increases and then decreases, thereby resulting in the curve 64 of Figure 22. This would also be true for t 2 and ⁇ t 2 resulting in curve 66 of Figure 22, where ⁇ t 2 is shown up from ⁇ t 1 on the diastolic decline.
- curve 64 it can be integrated to provide the patient's transformation curve which is generally indicated by the reference numeral 80 in Figures 23 and 24.
- This curve is placed in the coordinate system shown such that the vertical axis at zero transmural pressure extends through the center of its maximum slope for the reasons to be discussed below and such that the horizontal axis is located near the bottom of the curve, although this is not critical.
- the horizontal or transmural pressure axis corresponds to P which is equal to the actual blood pressure P h minus the applied cuff pressure P c (dc).
- the transformation curve 80 is obtained by integrating over curve 64 according to the procedures described above.
- the vertical axis at 80 Torr for curve 64 becomes the zero axis for curve 80.
- the corresponding values are shown in Figure 23.
- This cuff pulse including the pressure points D 1 and D 2 is illustrated in Figure 24 at 81.
- the D 1 and D 2 points are located on the horizontal P axis of the transformation w curve for a cuff pressure of 60 Torr. Since D 1 equals 80 Torr, the point on the horizontal P w axis corresponding to this point is 20 Torr (80 Torr minus 60 Torr). Since D 2 equals 100 Torr, the D 2 point on the horizontal P w axis is 40 Torr (100 Torr minus 60 Torr).
- each section of the reproduced cuff pulse 81' in Figure 24 is proportionate to the corresponding section of the original cuff pulse 81 but scaled to match the points D 1 ' and D 2 '.
- a horizontal line 104 is drawn from the top of the scaled pulse to an intersecting point of the transformation curve, at which point the vertically downward line 106 is drawn until it intersects the horizontal axis of the transformation curve. It does so at 60 Torr. Therefore, the systolic pressure is equal to 120 Torr (60 Torr plus 60 Torr).
- D 1 could be selected at a time tl sufficiently close to the patient's diastolic pressure so that D 1 automatically provides the patient's diastolic pressure and it is mainly necessary to carry out the foregoing procedure to provide the systolic pressure.
- this procedure can be repeated successively over a period of time in order to monitor the patient's diastolic and systolic blood pressures over a period of time without ever subjecting the patient to cuff pressures much greater than midway between the patient's systolic and diastolic pressures.
- the entire pulse 81' can now be transformed through the transformation curve 80 to obtain the transformed blood pressure pulse 81" shown in dot-dash fashion in Figure 24. Every pressure on the transformed blood pressure pulse 81'' is now known and the mean blood pressure can now be calculated by integration and the entire waveform 81" can be presented on a suitable monitor. For added accuracy additional points D 3 , D 4 ---Dn can be included on curve 81 by an analysis identical to the above.
- This apparatus includes a blood pressure cuff or pad 112 positioned adjacent a suitable artery of the patient.
- Means generally indicated at 114 are provided for placing the cuff at different pressure levels below the anticipated systolic pressure of the patient but including levels above and below the anticipated pressures of the patient at the selected points in time t 1 and t 2 on his actual waveform.
- Circuitry generally indicated at 116 is provided for producing cuff pulses at these different pressure levels. These cuff pulses are input to circuitry 118 which responds thereto for producing the pressure values at D 1 and D 2 and at the same time this circuitry generates the curves of Figure 22.
- circuitry 120 which integrates the curve and provides the transformation curve 80 as a result thereof.
- circuitry 122 utilizes this transformation curve, the pressures D 1 and D 2 and at least one of the cuff pulses (for example cuff pulse 81) to (1) establish the positional relationship between the transformation curve and selected cuff pulse and (2) the correct scaling of the latter relative to the transformation curve (thereby producing reproduction pulse 81').
- circuitry 122 uses the correctly scaled reproduced cuff pulse 81' and its positional relationship with regard to the transformation curve to determine the systolic pressure of the patient and his diastolic pressure, if the latter is not the blood pressures D 1 or D 2 .
- a suitable program in ROM 74' operates the microcomputer or computer so as to produce the curves 64 and 66 of Figure 22, it determines the pressures at D 1 and D 2 and it generates the transformation curve 80, then carries out the steps associated with Figure 24 in order to obtain the patient's diastolic and systolic pressure and also the patient's full blood pressure waveform (the waveform 81" in Figure 24).
- points D 1 and D 2 were selected to lie on the diastolic decline of the blood pressure waveform.
- points D 1 and D 2 can be located at any two points on the blood pressure waveform provided that the blood pressure difference between the two points is reasonably large.
- the two points can be chosen on the systolic rise part of the waveform between the diastolic end point of the previous pulse and the systolic peak of the current pulse. All the descriptions of this last mentioned technique hold true for these two points except that the polarity of the differential quantities AV and ⁇ P c (ac) reverses.
- the frequency response of an open artery is certainly higher than a collapsed artery.
- a further advantage resides in the reduction in consumption of energy by the air pump used to pressurize the pressure cuff or pad.-Thus, the present technique combines improved patient comfort, improved accuracy and the need for less power.
Landscapes
- Health & Medical Sciences (AREA)
- Life Sciences & Earth Sciences (AREA)
- Cardiology (AREA)
- Vascular Medicine (AREA)
- Biomedical Technology (AREA)
- Heart & Thoracic Surgery (AREA)
- Physiology (AREA)
- Biophysics (AREA)
- Pathology (AREA)
- Engineering & Computer Science (AREA)
- Veterinary Medicine (AREA)
- Physics & Mathematics (AREA)
- Medical Informatics (AREA)
- Molecular Biology (AREA)
- Surgery (AREA)
- Animal Behavior & Ethology (AREA)
- General Health & Medical Sciences (AREA)
- Public Health (AREA)
- Ophthalmology & Optometry (AREA)
- Measuring Pulse, Heart Rate, Blood Pressure Or Blood Flow (AREA)
Applications Claiming Priority (2)
| Application Number | Priority Date | Filing Date | Title |
|---|---|---|---|
| US68459284A | 1984-12-21 | 1984-12-21 | |
| US684592 | 1984-12-21 |
Publications (2)
| Publication Number | Publication Date |
|---|---|
| EP0188894A1 true EP0188894A1 (fr) | 1986-07-30 |
| EP0188894B1 EP0188894B1 (fr) | 1989-11-23 |
Family
ID=24748695
Family Applications (1)
| Application Number | Title | Priority Date | Filing Date |
|---|---|---|---|
| EP19850309205 Expired EP0188894B1 (fr) | 1984-12-21 | 1985-12-17 | Technique utilisant une méthode statistique spécifique pour obtenir des informations associées à la pression sanguine d'un patient |
Country Status (4)
| Country | Link |
|---|---|
| EP (1) | EP0188894B1 (fr) |
| JP (1) | JPH0624523B2 (fr) |
| CA (1) | CA1255118A (fr) |
| DE (1) | DE3574338D1 (fr) |
Cited By (7)
| Publication number | Priority date | Publication date | Assignee | Title |
|---|---|---|---|---|
| WO1988001773A1 (fr) * | 1986-09-03 | 1988-03-10 | Tom Mostert | Moyen permettant de determiner l'amplitude des parametres circulatoires et respiratoires et les proprietes de la valvule aortique d'un patient |
| EP0297146A4 (fr) * | 1986-12-25 | 1989-03-22 | Nippon Colin Co Ltd | Systeme de controle de la tension sanguine. |
| EP0365614A4 (en) * | 1988-03-24 | 1990-12-05 | Shiu-Shin Chio | Cardiovascular pressure and condition method and apparatus |
| WO1992022871A1 (fr) * | 1991-06-10 | 1992-12-23 | Akinyemi Samuel Nathaniel Olal | Mesure non sanglante des parametres du debit sanguin |
| EP0627191A1 (fr) * | 1993-05-03 | 1994-12-07 | Critikon, Inc. | Instrument de surveillance des artéries périphériques |
| EP0721764A3 (fr) * | 1995-01-04 | 1998-05-20 | JOHNSON & JOHNSON MEDICAL, INC. | Appareil de surveillance oscillométrique de la pression sanguine pour mesurer automatiquement la pression sanguine |
| CN109414199A (zh) * | 2016-06-14 | 2019-03-01 | 皇家飞利浦有限公司 | 用于最大动脉顺应性的无创评估的设备和方法 |
Citations (1)
| Publication number | Priority date | Publication date | Assignee | Title |
|---|---|---|---|---|
| US4074711A (en) * | 1975-05-15 | 1978-02-21 | American Optical Corporation | Apparatus and process for determining systolic pressure |
-
1985
- 1985-12-17 DE DE8585309205T patent/DE3574338D1/de not_active Expired
- 1985-12-17 EP EP19850309205 patent/EP0188894B1/fr not_active Expired
- 1985-12-20 JP JP60287581A patent/JPH0624523B2/ja not_active Expired - Lifetime
- 1985-12-20 CA CA000498224A patent/CA1255118A/fr not_active Expired
Patent Citations (1)
| Publication number | Priority date | Publication date | Assignee | Title |
|---|---|---|---|---|
| US4074711A (en) * | 1975-05-15 | 1978-02-21 | American Optical Corporation | Apparatus and process for determining systolic pressure |
Cited By (9)
| Publication number | Priority date | Publication date | Assignee | Title |
|---|---|---|---|---|
| WO1988001773A1 (fr) * | 1986-09-03 | 1988-03-10 | Tom Mostert | Moyen permettant de determiner l'amplitude des parametres circulatoires et respiratoires et les proprietes de la valvule aortique d'un patient |
| EP0297146A4 (fr) * | 1986-12-25 | 1989-03-22 | Nippon Colin Co Ltd | Systeme de controle de la tension sanguine. |
| US5099853A (en) * | 1986-12-25 | 1992-03-31 | Colin Electronics Co., Ltd. | Blood pressure monitoring system |
| EP0365614A4 (en) * | 1988-03-24 | 1990-12-05 | Shiu-Shin Chio | Cardiovascular pressure and condition method and apparatus |
| WO1992022871A1 (fr) * | 1991-06-10 | 1992-12-23 | Akinyemi Samuel Nathaniel Olal | Mesure non sanglante des parametres du debit sanguin |
| EP0627191A1 (fr) * | 1993-05-03 | 1994-12-07 | Critikon, Inc. | Instrument de surveillance des artéries périphériques |
| EP0721764A3 (fr) * | 1995-01-04 | 1998-05-20 | JOHNSON & JOHNSON MEDICAL, INC. | Appareil de surveillance oscillométrique de la pression sanguine pour mesurer automatiquement la pression sanguine |
| CN109414199A (zh) * | 2016-06-14 | 2019-03-01 | 皇家飞利浦有限公司 | 用于最大动脉顺应性的无创评估的设备和方法 |
| US11813044B2 (en) | 2016-06-14 | 2023-11-14 | Koninklijke Philips N.V. | Device and method for non-invasive assessment of maximum arterial compliance |
Also Published As
| Publication number | Publication date |
|---|---|
| DE3574338D1 (en) | 1989-12-28 |
| CA1255118A (fr) | 1989-06-06 |
| JPS61181439A (ja) | 1986-08-14 |
| EP0188894B1 (fr) | 1989-11-23 |
| JPH0624523B2 (ja) | 1994-04-06 |
Similar Documents
| Publication | Publication Date | Title |
|---|---|---|
| US4664126A (en) | Techniques for obtaining information associated with an individual's blood pressure including specifically a stat mode technique | |
| US4699152A (en) | Techniques for obtaining information associated with an individual's blood pressure including specifically a stat mode technique | |
| US4651747A (en) | Waveform information obtaining techniques associated with an individual's blood pressure | |
| US6719704B2 (en) | Vascular endothelial cell function evaluating apparatus | |
| US6659958B2 (en) | Augmentation-index measuring apparatus | |
| EP0389579B1 (fr) | Controle continu non invasif des formes d'onde de la tension arterielle | |
| US6120456A (en) | Apparatus for measuring pulse-wave propagation velocity | |
| US6626840B2 (en) | Method and system for detecting vascular conditions using an occlusive arm cuff plethysmograph | |
| US6733461B2 (en) | Methods and apparatus for measuring arterial compliance, improving pressure calibration, and computing flow from pressure data | |
| US20040158162A1 (en) | Cuff volumetric pulse wave obtaining apparatus, cuff volumetric pulse wave analyzing apparatus, pressure pulse wave obtaining apparatus, and pressure pulse wave analyzing apparatus | |
| JPH084576B2 (ja) | 血圧決定装置、平均動脈圧決定装置、心臓血管状態決定装置、および心臓ペースメーカの調整援助装置 | |
| US4699151A (en) | Techniques for obtaining information associated with an individual's blood pressure including specifically a stat mode technique | |
| CA2187638A1 (fr) | Appareil et procede permettant de mesurer une perturbation induite pour determiner les parametres physiologiques | |
| US6793628B2 (en) | Blood-pressure measuring apparatus having augmentation-index determining function | |
| US20090012411A1 (en) | Method and apparatus for obtaining electronic oscillotory pressure signals from an inflatable blood pressure cuff | |
| US4564020A (en) | Method and apparatus for obtaining an individual's systolic blood pressure | |
| GB2381076A (en) | Non-invasive method for determining diastolic blood pressure | |
| US6786872B2 (en) | Augmentation-index measuring apparatus | |
| EP0188894B1 (fr) | Technique utilisant une méthode statistique spécifique pour obtenir des informations associées à la pression sanguine d'un patient | |
| US4697596A (en) | Techniques for obtaining information associated with an individual's blood pressure including specifically a stat mode technique | |
| DE69618457T2 (de) | Gerät zur Auswertung der Herzfunktion eines Lebewesens | |
| WO1986000209A1 (fr) | Techniques permettant d'obtenir des informations a partir de formes d'ondes relatives a la tension arterielle d'un individu | |
| WO1986000210A1 (fr) | Techniques d'obtention d'informations de formes d'onde associees a la pression sanguine d'une personne | |
| EP0185084A4 (en) | A technique for generating an arterial curve associated with an individual's blood pressure |
Legal Events
| Date | Code | Title | Description |
|---|---|---|---|
| PUAI | Public reference made under article 153(3) epc to a published international application that has entered the european phase |
Free format text: ORIGINAL CODE: 0009012 |
|
| AK | Designated contracting states |
Kind code of ref document: A1 Designated state(s): DE FR GB IT SE |
|
| 17P | Request for examination filed |
Effective date: 19860703 |
|
| 17Q | First examination report despatched |
Effective date: 19880226 |
|
| RAP1 | Party data changed (applicant data changed or rights of an application transferred) |
Owner name: BAXTER INTERNATIONAL INC. (A DELAWARE CORPORATION) |
|
| GRAA | (expected) grant |
Free format text: ORIGINAL CODE: 0009210 |
|
| AK | Designated contracting states |
Kind code of ref document: B1 Designated state(s): DE FR GB IT SE |
|
| PG25 | Lapsed in a contracting state [announced via postgrant information from national office to epo] |
Ref country code: SE Effective date: 19891123 Ref country code: IT Free format text: LAPSE BECAUSE OF FAILURE TO SUBMIT A TRANSLATION OF THE DESCRIPTION OR TO PAY THE FEE WITHIN THE PRESCRIBED TIME-LIMIT;WARNING: LAPSES OF ITALIAN PATENTS WITH EFFECTIVE DATE BEFORE 2007 MAY HAVE OCCURRED AT ANY TIME BEFORE 2007. THE CORRECT EFFECTIVE DATE MAY BE DIFFERENT FROM THE ONE RECORDED. Effective date: 19891123 |
|
| ET | Fr: translation filed | ||
| REF | Corresponds to: |
Ref document number: 3574338 Country of ref document: DE Date of ref document: 19891228 |
|
| PLBE | No opposition filed within time limit |
Free format text: ORIGINAL CODE: 0009261 |
|
| STAA | Information on the status of an ep patent application or granted ep patent |
Free format text: STATUS: NO OPPOSITION FILED WITHIN TIME LIMIT |
|
| PGFP | Annual fee paid to national office [announced via postgrant information from national office to epo] |
Ref country code: SE Payment date: 19900926 Year of fee payment: 6 |
|
| 26N | No opposition filed | ||
| ITTA | It: last paid annual fee | ||
| PGFP | Annual fee paid to national office [announced via postgrant information from national office to epo] |
Ref country code: FR Payment date: 19981202 Year of fee payment: 14 |
|
| PGFP | Annual fee paid to national office [announced via postgrant information from national office to epo] |
Ref country code: GB Payment date: 19981203 Year of fee payment: 14 |
|
| PGFP | Annual fee paid to national office [announced via postgrant information from national office to epo] |
Ref country code: DE Payment date: 19981204 Year of fee payment: 14 |
|
| PG25 | Lapsed in a contracting state [announced via postgrant information from national office to epo] |
Ref country code: GB Free format text: LAPSE BECAUSE OF NON-PAYMENT OF DUE FEES Effective date: 19991217 |
|
| GBPC | Gb: european patent ceased through non-payment of renewal fee |
Effective date: 19991217 |
|
| PG25 | Lapsed in a contracting state [announced via postgrant information from national office to epo] |
Ref country code: FR Free format text: LAPSE BECAUSE OF NON-PAYMENT OF DUE FEES Effective date: 20000831 |
|
| PG25 | Lapsed in a contracting state [announced via postgrant information from national office to epo] |
Ref country code: DE Free format text: LAPSE BECAUSE OF NON-PAYMENT OF DUE FEES Effective date: 20001003 |
|
| REG | Reference to a national code |
Ref country code: FR Ref legal event code: ST |