EP0335419A2 - Verfahren und Vorrichtung zum Einsetzen von Licht- und Schattendichten - Google Patents
Verfahren und Vorrichtung zum Einsetzen von Licht- und Schattendichten Download PDFInfo
- Publication number
- EP0335419A2 EP0335419A2 EP89105719A EP89105719A EP0335419A2 EP 0335419 A2 EP0335419 A2 EP 0335419A2 EP 89105719 A EP89105719 A EP 89105719A EP 89105719 A EP89105719 A EP 89105719A EP 0335419 A2 EP0335419 A2 EP 0335419A2
- Authority
- EP
- European Patent Office
- Prior art keywords
- density
- terminal
- value
- curve
- image
- Prior art date
- Legal status (The legal status is an assumption and is not a legal conclusion. Google has not performed a legal analysis and makes no representation as to the accuracy of the status listed.)
- Granted
Links
Images






Classifications
-
- H—ELECTRICITY
- H04—ELECTRIC COMMUNICATION TECHNIQUE
- H04N—PICTORIAL COMMUNICATION, e.g. TELEVISION
- H04N1/00—Scanning, transmission or reproduction of documents or the like, e.g. facsimile transmission; Details thereof
- H04N1/40—Picture signal circuits
- H04N1/407—Control or modification of tonal gradation or of extreme levels, e.g. background level
- H04N1/4072—Control or modification of tonal gradation or of extreme levels, e.g. background level dependent on the contents of the original
- H04N1/4074—Control or modification of tonal gradation or of extreme levels, e.g. background level dependent on the contents of the original using histograms
Definitions
- the present invention relates to a method of and an apparatus for establishing highlight and shadow densities used for gradation control of image data obtained through reading an original.
- an image data obtained through reading an original is subjected to gradation control, whereby a recorded image having a desired gradation expression is obtained.
- gradation control a highlight density and a shadow density are needed to be previously set in the image processing apparatus in order to define both ends of that density range of the original which is faithfully reproduced with the recorded image.
- the highlight and shadow densities are respectively measured with a densitometer at a highlight area and a shadow area which are selected by an operator as the brightest area and the darkest area in the original.
- the measured highlight and shadow densities are set in the image processing apparatus to be used for the gradation control.
- the highlight and shadow densities are manually measured and set in the image processing apparatus by an operator so far, its operation takes much time and skill. Furthermore, a densitometer is necessary for the measurement besides the image processing apparatus. If the highlight area and the shadow area are not large enough for an aperture of the densitometer to be set in those areas, which aperture is usually a circle of a few millimeters in diameter, the highlight and shadow densities cannot be set at appropriate values.
- a highlight point and a shadow point where the highlight and shadow densities are to be measured are first specified in an original by an operator, respectively. Then, brightnesses of the respective highlight and shadow points are automatically read with a photoelectric converter device in a graphic arts scanner, to thereby be converted to the highlight and shadow densities in the process scanner.
- the brightnesses of the highlight and shadow points are determined as average values of brightnesses in the vicinity of the highlight and shadow points, respectively.
- the highlight and shadow densities are automatically determined on the basis of the average values. As a result, measurement error due to dust or the like is reduced and the highlight and shadow densities are obtained with considerable accuracy.
- the applicant of the present invention is also the applicant of these gazettes. According to the technique disclosed in these gazettes, sizes of candidate areas for the highlight and shadow points are measured first. If the candidate areas have enough size for measuring accurate densities, they are selected as the highlight and shadow points, respectively. Then, densities of the candidate areas are determined to be highlight and shadow densities, respectively.
- Highlight and shadow densities for an original where average density is shifted from a normal value need to be set shifted from a normal value according to magnitude of the shift of the average density in order to reproduce a relatively normal image. If an area of low density does not exist in an original or if the area has only an extremely small size, highlight density should be set at a lower value than usual in order for a recorded image to be reproduced normally. On the other hand, if an area of high density does not exist or if the area has only an extremely small size, shadow density should be set at a higher value than usual in order for a recorded image to be reproduced normally.
- an object of the present invention is to provide a method of and an apparatus for easily establishing proper highlight and shadow densities according to density characteristics of an original.
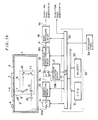
- Figs. 1A and 1B are schematic block diagrams showing a graphic arts scanner in which an apparatus according to a preferred embodiment of the present invention is assembled.
- the graphic arts scanner shown in Fig. 1 comprises a transparent original-receiving glass plate 2 provided in an upper opening of a frame box 1, so that an original 3 is placed on the glass plate 2, being downwardly directed.
- the original-receiving glass plate 2 is provided in its upper end surface with a white reference plate 4 having reference optical density.
- the white reference plate 4 is employed for shading correction.
- the reflected light 7 enters a first mirror 9 included in an optical system 8 to be reflected.
- the light 7 reflected by the first mirror 9 is successively reflected by second and third mirrors 10 and 11, to form an image on a light receiving surface of a charge-coupled device (CCD) line image sensor 13 serving as a photoelectric converter through an image forming lens 12.
- the CCD line image sensor 13 comprises a plurality of CCD elements one-dimensionally arrayed in a direction perpendicular to the plane of the drawing.
- the direction perpendicular to the plane of the drawing corresponds to a main scanning direction.
- the incident light focused on the light receiving surface of the CCD line image sensor 13 is photoelectrically converted into an image signal V CCD for each pixel by the CCD line image sensor 13.
- the image signal V CCD is digitized by an A-D converter 14, to be supplied to a shading correction circuit 15 for each pixel.
- the shading correction circuit 15 is adapted to correct nonuniformity in illuminaiton on the surface of the original 3, nonuniformity in image-forming function of the image-forming optical system 8 and nonuniformity in sensitivity of the respective CCD elements forming the CCD line sensor 13.
- the shading correction circuit 15 generates an image signal V N after the shading correction.
- the image signal V N is selectively supplied to a histogram counter circuit 17 or a gradation correction circuit 18 having a look-up table RAM 18a through a switching circuit 16.
- the histogram counter circuit 17 is employed to obtain a cumulative histogram as statistics expressing density characteristics of the original 3. As is described later in detail, highlight and shadow densities are determined on the basis of the result obtained in the histogram counter circuit 17, and a gradation correction table is generated using the highlight and shadow densities.
- the gradation correction table is stored in the RAM 18a.
- An image signal V1 generated in the gradation correction circuit 18 is supplied to an image processing circuit 19, to be subjected to processing such as contour enhancement, that is, sharpness enhancement and magnification change in the image processing circuit 19.
- An image signal V2 outputted from the image processing circuit 19 is supplied to a halftone signal generator 20.
- a halftone dot signal V dot generated in the halftone signal generator 20 serves as a modulation control signal for an acoustic optical modulator 24.
- the acoustic optical modulator 24 receives laser beam 22 from a laser source 21 through a mirror 23.
- the acoustic optical modulator 24 modulated the laser beam 22 on the basis of the halftone dot signal V dot , to provide an exposure beam 25.
- the exposure beam 25 is horizontally oscillated by vibration of a galvano mirror 26, to be emitted on a recording photosensitive material 28 through an image forming optical system 27 formed by an f ⁇ lens and the like.
- the vibration of the galvano mirror 26 is synchronous with output timing of the CCD elements in the CCD line sensor 13, whereby optical scanning in the main scanning direction ⁇ is achieved.
- the light source 5 and the first mirror 9 are fixed to a mechanism (not shown) transferring relatively to the original 3 in a direction A, whereby the original 3 is scanned in the direction A.
- the photosensitive material 28 is moved in the downward direction (- ⁇ ), to thereby achieve reading subscanning in the direction A and recording subscanning in a direction ⁇ synchronously.
- This apparatus is also provided with a microcomputer 30 for controlling the respective circuits and processing the respective data, especially processing for establishing highlight and shadow densities, and processing for generating the gradation correction table as described later.
- the microcomputer 30 has a CPU 31 and a memory 32, and is connected to the A-D converter 14, the shading correction circuit 15, the switching circuit 16, the histogram counter circuit 17, the gradation correction circuit 18, the image processing circuit 19 and the halftone signal generator 20 through an I/O port 33.
- a keyboard panel 34 for inputting various data as hereinafter described is also connected to the I/O port 33.
- a cumulative histogram about an object area in the original 3 is obtained through prescanning the original 3 as described below.
- the object area is a part of the original 3 as an object in reading and reproducing.
- the switching circuit 16 is switched to the histogram counter circuit 17 according to a switching signal SW1 supplied from the microcomputer 30. Then, the object area in the original 3 is scanned and image signal V CCD is sequentially generated in the CCD line sensor 13 accordingly.
- the image data V CCD is A-D converted in the A-D converter 14 and then supplied to the shading correction circuit 15 to be subjected to shading correction.
- the shading correction is performed on the basis of reference data obtained by reading the white reference plate 4.
- the image signal V N which is obtained as a result of the shading correction, is supplied to the histogram counter circuit 17 through the switching circuit 16.
- the histogram counter circuit 17 holds a density histogram shown in Fig. 2A for example.
- the abscissa axis of the graph is density X.
- the ordinate axis of the graph is frequency of occurence y of pixels having the density X.
- the frequency of occurence y is obtained by dividing sum of pixels having the density X by the total number of pixels.
- a density interval ⁇ X of the graph is a unit of density width used for constructing the density histogram.
- the histogram counter circuit 17 further generates a cumulative histogram h(X) shown in Fig. 2B.
- the ordinate axis of the graph is cumulative frequency of occurence Y concerning the density X. In the Figs.
- X min and X max are defined as follows: X min : Density at which the cumulative density histogram h(X) steps up from zero percent. X min is hereinafter referred to as "minimum density”. X max : Density at which the cumulative density histogram h(X) reaches a hundred percent. X max is hereinafter referred to as "maximum density”.
- Fig. 3A is a graph showing an example of the cumulative histogram to be processed in a first embodiment of the present invention.
- Fig. 3B is an enlarged view showing a part of Fig. 3A near the origin.
- a cumulative histogram h0(X) is associated with an ordinary original which is appropriately exposed.
- a cumulative histogram h1(X) is associated with an extraordinarily-dark (or "low-key") original such as a discolored original and an original underexposed in taking picture of a subject.
- the cumulative histograms h0(X) and h1(X) are simplified graphs showing examples of the histogram h(X) of Fig. 2B.
- a minimum value Y min and a maximum value Y max of cumulative frequency of occurence is zero and a hundred percent, respectively, for example.
- the minimum density X min is generally easy to fluctuate according to dust, defects or the like on an original, it is not good to adapt the minimum density X min for the highlight density in consideration of reproducibility of the gradation correction processing. Accordingly, the highlight density is usually set at a value a little higher than the minimum density X min .
- value of the highlight density is determined as follows: The cumulative histogram h1(X) of an extraordinarily-dark original is shifted to the right, that is, higher density side from the histogram h0(X) of a normal original, and its minimum density X 1min is much larger than a minimum density X 0min of the normal original.
- the highlight density is set at as small value as the minimum density X 1min in order for a brighter part to be emphasized in a reproduced image, whereby the reproduced image can be produced comparatively beautiful.
- the treatment described above is achievable only when it is recognizable whether an original to be treated is normal or not. However, it can be judged whether density character of the original is normal or not on the basis of a density value associated with a prescribed cumulative frequency in its histogram.
- a reference density (RD) associated with a prescribed value of reference cumulative frequency (RCF) of occurrence is first obtained in a procedure of the first embodiment, and then the density character of the original is recognized through comparing the reference density with a prescribed threshold value.
- RCF reference cumulative frequency
- Fig. 4 is a flow chart showing the procedure according to a method of the first embodiment.
- a reference density X HR for highlight density (“highlight RD”) and a minimum RD X HL associated with prescribed values of a reference cumulative frequency Y HR for highlight density (“highlight RCF”) and a minimum RCF Y HL , respectively, are obtained on a cumulative histogram h(X).
- the highlight RD X HR is used as an index showing how many pixels of comparatively low densities exist in the original.
- the minimum RD X HL is used as an index showing a density where the cumulative histogram h(X) substantially steps up. Accordingly, the minimum RCF Y HL is set as low as practicable and the highlight RCF Y HR is set higher than that. Detailed procedure for obtaining the highlight RD X HR and the minimum RD X HL is described later.
- the highlight RD X HR is compared with a prescribed threshold density X HS for highlight density, whereby it is judged whether the original is normal one or abnormal one to be subjected to exceptional processing. If the highlight RD X HR is lower than the threshold density X HS , the original is processed as a normal one at a step S3.
- the cumulative histogram h0(X) X 0HR ⁇ X HS In this case, the original is processed as a normal one at the step S3.
- the processing for a normal original may be performed according to a second embodiment of the present invention described later or some other method.
- a step S4 is executed as exceptional processing for an abnormal original.
- a highlight density X 1H (X H ) is set at the minimum RD X 1HL obtained at the step S1. Because the highlight density X 1H is set close to the minimum density X 1min , pixels in a density range down to the highlight density X 1H is faithfully reproduced, that is, comparatively bright part of the original can be faithfully reproduced to have given gradation with halftone dots. Accordingly, a reproduced image can be produced beautifully.
- the highlight RCF Y HR may be preferably set at 0.1 % - 2.0 %, especially 0.2 % - 0.8 %.
- the threshold density X HS may be preferably set at about 0.35.
- the minimum RCF Y HL may be preferably set at 0.01 % - 0.5 %, especially 0.02 % - 0.1 %.
- the values of Y HR and Y HL are empirically determined as cumulative frequencies close to a minimum value which can invariably specify one typical density of an original according to density character of the original without influence of dust, defects and the like on the original. Consequently, the values of Y HR and Y HL are not limited in the above stated ranges. Further, the values of Y HR and Y HL can be equal to each other.
- the value of X HS is also determined empirically and not limited in the above stated range.
- a shadow density for an extraordinarily-dark original such as an underexposed original, which has a histogram like h1(X) shown in Fig. 3A, can be set according to a second embodiment or some other method for a normal original. It is because, as shown in Fig. 3A, a maximum density X 1max of the extraordinarily-dark original is not so much different from a maximum density X 0max of the normal original.
- the highlight density X H may be computed by the following linear equation with a weighting coefficient k :
- X H kX HR + (1-k) X HL (2) where 0 ⁇ k ⁇ 1
- the highlight density X H is determined at a value betwen the minimum RDX HL and the highlight RD X HR .
- a shadow density can be appropriately determined through similar processing to the above processing at higher density range of its cumulative histogram.
- Fig. 5 is a graph showing a gradation correction curve F(X) employed for gradation control.
- the abscissa axis of the graph is density X
- the ordinate axis is halftone area rate Q in a recorded image.
- the gradation correction curve F(X) is determined as a curve drawn through coordinate points P H and P S which are specified by the values of the highlight density X H , the shadow density X S , a halftone area rate Q H for the highlight density and a halftone area rate Q S for the shadow density.
- the halftone area rates Q H and Q L are specified so that halftone dots having area rates between those values Q H and Q L can be invariably reproducible.
- the values of Q H and Q L are set at 5% and 95%, respectively, for example. Accordingly, by using the gradation correction curve F(X), image areas of an original having densities between the highlight density X H and the shadow density X S are invariably reproduced with halftone dots having area rates between Q H and Q S .
- image areas in a density range between the highlight density X H and a density X a associated with a minimum halftone area rate Q min can be reproduced with halftone dots expressing some gradation, although reliability and reproducibility of the halftone dots may be worse.
- Those density ranges have the width D H and D S as shown in Fig. 5, respectively.
- the main purpose of the second embodement is to equalize the minimum density X min and the density X a , and the maximum density X max and the density X b .
- the densities X a and X b are not directly set for the gradation correction curve F(X), but the highlight density X H and the shadow density X S are set for it.
- the highlight and shadow densities X H and X S need to be set appropriately according to shapes of both ends of the cumulative histogram h(X) so that the densities X a and X b of the gradation correction curve F(X) becomes equal to the minimum density X min and the maxmum density X max of the cumulative histogram h(X), respectively.
- one of processing procedures prepared in advance is selected according to shape of end portion of the cumulative histogram h(X).
- the the cumulative histogram h(X) is processed by the selected procedure so that appropriate highlight and shadow densities are determined.
- Fig. 6A is an enlarged view showing a highlight part of the cumulative histogram h(X), where the histogram h(X) is approximated as a straight line.
- two reference points P0 (X H0 , Y H0 ) and P i (X Hi , Y Hi ) are selected on the histogram h(X), where the density X Hi is higher than the density X H0 .
- a density X im is defined as a density at which a straight line through the reference points P0 and P i meets with the X axis.
- the density X im is equal to the munimum density X min because the histogram h(X) is also a straight line in the graph.
- D i X Hi - X im (3)
- Equation (7) or (8) does not necessarily hold strictly.
- the righthand side of the equation (7) may be defined as W Hi : If the value ⁇ X Hi obtained by the equation (4) agrees with the value W Hi obtained by the equation (9) within a prescribed error, the above purpose can be well achieved.
- Fig. 7 is a flow chart showing the procedure according to the second embodiment.
- Fig. 6B is an enlarged view showing a highlight part (low density part) of the cumulative histogram h(X).
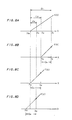
- the point of the processing described below is that, as shown in Figs. 8A through 8D, a temporary value X1, X2 or X3 of the highlight density X H is successively shifted to the lower density side of the cumulative histogram h(X) so that the highlight density X H is determined in order for the left side range having the width D H of the gradation correction curve F(X) to include the highlitht part of the cumulative histogram h(X) at which the histogram h(X) starts to increase.
- a minimum density X 1m of the histogram h(X) corresponds to the density X a of the gradation correction curve F(X) so that the gradation corrective curve F(X) does not include useless part at its highlight end.
- the density X2 does not satisfy the above point as shown in Fig. 8B and the density X3 includes useless part between the densities X a and X 1m as shown in Fig. 8C.
- Detailed procedure of the processing for establishing the highlight density X H is shown in Fig. 7.
- reference densities (RD) X H0 - X Hn corresponding to reference cumulative frequencies (RCF) Y H0 - Y Hn , respectively, are computed on the cumulative histogram h(X), where the RCF Y H0 - Y Hn have respective predetermined values at the lower density range and the subscript n is an integer.
- threshold values W H1 - W Hn are computed for respective RD's X H1 - X Hn by the equation (9).
- Reference points P0 - P4 on the histogram h(X) have respective coordinate values of (X H0 , Y H0 ) - (X H4 , Y H4 ).
- the values X H0 and Y H0 which are the smallest of all, work as basic values in the procedure shown in Fig. 7. Therefore, the values X H0 and Y H0 are referred to as "basic reference density (basic RD)" and “basic reference cumulative frequency (basic RCF)", respectively.
- the following relation among the RCF's Y H1 - Y H4 is determined for convenience with respect to the processing procedure described below: Y H4 ⁇ Y H3 ⁇ Y H2 ⁇ Y H1 (10)
- a density X im is defined as a density at which a straight line through points P i and P0 intersects the X axis. If the end portion of the histogram h(x) is nearly a straight line, a difference between the density X im and the minimum density X min is small.
- the value of the subscript i is set at "1". Then a judgement whether the highlight density X H can be set at the value of the RD X H1 or not is substantially performed at a step S14.
- a difference ⁇ X H1 between the densities X H1 and X H0 is compared with the threshold value W H1 which is determined in advance in the step S11. If the difference ⁇ X H1 is smaller than or equal to the threshold value W H1 , the highlight density X H is set at the value of the density X H1 at a step S15, and the processing is ended.
- the hilight X H is not set at the density X H1 and the processing returns from the step S16 to the step S13 where similar judgement on the next RD X H2 is performed. Because the difference ⁇ X H1 is larger than the threshold value W H1 , the next RD X H2 has to be smaller than the first RD X H1 . Consequently, the RCF Y H1 - Y H4 are predetermined according to the equation (10). In other words, the highlight density X H needs to be set as high as possible on the cumulative histogram h(X) in order that the density range having the width D H shown in Fig. 5 is utilized as much as possible in gradation control.
- the judgement is sequentially executed on the densities X Hi through X H4 in order of decreasing value. Then, the highlight density X H is set at a density X H1 when its difference ⁇ X Hi is smaller than or equal to its threshold value W Hi .
- the value of the basic RD X H0 is selected as the highlight density X H at a step S17, and the processing is ended. Therefore, the basic RD X H0 is a minimum value to be as the highlight density X H . Accordingly, the smaller the RCF Y H0 is predetermined, the wider becomes a density range in which the value of the highlight density is selected.
- the RCF Y H0 is predetermined as a minimum cumulative frequency by which a proper density is invariably specified in the highlight portion of the histogram h(X) according to density characteristics of an original without reference to dust, defects and the like on the original.
- the value of the basic RCF Y H0 may be set at 0.1 % - 0.5% and the RCF Y Hi - Y Hn are at 0.1 % - 2%.
- the threshold value W Hi is not always calculated by the equation (9), but it may be given by the following equation having a semi-empirical value ⁇ i :
- the value ⁇ i is given for each RD X i , where the subscript i is an integer, and the value ⁇ i is predetermined under consideration of the curvature at the end portion of the cumulative histogram h(X).
- the difference ⁇ X H1 agrees with the threshold value W Hi given by the equation (9) within the prescribed error ⁇ i or the former is smaller than the latter, the highlight density X H can be set at the value of the density X Hi .
- the highlight density X H may be selected instead.
- a straight line may be drawn through two reference points P0 (X H0 , Y H0 ) and P1 (X H1 , Y H1 ) as shown in Fig. 6B to intersect the X axis at the density X 1m .
- the highlight density X H may be set at the value of a density which is higher than the density X 1m by the difference D H
- a proper value for the highlight density X H can be easily set according to the purpose described above.
- Fig. 9 is a graph showing a cumulative histogram H(X) on which several values used in automatic setting of a highlight density are shown.
- Fig. 10 is a flow chart showing the procedure according to a third embodiment of the present invention.
- a highlight RD X HR a minimum RD X HL and RD's X H1 - X Hn associated with a highlight RCF Y HR , a minimum RCF Y HL and RCF's Y H1 - Y Hn , respectively, are computed.
- This step includes the step S1 shown in Fig. 4 and the step S10 shown in Fig. 7.
- the highlight RCF Y HR of Fig. 9 works not on y as the basic RCF Y H0 in the second embodiment but also as the highlight RCF in the first embodiment. Therefore, the highlight RD X HR is the same with the basic RD X H0 in Fig. 9.
- threshold values W H1 - W Hn are calculated by the equation (9) at a step S21.
- the highlight RD X HR is compared with a predetermined threshold density X HS .
- the highlight RCF Y HR is predetermined preferably at a range of 0.1 % - 2.0 %, and a threshold density X HS is at about 0.35.
- the highlight RD X HR is judged to be higher than the threshold density X HS , the original is subjected to a exceptional processing at a step S23. Namely, the minimum RD X HL is selected as the highlight density X H at the step S23 and the overall processing is ended.
- the step S23 corresponds to the step S4 in Fig. 4.
- steps S24 - S29 are executed.
- the steps S24 - S29 as a whole corresponds to the step S3 of Fig. 4 as well as the steps S12 - S17 of Fig. 7.
- a parameter i for subscript in Fig. 10 is initialized to be "1" at the steps S24 and S25.
- the step S27 is executed that the RD X Hi is selected as the highlight density X H .
- the step S29 is executed that the highlight RD X HR is selected as the highlight density X H .
- the minimum RCF Y HL is predetermined at a range of 0.01 % - 0.5%
- the RCF's Y H1 - Y Hn are at a range of 0.1 % - 2%
- the threshold density X HS is at about 0.35, respectively, as described before.
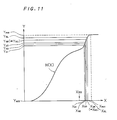
- Fig. 11 is a graph showing the cumulative histogram H(X) with several values used in automatic setting of a shadow density.
- Fig. 11 corresponds to Fig. 9 for highlight density setting.
- Fig. 12 is a flow chart showing the similar procedure to that of Fig. 10, applied to shadow density setting.
- the steps S21 - S29 of Fig. 10 correspond to steps S210 - S290 of Fig. 12, respectively.
- the values shown in Figs. 11 and 12 correspond to those shown in Figs.
- a gradation correction table is generated on the basis of the highlight and shadow densities obtained according to the above procedures.
- data expressing relation between density X and halftone area rate Q which relation is shown as a gradation correction curve G(X) in Fig. 13, is stored in the RAM 18a of the gradation correction circuit 18 shown in Fig. 1 in form of a look-up table.
- the gradation correction curve G(X) is drawn through points P H and P S which are defined by a combination of the highlight density X H and a halftone area rate Q H therefor, and that of the shadow density X S and a halftone area rate Q S therefor, respectively.
- the halftone area rates Q H and Q S are predetermined in advance.
- the reference density X HR is compared with a single value of the threshold density X HS .
- the reference density X HR may be compared with plurality of threshold densities in order to select one of plurality of procedures preset associated with the plurality of threshold densities, respectively.
- the shape of the histogram may be approximated to a line expressed by a polynominal or the like.
- the highlight density X H may be also set on the basis of a differencial coefficient at the end portion of the histogram h(X).
- statistics r(X) expressed by the following equation may be utilized in place of the cumulative histogram h(X): Since a change rate of staistic value due to a density change on the statistics r(X) is less than on the histogram h(X), the highlight and shadow densities are established more steadily without reference to noise component on the original if the statistics r(X) is utilized instead of the histogram h(X).
- the highlight and shadow densities may be set according to a shape of an end portion of density statistics of an original.
- Fig. 14 is a flow chart showing this procedure, and it is partly transformed from Fig. 10. Namely, a step S30(S31 - S34) is inserted between the step S21 and S22 in Fig. 10. The cumulative histogram h(X) of Fig. 9 is also subjected to the procedure of Fig. 14.
- the reason why the absolute values are compared in the step S32 is that both the values of ⁇ X HL and W HL are negative because relations X HL ⁇ X H0 and Y HL ⁇ Y H0 hold. If the absolute value of ⁇ X HL is larger than that of W HL , the original is processed as a normal one by the steps S22 - S29.
- ⁇ X HL expresses a gradient of the histogram H(X) at a density range from X HL to X H0 and the step S32 means that the original is processed as a normal one if the gradient is greater than a certain value.
- the minimum RD X HL is first compared with a predetermined threshold density X HLS at a step S33. If the minimum RD X HL is higher than the threshold density X HLS , the step S23 is executed that the minimum RD X HL is selected as the highlight density X H . This is similar to the step S22 and S23 in Fig. 10.
- the highlight density X H is set at the average value X LR of the minimum RD X HL and the highlight RD X HR at a step S34. It is considered in this procedure that the highlight density X H would not be set excessively low.
- the apparatus used for the present invention is not restricted to the graphic arts scanner shown in Fig. 1, but the present invention may be applicable to other apparatuses such as a drum type image scanner, facsimile terminal equipment, a copying machine, an image transmission apparatus and the like.
- the image data to be processed by the present invention is not restricted to what is obtained through scanning and reading by a graphic arts scanner as described in the embodiments, but various types of image data such as those obtained by so-called High Definition Television and other apparatuses referred to as New Media, can be also processed by the present invention.
- Fig. 15 is a block diagram showing the structure of one of such apparatuses.
- a magnetic tape 41 stores image data obtained by the other apparatus.
- the magnetic tape 41 is controlled by the magnetic tape controller 42 to transmit the image data V N to the switching circuit 16 or to the I/O port 33 of the microcomputer 30. That is, the image processing apparatus of Fig. 15 is provided with the magnetic tape 41 and the magnetic tape controller 42 in place of the internal structure of the frame box 1, the A-D converter 14 and the shading correction circuit 15 of the graphic arts scanner shown in Fig. 1, and the other structure of the apparatus is the same with that shown in Fig. 1.
- the magnetic tape 41 and the controller 42 may be also replaceable by a magnetic disc, an optical disc, other memory means with controller and an apparatus for generating image data such as High Definition Television.
- appropriate highlight and shadow densities can be easily established in consideration of density characteristics of an original because the processing procedure is selected on the basis of a certain density of or a shape of density statistics of the original.
- the present invention does not need manual operation for measuring densities, thereby reducing time and labor of an operator remarkably and providing a recorded image and a reproduced image having invariable quality.
Landscapes
- Engineering & Computer Science (AREA)
- Multimedia (AREA)
- Signal Processing (AREA)
- Facsimile Image Signal Circuits (AREA)
- Image Processing (AREA)
Applications Claiming Priority (2)
| Application Number | Priority Date | Filing Date | Title |
|---|---|---|---|
| JP80405/88 | 1988-03-31 | ||
| JP63080405A JP2525859B2 (ja) | 1988-03-31 | 1988-03-31 | ハイライト・シャド―濃度値の設定方法 |
Publications (3)
| Publication Number | Publication Date |
|---|---|
| EP0335419A2 true EP0335419A2 (de) | 1989-10-04 |
| EP0335419A3 EP0335419A3 (de) | 1991-07-03 |
| EP0335419B1 EP0335419B1 (de) | 1995-05-31 |
Family
ID=13717383
Family Applications (1)
| Application Number | Title | Priority Date | Filing Date |
|---|---|---|---|
| EP89105719A Expired - Lifetime EP0335419B1 (de) | 1988-03-31 | 1989-03-31 | Verfahren und Vorrichtung zum Einsetzen von Licht- und Schattendichten |
Country Status (4)
| Country | Link |
|---|---|
| US (1) | US5053888A (de) |
| EP (1) | EP0335419B1 (de) |
| JP (1) | JP2525859B2 (de) |
| DE (1) | DE68922876T2 (de) |
Cited By (8)
| Publication number | Priority date | Publication date | Assignee | Title |
|---|---|---|---|---|
| EP0509549A3 (en) * | 1991-04-19 | 1994-06-22 | Fuji Photo Film Co Ltd | Scan reading method |
| EP0703699A3 (de) * | 1994-09-21 | 1996-08-14 | Canon Kk | Vorrichtung zum Nachweis von Röntgenstrahlung und Bildlesegerät |
| EP0810551A1 (de) * | 1996-05-30 | 1997-12-03 | Agfa-Gevaert N.V. | Erkennung und Korrektur von spiegelnden Reflexionen in der digitalen Bilderfassung |
| EP0732842A3 (de) * | 1992-07-23 | 1998-04-01 | Fuji Xerox Co., Ltd. | Bildverarbeitungsgerät, das dazu fähig ist, die Densität eines Hintergrundteils richtig zu bestimmen |
| US6061091A (en) * | 1996-05-30 | 2000-05-09 | Agfa Gevaert N.V. | Detection of and correction for specular reflections in digital image acquisition |
| US6282306B1 (en) | 1994-09-21 | 2001-08-28 | Canon Kabushiki Kaisha | X-ray image detecting apparatus and image reading apparatus |
| EP1292113A3 (de) * | 2001-08-23 | 2005-03-23 | Eastman Kodak Company | Einstellung der Grauskala |
| WO2007019265A1 (en) * | 2005-08-04 | 2007-02-15 | Intel Corporation | Method of adaptive image contrast enhancement |
Families Citing this family (26)
| Publication number | Priority date | Publication date | Assignee | Title |
|---|---|---|---|---|
| JP2768786B2 (ja) * | 1990-02-20 | 1998-06-25 | キヤノン株式会社 | 画像読み取り装置 |
| US5612792A (en) * | 1990-03-05 | 1997-03-18 | Canon Kabushiki Kaisha | Image processing method and apparatus for outputting a pattern image in accordance with the color and density level of each color of the output polychromatic image |
| US5388168A (en) * | 1990-11-19 | 1995-02-07 | Matsushita Electric Industrial Co., Ltd. | Picture quality improving circuit using a cumulative histogram |
| JPH04196761A (ja) * | 1990-11-28 | 1992-07-16 | Canon Inc | 画像形成装置 |
| JPH04219067A (ja) * | 1990-12-19 | 1992-08-10 | Canon Inc | 画像処理方法 |
| JPH0799862B2 (ja) * | 1991-03-22 | 1995-10-25 | 松下電器産業株式会社 | 階調補正装置 |
| JPH04294467A (ja) * | 1991-03-22 | 1992-10-19 | Hitachi Ltd | 画像処理装置 |
| US5249241A (en) * | 1991-07-09 | 1993-09-28 | The United States Of America As Represented By The Secretary Of The Air Force | Real-time automated scene display for infrared cameras |
| DE69216190T2 (de) * | 1991-09-27 | 1997-04-17 | Dainippon Screen Mfg | Verfahren und Vorrichtung zum Umsetzen von Bildsignalen die ein Bild mit Gradation darstellen |
| DE69414151T2 (de) * | 1993-02-16 | 1999-03-18 | Fuji Photo Film Co., Ltd., Minami-Ashigara, Kanagawa | Verfahren für die Korrektur des Graugleichgewichts von einem Farbbild, welches auf einem Negativ-Film aufgenommen worden ist |
| JP3456032B2 (ja) * | 1994-05-09 | 2003-10-14 | 富士写真フイルム株式会社 | 画像処理方法 |
| US5625755A (en) * | 1994-07-01 | 1997-04-29 | Seiko Epson Corporation | Method and apparatus for tonal correction in binary printing devices by predistortion of image data utilizing ink reduction processing |
| US5760920A (en) * | 1994-09-19 | 1998-06-02 | Lin; Qian | System and method for generating calibrated dither matrices |
| US5727080A (en) * | 1995-05-03 | 1998-03-10 | Nec Research Institute, Inc. | Dynamic histogram warping of image histograms for constant image brightness, histogram matching and histogram specification |
| DE19531390A1 (de) * | 1995-08-26 | 1997-02-27 | Hell Ag Linotype | Verfahren und Einrichtung zur Umwandlung von Farbwerten |
| US6493468B1 (en) * | 1998-05-06 | 2002-12-10 | Canon Kabushiki Kaisha | Image processing apparatus and method |
| US6625327B1 (en) * | 1998-09-24 | 2003-09-23 | Minolta Co., Ltd. | Method and apparatus of image processing capable of gradation reducing process with high image quality |
| US6486915B2 (en) * | 1999-04-20 | 2002-11-26 | Intel Corporation | Determining a final exposure setting automatically for a solid state camera without a separate light metering circuit |
| US20020012126A1 (en) * | 1999-12-20 | 2002-01-31 | Hiroaki Nakamura | Image processing method and apparatus |
| JP4362479B2 (ja) * | 2003-12-12 | 2009-11-11 | 富士通株式会社 | カラーバランス補正プログラム、カラーバランス補正装置およびカラーバランス補正方法 |
| US8050511B2 (en) * | 2004-11-16 | 2011-11-01 | Sharp Laboratories Of America, Inc. | High dynamic range images from low dynamic range images |
| KR100752850B1 (ko) * | 2004-12-15 | 2007-08-29 | 엘지전자 주식회사 | 디지털 영상 촬영장치와 방법 |
| TW200820123A (en) * | 2006-10-20 | 2008-05-01 | Primax Electronics Ltd | Method and system of generating high dynamic range image corresponding to specific scene |
| KR20080076628A (ko) * | 2007-02-16 | 2008-08-20 | 삼성전자주식회사 | 영상의 입체감 향상을 위한 입체영상 표시장치 및 그 방법 |
| JP6241192B2 (ja) * | 2013-10-18 | 2017-12-06 | 株式会社リコー | 画像処理装置、画像処理システム、画像処理方法、プログラム及び記録媒体 |
| JP2016189946A (ja) * | 2015-03-31 | 2016-11-10 | 富士フイルム株式会社 | 医用画像位置合わせ装置および方法並びにプログラム |
Family Cites Families (5)
| Publication number | Priority date | Publication date | Assignee | Title |
|---|---|---|---|---|
| US4727434A (en) * | 1984-03-14 | 1988-02-23 | Canon Kabushiki Kaisha | Image processing apparatus for rapid production of a hard copy of a video image in which input image signal processing parameters are set while a record medium is being positioned at a recording position |
| JPS6342575A (ja) * | 1986-08-08 | 1988-02-23 | Dainippon Screen Mfg Co Ltd | 階調変換方法およびその装置 |
| JPS6361579A (ja) * | 1986-09-02 | 1988-03-17 | Fuji Photo Film Co Ltd | 画像処理方法及び装置 |
| JPH0614683B2 (ja) * | 1988-05-13 | 1994-02-23 | 株式会社ヤマトヤ商会 | 画像の階調変換処理法 |
| JP2796718B2 (ja) * | 1988-08-23 | 1998-09-10 | 株式会社ヤマトヤ商会 | 画像の階調変換方法 |
-
1988
- 1988-03-31 JP JP63080405A patent/JP2525859B2/ja not_active Expired - Lifetime
-
1989
- 1989-03-31 US US07/332,466 patent/US5053888A/en not_active Expired - Lifetime
- 1989-03-31 DE DE68922876T patent/DE68922876T2/de not_active Expired - Lifetime
- 1989-03-31 EP EP89105719A patent/EP0335419B1/de not_active Expired - Lifetime
Cited By (12)
| Publication number | Priority date | Publication date | Assignee | Title |
|---|---|---|---|---|
| EP0509549A3 (en) * | 1991-04-19 | 1994-06-22 | Fuji Photo Film Co Ltd | Scan reading method |
| EP0732842A3 (de) * | 1992-07-23 | 1998-04-01 | Fuji Xerox Co., Ltd. | Bildverarbeitungsgerät, das dazu fähig ist, die Densität eines Hintergrundteils richtig zu bestimmen |
| US5926579A (en) * | 1992-07-23 | 1999-07-20 | Fuji Xerox Co., Ltd. | Image processing apparatus capable of properly determining density of a background portion |
| EP0703699A3 (de) * | 1994-09-21 | 1996-08-14 | Canon Kk | Vorrichtung zum Nachweis von Röntgenstrahlung und Bildlesegerät |
| US6282306B1 (en) | 1994-09-21 | 2001-08-28 | Canon Kabushiki Kaisha | X-ray image detecting apparatus and image reading apparatus |
| EP1251685A3 (de) * | 1994-09-21 | 2003-01-08 | Canon Kabushiki Kaisha | Vorrichtung zum Nachweis von Röntgenstrahlung und Bildlesegerät |
| EP0810551A1 (de) * | 1996-05-30 | 1997-12-03 | Agfa-Gevaert N.V. | Erkennung und Korrektur von spiegelnden Reflexionen in der digitalen Bilderfassung |
| US6061091A (en) * | 1996-05-30 | 2000-05-09 | Agfa Gevaert N.V. | Detection of and correction for specular reflections in digital image acquisition |
| EP1292113A3 (de) * | 2001-08-23 | 2005-03-23 | Eastman Kodak Company | Einstellung der Grauskala |
| US7330287B2 (en) | 2001-08-23 | 2008-02-12 | Eastman Kodak Company | Tone scale adjustment |
| WO2007019265A1 (en) * | 2005-08-04 | 2007-02-15 | Intel Corporation | Method of adaptive image contrast enhancement |
| US7512269B2 (en) | 2005-08-04 | 2009-03-31 | Asaf Golan | Method of adaptive image contrast enhancement |
Also Published As
| Publication number | Publication date |
|---|---|
| EP0335419A3 (de) | 1991-07-03 |
| JP2525859B2 (ja) | 1996-08-21 |
| JPH01253366A (ja) | 1989-10-09 |
| DE68922876T2 (de) | 1995-10-19 |
| DE68922876D1 (de) | 1995-07-06 |
| US5053888A (en) | 1991-10-01 |
| EP0335419B1 (de) | 1995-05-31 |
Similar Documents
| Publication | Publication Date | Title |
|---|---|---|
| EP0335419B1 (de) | Verfahren und Vorrichtung zum Einsetzen von Licht- und Schattendichten | |
| US6674544B2 (en) | Image processing method and apparatus | |
| EP0372390B1 (de) | Verfahren und Vorrichtung zur Feststellung eines Referenzpunktes auf einer Gradationskorrekturkurve | |
| US6101273A (en) | Image reproducing method and apparatus | |
| US6748109B1 (en) | Digital laboratory system for processing photographic images | |
| US5818975A (en) | Method and apparatus for area selective exposure adjustment | |
| US5513016A (en) | Method and apparatus for processing image signal | |
| US6198844B1 (en) | Image processing apparatus | |
| US6122076A (en) | Image reproducing method and apparatus including compressing a dynamic range of a read-out image signal | |
| EP0457537A2 (de) | Farbbildverarbeitungsgerät | |
| US5905817A (en) | Image reproducing method and apparatus using dynamic range compression based on an unsharp signal generated by IIR filter | |
| US5475509A (en) | Method and apparatus for setting image processing conditions | |
| EP0595353B1 (de) | Verfahren und Vorrichtung zum Erzeugen einer Normalisierungskurve | |
| US7164805B2 (en) | Image processing method and apparatus, and recording medium | |
| US5805723A (en) | Image processing apparatus with means for adjusting image data for divided areas | |
| US6560374B1 (en) | Image processing apparatus | |
| US6694052B1 (en) | Image reproducing method and apparatus | |
| EP0420152B1 (de) | Verfahren und Vorrichtung zur Beseitigung von Falschbildern | |
| US5519509A (en) | Image processing method utilizing error diffusion technique | |
| US6674466B1 (en) | Image processing apparatus utilizing light distribution characteristics of an electronic flash | |
| JP4083823B2 (ja) | 画像処理装置 | |
| US6608943B1 (en) | Image processing method and apparatus | |
| US20020012126A1 (en) | Image processing method and apparatus | |
| JP3576812B2 (ja) | 画像処理装置及び画像処理方法 | |
| JPH1013673A (ja) | デジタル画像信号処理方法および装置 |
Legal Events
| Date | Code | Title | Description |
|---|---|---|---|
| PUAI | Public reference made under article 153(3) epc to a published international application that has entered the european phase |
Free format text: ORIGINAL CODE: 0009012 |
|
| AK | Designated contracting states |
Kind code of ref document: A2 Designated state(s): DE FR GB IT |
|
| PUAL | Search report despatched |
Free format text: ORIGINAL CODE: 0009013 |
|
| AK | Designated contracting states |
Kind code of ref document: A3 Designated state(s): DE FR GB IT |
|
| 17P | Request for examination filed |
Effective date: 19911004 |
|
| 17Q | First examination report despatched |
Effective date: 19931007 |
|
| GRAA | (expected) grant |
Free format text: ORIGINAL CODE: 0009210 |
|
| AK | Designated contracting states |
Kind code of ref document: B1 Designated state(s): DE FR GB IT |
|
| ET | Fr: translation filed | ||
| ITF | It: translation for a ep patent filed | ||
| REF | Corresponds to: |
Ref document number: 68922876 Country of ref document: DE Date of ref document: 19950706 |
|
| PLBE | No opposition filed within time limit |
Free format text: ORIGINAL CODE: 0009261 |
|
| STAA | Information on the status of an ep patent application or granted ep patent |
Free format text: STATUS: NO OPPOSITION FILED WITHIN TIME LIMIT |
|
| 26N | No opposition filed | ||
| REG | Reference to a national code |
Ref country code: GB Ref legal event code: IF02 |
|
| PGFP | Annual fee paid to national office [announced via postgrant information from national office to epo] |
Ref country code: IT Payment date: 20080327 Year of fee payment: 20 |
|
| PGFP | Annual fee paid to national office [announced via postgrant information from national office to epo] |
Ref country code: DE Payment date: 20080407 Year of fee payment: 20 Ref country code: FR Payment date: 20080311 Year of fee payment: 20 |
|
| PGFP | Annual fee paid to national office [announced via postgrant information from national office to epo] |
Ref country code: GB Payment date: 20080402 Year of fee payment: 20 |
|
| REG | Reference to a national code |
Ref country code: GB Ref legal event code: PE20 Expiry date: 20090330 |
|
| PG25 | Lapsed in a contracting state [announced via postgrant information from national office to epo] |
Ref country code: GB Free format text: LAPSE BECAUSE OF EXPIRATION OF PROTECTION Effective date: 20090330 |