EP0347995A1 - Procédé et dispositif pour déterminer une distribution de la résonance de spin - Google Patents
Procédé et dispositif pour déterminer une distribution de la résonance de spin Download PDFInfo
- Publication number
- EP0347995A1 EP0347995A1 EP89201596A EP89201596A EP0347995A1 EP 0347995 A1 EP0347995 A1 EP 0347995A1 EP 89201596 A EP89201596 A EP 89201596A EP 89201596 A EP89201596 A EP 89201596A EP 0347995 A1 EP0347995 A1 EP 0347995A1
- Authority
- EP
- European Patent Office
- Prior art keywords
- values
- distribution
- time integral
- signal
- gradient
- Prior art date
- Legal status (The legal status is an assumption and is not a legal conclusion. Google has not performed a legal analysis and makes no representation as to the accuracy of the status listed.)
- Granted
Links
- 238000009826 distribution Methods 0.000 title claims abstract description 72
- 238000000034 method Methods 0.000 title claims abstract description 44
- 238000005259 measurement Methods 0.000 claims abstract description 19
- 238000005070 sampling Methods 0.000 claims description 20
- 238000012545 processing Methods 0.000 claims description 5
- 230000000694 effects Effects 0.000 claims description 4
- 238000012935 Averaging Methods 0.000 abstract description 3
- 230000009466 transformation Effects 0.000 description 8
- 239000011159 matrix material Substances 0.000 description 6
- 238000005481 NMR spectroscopy Methods 0.000 description 5
- 238000003384 imaging method Methods 0.000 description 5
- 230000029058 respiratory gaseous exchange Effects 0.000 description 5
- 230000007704 transition Effects 0.000 description 4
- 238000012937 correction Methods 0.000 description 3
- 230000000875 corresponding effect Effects 0.000 description 3
- 230000005284 excitation Effects 0.000 description 3
- 230000001747 exhibiting effect Effects 0.000 description 3
- 230000006872 improvement Effects 0.000 description 3
- 230000005415 magnetization Effects 0.000 description 3
- 230000008569 process Effects 0.000 description 3
- 230000000241 respiratory effect Effects 0.000 description 3
- 238000002595 magnetic resonance imaging Methods 0.000 description 2
- 238000004435 EPR spectroscopy Methods 0.000 description 1
- 235000014443 Pyrus communis Nutrition 0.000 description 1
- 230000002596 correlated effect Effects 0.000 description 1
- 238000001514 detection method Methods 0.000 description 1
- 230000001788 irregular Effects 0.000 description 1
- 238000013507 mapping Methods 0.000 description 1
- 230000009467 reduction Effects 0.000 description 1
- 229920006395 saturated elastomer Polymers 0.000 description 1
- 238000000264 spin echo pulse sequence Methods 0.000 description 1
- 230000000699 topical effect Effects 0.000 description 1
Images



Classifications
-
- G—PHYSICS
- G01—MEASURING; TESTING
- G01R—MEASURING ELECTRIC VARIABLES; MEASURING MAGNETIC VARIABLES
- G01R33/00—Arrangements or instruments for measuring magnetic variables
- G01R33/20—Arrangements or instruments for measuring magnetic variables involving magnetic resonance
- G01R33/44—Arrangements or instruments for measuring magnetic variables involving magnetic resonance using nuclear magnetic resonance [NMR]
- G01R33/48—NMR imaging systems
- G01R33/54—Signal processing systems, e.g. using pulse sequences ; Generation or control of pulse sequences; Operator console
- G01R33/56—Image enhancement or correction, e.g. subtraction or averaging techniques, e.g. improvement of signal-to-noise ratio and resolution
Definitions
- the invention relates to a method of determining a spin resonance distribution from spin resonance signals which are generated in a region of an object containing atomic spins, such as nuclear spins, the object being arranged in a uniform magnetic field, a pulse and gradient sequence being applied a number of times in order to obtain the spin resonance signals, which sequence contains at least one rf electromagnetic pulse for exciting the spins in the uniform magnetic field which contains a first magnetic field gradient with a predetermined value of a time integral over the first magnetic field gradient in a first direction for phase encoding of the spins, and which also contains a second magnetic field gradient in a second direction which is applied during acquisition of the resonance signal, the pulse and gradient sequence being repeated a variable number of times over the number of times that the pulse and gradient sequence is applied for different values of the predetermined value of the time integral of the first magnetic field gradient, the spin resonance signals being averaged for equal values of the time integral after signal acquisition and before determination of the spin resonance distribution.
- the invention also relates to a device for determining a spin resonance distribution from spin resonance signals, which device comprises means for generating a uniform magnetic field, means for applying a pulse and gradient sequence in order to obtain spin resonance signals from a region of an object arranged in the uniform magnetic field, means for receiving, detecting and sampling the spin resonance signals, and means for displaying an image of the spin resonance distribution, and also comprises processing means which include programmed arithmetic means for determining the image from the sampled spin resonance signals.
- a method of this kind is particularly suitable for nuclear spin resonance, but can also be used for electron spin resonance.
- profile distributions are chosen which offer, selectively over a given range of spatial frequencies, an improvement of the signal-to-noise ratio in the image. Because not all profiles are measured equally frequently for the improvement of the signal-to-noise ratio in the image, unnecessary prolongation of the overall measuring time required for obtaining resonance signals for an image is avoided.
- a drawback of the method disclosed in said British Patent Application consists in that in advance a profile selection is made which is not based on an unambiguous criterion. For example, a distribution is proposed in which profiles with comparatively small values of the time integral (corresponding to comparatively low spatial frequencies) occur more frequently. Generally speaking, profile distributions are proposed in which profiles for a predetermined range of spatial frequencies are measured more often.
- a method in accordance with the invention is characterized in that there is determined a distribution of the values of the time integral which maximizes the information contents of an image representing the spin resonance distribution, the number of times that the pulse and gradient sequence is applied being predetermined.
- the profile distribution is determined by means of programmed means. Sampling values of the spin resonance signals associated with different values of the time integral over the first magnetic field gradient can be mapped on a two-dimensional space of spatial frequencies. By executing a two- dimensional Fourier transformation over the two-dimensional space, the spin resonance distribution is obtained for representation in a grey-tone image.
- Each point in the two-dimensional space may be considered to form an information source containing information concerning the image.
- a signal distribution within the set indicates, in each point in the two-dimensional space, the probability of occurrence of a given signal amplitude in the point.
- the amount of information received by measurement of a signal in the point is the entropy (uncertainty) of the signal distribution in the point.
- entropy uncertainty
- the distribution can be modelled by means of a two-dimensional Gaussian distribution in which the entropy is a function of the variance of the distribution in each point of the two-dimensional space.
- the variance determines how much image information is obtained in a point by measurement of a signal in the point. Furthermore, noise in a point is represented by a Gaussian distribution in the entropy of the point, so that the entropy of a noise-like information source is obtained.
- H( k ) 2log ⁇ 1+n( k ).vs( k )/vn ⁇ , where 2log is a logarithmic operation with base 2, n( k ) is the number of measurements in the point k , vs( k ) is the variance in the signal in the point k , and vn is the variance of the noise.
- the information contents I of the image are maximized, subject to the restriction that the total number of profiles for an image is predetermined, a distribution of the values of the time integral being determined on the basis of the maximization of the information contents.
- the total number of profiles can be determined from the total measuring time and the measuring time required for one profile.
- the value of the time integral of the first magnetic field gradient can be varied by varying its amplitude.
- a version of a method in accordance with the invention is characterized in that the distribution is determined during the acquisition of the spin resonance signals by selecting from a redundancy table containing redundancy values for the values of the time integral, prior to the application of the pulse and gradient sequence, a value of the time integral which is associated with a minimum redundancy value, the redundancy values being a function of a signal-to-noise ratio associated with the value of the time integral, of the number of times that the value of the time integral has been selected, and of the number of times that an opposite value of the time integral has been selected, said redundancy values being adapted during the acquisition of the spin resonance signals.
- the maximization of the information contents and the distribution of the profiles can be realized during the acquisition of the spin resonance signals by estimating, prior to the application of the pulse and gradient sequence, a value of the time integral which results in a maximum information increase in the image.
- this corresponds to an estimate of the minimum redundancy value for a profile.
- the redundancy for a profile is very high when there is substantially no signal (a small signal-to-noise ratio); such a profile does not lead to a substantial information increase in the image and the redundancy increases as the number of times that a profile has been measured is larger; measuring the profile again at the expense of other profiles does not result in the largest increase of the information contents of the image.
- the progress in the assignment of profiles is recorded in the redundancy table.
- a further version of a method in accordance with the invention is characterized in that the signal-to-noise ratio associated with a redundancy value is estimated from a signal-to-noise ratio associated with a neighbouring, already selected value of the time integral, the estimated signal-to-noise ratio being inserted in the redundancy table and the associated redundancy value being adapted.
- the mean signal power of a profile becomes known only after the profile has been measured, so that estimation in advance of the redundancy value of the profile is not possible simply on the basis of the signal-to-noise ratio of the profile.
- the signal-to-noise ratio of a profile is estimated on the basis of the signal-to-noise ratio of a neighbouring profile which has already been measured, after which the profile with a minimum redundancy is looked up in the redundancy table.
- Another version of a method in accordance with the invention is characterized in that prior to the acquisition of the spin resonance signals the distribution is determined from a predetermined redundancy table with redundancy values associated with values of the time integral of the first magnetic field gradient by applying in advance an additional pulse and gradient sequence in which the first magnetic field gradient is applied during the signal acquisition in order to obtain an additional resonance signal wherefrom there is determined a signal distribution whereby a parameter of a model function of a distribution of a signal power is estimated, and by determining signal-to-noise ratios from a function of a mean noise power, the values of the time integral and the parameter determined, after which the distribution is determined by selecting the values of the time integral from minimum redundancy values, the redundancy values being a function of the signal-to-noise ratios, of the number of times that the value of the time integral has been selected, and of the number of the times that an opposite value of the time integral has been selected, said redundancy values being adapted during the determination of the profile distribution.
- the distribution which leads to a maximum information contents in the image is available prior to the acquisition of the spin resonance signals.
- the function of the signal-to-noise ratio in the redundancy values is then estimated on the basis of the additional pulse and gradient sequence in which the first field gradient takes over the foundation of the second field gradient during signal acquisition.
- sampling values are then obtained in the direction of the first field gradient.
- Said function is estimated from the signal decrease over the additional profile, it being necessary to have an estimate available for the signal power over the spatial frequency space. The estimate is made on the basis of a model of the signal power of the spatial frequency space.
- the mean noise power is determined in a pulse and gradient sequence in which the spins are not excited.
- the number of times that the values of the time integral will be assigned in determined on the basis of minimum redundancy in the same way as is the previously described version; the redundancy table is compiled on the basis thereof.
- a further version of a method in accordance with the invention is characterized in that during the acquisition of the spin resonance signals a succession of values of the time integral is selected from the distribution, such that effects of motion of the object are reduced. Because the distribution is available prior to the measurement of the resonance signals, the succession in which the profiles are measured can be chosen at random. As a result, for example, a succession of profiles can be chosen so that the effect of motion of the object is reduced.
- Such successions of profiles have already been described, for example in European Patent Application No. 0.218.838 and PCT Patent Application No. WO 87/00923 and are known in the form of acronyms such as ROPE, COPE and PEAR.
- a further version of a method in accordance with the invention is characterized in that all associated pulse and gradient sequences are measured over a sub-range of a range of values of the time integral.
- a further version of a method in accordance with the invention is characterized in that over the range of values of the time integral there is made an estimate for resonance signals associated with non-measured values of the time integral so that an image is obtained which is a reasonable approximation of an image obtained by measurement of the non-measured resonance signals.
- an estimate for resonance signals associated with non-measured values of the time integral so that an image is obtained which is a reasonable approximation of an image obtained by measurement of the non-measured resonance signals.
- Gibbs' phenomenon occurs, so that ringing artefacts are liable to occur in the image.
- all non-measured profiles are first equated to zero in a data array of spin resonance signals. Subsequently, the estimate is made, using a method as described in the article by M. Fuderer "Ringing artefact reduction by an efficient likelihood improvement method", Magnetic Resonance Imaging, vol. 6, suppl. I, P-37, 1988.
- a further version of a method in accordance with the invention is characterized in that a step size between successive values of the time integral is adapted to a dimension of the object by estimating the dimension of the object from the resonance signal obtained by means of a pulse and gradient sequence in which the first magnetic field gradient is applied during the acquisition of the resonance signal.
- a step size between successive values of the time integral is adapted to a dimension of the object by estimating the dimension of the object from the resonance signal obtained by means of a pulse and gradient sequence in which the first magnetic field gradient is applied during the acquisition of the resonance signal.
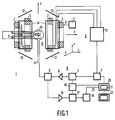
- Fig. 1 diagrammatically shows a device 1 in accordance with the invention.
- the device 1 comprises magnet coils 2 and, in the case of resistance magnets or superconducting magnets, a d.c. power supply source 3.
- the magnet coils 2 and the d.c. power supply source 3 constitute means 4 for generating a uniform magnetic field B0.
- the d.c. power supply source 3 is absent.
- an object 5 which contains atomic spins, for example nuclear spins.
- the device 1 also comprises means 6 for applying a pulse and gradient sequence in order to obtain spin resonance signals from a region of the object 5, which means comprise a modulator 7, an amplifier 8, a directional coupler 9, a transmitter/receiver coil 10 for transmitting rf electromagnetic pulses and for receiving magnetic resonance signals and a power supply source 12 which can be controlled by a process computer 11 and which serves to power individually controllable gradient magnet coils 13, 14 and 15.
- the arrangement of the gradient coils 13, 14 and 15 in space is such that the field direction of respective magnetic field gradients G x , G y and G z to be generated by means of the gradient magnet coils coincides with the direction of the magnetic field B0, the gradient directions being mutually perpendicular; in Fig. 1 this is denoted by three mutually perpendicular axes x, y and z.
- the device 1 furthermore comprises means for receiving and detecting the spin resonance signals, i.e. the transmitter/receiver coil 10, an amplifier 16, a phase-sensitive detector 17, means for sampling the spin resonance signals, i.e. an A/D converter 18.
- the modulator 7 and the phase sensitive detector 17 are coupled to an oscillator 19 for generating a carrier signal.
- the modulator 7 is controlled by the process computer 11 which is coupled to processing means 20 which comprise programmed arithmetic means 21. In the case of quadrature detection, there is also provided a further A/D converter (not shown herein). Sampling values 22 can be applied to the processing means 20.
- the programmed arithmetic means comprise Fourier transformation means for reconstructing an image from sampled magnetic resonance signals.
- the device 1 furthermore comprises display means 23, inter alia for displaying the image.
- the transmitter/receiver coil can alternatively be constructed as a separate transmitter coil and a separate receiver coil; the transmitter coil and the receiver coil should then be decoupled from one another. Alternatively, for example the receiver coil may be constructed as a so-called surface coil.
- Fig. 2A shows a pulse and gradient sequence as a function of the time t.
- the references t0, t1, t2, t3 and t4 denote some instants.
- the Figure shows an rf magnetic pulse rf which is applied to the object 5 via the transmitter/receiver coil 10, a first, a second and a third magnetic field gradient G y , G x , G z which are generated by means of the respective gradient magnet coils 14, 13 and 15, and a spin resonance signal e which is received by the transmitter/receiver coil 10.
- the rf pulse rf is applied to the object 5 at the instant t0.
- ⁇ 0 gamma.B0
- gamma the gyroscopic ratio of protons.
- the magnetization M is rotated through an angle which is determined by the rf pulse.
- the third gradient G z serves for slice selection.
- the frequency contents of the pulse rf are such that protons are excited exclusively in a selected slice extending parallel to the xy plane.
- the first gradient G y is applied for phase encoding of the nuclear spins.
- the first gradient G y has a variable time integral over different pulse and gradient sequences for obtaining resonance signals; in the version shown, this is achieved by variation of the amplitude of the gradient G y .
- the second gradient G x and the third gradient G z are applied in order to dephase the nuclear spins in the x direction and to rephase the nuclear spins in the z direction.
- the second gradient G x is applied with a polarity which opposes the polarity of G x in the interval t1-t2, in order to rephase the nuclear spins in the x direction.
- the spin resonance signal e is formed.
- the A/D converter 18 will sample the spin resonance signal, under the control of the programmed arithmetic means 21, in the interval t2-t4.
- a two-dimensional Fourier transformation performed on the sampling values 22 produces a spin resonance distribution.
- a two-dimensional Fourier function of sampling values is to be considered as a mapping in a k space of spatial frequencies.
- the Fourier function is then a function of the spatial frequencies k x and k y , corresponding to the x direction and the y direction, respectively.
- the k space is the Fourier transform of the xyz space. In each dimension the k space is related to the xyz space in the same way as the frequency is related to time.
- Practical NMR Imaging pp. 18-22 and pp. 95-102 for slice selection.
- Fig. 2B shows a spatial frequency plane.
- the two dimensional Fourier function of sampling values is a function of the spatial frequencies k x and k y .
- the pulse and gradient sequence shown in Fig. 1 for a given value of G y during the sampling of the spin resonance signal the k x k y -plane is followed along a line extending parallel to the k x -axis at a speed gamma.G x .
- Fig. 3A shows a profile distribution PD in accordance with the invention.
- the Figure shows a distribution of the number of profiles as a function of the spatial frequency k y .
- the spatial frequency k y can extend through a range from, for example -128 to +127. In the distribution, being asymmetrical in this case, 1, 2 or 3 profiles have been measured for different k y .
- the distribution PD is realized during the measurement of the spin resonance signals or can be predetermined. The distribution is realized on the basis of obtaining a maximum information contents of the image.
- mirrored profiles - k y and k y redundancy exists.
- the asymmetry of the distribution of positive and negative profiles need not give rise to problems during image reconstruction utilizing so-called "half Fourier" reconstruction.
- the "half Fourier" reconstruction utilizes the redundancy present.
- reconstruction can be performed with a normal Fourier reconstruction (full reconstruction) or with "half Fourier” reconstruction (partial matrix reconstruction).
- full reconstruction full reconstruction
- partial matrix reconstruction partial matrix reconstruction
- the highest profile number which has been selected at least once is of importance, and also the lowest profile number selected.
- the partial matrix reconstruction must be used if said highest and lowest number do not correspond in an absolute sense. In practice this requirement is less severe; normal Fourier reconstruction can be used when the lowest profile number, in an absolute sense, amounts to some 60 % of its maximum possible value in an absolute sense, and also when the difference between the highest and the lowest profile number is less than approximately 30 %.
- the partial matrix reconstruction is described in the article "Reducing MR imaging time by one-sided reconstruction" by J. Cuppen et al, Topical conference on fast magnetic resonance imaging, Cleveland, Ohio, May 1987.
- Fig. 3B shows a redundancy table used for determining the profile distribution PD in accordance with the invention.
- the table states inter alia a number of times i that the profile k y and its opposite -k y have been measured, a redundancy value R(k y ) and a function R0(k y ) of a signal-to-noise ratio associated with the redundancy value R(k y ) or an estimate thereof.
- R(k y ) When the profile k y has been selected, R(k y ) is adapted and the described process is repeated until the number of profiles n to be measured is reached. In order to enable the method in accordance with the invention to be used, an effective procedure must be available for the determination of R0(k y ). This will be described hereinafter.
- the mean power is to be considered as the sum of the squared sampling values of the signal divided by the number of samples.
- P N is the mean noise power (i.e.
- P p (k y ) can be determined for the profile.
- P N is determined by performing a measurement for some time without the pulse rf in a pulse and gradient sequence, i.e. without exciting the spins.
- Knowledge of P N and P p (k y ) enables R0(k y +1) to be inserted in the redundancy table, so that the estimate of R0 has already been determined when that profile is selected.
- the positive profiles may also be slightly favoured or monotonicity can be imposed on R0(k y ) so that the pattern of assignment of profiles does not become very irregular.
- Fig. 3C shows a redundancy pattern as a function of the spatial frequency k y .
- An interrupted line therein indicates R0(k y ) and a non-interrupted line indicates R(k y ).
- the situation is shown after a number of profiles has been measured.
- the redundancy of a profile increases as the number of times that the profile has been measured is larger.
- the redundancy strongly increases when the signal-to-noise ratio of a profile is very small in case P p has the same order of magnitude as P N .
- the spatial frequency plane k x k y is releated to an additional resonance signal when the values of R0(k y ) in the redundancy table are predetermined, i.e. before measurement of resonance signals in order to obtain an image.
- the additional resonance signal is obtained by applying a pulse and gradient sequence as described with reference to Fig. 2A, an rf pulse rf being applied to the object during the interval t0-t1 while at the same time a slice-selective gradient G z is applied, and by also applying a gradient G y during the measurement of a resonance signal e in the interval t2-t4, i.e.
- the additional profile is denoted by ep.
- R0(k y ) From the additional resonance signal and a model function of a signal power distribution P(k x ,k y ) of magnetic resonance data concerning the spatial frequency plane k x k y there is estimated R0(k y ).
- R0(k y ) When all values R0(k y ) have been inserted in the redundancy table, a profile distribution can be determined, in the same way as described with reference to Fig. 3B, in order to obtain resonance signals for an image. The estimation of R0(k y ) will be described hereinafter.
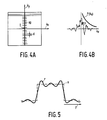
- Fig. 4B is a one-dimensional representation of a model function P(k x ) for a signal power distribution, and also shows a spread s in the mean signal power over comparable parts of comparable objects.
- the model function P(k x ) indicates that over different objects more spread exists for comparatively low k x values than for comparatively higher k x values.
- a model function P(k x ,k y ) for two dimensions will exhibit a similar tendency, i.e. P(k x ,k y ) will decrease isotropically from the origin 0 of the k x k y plane.
- the power -3/2 in P(k x ,k y ) can be theoretically derived or empirically determined.
- a constant C is estimated in P(k x ,k y ).
- the additional resonance signal is sampled so that the distance between two successive sampling values, in terms of spatial frequency, corresponds to a distance d between successive k y lines in the k x k y plane.
- the additional resonance signal offers an impression of the signal intensity over the k x k y plane.
- a profile distribution can be determined by means of the R0(k y ) found. Because the profile distribution is predetermined, an arbitrary succession can be selected for the measurement of profiles for an image on the basis of the profile distribution. The method can also be combined with profile schemes for reducing motion artefacts in an image of an object which moves during measurement.
- a profile scheme such as ROPE (Respiratory Ordered Phase Encoding) can be used for reducing motion artefacts due respiration of the object as described on pages 210-213 of said handbook "Practical NMR Imaging".
- a correction term can also be added to R0(k y ).
- R c exp(4 ⁇ 2 ⁇ 2k y 2/FOV2)-1, where FOV is a y dimension of the measured field (field of view), is a standard deviation of a y position of moving tissue, and exp is the exponential function when the entire object moves more or less to the same extent.
- R c f.(1-exp(-4 ⁇ 2 2k y 2/FOV2)) (for example, for the imaging of the spinal canal).
- R c SQRT(1+16 ⁇ 2 ⁇ M 2k y 2/FOV2)-1, where ⁇ M is the standard deviation of the y position of the tissue exhibiting the comparatively greatest motion, and SQRT is the square root when a continuous motion distribution exists from regions exhibiting hardly any motion to regions exhibiting strong motion.
- a signal which is a measure of object motion by respiration can be obtained by means of a respiration sensor.
- the respiration sensor can be coupled to the processing means 20, the sensor signal then being applied to the programmed arithmetic means 21.
- a respiration sensor is described per se, for example in United States Patent Specification No. 4,664,129.
- Fig. 5 shows an abrupt signal transition s in terms of y values, which transition causes ringing artefacts r in an image.
- the ringing artefacts r occur if given profiles have not been measured and are caused by the so-called Gibbs' phenomenon during Fourier transformation. It is proposed to estimate the non-measured profiles so that the resultant image resembles a likely image without artefacts as much as possible, that is to say an image obtained if the non-measured profiles had been measured. As a result, the image is split as if it were into a "likely" part (the part associated with the artefact-free image) and a "non-likely” part.
- an inverse Fourier transformation is performed on the likelihood function and the result thus obtained is divided by i.k y , which result is used for substituting the non measured profiles.
- a customary image reconstruction is performed.
- the procedure followed consists in that high frequency data are estimated from low frequency data, the likelihood of the resultant image being maximized.
- the likelihood is related to a histogram of image contrasts between successive pixels in the y direction.
- the histogram can be modelled by a Lorentz function which reflects the occurrence of flat image sections and edge contrasts.
- Said likelihood function can be optimized for the estimated high spatial frequencies in order to reduce ringing artefacts and to enhance edge contrasts.
- Fig. 6 illustrates the determination of a dimension a in the y direction of an object o in order to enable selection of an oversampling factor on the basis of the dimension a in the y direction (the direction of the phase encoding gradient G y ); this will be necessary to avoid backfolding if a selected FOV (field of view) is smaller than the dimension a of the measured object o.
- This problem is avoided by oversampling, being an increase of the profile density in the k y direction in the k x k y plane. For selective averaging it is attractive to define a comparatively small FOV and to leave it up to the device 1 whether to use the detailing which can thus be realized or not.
- Fig. 7 shows a second magnetic field gradient G x as a function of the time t, T M being the available measuring time and n being the number of sampling values of a resonance signal e measured in the measuring period T M . It is proposed to apply a non-constant gradient G x , simultaneously with non-equidistant sampling.
- k x gamma.G x .t
- the method described for 2D can be simply extended to 3D.
- the third field gradient G z should then also be varied.
- a minimum redundancy value R(k y ,k z ) is then determined.
- the two additional profiles are measured with G y and G z , respectively, as the measuring gradient, the other two gradients being deactivated.
- R0(k y ,k z ) is then ⁇ P N (k y 2+k z 2) 3/2 .n/f ⁇ /( ⁇ C/2).
- the method can be slightly adapted.
- a neighbouring profile R(k y +D) is estimated as max ⁇ R(k y + ⁇ ,R0 ⁇ , where D is a directional indicator +1 or -1 and ⁇ is a very small positive number, R ⁇ -(k y +D) ⁇ as R(k y +D)+2 ⁇ .
- D is determined as the sign of j0.
- the higher profiles are then filled with zeroes; however this causes said ringing artefacts in the vicinity of tissue edges.
- the noise may be white noise (the noise sampling values are non correlated) and may exhibit a uniform or a Gaussian distribution.
- the standard deviation of the noise can be determined from a profile without excitation.
- the profile distribution is aimed at obtaining a maximum amount of information in an image.
- the signal-to-noise ratio and the resolution are balanced. For practical reasons it may be desirable to emphasize either the signal-to-noise ratio or the resolution.
- the method can be executed using not only the described gradient echo pulse and gradient sequence, but also using many other described pulse and gradient sequences such as spin echo sequences with 180 o pulses and with stimulated echo sequences.
Landscapes
- Physics & Mathematics (AREA)
- Health & Medical Sciences (AREA)
- General Health & Medical Sciences (AREA)
- Nuclear Medicine, Radiotherapy & Molecular Imaging (AREA)
- Radiology & Medical Imaging (AREA)
- Engineering & Computer Science (AREA)
- Signal Processing (AREA)
- High Energy & Nuclear Physics (AREA)
- Condensed Matter Physics & Semiconductors (AREA)
- General Physics & Mathematics (AREA)
- Magnetic Resonance Imaging Apparatus (AREA)
Applications Claiming Priority (2)
| Application Number | Priority Date | Filing Date | Title |
|---|---|---|---|
| NL8801594A NL8801594A (nl) | 1988-06-23 | 1988-06-23 | Werkwijze en inrichting voor het bepalen van een spinresonantieverdeling. |
| NL8801594 | 1988-06-23 |
Publications (2)
| Publication Number | Publication Date |
|---|---|
| EP0347995A1 true EP0347995A1 (fr) | 1989-12-27 |
| EP0347995B1 EP0347995B1 (fr) | 1994-12-07 |
Family
ID=19852508
Family Applications (1)
| Application Number | Title | Priority Date | Filing Date |
|---|---|---|---|
| EP89201596A Expired - Lifetime EP0347995B1 (fr) | 1988-06-23 | 1989-06-19 | Procédé et dispositif pour déterminer une distribution de la résonance de spin |
Country Status (6)
| Country | Link |
|---|---|
| US (1) | US4998064A (fr) |
| EP (1) | EP0347995B1 (fr) |
| JP (1) | JPH0246829A (fr) |
| DE (1) | DE68919759T2 (fr) |
| IL (1) | IL90682A0 (fr) |
| NL (1) | NL8801594A (fr) |
Cited By (1)
| Publication number | Priority date | Publication date | Assignee | Title |
|---|---|---|---|---|
| EP1477824A2 (fr) | 2003-05-08 | 2004-11-17 | Kabushiki Kaisha Toshiba | Imagerie RM parallèle |
Families Citing this family (12)
| Publication number | Priority date | Publication date | Assignee | Title |
|---|---|---|---|---|
| US5233301A (en) * | 1989-07-28 | 1993-08-03 | Board Of Trustees Of The Leland Stanford Junior University | High resolution/reduced slice width magnetic resonance imaging and spectroscopy by signal combination and use of minimum phase excitation pulses |
| JP3146534B2 (ja) * | 1991-08-02 | 2001-03-19 | 株式会社日立製作所 | 核磁気共鳴装置 |
| US5196796A (en) * | 1991-08-06 | 1993-03-23 | Medrad, Inc. | Anatomically conformal quadrature mri surface coil |
| IL100530A (en) * | 1991-12-26 | 1996-05-14 | Elscint Ltd | Evolving image |
| JP3322688B2 (ja) * | 1992-04-23 | 2002-09-09 | 住友特殊金属株式会社 | 電子スピン共鳴装置 |
| US5912993A (en) * | 1993-06-08 | 1999-06-15 | Regents Of The University Of Calif. | Signal encoding and reconstruction using pixons |
| EP1157281A1 (fr) * | 1999-12-20 | 2001-11-28 | Koninklijke Philips Electronics N.V. | Appareil d'irm avec commande flexible de gradient |
| DE10015068C2 (de) * | 2000-03-25 | 2002-06-27 | Bruker Medical Gmbh | Verfahren zur Erzeugung von Bildern der magnetischen Resonanz |
| US7095183B2 (en) | 2004-07-07 | 2006-08-22 | Osram Sylvania Inc. | Control system for a resonant inverter with a self-oscillating driver |
| US7045966B2 (en) | 2004-07-07 | 2006-05-16 | Osram Sylvania Inc. | Resonant inverter including feed back circuit having phase compensator and controller |
| US7030570B2 (en) | 2004-07-07 | 2006-04-18 | Osram Sylvania Inc. | Resonant inverter including feed back circuit with source of variable bias current |
| US20110200243A1 (en) * | 2008-10-20 | 2011-08-18 | Hitachi Medical Corporation | Magnetic resonance imaging apparatus and method |
Citations (1)
| Publication number | Priority date | Publication date | Assignee | Title |
|---|---|---|---|---|
| DE3718344A1 (de) * | 1986-06-04 | 1987-12-10 | Hitachi Ltd | Abbildungsverfahren fuer magnetische kernresonanz |
Family Cites Families (3)
| Publication number | Priority date | Publication date | Assignee | Title |
|---|---|---|---|---|
| DE3542215A1 (de) * | 1985-11-29 | 1987-06-04 | Philips Patentverwaltung | Kernspintomographieverfahren und anordnung zur durchfuehrung des verfahrens |
| DE3543854A1 (de) * | 1985-12-12 | 1987-06-19 | Philips Patentverwaltung | Kernspintomographieverfahren und anordnung zur durchfuehrung des verfahrens |
| DE3701849A1 (de) * | 1987-01-23 | 1988-08-04 | Philips Patentverwaltung | Verfahren und vorrichtung fuer die kernspintomographie |
-
1988
- 1988-06-23 NL NL8801594A patent/NL8801594A/nl not_active Application Discontinuation
-
1989
- 1989-06-09 US US07/364,354 patent/US4998064A/en not_active Expired - Fee Related
- 1989-06-19 EP EP89201596A patent/EP0347995B1/fr not_active Expired - Lifetime
- 1989-06-19 DE DE68919759T patent/DE68919759T2/de not_active Expired - Fee Related
- 1989-06-20 IL IL90682A patent/IL90682A0/xx unknown
- 1989-06-20 JP JP1158122A patent/JPH0246829A/ja active Pending
Patent Citations (1)
| Publication number | Priority date | Publication date | Assignee | Title |
|---|---|---|---|---|
| DE3718344A1 (de) * | 1986-06-04 | 1987-12-10 | Hitachi Ltd | Abbildungsverfahren fuer magnetische kernresonanz |
Non-Patent Citations (3)
| Title |
|---|
| MAGNETIC RESONANCE IN MEDICINE, vol. 4, 1987, pages 78-82, Academic Press, Inc.; B.C. DE SIMONE et al.: "Maximum entropy method in phase-encoding NMR imaging" * |
| MEDICAL PHYSICS, vol. 14, no. 4, July/August 1987, page 710, abstract no. WP3-6; R.T. CONSTABLE et al.: "Maximum entropy reconstruction in MRI" * |
| SIXTH ANNUAL MEETING OF THE SOCIETY FOR MAGNETIC RESONANCE IMAGING, February 1988, & MAGNETIC RESONANCE IMAGING, vol. 6, supplement 1, 1988, page 19, abstract no. P37, Pergamon Press, New York, US; M. FUDERER: "Ringing artefact reduction by an efficient likelihood improvement method" * |
Cited By (7)
| Publication number | Priority date | Publication date | Assignee | Title |
|---|---|---|---|---|
| EP1477824A2 (fr) | 2003-05-08 | 2004-11-17 | Kabushiki Kaisha Toshiba | Imagerie RM parallèle |
| EP1477824A3 (fr) * | 2003-05-08 | 2005-08-24 | Kabushiki Kaisha Toshiba | Imagerie RM parallèle |
| US7102351B2 (en) | 2003-05-08 | 2006-09-05 | Kabushiki Kaisha Toshiba | Parallel imaging based on expanded unfolding technique |
| US7205765B2 (en) | 2003-05-08 | 2007-04-17 | Kabushiki Kaisha Toshiba | Parallel imaging based on expanded unfolding technique |
| CN100339048C (zh) * | 2003-05-08 | 2007-09-26 | 株式会社东芝 | 基于扩大展开法的平行成像 |
| CN101017198B (zh) * | 2003-05-08 | 2010-05-19 | 株式会社东芝 | 基于扩大展开法的平行成像 |
| EP2541271A1 (fr) * | 2003-05-08 | 2013-01-02 | Kabushiki Kaisha Toshiba | Imagerie RM parallèle |
Also Published As
| Publication number | Publication date |
|---|---|
| DE68919759D1 (de) | 1995-01-19 |
| DE68919759T2 (de) | 1995-06-29 |
| NL8801594A (nl) | 1990-01-16 |
| JPH0246829A (ja) | 1990-02-16 |
| US4998064A (en) | 1991-03-05 |
| IL90682A0 (en) | 1990-01-18 |
| EP0347995B1 (fr) | 1994-12-07 |
Similar Documents
| Publication | Publication Date | Title |
|---|---|---|
| US7005853B2 (en) | Prior-information-enhanced dynamic magnetic resonance imaging | |
| EP0445151B1 (fr) | Artefacts de reduction de mouvement dans des images de resonance magnetique nucleaire (nmr) | |
| EP0543468B1 (fr) | Procédé de résonance magnétique | |
| CN102866371B (zh) | 磁场不敏感的化学交换饱和转移成像 | |
| EP0490528A1 (fr) | Correction de résultats de mesure dans le domaine de la résonance magnétique nucléaire acquis par une technique du type echo-planar | |
| EP3080634B1 (fr) | Imagerie par résonance magnétique de temps d'écho nul avec séparation des graisses/de l'eau | |
| EP0492706B1 (fr) | Imagerie par résonance magnétique et dispositif pour réduire les défauts d'image dans une image de résonance magnétique | |
| US5534777A (en) | Method and apparatus for magnetic resonance imaging by radially scanning through frequency space and employing a correction image derived from an edge image | |
| EP0347995B1 (fr) | Procédé et dispositif pour déterminer une distribution de la résonance de spin | |
| US7418287B2 (en) | Magnetic resonance imaging method with accelerated data acquisition | |
| EP3191862B1 (fr) | Imagerie par résonance magnétique à temps d'écho nul | |
| JPH06500947A (ja) | Nmrシステム及び別々に収集された1組のnmr信号から像を発生する方法 | |
| US6294913B1 (en) | Compensation of variations in polarizing magnetic field during magnetic resonance imaging | |
| EP3803426B1 (fr) | Imagerie par résonance magnétique de temps d'écho nul comportant une séparation des graisses/de l'eau | |
| CN107810425A (zh) | 消除非t2加权信号贡献的t2加权mr成像 | |
| CN116940856A (zh) | 狄克逊型水/脂肪分离mr成像 | |
| EP0497402B1 (fr) | Procédé et dispositif de résonance magnétique pour réduire des défauts d'image dans une image de résonance magnétique | |
| US5093621A (en) | Mri apparatus having an optimally adjusted detection chain and an enlarged dynamic range | |
| US7215190B2 (en) | Magnetic resonance imaging method involving sub-sampling | |
| US7176686B2 (en) | Parallel MR imaging method | |
| JP2022521277A (ja) | ウェーブ符号化を用いたパラレルmrイメージング | |
| JPH038215B2 (fr) | ||
| JPH06133944A (ja) | Mrイメージング装置 | |
| JPH0712352B2 (ja) | Nmrを用いた検査装置における像再生方法 |
Legal Events
| Date | Code | Title | Description |
|---|---|---|---|
| PUAI | Public reference made under article 153(3) epc to a published international application that has entered the european phase |
Free format text: ORIGINAL CODE: 0009012 |
|
| AK | Designated contracting states |
Kind code of ref document: A1 Designated state(s): CH DE FR GB IT LI NL SE |
|
| 17P | Request for examination filed |
Effective date: 19900618 |
|
| 17Q | First examination report despatched |
Effective date: 19930209 |
|
| GRAA | (expected) grant |
Free format text: ORIGINAL CODE: 0009210 |
|
| AK | Designated contracting states |
Kind code of ref document: B1 Designated state(s): CH DE FR GB IT LI NL SE |
|
| PG25 | Lapsed in a contracting state [announced via postgrant information from national office to epo] |
Ref country code: IT Free format text: LAPSE BECAUSE OF FAILURE TO SUBMIT A TRANSLATION OF THE DESCRIPTION OR TO PAY THE FEE WITHIN THE PRESCRIBED TIME-LIMIT;WARNING: LAPSES OF ITALIAN PATENTS WITH EFFECTIVE DATE BEFORE 2007 MAY HAVE OCCURRED AT ANY TIME BEFORE 2007. THE CORRECT EFFECTIVE DATE MAY BE DIFFERENT FROM THE ONE RECORDED. Effective date: 19941207 Ref country code: NL Effective date: 19941207 Ref country code: LI Effective date: 19941207 Ref country code: CH Effective date: 19941207 |
|
| REF | Corresponds to: |
Ref document number: 68919759 Country of ref document: DE Date of ref document: 19950119 |
|
| PG25 | Lapsed in a contracting state [announced via postgrant information from national office to epo] |
Ref country code: SE Effective date: 19950307 |
|
| REG | Reference to a national code |
Ref country code: CH Ref legal event code: PL |
|
| ET | Fr: translation filed | ||
| NLV1 | Nl: lapsed or annulled due to failure to fulfill the requirements of art. 29p and 29m of the patents act | ||
| PGFP | Annual fee paid to national office [announced via postgrant information from national office to epo] |
Ref country code: GB Payment date: 19950531 Year of fee payment: 7 |
|
| REG | Reference to a national code |
Ref country code: FR Ref legal event code: CD |
|
| PGFP | Annual fee paid to national office [announced via postgrant information from national office to epo] |
Ref country code: FR Payment date: 19950628 Year of fee payment: 7 |
|
| PGFP | Annual fee paid to national office [announced via postgrant information from national office to epo] |
Ref country code: DE Payment date: 19950822 Year of fee payment: 7 |
|
| PLBE | No opposition filed within time limit |
Free format text: ORIGINAL CODE: 0009261 |
|
| STAA | Information on the status of an ep patent application or granted ep patent |
Free format text: STATUS: NO OPPOSITION FILED WITHIN TIME LIMIT |
|
| 26N | No opposition filed | ||
| PG25 | Lapsed in a contracting state [announced via postgrant information from national office to epo] |
Ref country code: GB Effective date: 19960619 |
|
| GBPC | Gb: european patent ceased through non-payment of renewal fee |
Effective date: 19960619 |
|
| PG25 | Lapsed in a contracting state [announced via postgrant information from national office to epo] |
Ref country code: FR Effective date: 19970228 |
|
| PG25 | Lapsed in a contracting state [announced via postgrant information from national office to epo] |
Ref country code: DE Effective date: 19970301 |
|
| REG | Reference to a national code |
Ref country code: FR Ref legal event code: ST |