EP0430088A2 - Méthode d'ajustement in vivo du champ - Google Patents
Méthode d'ajustement in vivo du champ Download PDFInfo
- Publication number
- EP0430088A2 EP0430088A2 EP90122354A EP90122354A EP0430088A2 EP 0430088 A2 EP0430088 A2 EP 0430088A2 EP 90122354 A EP90122354 A EP 90122354A EP 90122354 A EP90122354 A EP 90122354A EP 0430088 A2 EP0430088 A2 EP 0430088A2
- Authority
- EP
- European Patent Office
- Prior art keywords
- inhomogeneity
- image
- weighting function
- pixel
- magnetic field
- Prior art date
- Legal status (The legal status is an assumption and is not a legal conclusion. Google has not performed a legal analysis and makes no representation as to the accuracy of the status listed.)
- Withdrawn
Links
Images

Classifications
-
- G—PHYSICS
- G01—MEASURING; TESTING
- G01R—MEASURING ELECTRIC VARIABLES; MEASURING MAGNETIC VARIABLES
- G01R33/00—Arrangements or instruments for measuring magnetic variables
- G01R33/20—Arrangements or instruments for measuring magnetic variables involving magnetic resonance
- G01R33/28—Details of apparatus provided for in groups G01R33/44 - G01R33/64
- G01R33/38—Systems for generation, homogenisation or stabilisation of the main or gradient magnetic field
- G01R33/387—Compensation of inhomogeneities
- G01R33/3875—Compensation of inhomogeneities using correction coil assemblies, e.g. active shimming
-
- G—PHYSICS
- G01—MEASURING; TESTING
- G01R—MEASURING ELECTRIC VARIABLES; MEASURING MAGNETIC VARIABLES
- G01R33/00—Arrangements or instruments for measuring magnetic variables
- G01R33/20—Arrangements or instruments for measuring magnetic variables involving magnetic resonance
- G01R33/24—Arrangements or instruments for measuring magnetic variables involving magnetic resonance for measuring direction or magnitude of magnetic fields or magnetic flux
Definitions
- This invention relates to nuclear magnetic resonance (NMR) imaging methods and apparatus and more particularly to a method of shimming the magnets used with such apparatus.
- NMR nuclear magnetic resonance
- a uniform magnetic field Bo is applied to an imaged object along the z axis of a spatial Cartesian reference frame.
- the effect of the magnetic field Bo is to align some of the object's nuclear spins along the z axis.
- the nuclei resonate at their Larmor frequencies according to the following equation:
- a spatial z axis magnetic field gradient (G z ) is applied at the time of a shaped RF pulse such that only the nuclei in a slice through the object in a planar slab orthogonal to the z-axis are excited into resonance.
- Spatial information is encoded in the resonance of these excited nuclei by applying the slice selective gradient pulse G z , applying a phase encoding gradient (Gy) along the y axis and then acquiring a NMR signal in the presence of a magnetic field gradient (G x ) in the x direction.
- the magnitude of the phase encoding gradient pulse Gy is incremented monotonically between the acquisitions of each NMR signal to produce a view set of NMR data from which a slice image may be reconstructed.
- An NMR pulse sequence is described in the article entitled: "Spin Warp NMR Imaging and Applications to Human Whole Body Imaging” by W. A. Edelstein et al., Physics in Medicine and Biology, Vol. 25 pp. 751-756 (1980).
- lipids Materials other than water, principally lipids, may also be found in biological tissue.
- the protons of lipids have a slightly different gyromagnetic ratio; the lipid frequency is approximately 220 Hz lower than that of water protons in a 1.5 Tesla polarizing magnetic field Bo.
- the difference between the Larmor frequencies of such different substances, under an identical magnetic polarizing field, is termed "chemical shift".
- the polarizing magnetic field Bo may be produced by a number of types of magnets including: permanent magnets, resistive electromagnets and superconducting magnets.
- the latter, superconducting magnets are particularly desirable because strong magnetic fields may be maintained without expending large amounts of energy.
- the magnetic field Bo is maintained within a cylindrical magnet bore tube whose axis is aligned with the z-axis referred to above.
- NMR imaging techniques The accuracy of the image formed by NMR imaging techniques is highly dependant of the uniformity of this polarizing magnetic field Bo.
- Most standard NMR imaging techniques require a field homogeneity better than ⁇ 4 ppm ( ⁇ )250Hz at 1.5 Tesla) over the volume of interest, located within the magnet bore.
- Some chemical shift selective imaging techniques require much better homogeneity (less than 1 ppm).
- In-vivo spectroscopy of carbon ( 13 C ) phosphorous (31P ), and hydrogen ('H ) place more severe requirements on the measurements and correction of the inhomogeneity.
- the homogeneity of the polarizing magnetic field Bo may be improved by shim coils, as are known in the art.
- Such coils may be axis-symmetric with the z or bore axis, or transverse to the z or bore axis.
- the axis-symmetric coils are generally wound around a coil form coaxial with the magnet bore tube while the transverse coils are generally disposed in a so-called saddle shape on the surface of a coil form.
- Each such shim coils may be designed to produce a magnetic field corresponding to one spherical harmonic of the magnetic field Bo.
- the shim coils of different order spherical harmonics may correct a variety of inhomogeneities.
- the lowest order shim coils are those which produce a linear gradient along one axis of the spatial reference frame.
- Correction of the inhomogeneity of the polarizing field Bo involves adjustment of the individual shim coil currents so that the combined fields of the shim coils just balance any variation in the polarizing field Bo to eliminate the inhomogeneity. This procedure is often referred to as shimming.
- a dummy or "phantom" of uniform composition is placed in the magnet bore and the inhomogeneities are deduced from the NMR signals acquired of the phantom.
- the Larmor frequency of the nuclei of the phantom will vary depending on the total field strength Bo according to equation 1 above.
- the line width of the NMR signal from the phantom will indicate the overall variation in the strength of Bo throughout the volume of the phantom. Shimming may then be accomplished by iterative techniques that minimize this spectral width. Such techniques are, of course, limited by problems of local minima and by the time required to perform the iterations.
- a phantom containing a uniform material (water) is used to make magnetic field measurements at specific locations ("voxels") within the phantom.
- These measurements are expanded mathematically to provide a map of the inhomogeneities over a volume within the phantom.
- a proton spectrum must be obtained at each voxel and the position of the resonance line must be determined.
- this method is time consuming both in the collection and analyses of data, and therefore, typically only a limited amount of data is acquired. Further, the method assumes that only one proton species is present and hence requires a phantom of single composition.
- the present invention relates to methods and apparatus for measuring the inhomogeneities of a polarizing magnetic field B o while the imaged object, typically a patient, is positioned in the magnet bore.
- Such in-vivo shimming allows magnetic fields to be corrected to a much higher level of homogeneity.
- the key to the in vivo shimming is the adjustment of the phase evolution time of a phase sensitive imaging sequence so that different proton species, principally fat and water of the imaged object, remain in phase despite the chemical shift.
- the map of magnetic field inhomogeneity produced by the present invention derives from measurements of phase of the NMR signal at each voxel, and therefore contains discontinuities as a result of the limited range of the arctangent function. These discontinuities are detected by examining the derivative of the inhomogeneity map, where the discontinuities appear as "spikes". A discontinuity weighting function is used to eliminate these spikes.
- a low-order function is fit to the map of magnetic field inhomogeneity and used to derive correction gradients to reduce the inhomogeneities.
- higher order inhomogeneities degrade the shimming process. Therefore steps are taken to eliminate the effect of such higher order inhomogeneities on the shimming process.
- a first and second NMR view set is acquired of the imaged object.
- the phase evolution times t E1 and t E2 of the pulse sequences used to acquire the first and second NMR view sets, respectively, are selected such that where &j i and Q)2 are the Larmor frequencies of the dominant proton species of the imaged object.
- the view sets are reconstructed into a first and second image and a ratio is taken of the corresponding pixels of the resultant first and second images.
- the phase angle of the divided images will be related to the strength of the magnetic field at the voxels in the imaged object associated with the pixels of the combined image.
- In-vivo measurement of inhomogeneities may be used to correct for both structural inhomogeneities, resulting from the geometry of the magnet, and local field distortions resulting from the imaged object itself.
- the phase variations in an NMR image resulting from inhomogeneity of Bo are obscured by phase variations resulting from chemical shift effects produced by the multiple proton species in the imaged object.
- the selection of the evolution times as described and the subsequent dividing of the two image sets by one another reduces these chemical shift induced phase variations permitting accurate measurement of the phase shifts resulting only from magnetic field inhomogeneities. These latter phase shifts provide an in-vivo map of magnet field B o inhomogeneity.
- NMR view sets required for the above method may be acquired by means of a gradient recalled echo sequence which permits rapid acquisitions of each view set.
- the map of magnetic field inhomogeneities deduced from the phase of the processed NMR image, contains discontinuities every 2 1T radians.
- the partial derivative of this deduced inhomogeneity map is taken along an axis.
- a discontinuity weighting function is then derived that assigns zero weight to points of discontinuity of the differentiated inhomogeneity map.
- the above described weighting process removes discontinuities from the weighting process.
- an amplitude weighting function can be constructed from the corresponding magnitude image. This weighting function may be used to modify the curve fitting such that points of low intensity in the magnitude image have decreased importance in the fitting process. A weighted fit using this amplitude weighting function is then performed on the product of the differentiated inhomogeneity map and the discontinuity weighting function to produce a corrected inhomogeneity map. The gradients of the shimming coils are then adjusted to produce this corrected inhomogeneity map.
- the magnetic inhomogeneity map may be modeled as a combination of a low order inhomogeneity terms and and higher order inhomogeneity terms. If the higher order terms are not centered in the region of interest they may adversely affect the curve fitting of the lower order shimming gradients to the inhomogeneity map.
- the location of an off-center higher order inhomogeneities are estimated from the inhomogeneity map. The fit of a low order gradients to the inhomogeneity map is then corrected to remove the influence of the off-center higher order inhomogeneities on the shimming process.
- FIG. 1 is a block diagram of an NMR imaging system of a type suitable for the practice of the invention. It should be recognized, however, that the claimed invention may be practiced on any suitable apparatus.
- a computer 10 controls a pulse control module 12 which in turn controls gradient coil power amplifiers 14.
- the pulse control module 12 and the gradient amplifiers 14 together produce the proper gradient waveforms G x , Gy, and G z , as will be described below, for a gradient echo pulse sequence.
- the gradient waveforms are connected to gradient coils 16 which are positioned around the bore of the magnet 34 so that gradients G x , Gy, and G z are impressed along their respective axes on the polarizing magnetic field Bo from magnet 34.
- the pulse control module 12 also controls a radio frequency synthesizer 18 which is part of an RF transceiver system, portions of which are enclosed by dashed line block 36.
- the pulse control module 12 also controls a RF modulator 20 which modulates the output of the radio frequency synthesizer 18.
- the resultant RF signals amplified by power amplifier 22 and applied to RF coil 26 through transmit/receive switch 24, are used to excite the nuclear spins of the imaged object (not shown).
- the NMR signals from the excited nuclei of the imaged object are picked up by the RF coil 26 and presented to preamplifier 28 through transmit/receive switch 24, to be amplified and then processed by a quadrature phase detector 30.
- the detected signals are digitized by an high speed A/D converter 32 and passed to computer 10 for processing to produce NMR images of the object.
- the computer 10 also controls a series of shimming coil power supplies 38 which provide current to shimming coils 40.
- Each shimming coil may generate magnetic field aligned with Bo with variations in intensity along chosen axes.
- the first order shimming fields are typically produced by the gradient coils 16, with higher order shimming gradients produced by the shimming coils 40.
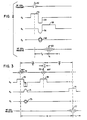
- a gradient echo pulse of a first embodiment sequence begins with the transmission of a narrow bandwidth radio frequency (RF) pulse 50 in the presence of slice selection G z pulse 52.
- the energy and the phase of this initial RF pulse may be controlled such that at its termination the magnetic moments of the individual nuclei are located in the x-y plane of a rotating reference frame of the nuclear spin system.
- a pulse of such energy and duration is termed a 90 RF pulse.
- the rotating frame differs from the previously described spatial reference frame in that the rotating frame rotates about the z-axis at a frequency «o equal to the Larmor frequency of the dominant proton species without any gradient fields.
- the result of the combined RF signal and gradient pulse 52 is that the nuclear spins of a narrow slice in the three dimensional imaged object along spatial z-plane are excited. Only those spins with a Larmor frequency, under the combined field G z and B o , within the frequency bandwidth of the RF pulse will be excited. Hence the position of the slice may be controlled by the gradient G z intensity and the RF frequency.
- the negative G z rewinder gradient pulse 54 serves to rephase the nuclear spins in the x-y plane of the rotating frame. Rewinder pulse 54 therefore is approximately equal to half the area of that portion of slice select gradient 52 which occurs during the RF pulse 50.
- the G x prewinder pulse 56 is applied.
- the prewinder pulse 56 begins to dephase the precessing nuclei: those nuclei at higher spatial locations within the slice advance in phase faster as a result of the G x- induced higher Larmor frequency than those nuclei at lower spatial locations.
- a positive G x readout pulse 58 causes the dephased spins to rephase into a gradient echo or NMR signal 60 at or near the center of the read-out pulse 58.
- the gradient echo 60 is the NMR signal for one view.
- a gradient pulse Gy 62 is applied to phase encode the spins along the y axis during the prewinder gradient 56.
- the sequence is then repeated with different Gy gradients, as is understood in the art, to acquire an NMR view set from which a tomographic image of the imaged object may be reconstructed according to conventional reconstruction techniques.
- a spin echo pulse sequence is used.
- the spin echo sequence begins with the transmission of a narrow bandwidth 90° radio frequency (RF) pulse 70 in the presence of slice selection G z pulse 74.
- RF radio frequency
- the position of the slice may be controlled by the gradient G z intensity and the RF frequency.
- the negative G z rewinder gradient pulse 76 serves to rephase the nuclear spins in the x-y plane of the rotating frame.
- Rewinder pulse 74 is equal to half the area of that portion of slice select gradient 74 which occurs after during the RF pulse 70.
- a G x prewinder pulse 71 is applied and a gradient pulse Gy 73 is applied to phase encode the spins along the y axis as described above for the gradient echo pulse sequence.
- a second G z slice selection gradient 78 is centered at a time (T E /2)- ⁇ /2 after the 90° RF pulse 70 and during this slice selection gradient 78 a narrow bandwidth 180 RF pulse, also centered at a time (T E /2)- T /2, is transmitted.
- This 180° pulse serves to reverse the phase evolution of the spins and to produce a spin echo 77 T E after the 90 RF pulse 70.
- the timing of the 180° RF pulse may be adjusted to be r/2 before the center of the slice selection gradient 78 and hence at time (T E- ⁇ )/2.
- the spin echo 77 occurs during a G x read-out pulse 75 and forms the NMR signal for one view.
- the NMR signal 60 or 77 of either of these embodiments is the sum of the component signals from many precessing nuclei throughout the excited slice.
- the phase of each component signal will be determined by the strength of the G z , G x and Gy gradients at the location of the individual nuclei during the read out pulse 58, and hence by the the spatial z-axis, x-axis and y-axis locations of the nuclei. In practice, however, numerous other factors affect the phase of the NMR signal 60.
- NMR signal 60 may be then represented as follows: where p(x) is the spin density, i.e. the number of nuclei at a given voxel in the x direction; y is the gyromagnetic constant of the nuclei of the material being imaged; Bo is the strength of the polarizing magnetic field; G x is the slope of the x axis gradient and t E is the phase evolution time to be defined below.
- the first complex term of this integral represents the effect of the readout gradient 58 or 75 G x on the NMR signal S(t).
- the gradient prewinders 56 or 71 cause this effect to be referenced not from the start of the gradient pulse G x but from to as shown in Figure 2 and 3.
- the second complex term of this equation e i ⁇ B O( t E+ 1 ), represents the effect of the polarizing field B o on the NMR signal S(t).
- Bo is continuously present and hence, in the gradient echo pulse sequence, the effect of Bo on S(t) is measured from the instant of occurrence of the RF pulse 50.
- the time elapsed since the RF pulse 50, in the gradient echo pulse sequence is TE + t as shown in Figure 2.
- the 180 RF pulse 72 reverses the phase evolution and therefore the cancels some of the effect of Bo on the phase of S(t).
- the effective time elapsed since the RF pulse 70, in the spin echo pulse sequence is T .
- Equation (3) addresses both of these pulse sequences: gradient echo and spin echo, through the use of the term t E defined as the phase evolution time.
- t E is equal to T E .
- t E is equal to T .
- the third complex term of this equation arises from inhomogeneities in the magnetic field B o .
- These inhomogeneities are generally spatially variable and may be derived from the second complex term of equation (2).
- e i ⁇ B O( t E + t ) becomes e i ⁇ (B O + ⁇ B(x)) ( t E + t ) where AB(x) is the inhomogeneity of B o and generally a function of x.
- the phase error of such inhomogeneities in B o increases for increasing phase evolution time and hence this term is a function of t E +t, for the same reasons as those described above for the second complex term of equation (2) .
- the fourth complex term of this equation, e i ⁇ collects phase lags or leads resulting from the signal processing of the NMR signal chain.
- the RF coil structure 26, shown in Figure 1 may introduce certain phase distortions as may the RF power amplifier 22 and the preamplifier 28. These phase terms may also vary with x and are represented by the term ei ⁇ .
- This equation (2) may be simplified by recognizing that the NMR signal is typically hetrodyned or shifted in frequency to remove the base frequency of water polarized by the magnetic field Bo. This frequency shift transformation is accomplished by multiplying S(t) by e -i ⁇ B O( t E +t ) producing the signal S'(t):
- Equation (3) becomes more complex if the imaged object contains more than one proton species, as in the case of most biological tissue, each proton species having a different resonance offset due to chemical shift.
- the two dominant proton species in biological tissue are those associated with water and lipid.
- p 2 be the spin density function of lipid protons with resonant frequency ⁇ 1
- ⁇ F ⁇ 1 - ⁇ 2 be the chemical shift or resonant offset of lipid protons with respect to water protons. Equation (3) then becomes: representing the signals from both proton species.
- the new complex term, e i ⁇ F ( t E +t ) represents a phase offset resulting from the chemical shift which is predominantly a function of Bo and hence proportional to the evolution time t E+t as has been discussed above.
- the reconstruction is performed by performing the reverse Fourier transform upon S'(t) to derive a complex, multipixel image P(x)':
- the pixels of the image P(x)' are displaced from their true positions x by the terms used in the substitution given in equations (5) and (6), however these displacements may be ignored if the displacement is on the order of one pixel.
- a displacement of less than one pixel will result if the inhomogeneity ⁇ B of the magnetic field B o is small relative to the gradient strength G x .
- ⁇ (x)/ ⁇ G x ⁇ (x))/ ⁇ G x ) x ⁇ o ⁇ ⁇ ⁇ ⁇ ⁇ F/ ⁇ 2G x + ⁇ B(x)/G x n ⁇ G x is then approximately 1.7 and may be ignored in areas of the imaged object where there there is little change from pixel to pixel.
- the curve fitting process will tend to further decrease error resulting from occasional deviations from these assumptions.
- equation (8) becomes:
- a third image P 3 may be produced by dividing image P 2 by Pi, on a pixel by pixel basis, such that
- pa is an image whose argument A ⁇ , (the angle of the complex number e i ⁇ (x) ⁇ is proportional to the inhomogeneity ⁇ (x).
- the inhomogeneity ⁇ (x) may be calculated at any point x by dividing A ⁇ (x), the argument of P 3 (x) at the pixel associated with x, by T .
- T will be about 4.5 ms. so as to produce the desired phase shift.
- any multiple of T which produces an integer multiple of 2 7T will also work.
- the two signals P 1 and P 2 of equations (10) and (11) above provide a method of eliminating the influence of different proton species on the above described inhomogeneity measurement process and hence permit in-vivo shimming on an imaged object with more than one proton species. It will be apparent from this discussion, however that the above described technique may also be used on a imaged object with only a single proton species, for example on a phantom. In this case, the value of T is not critical, as there is no need to cancel the effects of two proton species, however two signals P 1 and P 2 are still acquired and the division of equation (12) performed to eliminate the e i ⁇ term of equation (9).
- the argument A ⁇ (x) of the complex image P 3 divided by T yields a map of the inhomogeneity Q(x) over the image P a' s surface.
- the complex array P 3 is represented digitally within the NMR system by means of two quadrature arrays indicating the magnitudes of sine and cosine terms of P 3 respectively.
- the argument or phase angle of P 3 may be extracted by application of the arctangent function to the ratio of these quadrature arrays.
- the arctangent function has a range of - ⁇ to + ⁇ and therefore the argument of A ⁇ (x) will be limited to values within this range.
- the inhomogeneity ⁇ is equal to the argument ⁇ divided by r.
- the deduced inhomogeneity value Q' will be restricted to the range - ⁇ l ⁇ to + ⁇ / ⁇ or - ⁇ V F to + ⁇ V F where V F is the chemical shift frequency ⁇ F /2 ⁇ .
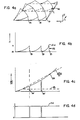
- FIG. 4(a) an example map of deduced inhomogeneity ⁇ '(x,y) 80 over a two dimensional image P 3 (X,Y) is shown with Q'(x,y) plotted in the vertical dimension.
- the actual inhomogeneity Q(x,y) increases monotonically over the surface P a , however, as explained, the deduced inhomogeneity Q' (x,y) is bounded between the arctangent imposed limits of - ⁇ V F to + ⁇ V F . Accordingly, discontinuities 81 occur at the points where the arctangent function is discontinuous at ⁇ and - 7T .
- the actual inhomogeneity ⁇ (x,y) may be determined by by "unwrapping" the discontinuities, a complex topological problem that requires tallying the discontinuities as one moves over the surface of the P 3 (x,y) argument array 80 and adding or subtracting 2 ⁇ to the deduced inhomogeneity ⁇ ' as each discontinuity 81 is passed.
- this difficult tallying procedure is avoided by taking the spatial partial derivatives of the deduced inhomogeneity map 80.
- a first partial derivative, ⁇ '/ ⁇ x, along line 82 is shown in Figure 4(c).
- the partial derivative exhibits "spikes" 81' at the points of discontinuity 81 in Figure 3(b). These points of discontinuity may be readily detected by comparing curve 84 to a threshold value 85 and creating a weighting function T(x), as shown in Figure 4(c), whose value is zero when the magnitude of curve 84 is greater than the threshold value 85 and one otherwise.
- the threshold is preferably set to ⁇ V F /4 although other values may be used.
- a shimming gradient may be fit to this weighted curve 84 according to standard methods, however it is preferable that the gradient curve be fitted instead to: which effectively averages the spatial x-axis inhomogeneities together along the y-axis.
- the curve fitting process may be the least square method or other methods known in the art.
- shim correction gradient values for the shim coils of the y axis may be determined by a similar procedure applied along the y axis.
- an amplitude weighting function W(x,y) is also constructed such that the amplitude weighting function W(x,y) equals zero when the magnitude of image value P 3 is less than a second threshold value and one otherwise.
- the second threshold is set to 15% of the maximum signal magnitude within the area of the image under consideration, although other values could be selected depending on the signal to noise ratio of the image.
- the amplitude weighting function is used to diminish the importance during curve fitting of portions of curve 84 in which there is little signal strength, as indicated by the magnitude of P 3 , and hence serves to reduce the effect of noise on the subsequent curve fitting. Therefore, as will be apparent to one of ordinary skill in the art, the weighting function W(x) may be implemented in numerous other ways. For example, W(x) may be a continuous function of the magnitude of the image or the power of the image (P) 2 . With the amplitude weighting function equation (15) becomes:
- weighted inhomogeneity map f(x) may be modeled as a second order polynomial: where xo is the displacement of the imaged object, hence the displacement of the quadratic inhomogeneities from the center of the region of interest, then:
- steps are taken to eliminate the effect of an off-center quadratic term on the shimming process.
- a first order polynomial ⁇ 2 x + ⁇ 1 is fit to the derivative of the weighted inhomogeneity map f x (x) of equations 15 or 16 by a standard least squares method or other methods as known in the art.
- the linear coefficient Cl1 and the quadratic coefficient a 2 of the polynomial will correspond to the components of the differentiated, weighted inhomogeneity function f(x) modeled in equation 18, that is:
- the axis of symmetry of the imaged object, and hence the center, xo, of the quadratic term is next determined by calculating the center of mass of the imaged object from the image p(x,y). Specifically:
- the x axis shim gradient is adjusted to this term a 1 which corresponds to the linear part of the weighted inhomogeneity function f(x) as modeled by equation 17.
- this procedure may be applied also to the other shim axes.
- the same procedure may also be applied to compensate for the effect of higher order off-center inhomogeneities to the extent that that the center of the inhomogeneities may be determined. It is believed that the center of mass of the imaged object may be used to approximate the center of higher order inhomogeneities to the extent required to make the relatively small correction indicated by equation 20.
Landscapes
- Physics & Mathematics (AREA)
- Condensed Matter Physics & Semiconductors (AREA)
- General Physics & Mathematics (AREA)
- Magnetic Resonance Imaging Apparatus (AREA)
Applications Claiming Priority (2)
| Application Number | Priority Date | Filing Date | Title |
|---|---|---|---|
| US441850 | 1989-11-27 | ||
| US07/441,850 US4987371A (en) | 1989-11-27 | 1989-11-27 | Method for in-vivo shimming |
Publications (2)
| Publication Number | Publication Date |
|---|---|
| EP0430088A2 true EP0430088A2 (fr) | 1991-06-05 |
| EP0430088A3 EP0430088A3 (en) | 1991-11-06 |
Family
ID=23754547
Family Applications (1)
| Application Number | Title | Priority Date | Filing Date |
|---|---|---|---|
| EP19900122354 Withdrawn EP0430088A3 (en) | 1989-11-27 | 1990-11-23 | Method for in-vivo shimming |
Country Status (3)
| Country | Link |
|---|---|
| US (1) | US4987371A (fr) |
| EP (1) | EP0430088A3 (fr) |
| JP (1) | JPH0644904B2 (fr) |
Cited By (4)
| Publication number | Priority date | Publication date | Assignee | Title |
|---|---|---|---|---|
| EP0465139A3 (en) * | 1990-06-29 | 1992-08-05 | General Electric Company | Shimming magnets in nmr systems |
| EP0470845A3 (en) * | 1990-08-10 | 1992-08-19 | General Electric Company | Nmr imaging of chemical species |
| US5321359A (en) * | 1993-03-29 | 1994-06-14 | General Electric Company | Selective imaging among three or more chemical species |
| US11774530B2 (en) | 2022-01-28 | 2023-10-03 | Canon Medical Systems Corporation | System and method for robust shimming for magnetic resonance imaging |
Families Citing this family (23)
| Publication number | Priority date | Publication date | Assignee | Title |
|---|---|---|---|---|
| JPH03103236A (ja) * | 1989-09-18 | 1991-04-30 | Hitachi Ltd | 核磁気共鳴マルチエコー撮影方法 |
| DE3937150A1 (de) * | 1989-11-08 | 1991-05-23 | Bruker Analytische Messtechnik | Kernresonanzspektrometer |
| US5371465A (en) * | 1991-03-13 | 1994-12-06 | Hitachi, Ltd. | Inspection method and apparatus using nuclear magnetic resonance (NMR) |
| US5218299A (en) * | 1991-03-25 | 1993-06-08 | Reinhard Dunkel | Method for correcting spectral and imaging data and for using such corrected data in magnet shimming |
| US5202631A (en) * | 1991-08-09 | 1993-04-13 | Steven E. Harms | Magnetic resonance imaging techniques utilizing multiple shaped radiofrequency pulse sequences |
| US5304931A (en) * | 1991-08-09 | 1994-04-19 | Flamig Duane P | Magnetic resonance imaging techniques |
| DE69225564T2 (de) * | 1991-11-29 | 1998-11-26 | Philips Electronics N.V., Eindhoven | Magnetische Resonanzanordnung |
| US5345178A (en) * | 1992-04-21 | 1994-09-06 | Siemens Aktiengesellschaft | Method for setting the current through shim coils and gradient coils in a nuclear magnetic resonance apparatus |
| FR2693802B1 (fr) * | 1992-07-17 | 1994-09-16 | Sadis Bruker Spectrospin | Procédé de mesure et d'ajustement des gradients d'un appareil à résonance magnétique nucléaire et dispositif correspondant. |
| DE4227162C2 (de) * | 1992-08-17 | 1994-07-14 | Siemens Ag | Iterative Shim-Verfahren für einen Grundfeldmagneten eines Kernspintomographiegerätes |
| DE4333440C1 (de) * | 1993-09-30 | 1995-04-06 | Siemens Ag | Verfahren zur Shimmung eines Magnetfeldes in einem Untersuchungsraum eines Kernspinresonanzgerätes |
| US5592090A (en) * | 1994-12-12 | 1997-01-07 | Houston Advanced Research Center | Compact, open geometry U-shaped magnet for magnetic resonance imaging |
| JPH08196518A (ja) * | 1995-01-20 | 1996-08-06 | Toshiba Corp | Mri装置 |
| US5617029A (en) * | 1995-12-14 | 1997-04-01 | General Electric Company | Method of magnet shimming |
| DE19604519A1 (de) * | 1996-02-08 | 1997-08-14 | Philips Patentverwaltung | MR-Verfahren zur Bestimmung der Magnetfeldinhomogenität im Untersuchungsbereich und MR-Gerät zur Durchführung des Verfahrens |
| US6064208A (en) * | 1998-04-02 | 2000-05-16 | Picker International, Inc. | Two-peak alignment method of field shimming |
| US6529002B1 (en) | 2000-08-31 | 2003-03-04 | The Board Of Trustees Of The Leland Stanford Junior University | High order shimming of MRI magnetic fields using regularization |
| US20050033151A1 (en) * | 2001-10-19 | 2005-02-10 | Wu Ed X | Combined magnetic resonance data acquisition of multi-contrast images using variable acquisition parameters and k-space data sharing |
| US7692423B2 (en) * | 2007-10-08 | 2010-04-06 | The Board Of Trustees Of The Leland Stanford Junior University | Self navigating cartesian trajectory |
| US8970217B1 (en) | 2010-04-14 | 2015-03-03 | Hypres, Inc. | System and method for noise reduction in magnetic resonance imaging |
| JP5943159B2 (ja) * | 2016-01-04 | 2016-06-29 | 株式会社日立製作所 | 磁気共鳴イメージング装置 |
| JP6954767B2 (ja) * | 2017-06-02 | 2021-10-27 | 日本電子株式会社 | Nmr測定装置及び磁場マップ演算方法 |
| CN112716476B (zh) | 2019-10-28 | 2024-07-02 | 通用电气精准医疗有限责任公司 | 磁共振成像方法及系统、计算机可读存储介质 |
Family Cites Families (9)
| Publication number | Priority date | Publication date | Assignee | Title |
|---|---|---|---|---|
| US4585992A (en) * | 1984-02-03 | 1986-04-29 | Philips Medical Systems, Inc. | NMR imaging methods |
| IL72388A (en) * | 1984-07-12 | 1988-07-31 | Elscint Ltd | Nmr imaging systems |
| US4523166A (en) * | 1984-10-19 | 1985-06-11 | General Electric Company | Optimal field inhomogeneity correction coil operation for NMR magnets |
| US4720679A (en) * | 1985-12-31 | 1988-01-19 | Picker International, Inc. | Magnetic resonance imaging with phase encoded chemical shift correction |
| US4733189A (en) * | 1986-06-03 | 1988-03-22 | Massachusetts Institute Of Technology | Magnetic resonance imaging systems |
| US4761614A (en) * | 1987-04-27 | 1988-08-02 | Phospho-Energetics, Inc. | Device and method for automatic shimming of NMR instrument |
| US5121060A (en) * | 1987-11-05 | 1992-06-09 | University Of Queensland | Magnetic field homogenization in NMR spectroscopy |
| US4949044A (en) * | 1988-04-18 | 1990-08-14 | Resonance Research, Inc. | Apparatus for mapping a static magnetic field |
| US4899109A (en) * | 1988-08-17 | 1990-02-06 | Diasonics Inc. | Method and apparatus for automated magnetic field shimming in magnetic resonance spectroscopic imaging |
-
1989
- 1989-11-27 US US07/441,850 patent/US4987371A/en not_active Expired - Lifetime
-
1990
- 1990-10-24 JP JP2284544A patent/JPH0644904B2/ja not_active Expired - Lifetime
- 1990-11-23 EP EP19900122354 patent/EP0430088A3/en not_active Withdrawn
Cited By (4)
| Publication number | Priority date | Publication date | Assignee | Title |
|---|---|---|---|---|
| EP0465139A3 (en) * | 1990-06-29 | 1992-08-05 | General Electric Company | Shimming magnets in nmr systems |
| EP0470845A3 (en) * | 1990-08-10 | 1992-08-19 | General Electric Company | Nmr imaging of chemical species |
| US5321359A (en) * | 1993-03-29 | 1994-06-14 | General Electric Company | Selective imaging among three or more chemical species |
| US11774530B2 (en) | 2022-01-28 | 2023-10-03 | Canon Medical Systems Corporation | System and method for robust shimming for magnetic resonance imaging |
Also Published As
| Publication number | Publication date |
|---|---|
| EP0430088A3 (en) | 1991-11-06 |
| JPH03182231A (ja) | 1991-08-08 |
| JPH0644904B2 (ja) | 1994-06-15 |
| US4987371A (en) | 1991-01-22 |
Similar Documents
| Publication | Publication Date | Title |
|---|---|---|
| US4987371A (en) | Method for in-vivo shimming | |
| US5168232A (en) | Method for rapid magnet shimming | |
| JP3402916B2 (ja) | 核スピントモグラフ装置のマグネット装置のシム調整方法及び方法を実施する装置 | |
| US5225781A (en) | Robust decomposition of NMR images by chemical species | |
| CN112716476B (zh) | 磁共振成像方法及系统、计算机可读存储介质 | |
| US20140070805A1 (en) | Mr imaging with b1 mapping | |
| JPS6363225B2 (fr) | ||
| EP0585973B1 (fr) | Méthode pour corriger les écarts de position occasionnée par un changement du champ magnétique statique dans un appareil d'imagerie par RMN | |
| US8848992B2 (en) | Susceptibility gradient mapping | |
| US5617029A (en) | Method of magnet shimming | |
| US4553096A (en) | Nuclear magnetic resonance method and apparatus | |
| US5451877A (en) | Method for the compensation of eddy currents caused by gradients in a nuclear magnetic resonance apparatus | |
| US20040056660A1 (en) | Magnetic resonance imaging device and method | |
| US4803432A (en) | Short echo NMR imaging of sodium | |
| US5578921A (en) | Magnetic resonance imaging using three-dimensional spectral-spatial excitation | |
| US4706027A (en) | Method for correcting phase errors in magnetic resonance imaging data | |
| EP0230027B1 (fr) | Réglage d'aimant utilisant l'information acquise par imagerie du déplacement chimique | |
| US4777439A (en) | Spatially localized spectroscopy | |
| US4709211A (en) | Nuclear magnetic resonance system | |
| JPH0583250B2 (fr) | ||
| JP3189982B2 (ja) | 磁気共鳴イメージング装置 | |
| Robert et al. | Two-dimensional rotating-frame NQR imaging | |
| US11474170B2 (en) | MRI method for B0-mapping | |
| WO2012143540A1 (fr) | Détermination des positions d'une sonde de champ magnétique dans une mesure de résonance magnétique | |
| JPH0442010B2 (fr) |
Legal Events
| Date | Code | Title | Description |
|---|---|---|---|
| PUAI | Public reference made under article 153(3) epc to a published international application that has entered the european phase |
Free format text: ORIGINAL CODE: 0009012 |
|
| AK | Designated contracting states |
Kind code of ref document: A2 Designated state(s): DE FR GB NL |
|
| PUAL | Search report despatched |
Free format text: ORIGINAL CODE: 0009013 |
|
| AK | Designated contracting states |
Kind code of ref document: A3 Designated state(s): DE FR GB NL |
|
| 17P | Request for examination filed |
Effective date: 19911220 |
|
| 17Q | First examination report despatched |
Effective date: 19950227 |
|
| STAA | Information on the status of an ep patent application or granted ep patent |
Free format text: STATUS: THE APPLICATION IS DEEMED TO BE WITHDRAWN |
|
| 18D | Application deemed to be withdrawn |
Effective date: 19960928 |